 Open Access Article
Creative Commons Attribution 3.0 Unported Licence
The circular economy of water across the six continents†
Mohammad
Peydayesh
 *a and
Raffaele
Mezzenga
 *ab
*ab
aETH Zurich, Department of Health Sciences and Technology, 8092 Zurich, Switzerland. E-mail: mohammad.peydayesh@hest.ethz.ch; raffaele.mezzenga@hest.ethz.ch
bETH Zurich, Department of Materials, 8093 Zurich, Switzerland
First published on 10th April 2024
Abstract
Water is our most valuable and precious resource, yet it is only available in a limited amount. Sustainable use of water can therefore only operate in a circular way; nonetheless, still today depletion of water resources proceeds at an accelerated pace. Here, we quantitatively assess the water circular economy and the status of water management across 132 countries distributed over six continents by introducing the water circular economy index, WCEI, based on the three pillars of water circular economy, i.e., decreasing, optimising, and retaining. This index relies on eight indicators such as water stress, tap water price, water use efficiency, the degree of water resource management, proportion of safely treated wastewater, population with access to safe drinking water, drinking water quality, and surface water changes in hydrological basins. It allows ranking 132 countries, and most importantly to identify criticalities and bottlenecks in the sustainable use of water resources across the six continents, pointing at possible directions and actions towards a fully circular economy of water.
Key learning points(1) Recognize the importance of a water circular economy (WCE) in sustainable water management.(2) Explore key components of a WCE, including reducing consumption, optimizing utilization, and retaining resources. (3) Evaluate the WCE across 132 countries via a comprehensive index with three pillars and eight indicators. (4) Identify challenges and barriers hindering widespread WCE adoption. (5) Understand the impact of integrating renewable energy into water treatment and its design considerations. |
Introduction
Water is at the epicentre of socio-economic development and ultimately underpins the success or failure of each and every Sustainable Development Goal (SDG).1 SDGs are the heart of the 2030 agenda for sustainable development, an initiative embraced by all United Nations member states in 2015 that serves as a blueprint for peace and prosperity for people and the planet, now and into the future. SDGs are 17 goals that include 169 associated targets aiming at extending the achievements of the Millennium Development goals, embodying an integrated and indivisible approach that harmonizes the economic, social, and environmental dimensions of sustainable development.2 The importance of water is reflected in SDG6 (clean water and sanitation for all). This SDG aims to ensure universal access to clean water and sanitation, improve water quality by minimizing pollution, enhance water-use efficiency across sectors, protect and restore water-related ecosystems, foster international cooperation for sustainable water management, and implement integrated water resource management to achieve a world where everyone enjoys the benefits of safe water and sanitation.3Water determines food and energy production, industrial output, the quality of our lives and the environment where we live. Yet, water scarcity and inadequate access to clean water remain among the most urgent, pervasive and impactful problems afflicting people throughout the world.4 Along with population increase, economic growth and shifts in consumption patterns, which have intensified the demand for water resources, the inability to recognize the real value of water is possibly the main cause of its misuse and waste.5 Against this background, valid strategies for implementing a circular economy (CE) approach in the water sector are still in their infancy.6
The significance of transitioning from a linear economy of take-make-waste to a CE that closes loops in ecosystems and minimises waste7 has never been more apparent than in the present era, despite this concept originating in the 1990s.8 In a CE concept, water is appreciated at its full value and perceived as a finite resource and as an input for other processes.5 In the context of water, a transition to a CE can avoid misusing water, valorising it as a resource, and promote water reuse as an alternative water supply,9 on par with the use of pristine water. In this context, the three pillars of water circular economy (WCE) have been proposed to be decreasing (using less water), optimising (efficient use of water), and retaining (keeping water, materials, and energy).10 In other words, the primary objectives of WCE encompass minimising water, energy, and valuable substance losses, enhancing water efficiency and productivity, promoting the re-use of treated wastewater, and effectively safeguarding and alleviating pressure on water-related ecosystems.11 While this has been widely advocated and recognized, its assessment in a quantitative way is still seldom pursued. This manuscript presents a novel methodology, based on a simple, compact index, the Water Circular Economy Index (WCEI), that systematically and quantitatively assesses the status of WCE in 68% of the countries across the six continents, i.e. the 132 countries for which data availability is sufficiently large to allow computation of the WCEI. This analysis thoroughly assesses the differences in how water is used and valorised across the world and highlights the opportunities arising by establishing a WCE both on a local and a global scale.
Identifying criticalities in the water cycle
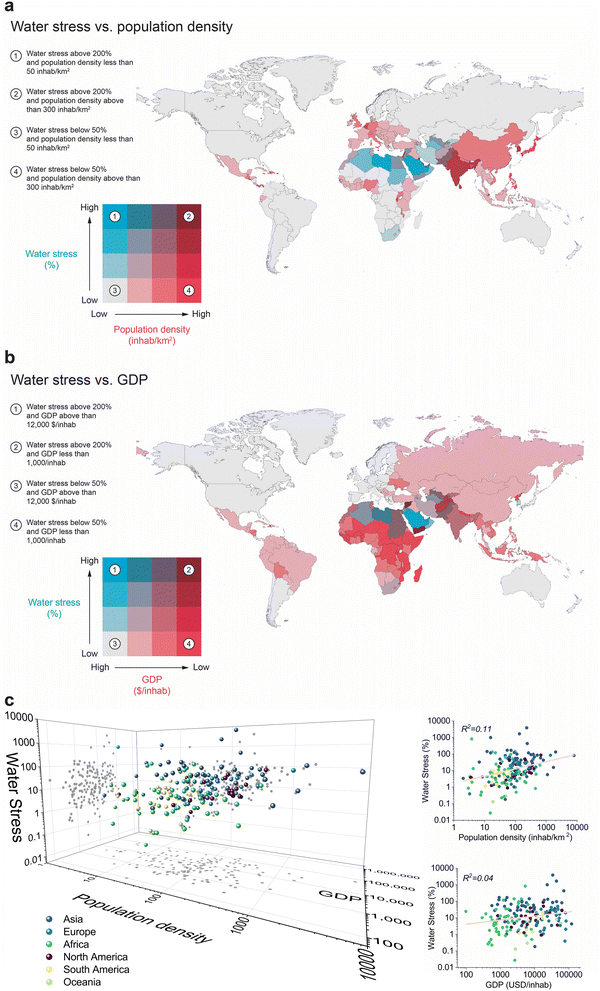
We start by geographically mapping the current water consumption rates per capita for each individual country and averaging them by continent, via two distinct geographical maps (Fig. S1, ESI†), in order to gain an immediate estimation of the countries and continents which acknowledge the value of water and those which overuse it. This representation provides an absolute scale on water use, which immediately highlights critical spots (e.g., Turkmenistan, Fig. S1a, ESI†), but fails to determine or identify correctly the factors behind each country's water consumption. For example, water consumption in Northern America is the highest continental consumption, yet, it also occurs in a world region with large water supplies and with a high industrial and agricultural development level; thus, the high water consumption does not indicate, alone, criticality.In order to analyse water consumption in a more meaningful way, we perform an analysis based on the open accessible water database from the Food and Agriculture Organization of the United Nations (FAO),12 and we turn to the concept of water stress, as a measure of the ratio of freshwater withdrawal vs. available freshwater resources, which we plot as a function of the gross domestic product (GDP) and population density for each country (Fig. 1). We analyse 178 countries across the six continents, excluding Antarctica due to limited available data and the absence of inhabiting nations and rank them according to four major levels of risk based on water stress values vs. four levels of population density (Fig. 1(a)) and four levels of GDP (Fig. 1(b)). Furthermore, Fig. 1(c) simultaneously shows water stress vs. population density and GDP based on each continent (for the legend on exact data points for each country, see Table S1, ESI†). Human civilization emerged and evolved alongside water bodies, and water directly impacts the population distribution worldwide.13 As shown in Fig. 1(c) on the top right, densely populated countries have approximately more water stress. However, the effect of other impacts, such as climate and water management strategies, is equally important. For instance, despite being sparsely populated, Saudi Arabia experiences extreme water stress primarily due to its arid climate. The country's average annual rainfall is less than 100 mm, and the high evaporation rates limit the availability of surface water sources. The over-extraction of groundwater resources makes it challenging for Saudi Arabia to meet the water demands of its population and various sectors, relying heavily on desalination and water importation to mitigate water scarcity.14 On the other hand, Belgium, despite having a higher population density, maintains relatively low water stress levels, mainly attributed to the country's climate with higher rainfall and robust water management practices.15 Yet, population density has a detrimental impact on drinking water quality and supply efficiency due to congestion problems.16 Moreover, rapid population growth due to urbanization and industrialization commonly occurs in many countries’ lowland regions, making the flat beds of river basins more susceptible to being polluted.17 Interestingly, the analysis does not reveal statistically strong correlations between water stress and GDP among the different countries. Although the countries with higher GDP are probably able to invest more capital in addressing their water stress, the impact of GDP itself as a motive for more industrialization, which in turn results in more pressure on the environment and water resources, cannot be neglected.
Water circular economy index (WCEI)
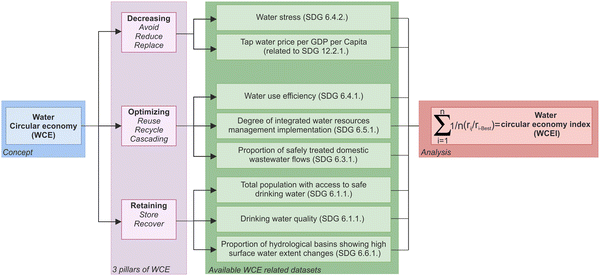
In order to establish a deeper picture of water circular economy around the globe, we introduce the water circular economy index, WCEI, based on the three pillars of water circular economy (WCE) to assess water use circularity and efficiency in different countries across the six continents. As observed in Fig. 2, the WCE pillars considered are: (i) decreasing (avoid, reduce, and replace), (ii) optimising (reuse, recycle, and cascading), and (iii) retaining (store and recover).10,18 While the avoid strategy entails renouncing and entirely preventing water use, setting an extreme form of water reduction which aims at 100% dismissal of water use, reduce and replace strategies involve using less water than traditional practices and replacing – whenever possible – water with alternative substances, respectively. The optimising pillar encompasses reutilising water without any treatment (reuse) and with treatment (recycle) to remove particles and contaminants, as well as using both untreated and treated water across consecutive stages of industrial and domestic processes (cascading). Finally, retaining water can be accomplished both quantitatively and qualitatively through the implementation of two strategies: the store strategy involves deliberate retention of water after its initial use by transferring it to reservoirs, cisterns, or artificial basins, while the recover strategy focuses not only on recovering high quality water, but also on extracting valuable materials and generating energy from water resources.10Based on these three WCE pillars, we thoroughly screened for available databases to identify relevant indicators that align with these concepts and selected eight indicators, given their relevance and availability across most countries: water stress (SDG 6.4.2.), tap water price per GDP per capita (related to SDG 12.2.1.), water use efficiency (SDG 6.4.1.), the degree of integrated water resource management implementation (SDG 6.5.1.), proportion of safely treated domestic wastewater flows (SDG 6.3.1.), total population with access to safe drinking water (SDG 6.1.1.), drinking water quality (SDG 6.1.1.), proportion of hydrological basins showing high surface water extent changes (SDG 6.6.1.). It becomes evident that most of these indicators are the targets of SDG 6 (clean water and sanitation), highlighting their significance in the water management and circularity context, as well as their direct relevance to achieving the SDG 6 goal.
Water stress and tap water price are indicators of the WCE decreasing pillar. Water stress gives the balance between water consumption and available water resources. While the availability and retaining of water resources play a role, reducing water consumption can effectively alleviate water stress. Furthermore, implementing appropriate pricing mechanisms for water can motivate users to conserve more, reduce pollution, and increase investments in water infrastructure.19 As supporting evidence of this, Turkmenistan, the country with the highest per capita water consumption, has been providing its citizens with free water for more than 25 years until recently.20 Despite the economic perspective of treating water as a commodity due to its resource nature, water pricing poses challenges against the perception of access to safe drinking water as a fundamental human right. Furthermore, reports indicate a low impact of water pricing on water consumption volumes in Europe, primarily attributed to the low price elasticity of water.11
Water use efficiency, degree of integrated water resource management implementation, and proportion of safely treated domestic wastewater flows, all indicators related to the optimising pillar, represent the core of WCE. The first indicator is the ratio of the gross economic value added by agriculture, industry, and services sectors to the amount of water withdrawn over time: it indicates how water can be utilised efficiently to generate economic value.21 The second indicator is the implementation of managing water resources sustainably by considering social, economic, and environmental aspects. The four main components of this indicator include creating an enabling environment through policies and planning tools, involving institutions and stakeholders participation, utilising management instruments for informed decision-making, and securing financing from various sources for the development and management of water resources.22 The third indicator indicates the level of wastewater treatment by tracking the proportion of wastewater flows from domestic activities that are safely treated before being discharged into the environment. The reason for only considering the domestic sector in this assessment is due to data limitations regarding other sectors, such as industry,23 which may involve a more global approach.
The two indicators of the total population with access to safe drinking water and drinking water quality, align with the retaining (store and recover) pillar of WCE by emphasising the importance of storing water resources and ensuring their quality and safety for human consumption through effective water management and treatment processes. Moreover, the proportion of hydrological basins showing high surface water extent changes is a criterion for determining the extent of retaining water-related ecosystems over time.23
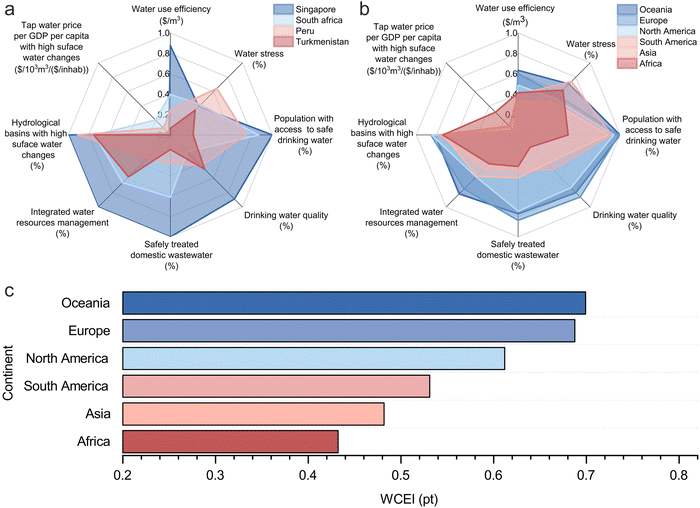
Having selected these 8 indicators, we calculate and assign normalized scores to countries and continents for each individual indicator based on a scale of 0 to 1, where the highest (best) value has a score of 1, and the lowest (worst) value has a score of 0. However, for water stress and the proportion of hydrological basins showing high surface water extent changes, the scoring is reversed, with the highest value assigned to 0 and the lowest value assigned to 1. The overall WCEI is then calculated by summing the score obtained for each indicator for every country and dividing this sum by the number of indicators (see the Methods section). The best performing country is the one approaching a value of 1 for the WCEI, the worst set being close to 0. Considering the availability of data, we conducted two separate analyses. The first analysis involved all eight indicators for 132 countries (Table S2, ESI†), while the second analysis focused on seven indicators (excluding drinking water quality) for 136 countries (Table S3, ESI†). Clearly, involving additional indicators provides a more robust WCEI but restricts the analysis to a more limited number of countries for which data related to all indicators are available; conversely, a lower number of indicators allows expanding the analysis to a broader set of countries at the expense of the robustness of the WCEI. The two analysis cases reported here are meant to provide a good balance among these two extremes. Radar charts for the four selected countries and six continents are illustrated in Fig. 3(a) and (b), respectively. As observed, various countries and continents exhibit diverse scores in each indicator, leading to varying degrees of surface coverage on the charts. The WCEI for different continents is calculated based on the population-weighted contribution of each country to the overall WCEI for that continent and is shown in Fig. 3(c). Oceania and Europe emerge as the leading continents in terms of WCE, exhibiting the highest scores, and they are followed by North America and South America. In contrast, Africa and Asia display overall WCEI values below 0.5, indicating lower performance in this regard.
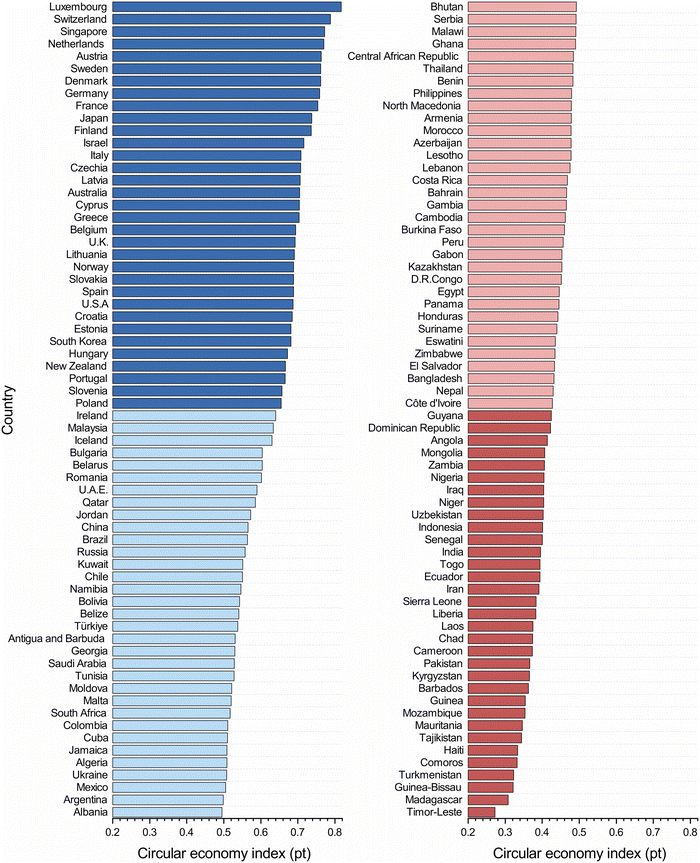
The WCEI for 132 countries (8 indicators) is shown in both descending ranking and alphabetical order (to ease the search of a specific country) in Fig. 4 and Fig. S2 (ESI†), respectively (details in Table S2, ESI†). Similarly, the WCEI for 136 countries (7 indicators) is presented in Fig. S3 and S4 along with Table S3 (ESI†). Based on this result, we divided the countries into four groups, each containing 33 countries (or 34 countries in the case of 136 countries). As observed in Fig. 4, the top first group is the leading WCE countries (WCEI ≥ 0.65), primarily European and Oceanian. However, some countries from other continents are yet to be found in this first group, namely Japan, Israel, the U.S.A., and South Korea. The second group comprises countries with 0.5 ≤ WCEI < 0.65, indicating countries with acceptable progress toward water circularity, especially considering that some of the countries in this group suffer from high water stress, such as the U.A.E., Qatar, Jordan, Kuwait, and Saudi Arabia. The third group comprises 33 countries with 0.43 ≤ WCEI < 0.5, including countries from various regions such as Asia, Africa, Europe, and North and South America. Finally, group 4 consists of 33 countries with the lowest scores in the WCEI (<0.43), predominantly in Asia, Africa, the Caribbean, and South America.
Given the impossibility of conducting an in-depth study of WCE in all these countries, we identify four countries from each group for further analysis based on several factors, including the availability of data over a sufficiently long time (several decades), complex time-evolving trends, and geographical and demographic diversity. We select the U.S.A., Singapore, Israel, and Belgium from Group 1, South Africa, Saudi Arabia, Russia, and China from Group 2, Peru, Ghana, Egypt, and Bahrain from Group 3, and Turkmenistan, Nigeria, Iran, and India from Group 4.
Understanding the water cycle and its distribution
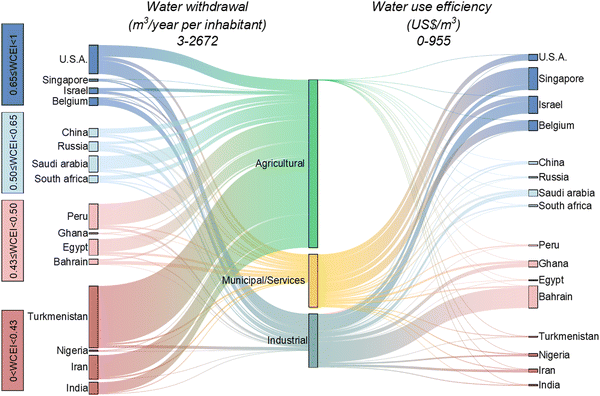
For the selected countries, we analyse how water consumption is distributed over the three main sectors, i.e., agriculture, industry, and municipality, via a flow diagram (Fig. 5). We depict the economic value generated by the consumption of 1 m3 of water in each sector, measured as water use efficiency (US$ per m3). The width of the streams shown in Fig. 5 is proportional to the volume of water withdrawals (left side of the diagram) and the corresponding water use efficiency (right side of the diagram).As observed, some countries successfully employ most of their water withdrawals in sectors as industry (Belgium), agriculture (China), or municipal (Bahrain) while maintaining acceptable water circularity; in contrast, countries with worst WCE, they all have in common a majority use of water in the sector of agriculture, independently on whether they are densely or sparsely populated countries. Agriculture is the largest consumer of water globally, using around 71.7% of 4250 km3 total world annual withdrawals.12 Meanwhile, it is estimated that 40% of agricultural water is lost to the environment as a result of poor water management and irrigation systems, as well as evaporation.24 Most of the agricultural water withdrawal is from surface and ground waters. Less than 10% of irrigation water worldwide is derived from non-conventional sources such as seawater, agricultural drainage, stormwater, thermoelectric cooling water, as well as industrial, domestic and commercial wastewater.12,25 Unfortunately, in Arab countries experiencing severe water scarcity, this amount is only 0.3%, yet, some countries, including Saudi Arabia, Egypt, Jordan, and Tunisia, have begun to reuse treated wastewater for crop cultivation, moving toward a CE.25
In the context of non-conventional water resources, the quality of recycled water must meet minimum irrigation requirements because unfavourable levels of pH, biochemical oxygen demand (BOD) or chemical oxygen demand (COD), electrical conductivity (EC), heavy metals, and oil in water can damage cultivated plants.25 Moreover, using non-conventional water resources without proper pre-treatment can result in soil and groundwater contamination, posing severe issues that can lead to the pollution of other freshwater sources and damage the overall health of ecosystems in the long term.26 As observed on the right side of Fig. 5, the water use efficiency in agriculture remains deficient compared to the other two sectors, despite the massive amount of water used in this sector. According to FAO,27 in 2018, the world water use efficiency of agriculture, services, and industrial sectors was 0.60, 112.2, and 32.2 US$ per m3, respectively. Although the ultimate goal remains to use water for essential life purposes (e.g., drinking water, sanitation and agriculture) and move the economic growth to non-water dependent activities (e.g., water-free toilets, industrial vacuum pumps, dry wash sprays, and atmospheric plasma technologies for clothing),10 the water use efficiency in the agriculture sector still needs improvement by an efficient management of green water (mostly rainwater) to increase rainfed agricultural production, cultivating new crop varieties and efficient irrigation systems.27 Moreover, since agriculture is the primary source of food production, reducing water consumption by reducing food waste is a timely critical endeavour. The urgency of addressing this issue can be clearly realised by knowing the fact that 30% of the total food produced for human consumption is wasted,28 which has an even more deleterious impact on water resources (for instance, for producing 1 kg of wheat and meat, 500–4000 L and 5000–20![[thin space (1/6-em)]](https://www.rsc.org/images/entities/char_2009.gif) 000 L of water are needed, respectively29). Therefore, a sustainable transition from the current linear situation to a CE within the framework of the food-energy-water-waste (FEWW) nexus is of paramount importance, extremely urgent and, in fact, inevitable.30
000 L of water are needed, respectively29). Therefore, a sustainable transition from the current linear situation to a CE within the framework of the food-energy-water-waste (FEWW) nexus is of paramount importance, extremely urgent and, in fact, inevitable.30
Management of water stress and efficiency
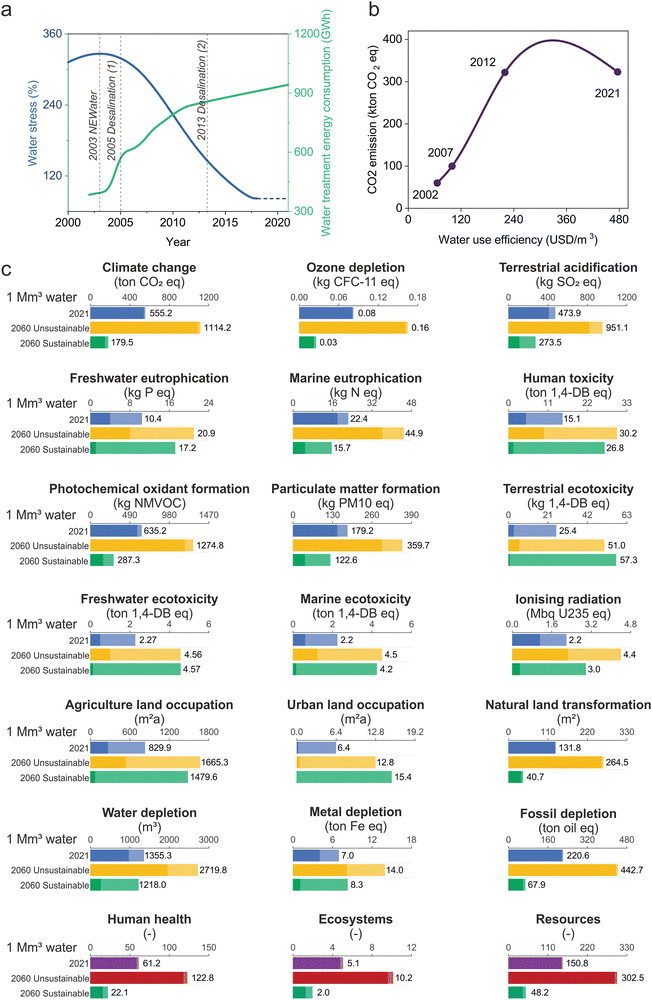
One of the goals of SDG6 (clean water and sanitation) is to increase water-use efficiency and ensure freshwater supplies, highlighted as Target 6.4. This target itself has two indicators: change in water-use efficiency over time (indicator 6.4.1) and level of water stress (indicator 6.4.2).31 In order to understand which measures governments have put in place to manage the water stress and enhance water efficiency and whether these measures have been effective, we then study the water stress and water efficiency change in these same groups and countries versus time spanning several decades for each country based on data availability (Fig. 6). As observed in Fig. 6(a), within each class of the WCEI, countries have taken very different approaches to managing water stress with very different results. While some countries have decreased their water stress over time by performing sustainable and efficient practices, water scarcity in other countries has been steadily worsening due to the lack of holistic approaches such as sustainable agriculture with higher water efficiency and minimised loss, integrated water management, water treatment and recycling, innovation and public awareness and stakeholder engagement. Many middle eastern countries have experienced increasing water stress due to population growth and urbanization, wasteful consumption patterns, and low annual rainfall, resulting in unsustainable groundwater abstractions.32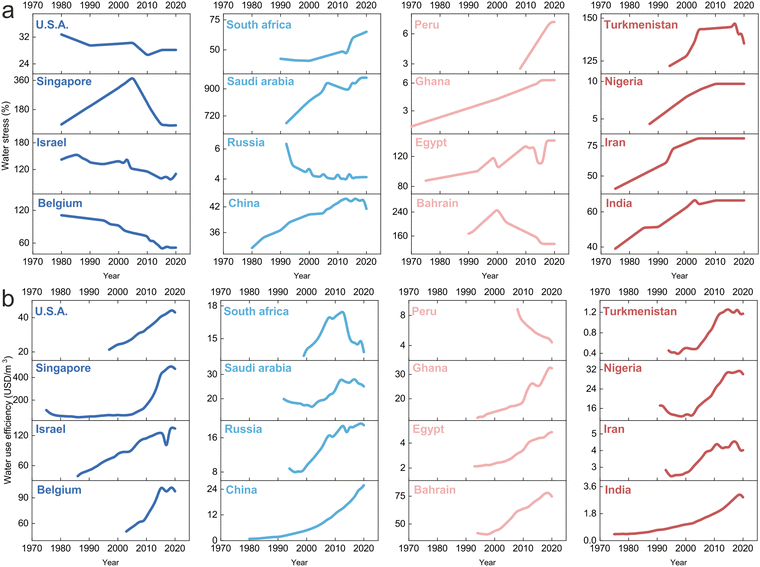 | ||
| Fig. 6 (a) Water stress over time in selected countries for four different WCEI levels. (b) Water efficiency over time in the same selected countries. | ||
Iran is estimated to have lost approximately 211 km3 of total water storage over the last two decades due to its aquifer collapse caused by the overexploitation of groundwater resources without proper recharge (equivalent to twice the country's annual water consumption).33 This water bankruptcy is a tragedy for a country that once pioneered sustainable water management via a Qanat, an ancient underground water transport network.34 Yet, there are countries capable of reversing the increasing trend of water stress, that is, those countries for which the water stress evolution shows a non-monotonic behaviour (e.g., Singapore, Bahrain, Turkmenistan) by diversifying water supply sources, improving water remediation technologies, and even changing water policies (see the case of Turkmenistan), corresponding to an increase over time in water use efficiency (Fig. 6(b)). Global water use efficiency increased by 9% between 2015 and 2018, to reach about 19 US$ per m3. The industrial sector gained the most net efficiency, around 15%, compared to 8% for services and agriculture, owing primarily to transforming thermal systems for energy production and industrial processes.27 Belgium is a representative case of an industrialised country with high water consumption in this sector that shows a steadily decreasing curve in water stress over the last five decades, achieved by the 6Rs strategy based on the water principles of reduce, reuse, recycle, reclaim, recover and restore of CE.6 The country has embraced decentralised solutions as an alternative to centralised infrastructure, particularly for smaller scales such as individual households, neighbourhoods, or districts. Decentralised water systems promote infrastructure conservation, reuse, and resiliency while reducing replacement costs.35 Additionally, by implementing digital water systems and smart water grids, the country minimised water losses and enhanced monitoring and reporting on water quality, quantity, and reuse.15 Lastly, Belgium revised water prices by considering abstraction, use, and pollution.36 By implementing a redesigned tariff structure, the country induced water-efficient consumer behaviour, lowered operational costs, and ensured cost recovery for water utilities.6
Interestingly, in contrast to the other examined countries, Peru experiences a notable decline in water use efficiency, amounting to approximately 50% over time. This trend persists despite the country's 46% increase in GDP during the same period. The primary cause for this decrease in water use efficiency can be attributed to the substantial surge of 182% in total water withdrawals within the country, indicating that Peru is using a larger volume of water resources to sustain its economic growth:12 this comes as no surprise considering, for example, the high impact of mining in the country's GDP, a sector which is highly demanding on water resources, and which highly impacts access to freshwater.
Box 1. Learning from SingaporeSingapore can be considered a role model in water circularity (ranked 3 in WCEI analysis). Despite its tropical location and high rainfall, Singapore is a water-scarce country due to its lack of natural aquifers or groundwater, natural surface water sources and limited land for water storage facilities37,38 (Ranked 170th among 190 countries in terms of freshwater availability according to the United Nations).39 During its pre- and post-independence periods, the country experienced several droughts and instances of water rationing40 and still relies on freshwater supply from Malaysia by a contract ending in 2061.38 In the quest for water self-sufficiency by 2061, Singapore has progressed in designing water cycles and diversifying water sources. Besides water from the local catchment and imported water from the Johor river, Public Utilities Board (PUB) in Singapore defines new sources of water supply from seawater and has reclaimed water by establishing desalination and NEWater plants, respectively,41 both relying on reverse osmosis. Reverse osmosis-based desalination can be considered a viable solution for potable water supply in Singapore, an island country. In the case of Singapore, desalination offers numerous advantages, such as providing a local and reliable source of freshwater, reducing dependence on imported water, and being less vulnerable to climate change and droughts. However, it is not without its drawbacks, including high energy consumption, potential environmental impacts, and the need for careful management of brine discharge.42 Since its introduction, NEWater has grown in popularity, particularly among industries such as wafer fabrication plants, which value NEWater for its ultra-pure properties, boosting water use efficiency.43 However, these achievements in decreasing water stress and enhancing water efficiency come at the cost of high energy consumption and, consequently, environmental pollution, specifically CO2 emission (Fig. 7(a) and (b)). The water sector consumes 4% of total global electricity,44 of which almost two-thirds of this energy comes from fossil fuels, mainly coal, and gas,45 resulting in 5% of all global greenhouse gas (GHG) emissions.46 In Singapore, natural gas, the cleanest form of fossil fuel, now accounts for approximately 95% of the country's electricity generation.47 As observed in Fig. 7(a), since 2003 and the establishment of NEWater and desalination plants, the water stress in Singapore has continuously decreased, while the water treatment energy consumption has increased accordingly48 (one percent decrease in water stress required approximately 2 GW h of energy for water treatment facilities). Fig. 7(b) depicts the CO2 emission associated with the energy consumption of water treatment facilities versus water use efficiency (considering 381 ton CO2 emission for 1 GW electricity from a natural gas combined-cycle power plant). As observed, despite the ever-increasing trend of water efficiency in Singapore, the CO2 emission related to the energy consumption of water facilities in recent years does not follow the increasing energy consumption pattern of earlier years and, based on our calculation, in 2021 stays at the same value as 2012. Although the PUB energy consumption increased from 844.8 in 201248 to 941.9 GW h in 2021, 10.2% of the total energy in 2021 was provided from clean photovoltaic solar energy,49 decreasing the total carbon footprint. Yet, PUB ambitiously and continuously moves towards a more sustainable, diversified, climate-resilient, and self-sufficient water supply by 2060.49 Based on PUB reports to meet the increasing water demand, the current water production of 594.12 Mm3 per year should be doubled by 2060.50,51 Doubling water production under the current conditions, and having to compensate at the same time roughly half of water supply currently imported from Malaysia, the energy demand for this increase in water volume is expected to quadruple, which is unsustainable.51,52 Accordingly, PUB has set a target to sustainably meet this doubled water demand by 2060 without using more energy53 while increasing its solar capacity by more than five times from current levels, reaching 2 Gigawatt peak (GWp).54 To follow this target, the share of solar energy in its total energy supply must increase from 10.2 to 51% by 2060. Based on the aforementioned goals and assumptions, we perform three life cycle assessments (LCAs) to evaluate the current environmental footprint of water treatment in Singapore (in terms of energy consumption as the primary contributor to environmental footprint) and compare it with two possible scenarios for 2060: unstainable and sustainable (for details, see Table S4, ESI†). The results for 18 midpoint impacts, including climate change (CC), ozone depletion (OD), terrestrial acidification (TA), freshwater eutrophication (FE), marine eutrophication (ME), human toxicity (HTOX), photochemical oxidant formation (POF), particulate matter formation (PMF), terrestrial ecotoxicity (TTOX), freshwater ecotoxicity (FTOX), marine ecotoxicity (MTOX), ionizing radiation (IR), agricultural land occupation (ALO), urban land occupation (ULO), natural land transformation (NLT), water depletion (WAT), metal depletion (MET), and fossil depletion (FOS), as well as three endpoint impacts, including human health, ecosystems, and resources are presented in Fig. 7(c) and Fig. S5 (ESI†). As observed, the energy-related CO2 footprint of treatment of 1 Mm3 of water in Singapore can be sustainably decreased from 555.2 tons to 179.5 tons (68% decrease) by 2060 through the increase of photovoltaic share to 51% of total energy, thanks to low GHG emission of solar panels for electricity generation. However, by keeping the energy sources as today (unsustainable scenario, 90% natural gas and 10% photovoltaic), the CO2 footprint would increase twofold by 2060. Besides using greener energy resources and lowering energy consumption to achieve the goal of net-zero emissions by 2050, PUB is seeking innovative solutions in carbon capture, utilization, and removal, as well as other emerging technologies related to optimized sludge management.55 As observed in Fig. 7(c), in addition to CC, the sustainable scenario by 2060 will result in the reduction of all endpoint impacts, including human health, ecosystems, and resources, as well as eight other midpoint environmental impacts, i.e., FOS, WAT, NLT, PMF, POF, ME, TA and OD compared to 2021. Moreover, the environmental impacts of six other factors of MET, ALO, IR, MTOX, HTOX, and FE in the sustainable scenario will be still lower than the unsustainable ones by 2060. However, as reflected by increased TTOX, FTOX, and ULO, the sustainable scenario is not exceling in all impact factors. The high ecotoxicities of the sustainable scenario mainly emerge from the manufacturing of photovoltaic solar cells, which involves different kinds of hazardous materials during either the mining, extraction, and purification processes of solar panel's raw materials such as silicon (Si), cadmium (Cd), copper (Cu), selenium (Se), tellurium (Te), and gallium (Ga) or semiconductors’ etching and surface cleaning.56 Land occupation is another drawback of photovoltaic farms due to the high land use of physical infrastructures such as solar arrays. This is particularly true for a country like Singapore, which, due to land limitations, is already reaching a limit to the possible increases in water reservoirs (the water catchment area has expanded from half to two-thirds of Singapore's entire land surface since 2011).57 However, these available vast reservoir surfaces have great potential for installing floating solar photovoltaic systems, allowing the reservoirs to serve as both water catchment and storage, as well as for green electricity generation.58 |
Lessons learned, discussion and outlook
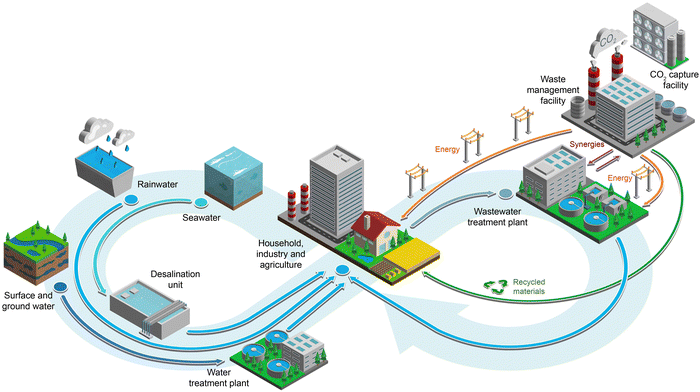
Based on the dataset and the analysis above, we discuss the essential elements of the CE in the water context, allowing extending the life cycle of water and reducing the burden on natural resources. The WCE offers a transition from a water use linear model of “take, make, consume, waste”5 to a circular model to reduce, optimize and preserve the water by waste avoidance, efficient utilization and quality retention, while ensuring conservation and environmental protection.10 In the CE scheme, water is a distinctive component because it can be a resource, a product, and a service with no equivalent in the economic system.10 Indeed, it has been demonstrated that of all UN SDGs, CE practices have the strongest connection to SDG 6 (clean water and sanitation) targets.59Fig. 8 depicts a possible CE model in the water context. In the quest for a paradigm shift toward a WCE, efficient wastewater treatment plants recover not only water for agriculture, municipalities, and industry, but even valuable nutrients from the nitrogen and phosphorus cycle and biogas precursors for energy production,60 integrating the WCE within correct management of all the main planetary boundaries.61 The first steps in the circular economy are managing “conventional” surface water and groundwater resources (components of “blue water”62), reducing water consumption and replacing freshwater with new water supply sources. Besides blue water from surface and groundwater, green water harvested from rainwater in catchments (e.g., Singapore57) and desalinated seawater (e.g., Israel63) can be considered efficient water sources capable of inverting the tendency of water stress in water-scarce countries. Moreover, treated grey water (household wastewater) can replace freshwater as a water resource for irrigation, cleaning, or flushing operations.10 Furthermore, highly purified water from wastewater can be recycled and reused as potable water. There have been numerous successful cases in this regard, including in the United States (Arizona, California, and Texas), Australia, Belgium, South Africa, Singapore, Namibia, and the International Space Station.10 Yet, reusing treated wastewater as drinking water is a delicate issue and faces public opposition, extrapolating it to drinking toilet water. However, public approval is now becoming stronger due to the increasingly common concerns about the environmental crises and burden on natural resources, as well as more trust in technologies capable of converting reused water into safe drinking water.9 Today, various efficient wastewater treatment technologies, including membrane filtrations, i.e., microfiltration (MF), ultrafiltration (UF), nanofiltration (NF), and reverse and forward osmosis (RO and FO), membrane bioreactor (MBR) systems and UV advanced oxidation process (UV-AOP), can be successfully applied to treat water.64,65 Moreover, many other nature-based emerging technologies can be used to purify water in a more sustainable way.1 In the CE model, the excess amount of treated wastewater can be further stored in a reservoir or artificial catchment to retain water for future use. For instance, 248![[thin space (1/6-em)]](https://www.rsc.org/images/entities/char_2009.gif) 000 m3 of treated wastewater in Berlin is discharged into neighbouring surface water lakes to recharge aquifers via artificial infiltration ponds and bank filtration, providing non-chlorinated drinking water to the city's 3.4 million residents.9 Sustainable wastewater treatment systems in a CE operate beyond only purifying water and aim to recover valuable materials and generate energy. Various materials, including precious metals, nutrients (e.g., nitrogen and phosphorus), organic materials (e.g., mud and proteins), and gas (e.g., methane), can be recovered mainly from wastewater and sewage sludge.10 For this purpose, a zero liquid discharge (ZLD) strategy for wastewater management that maximizes water usage efficiency and produces solid wastes should be considered, although still expensive and energy-intensive.66 Wastewater treatment plants can also operate as energy factories by converting the chemical energy available in wastewater to electrical energy or heat. It has been reported that the energy embedded in typical municipal wastewater surpasses the energy required for treatment by a factor of nine.67 For instance, this energy can be generated from the recovered biogas (methane) through the anaerobic digestion process.68 Not only can the recovered energy be used to supply the plant demand but it also can be sold on grid,65 transforming the plant's energy-related carbon footprint from positive to negative. To achieve the goals of the CE, many plants are considering the co-digestion scenario, in which the additional digestion capacity of the existing anaerobic digesters is used to process external organic wastes such as FOG (fats, oil, and grease) and agri-food wastes, converting the waste into products such as biogas for energy generation.68 Ultimately, no CE of water can be pursued without fully integrating such a scheme within the management of the other global resources necessary to modern society; for example to reach zero carbon emission, carbon capture and utilization processes can and should be integrated with wastewater treatment plants via single or multiple integrated approaches such as microbial electrolytic carbon capture, microbial electrosynthesis, microalgae cultivation, constructed wetlands and biochar production.67 A possible example of such a holistic water CE model is shown in Fig. 8.
000 m3 of treated wastewater in Berlin is discharged into neighbouring surface water lakes to recharge aquifers via artificial infiltration ponds and bank filtration, providing non-chlorinated drinking water to the city's 3.4 million residents.9 Sustainable wastewater treatment systems in a CE operate beyond only purifying water and aim to recover valuable materials and generate energy. Various materials, including precious metals, nutrients (e.g., nitrogen and phosphorus), organic materials (e.g., mud and proteins), and gas (e.g., methane), can be recovered mainly from wastewater and sewage sludge.10 For this purpose, a zero liquid discharge (ZLD) strategy for wastewater management that maximizes water usage efficiency and produces solid wastes should be considered, although still expensive and energy-intensive.66 Wastewater treatment plants can also operate as energy factories by converting the chemical energy available in wastewater to electrical energy or heat. It has been reported that the energy embedded in typical municipal wastewater surpasses the energy required for treatment by a factor of nine.67 For instance, this energy can be generated from the recovered biogas (methane) through the anaerobic digestion process.68 Not only can the recovered energy be used to supply the plant demand but it also can be sold on grid,65 transforming the plant's energy-related carbon footprint from positive to negative. To achieve the goals of the CE, many plants are considering the co-digestion scenario, in which the additional digestion capacity of the existing anaerobic digesters is used to process external organic wastes such as FOG (fats, oil, and grease) and agri-food wastes, converting the waste into products such as biogas for energy generation.68 Ultimately, no CE of water can be pursued without fully integrating such a scheme within the management of the other global resources necessary to modern society; for example to reach zero carbon emission, carbon capture and utilization processes can and should be integrated with wastewater treatment plants via single or multiple integrated approaches such as microbial electrolytic carbon capture, microbial electrosynthesis, microalgae cultivation, constructed wetlands and biochar production.67 A possible example of such a holistic water CE model is shown in Fig. 8.
Yet, the WCE faces several fundamental barriers, slowing its widespread implementation. One major issue is the lack of awareness and understanding among individuals, communities, industries, and governments. It is impossible to effectively promote and adopt WCE approaches without a comprehensive knowledge of the concept and its benefits. Societal attitudes and behaviours, including resistance to change, social norms, and cultural practices, additionally hamper the adoption of WCE. The transition to a WCE is further complicated by institutional and regulatory challenges, where existing frameworks and regulatory systems may not support or incentivise the concept. Technological limitations on water treatment, recycling, resource recovery and economic considerations related to costs associated with implementing circular water systems also pose a barrier to the WCE, particularly in less developed regions. But perhaps the most severe drawback towards the implementation of a global WCE is still the widespread assumption that water is an unlimited resource; quite in contrast with this idea, it is becoming increasingly clear that the planetary boundary of freshwater change has already passed the safe operating space, particularly concerning green water.62
Conclusions
The only possible mechanism by which a long-lasting and sustainable management of water can take place in a growing world with limited resources must operate according to a circular model where each individual drop of water is reused, recycled, reclaimed, recovered and restored, and where water losses are simultaneously reduced from the very beginning, that is, functioning according to the 6Rs principle.6,69 However, establishing a circular economy of water as a self-standing grand design is likely to fail unless it is appropriately integrated into a broader global approach that also addresses the management of other essential resources on which humanity depends. For example, reduction of water stress alone, or increase in water use efficiency, may not be sustainable targets if these come at the cost of increased greenhouse gas global emissions, which calls for the continuous development of more efficient and sustainable water treatment technologies. Even the use of clean and renewable energies to achieve this task may present unexpected drawbacks that require careful consideration. The LCA case study analysed in this work demonstrates, for example, that replacing fuel or gas-based energy supply for water purification technologies with cleaner, renewable solar energy can have unintended side effects such as terrestrial ecotoxicity, freshwater ecotoxicity, and urban land occupation. These findings highlight the importance of meticulously designing renewable energy systems to ensure the transition to clean water using clean energy, free from deleterious implications or impacts on other planetary boundaries. If this is done correctly, however, even energy-intense water treatment technologies such as reverse osmosis desalination may become a valid and sustainable approach in water treatment. Alternatively, combustion-enabled strategies integrated within the water cycle converting sludge and organic biomass into energy may be inevitable, and should be perceived as valid solutions, provided measures to reduce or capture associated CO2 emissions are duly implemented. Ultimately, global freshwater use and management represent only one of the planetary boundaries which humanity is asked to correctly manage for a sustainable future, and this can only be achieved via a holistic global approach integrating water among the other key resources needed for our existence.Methods
For calculating the WCEI, scores were assigned to countries for each indicator on a scale of 0 to 1, based on available data published by FAO,12 where 1 corresponds to the highest (best) value and 0 corresponds to the lowest (worst) value. However, for water stress and the proportion of hydrological basins showing high surface water extent changes (i.e. adverse indicators), the scoring is reversed, with 0 assigned to the highest (worst) value and 1 assigned to the lowest (best) value. The overall WCEI for the j-country was then calculated as , where n is the number of indicators, rij is the value of the indicator i for country j and ri-Best is the best value scored by any country for indicator i. The average WCEI for each continent c was calculated as:
  , where P is the total population of that continent, Pj and WCEIj are the populations and individual WCEI of each country j on that c continent, respectively.
LCA
The LCAs were performed using the ISO14040/44 standard70 and were attributional and prospective for the energy consumption of water treatment (Table S4, ESI†). The functional unit was the treatment of 1 Mm3 of water. The Ecoinvent 3 database served as the source of the life cycle inventory (LCI), and SimaPro v.9.3.0.3 was used to generate life cycle models. In the LCI, electricity production, natural gas, combined cycle power plant (Cut-off, U, CH) and electricity production from photovoltaic systems in an open ground installation, using multi-Si technology (Cut-off, U, RoW) were considered. The ReCiPe midpoint and endpoint were used to calculate the life cycle impact assessment (LCIA) for a wide range of environmental impact categories.Author contributions
M. P. and R. M. conceived, designed, performed the analysis and wrote the article.Conflicts of interest
The authors declare no competing interests.Acknowledgements
We thank Xinagze Jia from the South China University of Technology, and Arash Khosravi and Benyamin Bordbar from the Persian Gulf University for their valuable contributions and support.References
- M. Peydayesh and R. Mezzenga, Protein nanofibrils for next generation sustainable water purification, Nat. Commun., 2021, 12, 3248, DOI:10.1038/s41467-021-23388-2.
- United Nations, Transforming our world: the 2030 Agenda for Sustainable Development A/RES/70/1, sustainabledevelopment.un.org ( 2015).
- Stockholm Environment Institute, 6 Clean Water and Sanitation, The Government of Sweden, https://www.government.se/49f47b/contentassets/3bef47b49ed64a75bcdf56ff053ccaea/6—clean-water-and-sanitation.pdf..
- M. Sgroi, F. G. A. Vagliasindi and P. Roccaro, Feasibility, sustainability and circular economy concepts in water reuse, Curr. Opin. Environ. Sci. Health, 2018, 2, 20–25, DOI:10.1016/j.coesh.2018.01.004.
- A. Delgado, D. J. Rodriguez, C. A. Amadei and M. Makino, Water in Circular Economy and Resilience (WICER), World Bank, Washington, DC, 2021 Search PubMed.
- T. M. Mbavarira and C. Grimm, A Systemic View on Circular Economy in the Water Industry: Learnings from a Belgian and Dutch Case, Sustainability, 2021, 13, 3313, DOI:10.3390/su13063313.
- W. R. Stahel, The circular economy, Nature, 2016, 531, 435–438, DOI:10.1038/531435a.
- C. Andrade, S. Selosse and N. Maïzi, Thirty years since the circular economy concept emerged: has it reached a consensus. Working Paper 2021-02-30, Chaire Modélisation prospective au service du développement durable, Les Cahiers de la Chaire, 2021, p. 27.
- N. Voulvoulis, Water reuse from a circular economy perspective and potential risks from an unregulated approach, Curr. Opin. Environ. Sci. Health, 2018, 2, 32–45, DOI:10.1016/j.coesh.2018.01.005.
- P. Morseletto, C. E. Mooren and S. Munaretto, Circular Economy of Water: Definition, Strategies and Challenges, Circ. Econ. Sustainability, 2022, 2, 1463–1477, DOI:10.1007/s43615-022-00165-x.
- J. Salminen, K. Määttä, H. Haimi, M. Maidell, A. Karjalainen, K. Noro, J. Koskiaho, S. Tikkanen and J. Pohjola, Water-smart circular economy – Conceptualisation, transitional policy instruments and stakeholder perception, J. Cleaner Prod., 2022, 334, 130065, DOI:10.1016/j.jclepro.2021.130065.
- AQUASTAT Database, (FAO 2020, accessed 9 September 2022), https://www.fao.org/aquastat/statistics/query/index.html?lang=en.
- Y. Fang and J. W. Jawitz, The evolution of human population distance to water in the USA from 1790 to 2010, Nat. Commun., 2019, 10, 430, DOI:10.1038/s41467-019-08366-z.
- K. A. Rambo, D. M. Warsinger, S. J. Shanbhogue and A. F. Ghoniem, Water-Energy Nexus in Saudi Arabia, Energy Procedia, 2017, 105, 3837–3843, DOI:10.1016/j.egypro.2017.03.782.
- L. Ho, A. Alonso, M. A. Eurie Forio, M. Vanclooster and P. L. M. Goethals, Water research in support of the Sustainable Development Goal 6: A case study in Belgium, J. Cleaner Prod., 2020, 277, 124082, DOI:10.1016/j.jclepro.2020.124082.
- B. Benito, Ú. Faura, M.-D. Guillamón and A.-M. Ríos, The efficiency of public services in small municipalities: The case of drinking water supply, Cities, 2019, 93, 95–103, DOI:10.1016/j.cities.2019.04.016.
- C. P. Liyanage and K. Yamada, Impact of Population Growth on the Water Quality of Natural Water Bodies, Sustainability, 2017, 9, 1405 CrossRef.
- A. M. Michalak, J. Xia, D. Brdjanovic, A.-N. Mbiyozo, D. Sedlak, T. Pradeep, U. Lall, N. Rao and J. Gupta, The frontiers of water and sanitation, Nature Water, 2023, 1, 10–18, DOI:10.1038/s44221-022-00020-1.
- OECD, Pricing Water Resources and Water and Sanitation Services, 2010.
- Turkmenistan ends free utilities after a quarter century, (AP NEWS, 2018, accessed 21 May 2023), https://apnews.com/article/ad5f5b1b1e51415689a5835b7a9a150c.
- P. Hellegers and G. van Halsema, SDG indicator 6.4.1 “change in water use efficiency over time”: Methodological flaws and suggestions for improvement, Sci. Total Environ, 2021, 801, 149431, DOI:10.1016/j.scitotenv.2021.149431.
- M. Bertule, P. Glennie, P. Koefoed Bjørnsen, G. James Lloyd, M. Kjellen, J. Dalton, A. Rieu-Clarke, O. Romano, H. Tropp, J. Newton and J. Harlin, Monitoring Water Resources Governance Progress Globally: Experiences from Monitoring SDG Indicator 6.5.1 on Integrated Water Resources Management Implementation, Water, 2018, 10, 1744 CrossRef.
- United nations, UN Water Integrated Monitoring Initiative for SDG 6 (2020, accessed 18 May 2023), https://www.unwater.org/our-work/integrated-monitoring-initiative-sdg-6.
- P. Balsom, Water Usage In The Agricultural Industry (High Tide Technologies, 2020), https://htt.io/water-usage-in-the-agricultural-industry.
- C.-Y. Chen, S.-W. Wang, H. Kim, S.-Y. Pan, C. Fan and Y. J. Lin, Non-conventional water reuse in agriculture: A circular water economy, Water Res., 2021, 199, 117193, DOI:10.1016/j.watres.2021.117193.
- M. Qadir, B. R. Sharma, A. Bruggeman, R. Choukr-Allah and F. Karajeh, Non-conventional water resources and opportunities for water augmentation to achieve food security in water scarce countries, Agric. Water Manage., 2007, 87, 2–22, DOI:10.1016/j.agwat.2006.03.018.
- Progress on change in water-use efficiency. Global status and acceleration needs for SDG indicator 6.4.1 (FAO and UN Water, 2021) DOI:10.4060/cb6413en.
- M. Peydayesh, M. Bagnani, W. L. Soon and R. Mezzenga, Turning Food Protein Waste into Sustainable Technologies, Chem. Rev., 2023, 123(5), 2112–2154, DOI:10.1021/acs.chemrev.2c00236.
- How much water is needed to produce food and how much do we waste? (The guardian, accessed 8 September 2022), https://www.theguardian.com/news/datablog/2013/jan/10/how-much-water-food-production-waste.
- A. Valencia, W. Zhang and N.-B. Chang, Sustainability transitions of urban food-energy-water-waste infrastructure: A living laboratory approach for circular economy, Resour., Conserv. Recycl., 2022, 177, 105991, DOI:10.1016/j.resconrec.2021.105991.
- Resolution adopted by the General Assembly on 6 July 2017, Work of the Statistical Commission pertaining to the 2030 Agenda for Sustainable Development (UN, 2017); https://ggim.un.org/documents/a_res_71_313.pdf.
- M. Raouf, Water Issues in the Gulf: Time for Action (Middle East Institute, 2009), https://www.mei.edu/publications/water-issues-gulf-time-action.
- P. Saemian, M. J. Tourian, A. AghaKouchak, K. Madani and N. Sneeuw, How much water did Iran lose over the last two decades, J. Hydrol. Reg. Stud., 2022, 41, 101095, DOI:10.1016/j.ejrh.2022.101095.
- M. Manuel, D. Lightfoot and M. Fattahi, The sustainability of ancient water control techniques in Iran: an overview, Water History, 2018, 10, 13–30, DOI:10.1007/s12685-017-0200-7.
- F. H. Lakho, A. Qureshi, W. Igodt, H. Q. Le, V. Depuydt, D. P. L. Rousseau and S. W. H. Van Hulle, Life cycle assessment of two decentralized water treatment systems combining a constructed wetland and a membrane based drinking water production system, Resour., Conserv. Recycl., 2022, 178, 106104, DOI:10.1016/j.resconrec.2021.106104.
- Cost of drinking water to rise slightly in 2023, (The Brussels Times, 2022, accessed on 24th May); https://www.brusselstimes.com/343392/cost-of-drinking-water-to-rise-slightly-in-2023.
- C. Tortajada, Y. K. Joshi and A. K. Biswas, The Singapore Water Story: Sustainable Development in an Urban City State, Routledge, 1st edn, 2013, p. 288 Search PubMed.
- C. Hsien, J. S. Choong Low, S. Chan Fuchen and T. W. Han, Life cycle assessment of water supply in Singapore – A water-scarce urban city with multiple water sources, Resour., Conserv. Recycl., 2019, 151, 104476, DOI:10.1016/j.resconrec.2019.104476.
- T. C. Khoo, in Water Management in 2020 and Beyond, ed. A. K. Biswas, C. Tortajada and R. Izquierdo, Springer Berlin Heidelberg, 2009, pp. 237–250 Search PubMed.
- Centre for Liveable Cities, Water shortages and rationing in Singapore (Singapore infopedia, A Singapore Government Agency Website, 2020, accessed 6 September 2022); https://eresources.nlb.gov.sg/infopedia/articles/SIP_2020-02-20_192848.html.
- L. H. Peter and G. Rowe, A City in Blue and Green: The Singapore Story, Springer, Singapore, 2019, p. 152 Search PubMed.
- L. F. Greenlee, D. F. Lawler, B. D. Freeman, B. Marrot and P. Moulin, Reverse osmosis desalination: Water sources, technology, and today's challenges, Water Res., 2009, 43, 2317–2348, DOI:10.1016/j.watres.2009.03.010.
- Y. S. Tan, 50 Years of Environment: Singapore's Journey Towards Environmental Sustainability, World Scientific Publishing Co. Pte. Ltd., 2016 Search PubMed.
- Water Energy Nexus: Excerpt from the World Energy Outlook 2016, (International Energy Agency (IEA) Paris, 2016).
- H. Ritchie, M. Roser and P. Rosado Energy (OurWorldInData.org, 2020, accessed 6 September 2022); https://ourworldindata.org/electricity-mix#citation.
- S. Rüd, Linking Water and Climate|Towards a Carbon Neutral, Risk Resilient Water Sector (Water and Wastewater Companies for Climate Mitigation (WaCClim), Deutsche Gesellschaft für Internationale Zusammenarbeit (GIZ) GmbH, Germany, 2020); https://wacclim.org/wp-content/uploads/2020/02/WaCCliM-Bochure_2020_EN.pdf.
- Energy Market Authority (EMA), About Singapore's Energy Story (Government of Singapore, accessed 6 September 2022); https://www.ema.gov.sg/ourenergystory.
- L. Vincent, L. Michel, C. Catherine and R. Pauline, The energy cost of water independence: the case of Singapore, Water Sci. Technol., 2014, 70, 787–794, DOI:10.2166/wst.2014.290.
- PUB Sustainability Report FY2020/21 (PUB. Singapore's National Water Agency, 2021); https://www.pub.gov.sg/Documents/Publications/PUB_Sustainability_Report.pdf.
- Singapore Water Story (PUB. Singapore's National Water Agency, accessed 6 September 2022); https://www.pub.gov.sg/watersupply/singaporewaterstory.
- PUB to achieve net zero emissions by increasing renewable energy sources and leveraging innovative solutions to close carbon loop (Singapore's National Water Agency, 2021); https://www.pub.gov.sg/news/pressreleases/2021pr018.
- PUB pushes the frontier of water technology to reach future energy and sludge reduction targets (PUB. Singapore's National Water Agency, 2018); https://www.nas.gov.sg/archivesonline/data/pdfdoc/20180704002/Press%20Release_PUB%20RD%20blueprint.pdf.
- L. Tang, PUB aims to double water supply by 2060 without using more energy or producing more waste (today, 2018, accessed 6 September 2022); https://www.todayonline.com/singapore/pub-aims-double-water-supply-2060-without-using-more-energy-producing-more-waste.
- R. Chandran, Land-starved Singapore gets creative with solar in clean energy push (Reuters, 2021, accessed 6 September 2022); https://www.reuters.com/article/us-singapore-renewables-solar-trfn-idUSKBN2C30ZD.
- Carbon Zero Grand Challenge (PUB Singapore's National Water Agency, accessed 6 September 2022); https://www.pub.gov.sg/innovationchallenge/Pages/CarbonZero.aspx.
- M. Tawalbeh, A. Al-Othman, F. Kafiah, E. Abdelsalam, F. Almomani and M. Alkasrawi, Environmental impacts of solar photovoltaic systems: A critical review of recent progress and future outlook, Sci. Total Environ., 2021, 759, 143528, DOI:10.1016/j.scitotenv.2020.143528.
- Water from Local Catchment (PUB Singapore's National Water Agency, accessed 6 September 2022), https://www.pub.gov.sg/watersupply/fournationaltaps/localcatchmentwater.
- Solar Energy (PUB Singapore's National Water Agency, accessed 6 September 2022), https://www.pub.gov.sg/sustainability/solar..
- P. Schroeder, K. Anggraeni and U. Weber, The Relevance of Circular Economy Practices to the Sustainable Development Goals, J. Ind. Ecol., 2019, 23, 77–95, DOI:10.1111/jiec.12732.
- D. J. Rodriguez, H. A. Serrano, A. Delgado, D. Nolasco and G. Saltiel, From Waste to Resource: Shifting paradigms for smarter wastewater interventions in Latin America and the Caribbean, World Bank, Washington, DC, 2020 Search PubMed.
- J. Rockström, et al., A safe operating space for humanity, Nature, 2009, 461, 472–475, DOI:10.1038/461472a.
- L. Wang-Erlandsson, A. Tobian, R. J. van der Ent, I. Fetzer, S. te Wierik, M. Porkka, A. Staal, F. Jaramillo, H. Dahlmann, C. Singh, P. Greve, D. Gerten, P. W. Keys, T. Gleeson, S. E. Cornell, W. Steffen, X. Bai and J. Rockström, A planetary boundary for green water, Nat. Rev. Earth Environ., 2022, 3, 380–392, DOI:10.1038/s43017-022-00287-8.
- R. R. Palatnik, in Economy-Wide Modeling of Water at Regional and Global Scales, ed. G. Wittwer, Springer, Singapore, 2019, pp. 193–208 Search PubMed.
- S. Bolisetty, M. Peydayesh and R. Mezzenga, Sustainable technologies for water purification from heavy metals: review and analysis, Chem. Soc. Rev., 2019, 48, 463–487, 10.1039/C8CS00493E.
- T. Giakoumis, C. Vaghela and N. Voulvoulis, in Advances in Chemical Pollution, Environmental Management and Protection, ed. P. Verlicchi, Elsevier, 2020, pp.227–252 Search PubMed.
- T. Tong and M. Elimelech, The Global Rise of Zero Liquid Discharge for Wastewater Management: Drivers, Technologies, and Future Directions, Environ. Sci. Technol., 2016, 50, 6846–6855, DOI:10.1021/acs.est.6b01000.
- L. Lu, J. S. Guest, C. A. Peters, X. Zhu, G. H. Rau and Z. J. Ren, Wastewater treatment for carbon capture and utilization, Nat. Sustainability, 2018, 1, 750–758, DOI:10.1038/s41893-018-0187-9.
- U. Ghimire, G. Sarpong and V. G. Gude, Transitioning Wastewater Treatment Plants toward Circular Economy and Energy Sustainability, ACS Omega, 2021, 6, 11794–11803, DOI:10.1021/acsomega.0c05827.
- M. Smol, in Circular Economy and Sustainability, ed. A. Stefanakis and I. Nikolaou, Elsevier, 2022, pp. 1–19 Search PubMed.
- ISO14040:2006 Environmental management – Life cycle assessment – Principles and framework (International Organization for Standardization, 2006).
Footnote |
| † Electronic supplementary information (ESI) available. See DOI: https://doi.org/10.1039/d3cs00812f |
| This journal is © The Royal Society of Chemistry 2024 |

