ATR-far-ultraviolet spectroscopy: a challenge to new σ chemistry
Yukihiro
Ozaki
 *ab,
Yusuke
Morisawa
 *c and
Ichiro
Tanabe
 *d
*d
aSchool of Biological and Environmental Sciences, Kwansei Gakuin University, Sanda, Hyogo 669-1330, Japan. E-mail: yukiz89016@gmail.com
bToyota Physical and Chemical Research Institute, Nagakute, Aichi 480-1192, Japan
cSchool of Science and Engineering, Kindai University, Higashi-Osaka, Osaka 577-8502, Japan. E-mail: morisawa@chem.kindai.ac.jp
dDepartment of Chemistry, School of Science, Rikkyo University, Toshima, Tokyo 171-8501, Japan. E-mail: itanabe@rikkyo.ac.jp
First published on 30th January 2024
Abstract
This review reports the recent progress on ATR-far ultraviolet (FUV) spectroscopy in the condensed phase. ATR-FUV spectroscopy for liquids and solids enables one to explore various topics in physical chemistry, analytical chemistry, nanoscience and technology, materials science, electrochemistry, and organic chemistry. In this review, we put particular emphasis on the three major topics: (1) studies on electronic transitions and structures of various molecules, which one cannot investigate via ordinary UV spectroscopy. The combined use of ATR-FUV spectroscopy and quantum chemical calculations allows for the investigation of various electronic transitions, including σ, n-Rydberg transitions. ATR-FUV spectroscopy may open a new avenue for σ-chemistry. (2) ATR-FUV spectroscopy enables one to measure the first electronic transition of water at approximately 160 nm without peak saturation. Using this band, one can study the electronic structure of water, aqueous solutions, and adsorbed water. (3) ATR-FUV spectroscopy has its own advantages of the ATR method as a surface analysis method. ATR-FUV spectroscopy is a powerful technique for exploring a variety of top surface phenomena (∼50 nm) in adsorbed water, polymers, graphene, organic materials, ionic liquids, and so on. This review briefly describes the principles, characteristics, and instrumentation of ATR-FUV spectroscopy. Next, a detailed description about quantum chemical calculation methods for FUV and UV regions is given. The recent application of ATR-FUV-UV spectroscopy studies on electronic transitions from σ orbitals in various saturated molecules is introduced first, followed by a discussion on the applications of ATR-FUV spectroscopy to studies on water, aqueous solutions, and adsorbed water. Applications of ATR-FUV spectroscopy in the analysis of other materials such as polymers, ionic liquids, inorganic semiconductors, graphene, and carbon nanocomposites are elucidated. In addition, ATR-FUV-UV-vis spectroscopy focusing on electrochemical interfaces is outlined. Finally, FUV-UV-surface plasmon resonance studies are discussed.
1. Introduction
Recently, both edges of optical spectroscopy, namely, high energy UV spectroscopy and far infrared (FIR)/tera Herz (THz) spectroscopy, have received keen interests. In particular, remarkable attention has been paid to far-ultraviolet (FUV) spectroscopy and terahertz spectroscopy, mainly, owing to their necessity in chemistry, physics, and molecular science and the advances in light sources, detectors, and other instrumentation and equipment.1–6 In optical spectroscopy, ultraviolet-visible (UV-vis), near-infrared (NIR), and infrared (IR) regions have been extensively investigated, but compared with these regions, the development of both edge areas, high energy UV spectroscopy and FIR/THz spectroscopy, have been far behind, and some of the regions, for example, FUV region (120–200 nm), are unexplored in molecular spectroscopy for condensed matters. This review reports recent progress on FUV spectroscopy in the condensed phase.In this review, we have also focused on FUV (120–200 nm) and DUV (deep ultraviolet) regions (200–300 nm). Except for molecules in the gas phase, most studies on the electronic structure and transitions of molecules have been carried out using mainly commercial UV-vis spectrometers that are available only below 190 nm. The UV region above 190 nm is extremely rich in information about electronic structures and transitions, but absorbance in this region is so strong that this region has been used mainly for studying the electronic structures and transitions of gas molecules.7–11 Since particles in the condensed phase do not transmit light in the FUV region, reflection spectroscopy was employed to measure spectra of solid samples above 190 nm.7–10 However, for liquid samples, it is difficult to use both absorption spectroscopy and reflection spectroscopy. To overcome the above difficulties of UV spectroscopy above 190 nm in spectral measurements, we introduced attenuated total reflection (ATR) technique to the FUV region that allows us to measure spectra for almost all kinds of molecules in the 145–280 nm region.1–6 In the FUV region, one can expect transitions not only due to π electrons and lone pair electrons but also due to σ electrons; thus, one can say that ATR-FUV spectroscopy has opened a totally new electronic spectroscopy. The combination of FUV spectroscopy and quantum chemical calculations has established band assignment method and a method for exploring electronic transition and electronic structure.1–6
The purpose of the present review paper is to discuss the state-of-the-art of ATR-FUV-UV spectroscopy. Since the principle, characteristics, and instrumentation of ATR-FUV spectroscopy have already been reviewed,1–6 this article describes them only briefly, and much attention is paid on new applications of FUV-UV spectroscopy. Thus, not only FUV but also UV region is included in this review. This review consists of introductory parts (Sections 1–3), instrumentation and data handling (Section 4), quantum chemical calculation study for FUV spectroscopy (Section 5), transitions from σ orbitals in saturated molecules (Section 6), various applications including those to water, aqueous solutions, inorganic materials, polymers, ionic liquids, ultrathin materials surfaces, and electrochemical interfaces (Sections 7–10), FUV-UV surface plasmon resonance (Section 11), and perspectives (Section 12).
2. Historic overview and recent developments of FUV spectroscopy
2.1. Brief history of FUV spectroscopy
FUV spectroscopy of the gas phase has a long history.1,2,4,7–11 Many gas molecules with sufficient vapor pressure were subjected to FUV measurement. Fig. 1 gives one good example of FUV studies of gas molecules.12 It shows FUV spectra of six kinds of amides in the gas phase measured by Kaya and Nagakura in 1957.12 Major absorption bands in the spectra in Fig. 1 were assigned to the π–π* transition of the amide group, and the bands show a peak shift to lower energy upon CH3 substitution on the N atom. Kaya and Nagakura12 attributed the peak shift to low energy region to hyperconjugation with the substitution of methyl groups.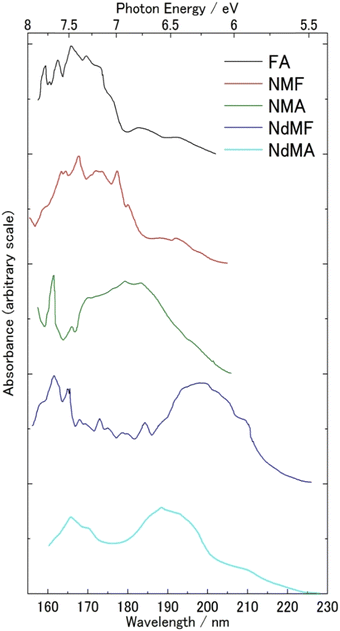 | ||
| Fig. 1 FUV-DUV spectra in the 160–230 nm region of six kinds of amides in the gas phase. Formamide (FA), N-methylformamide (NMF), N-methylacetamide (NMA), N,N-dimethylformamide (NdMF), and N,N-dimethylacetamide (NdMA). Reproduced from ref. 12 with permission from [Springer], copyright [1967]. | ||
The FUV spectroscopy studies of liquid and solid samples also have a long history, although their examples are limited.1,2,4,6,13–20 Rudloff et al.13 observed FUV spectra in the 34–207 nm region of solids using synchrotron radiation in 1971. Jung and Gress14,15 also utilized it to measure transmission FUV spectra in the 115–207 nm region of neat CH3OH and C2H5OH. A few groups measured the transmission spectra of water down to 155 nm or below using a very thin water film (2850 Å thick).18 This technique did not allow to observe a whole picture of FUV spectra of water without peak saturation. The reflection spectra of water were tried instead in the wavelength region above 170 nm. The absorption spectra of water were calculated from reflectance measurements by Painter et al.19–21 but they could not provide clear information about water spectrum.
2.2. Rydberg states and transitions in gas phase
Rydberg transitions are electronic transitions from π, n, and σ to molecular Rydberg orbitals. They often take place in a series described by the following hydrogen-like formula | (1) |
Rydberg transitions are, in general, ascribed to term values defined as the difference between the Rydberg state and corresponding ionization limit: ẼIP − ẼRyd.4,7,10 It can be seen from eqn (1) that the term values are small for high-n states, but for low n-states, they are large and very much depend on the molecular structure.
Rydberg transitions measured in the FUV region can be distinguished from the valence-shell transitions using difference in pressure dependence. Since Rydberg orbitals have large radii, Rydberg transitions are very susceptible to external perturbations or a high pressure. On the other hand, valence-shell transitions are much less sensitive to external perturbations because the unoccupied molecular orbitals of the transitions are less diffuse than Rydberg orbitals and do not expand over the molecule.10
Recently, investigations of high-resolution FUV spectra were carried out using synchrotron radiation. The electronic spectra in the 115–330 nm region of acetone in the gas phase were investigated with the resolution of 0.075 nm.24 Using high-resolution measurement, a new vibronic structure was observed, and n–π*, π–π*, and six Rydberg series were assigned. The absorption cross sections in the FUV region of CH3OH and its deuterated species (CH3OH, CD3OH, and CD3OD) were measured using synchrotron radiation.25
2.3. Recent progress of ATR-FUV spectroscopy
ATR-FUV spectroscopy has recently made remarkable progress in three directions.1–6 One is the direction of the extension of the wavelength region. The first ATR-FUV spectrometer was applicable to the 145–280 nm region, but the applicable region has been extended gradually. Nowadays, one can measure the ATR–UV-vis spectra in the region of 145–800 nm using a single spectrometer (Sections 5.3 and 9.2). Another new direction is the development of novel instrument and data analysis. Morisawa et al. developed nanosecond time-resolved ATR-FUV spectrometer that enables, for example, spectroscopic studies of radical species in chain reactions.26,27 Electrochemical ATR-FUV-UV spectroscopy has also been designed for the investigations of electrochemical interfaces (Sections 4.4 and 10).28 As for the data analysis, quantum chemical calculations have been employed from the beginning of ATR-FUV spectroscopy, but recently, chemometrics has also been used. Notably, Tanabe et al. demonstrated the usefulness of MCR in the ATR-FUV-UV spectra.29 Yet another new direction is a variety of applications.1–6 The recent trend of application of ATR-FUV and ATR-FUV-UV spectroscopy is applications to various materials such as inorganic semiconductors, graphene, carbon nanocomposites, ionic liquids, and biological materials. Applications to ultrathin materials surface (Section 8) and electrochemical interfaces (Section 10) are particularly noted. Another important research on ATR-FUV-UV spectroscopy is FUV-UV-surface plasmon resonance (SPR) and development of FUV-UV sensors with high sensitivity and surface selectivity (Section 11).3. Principles, characteristics, advantages, and limitations of ATR-FUV spectroscopy in the condensed phase
ATR method, which is one of reflection methods, has been used mainly for surface analysis and analysis of bulk materials and aqueous solutions in IR spectroscopy. In the ATR method, the penetration depth of incident light is very important. It is defined as the distance from the surface to a place where the intensity of radiation becomes 1/e of that at the surface. The penetration depth dp is expressed as follows | (2) |
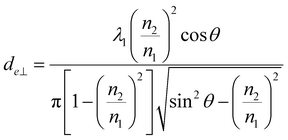
Penetration depth indicates the range of interaction between the evanescent wave and the non-absorbent sample. This value can be used as an indicator of a good interaction range even in samples with weak absorption. On the other hand, for the more precise quantification of bulk substances such as solutions, effective thicknesses are used as the optical path length of light. When parallel and perpendicular polarizations at the incident plane have the same intensity, the corresponding intensity in the evanescent wave is different (parallel > perpendicular); thus, the effective thicknesses are also different, expressed as follows.30
 | (3a) |
 | (3b) |
The idea of ATR-FUV spectroscopy came from ATR-IR spectroscopy.1–6 ATR spectroscopy markedly reduces the path length of light.30 It is possible to develop a very thin “cell” by introducing the ATR technique. ATR is a reflection method, and at the total reflection of light irradiation, it penetrates into a sample straddling an interface. The penetrated electric field enables one to measure a spectrum. It reduces exponentially in the sample. The penetration depth is defined as the distance from the surface of a prism to a place where the light intensity becomes 1/e of the intensity at the surface. The penetration depth in the IR region is several μm, while that in the FUV region is 20–100 nm. Accordingly, using ATR-FUV spectroscopy, one can overcome the problem of strong absorbance in the FUV region, and at the same time, ATR-FUV spectroscopy can be used as an ultrathin surface analysis method.
Molecules in condensed phase have very intense absorption in the FUV region. Many molecules that do not have a significant absorption below 200![[thin space (1/6-em)]](https://www.rsc.org/images/entities/char_2009.gif) nm yield an intense absorption in the FUV region. Water and alkanes are good examples. Bands originating from electronic transitions, such as π–π* and n–σ* transitions, and Rydberg transitions appear in the FUV region.1–6 One of the most important information that the FUV region provides is information about various types of Rydberg transitions in the condensed phase.
nm yield an intense absorption in the FUV region. Water and alkanes are good examples. Bands originating from electronic transitions, such as π–π* and n–σ* transitions, and Rydberg transitions appear in the FUV region.1–6 One of the most important information that the FUV region provides is information about various types of Rydberg transitions in the condensed phase.
FUV spectra sensitively reflect various variations, such as those in chemical bonding, conformations, and environments, so that they can yield information about the structure and interactions of molecules. FUV spectroscopy is a unique technique for investigating hydrogen bonds and hydration of water and aqueous solutions and hydrogen bonds, molecular structures and molecular interactions of inorganic and organic molecules, polymers, nanomaterials, and biological molecules.1–6
ATR-FUV spectroscopy is a unique method for exploring a top surface: ATR-FUV spectroscopy is basically a surface analysis method; thus, one can investigate the electronic structure and molecular structure of the top surface. The variable angle (VA)-ATR-FUV technique is often suitable for this type of study.1 Time-resolved FUV-UV spectroscopy allows us to investigate the kinetics of photochemical reactions (Section 4.2).
In comparison with synchrotron-based FUV spectroscopy, ATR-FUV spectroscopy is simple, inexpensive, and efficient. ATR-FUV spectrometers are bench top instruments. One can measure the FUV spectra of inorganic semiconductors, for example, without a high vacuum or big space, and ATR-FUV spectroscopy allows efficient and systematic investigations of the electronic structure and transitions of a variety of materials.
FUV spectroscopy shows wide versatility in its applications.1–6 Applications may be divided into four categories: applications to basic science, application to materials science and biological molecules, applications to surface science, and practical applications. As for applications to basic science, transitions from the σ molecular orbital in saturated molecules and observation of σ-Rydberg transitions in solid and liquid states have been investigated. This is a challenge to σ chemistry (Section 6). In these studies, ATR-FUV spectroscopy and quantum chemical calculations have always been combined (Section 5). Recently, the conformational dependence on the electronic structure and transitions of cyclohexane, methyl and dimethyl cyclohexane, and decalin were investigated by the combined study of ATR-FUV spectroscopy and quantum chemical calculation, and its study has attracted keen interests (Section 6). FUV spectroscopy is very useful for a variety of water studies, for example, investigations on hydrogen bonding, hydration, the effects of cations and anions on water structure, and the adsorption of water (Section 7). Another type of application to basic science is nanosecond time-resolved ATR-FUV spectroscopy studies of radical species in chain reactions, such as O3 pulse-photolytic reactions in aqueous solutions. FUV spectroscopy has been utilized for a variety of materials research ranging from polymers (Section 8) inorganic semiconductor materials (Section 8), ionic liquids (Sections 9 and 10), to nanomaterials (Section 9). ATR-FUV spectroscopy is powerful for research on surface science (Section 8). It is used to explore the electronic structure of ultrathin materials surface such as those of polymers, polymer nanocomposites, and graphene (Section 8). The electrochemical application of ATR-FUV is also concerned with materials research (Section 10). A valuable angle ATR-FUV spectroscopy study of water structure on an aluminum surface is another interesting example of surface study by ATR-FUV spectroscopy. Investigations of mineral waters and spring waters by ATR-FUV spectroscopy have also been reported. Another direction of ATR-FUV spectroscopy is FUV-UV surface plasmon resonance (SPR) sensors based on Al thin films (Section 11). The reflective index-dependent SPR properties of Al thin films have been studied by ATR-FUV-UV spectroscopy.
ATR-FUV spectroscopy has a few limitations.1–6 For example, it cannot disclose the electronic structure of the inside of a bulk material; it can investigate the electronic structure of only its surface. This is its disadvantage as well as its advantage. Another limitation is that there is possibility that the morphology of the solid samples creates imperfections at the surface of IRE-sample contact, decreasing the single-to-noise ratio of the measured spectra. Yet another one is that it is not always suitable for the qualitative and quantitative analysis of highly dilute solutions.
4. Instrumentation of ATR-FUV spectroscopy and data handling of ATR-FUV spectra
4.1. ATR-FUV spectrometer
Fig. 2 shows the schematic diagram of the ATR-FUV spectrometer system and an illustration of the evanescent wave on the IRE.1,2,31,32 The spectrometer consists of a commercial FUV spectrometer (KV-200, Bunko-Keiki, Tokyo, Japan) and an ATR compartment. In the development of this spectrometer, the design of a very small IRE probe was a crucial point.1,2,31,32 This IRE has led to the successful measurement of a whole à ←![[X with combining tilde]](https://www.rsc.org/images/entities/char_0058_0303.gif) transition absorption band of water and aqueous solutions. A 30 W deuterium lamp was used as the light source. As can be seen in Fig. 2, using a MgF2 beam splitter, light from the monochromator is split into two beams, a reference beam and a sample beam. The ATR reflected light and reference light pass through a quartz plate coated with sodium salicylic acid, which fluoresces. The fluorescence of each beam is then detected by a photomultiplier. In the case of a liquid sample, it is drawn into the 2-mm-diameter aperture in the IRE probe. A solid sample is placed on the probe, and the sample is pressed from the top to make contact between the IRE and the sample smooth. It is noted that air in the sealed instrument is purged with pure nitrogen gas while a sample is in the air. For more details of the instrument, please ref. 31.
transition absorption band of water and aqueous solutions. A 30 W deuterium lamp was used as the light source. As can be seen in Fig. 2, using a MgF2 beam splitter, light from the monochromator is split into two beams, a reference beam and a sample beam. The ATR reflected light and reference light pass through a quartz plate coated with sodium salicylic acid, which fluoresces. The fluorescence of each beam is then detected by a photomultiplier. In the case of a liquid sample, it is drawn into the 2-mm-diameter aperture in the IRE probe. A solid sample is placed on the probe, and the sample is pressed from the top to make contact between the IRE and the sample smooth. It is noted that air in the sealed instrument is purged with pure nitrogen gas while a sample is in the air. For more details of the instrument, please ref. 31.
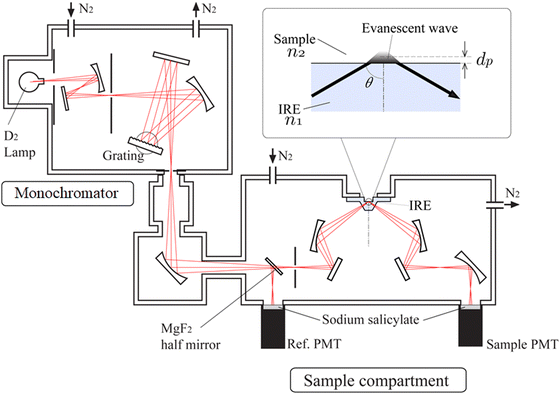 | ||
| Fig. 2 Schematic diagram of the ATR-FUV spectrometer and an illustration of the evanescent wave on the IRE. | ||
4.2. A time-resolved ATR-FUV spectrometer
Time-resolved absorption spectroscopy has been utilized extensively for investigating the kinetics of photochemical reactions. UV/Vis, near-infrared (NIR), and IR time-resolved spectroscopy have been pursued by many research groups. However, there was no investigation of transient absorption spectroscopy in the FUV region. We developed a time-resolved ATR-FUV spectrometer.26Fig. 3 illustrates a schematic diagram of the time-resolved ATR-FUV spectrometer, which we developed.26 In the FUV region, it was difficult to find a stable tunable laser; therefore, as a light source, white light from a laser-driven Xe lamp source was employed. The time resolution, determined by the time response of a continuous light detector, was 40 ns.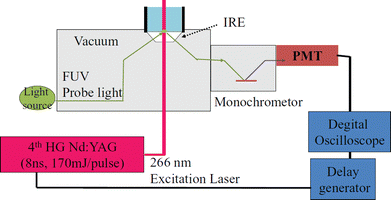 | ||
| Fig. 3 A schematic diagram of the time-resolved (TR) ATR-FUV spectrometer. Reproduced from ref. 26 with permission from [AIP Publishing], copyright [2012]. | ||
The sample solution flows through the cell (Fig. 3) at 80 mL min−1. As a probe light source, a laser-driven Xe lamp source (EQ-99, Energetic Technology) was used. The probe light is incident to the IRE at an incident angle of 70°. A solar blind response photomultiplier (PMT; R6835, Hamamatsu Photonics) with a homemade preamplifier was employed to detect the probe light. This time-resolved spectrometer enables us to obtain the nanosecond TR FUV spectra in the 170 to 185 nm region of aqueous solutions. For example, Morisawa et al.26 measured the transient absorption spectra in the 170–185 nm region of the phenol solution (3.0 × 10⁻³ mol dm−3) over a time range of 0.2–2.0 μs. They also investigated the transient absorption spectra of a 1.0 × 10⁻³ mol dm−3 aqueous solution of tryptophan.26 In these, time-resolved ATR-FUV captured the decrease in the reactant by photodissociation and increase and decrease in transient products after photodissociation in the solution state.26 Goto et al. studied pulse laser photolysis of aqueous ozone in the μs range using time-resolved ATR-FUV spectroscopy.27
4.3. ATR-UV-visible spectroscopy
Recently, we have expanded the measurement wavelength region into the visible region by changing the diffraction gratings. Although a diffraction grating designed for visible light cannot measure FUV light, we can measure ATR spectra in the 200–800 nm range. In this region, many materials have strong absorbance. Therefore, using the ATR method, their absorption spectra can be measured without spectral saturation. In addition, the strong absorbance enables us to measure the spectra of thin (nanometer thickness) films with enough spectral intensity. Recently, the ATR-UV-visible spectral investigation of the organic films has been reported (Section 10).334.4. Electrochemical ATR-UV-visible spectroscopy
Recently, we constructed a new electrochemical-ATR-UV-visible spectroscopic system, which can measure the spectra under voltage applications.28 In this system, working electrode films (∼10 nm thickness) such as metal (Pt) and organic film were deposited on an ATR prism. Subsequently, other liquid or solid materials was placed on the working electrode. As needed, a reference electrode and a counter electrode were placed in the system. In the UV and visible regions, the penetration depth of the evanescent wave is approximately 50–100 nm; thus, it is expected that the absorbance near the working electrode surface is measured. More details are described in Section 10.4.5. Data handling
Absorbances and their corresponding peak wavelengths, as observed through the ATR method, exhibit deviations from the spectra measured by transmittance mode and simulation spectra calculated by quantum chemical calculations. These deviations are due to refraction effects associated with the reflection spectra. Therefore, it is necessary to employ the Kramers–Kronig transformation (KKT) to the measured ATR spectra to compare them with the corresponding transmittance spectra. Theoretically, an ATR spectrum can be decomposed by KKT and Fresnel equations into the spectra of real and imaginary parts of the refractive indices, corresponding to absorption and refractive indices, respectively.30 Ikehata et al. developed the KKT for ATR-FUV.32,34,35 They formulated KKT without taking into account the wavelength dispersion of optical parameters of the IRE.32,34 Nonetheless, the equations have been proven in the analysis of the ATR-FUV spectra.32–36To achieve more precise results, recently, they have proposed a simple practical method for the correction of KKT with two parameters in the refractive index of internal reflection elements, np.37 These parameters include all the effects of the instrumental function. Potassium iodide solutions employing the ratio of absorption indices of charge-transfer-to-solvent (CTTS) transitions at 195 and 230 nm, respectively, were used to optimize the parameters. The transitions observed were assigned to 2P1/2 and 2P3/2, respectively.38–40 The absorption indices, κ, at the corresponding wavelength, λ, were calculated from the absorbance of the transmittance measurements, AT, by the following formula
 | (4) |
 | (5) |
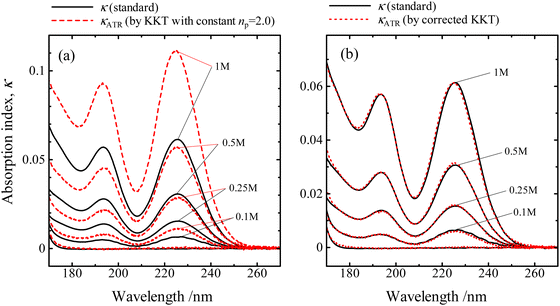 | ||
| Fig. 4 Absorption indices of KI solutions, derived from the ATR-FUV spectra using alternative KKT methods (represented by dotted lines, denoted as κATR), and those obtained from transmittance spectra using formula (2) (represented by solid lines, denoted as κ) are compared. The results of κATR are calculated form (a) KKT using a constant value of np = 2.0 and (b) the refined KKT with a np obtained by formula (3), taking into account the inherent instrument function. Reproduced from ref. 37 with permission from [Sage], copyright [2017]. | ||
The absorption indices determined by the KKT with a constant value of np show significant deviations from those by transmittance. On the other hand, the absorption indices given by the corrected KKT significantly correspond well to the standards in the same concentration range and wavelength region.
It has been confirmed that the corrected KKT using the parameters optimized by the absorption indices of aqueous solutions of KI in the wavelength region of 175–270 nm can be successfully applied. Absorption spectra indices calculated from the ATR-FUV spectra of water in the wavelength range of 145–200 nm region by the same parameters of Fig. 4(b) are compared with the corresponding absorbance of a liquid water film sandwiched between CaF2 windows prepared as thin as possible by the transmittance method in Fig. 5. The transmittance spectrum and the calculated κATR spectrum both show the band peak at 147 nm. In this way, the corrected KKT with the parameters optimized by standard solutions can also be performed well in the FUV region.
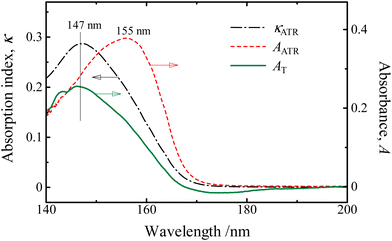 | ||
Fig. 5 The absorption indices of pure water within the à ← ![[X with combining tilde]](https://www.rsc.org/images/entities/char_0058_0303.gif) band region that were acquired through transmittance measurements of a liquid thin film confined between sandwiched CaF2 windows (represented by the solid line) and calculated indices from the refined KKT (represented by the dotted line). The dashed line corresponds to the ATR spectrum without any correction. Reproduced from ref. 37 with permission from [Sage], copyright [2017]. band region that were acquired through transmittance measurements of a liquid thin film confined between sandwiched CaF2 windows (represented by the solid line) and calculated indices from the refined KKT (represented by the dotted line). The dashed line corresponds to the ATR spectrum without any correction. Reproduced from ref. 37 with permission from [Sage], copyright [2017]. | ||
5. Quantum chemical calculation methods for UV transition bands and the challenges resulting from the properties of FUV and DUV spectra
Quantum chemical calculations can provide important insights into the electronic absorption bands observed in the ATR-FUV-DUV spectra.4,6,41 Over the years, there have been significant advances in both theoretical and computational (i.e., implementation of methods) aspects of quantum chemistry, enabling the calculation of the electronic structure and transitions of increasingly complex molecular systems and more accurate predictions of UV spectra.42 Time-dependent density functional theory (TD-DFT) is one of the most widely applied method for the calculation of UV spectra,43 while advanced ab initio methods such as symmetry-adapted cluster-configuration interaction (SAC-CI) or equation-of-motion coupled cluster (EOM-CC) are also used. Particular attention should be given to the recent studies of condensed phases with ATR-FUV-DUV spectroscopy.1–6 Firstly, the quantum chemical calculations of high-energy electronic transitions in this spectral region have introduced certain challenges. Secondly, the properties of the condensed phase, investigation of which has been much eased by this new technique, also require refined approaches. For example, accurate modelling of the Rydberg transitions in such materials involves effects that are not essential in the conventional studies of FUV and DUV region in the gas phase (Section 6.1).In quantum chemistry, excited states are typically described using time-dependent methods, which are capable of treating the dynamics of electronic excitation and relaxation processes.44,45 While methods such as Hartree–Fock (HF) and density functional theory (DFT) are very successful in describing the ground-state properties of molecules, they are unable to accurately describe the excited-state properties due to their static nature. The electronic structure of molecules determined from both the ground and excited states is important for the accurate calculation of UV absorption spectra. The methods explicitly designed to describe excited states treat electron correlation effects beyond the single-electron level to capture the dynamical processes involved in electronic excitation and relaxation.
5.1. Density functional methods
Density functional theory (DFT) calculations are widely used in spectroscopy because of their efficiency, which allows for the calculation of electronic structures of large systems. However, ground-state DFT can only provide approximate UV spectra because they cannot accurately account for the excited states involved in electronic transitions.46 Time-dependent DFT (TD-DFT) extends DFT to include the calculation of excited states, making it a powerful method for calculating electronic absorption spectra.47 TD-DFT calculations explicitly include excited states (eqn (4)), making them much more accurate in predicting electronic absorption spectra.| Eexcited state = Eground state + ΔEvertical + ΔEnon-vertical | (6) |
5.2. SAC-CI method
The SAC-CI method enables the accurate calculation of electronic excited states in various molecular systems, including organic molecules, transition metal complexes, and biomolecules.50 This method was originally developed by Nakatsuji51,52 and was further improved by Ehara and co-workers, particularly for including higher operators and implementation.50 The ground state is described by the SAC method, which is the cluster expansion with single and double symmetry-adapted excitation operators. The SAC-CI method describes the excited states by applying the excitation operators to this correlated ground-state SAC wavefunction. It utilizes the transferability of the electron correlations; therefore, the convergence with respect to the order of the excitation operators is much faster than the standard CI methods for describing the excited states. Because the method adopts only the space- and spin-symmetry adapted excitation operators, the expansion is compact and instability does not occur. Thus, the SAC-CI method sufficiently includes dynamic electron correlations, which are important to describe the electronic excited states suitably.The SAC-CI method is computationally more expensive than TD-DFT and semi-empirical methods; however, it provides reliable results in various spectroscopies including ATR-UV-FUV.50,53 For application in FUV and DUV spectroscopy, the relevant excited states can be intrinsically characterized by one-electron excitations. In that case, the excitation operators can be limited to singles and doubles for R-operators, i.e., in the SAC-CI SD-R method.50,53 The applicability of SAC-CI is especially notable for its use in spectroscopic studies.50,53
5.3. EOM-CC method
Equation-of-motion coupled-cluster (EOM-CC) is a highly accurate method for calculating electronic excited states and UV spectra of molecules. EOM-CC is an extension of the CC method, which expands the wavefunction as a series of excitation operators on a reference determinant.54 Unlike the traditional CC method, EOM-CC solves the equation-of-motion derived from the Schrödinger equation, accurately describing both singly and doubly excited states, including charge transfer and Rydberg states. EOM-CC can be performed at various levels of approximation, including EOM-CCSD (iterative singles and doubles) and EOM-CCSD(T), which includes perturbative triples and is essential for systems with significant correlation energy. Studies have shown that EOM-CC delivers high accuracy and reliability for computing UV spectra both for simple systems as well molecules with diverse electronic structures.55–595.4. Challenges in quantum chemical calculations of high-energy electronic spectra
In the high-energy region of the UV spectrum (FUV and DUV), the electronic transitions involve highly excited states and are, therefore, more challenging to accurately describe using quantum chemistry methods.44 For instance, even relatively efficient time-dependent methods such as TD-DFT or TD-HF become more computationally demanding and less accurate in this region due to the inclusion of higher-energy virtual orbitals. Semi-empirical methods may also have limitations in accurately describing highly excited states due to their parametrization that is better aligned with the properties corresponding to the transitions appearing in the conventional UV region, i.e., low-lying excited states. Therefore, different methods and/or experimental data may be needed to obtain accurate results in the FUV and DUV regions.46,53 In general, highly correlated methods such as EOM-CC and SAC-CI are considered to be the gold standard for the calculation of electronic excited states in this region of the spectrum. However, their application to molecules as the center of attention of experimental FUV-DUV spectroscopy (e.g., polymers, ionic liquids, and medium-sized organic molecules) is often prohibitively expensive. However, TD-DFT and semi-empirical methods can still provide useful information about the electronic transitions in FUV and DUV regions of such systems and are therefore of great value for the advancement of applied ATR-FUV-DUV spectroscopy.53Earlier before, the attention in the investigation of high-lying excited states was primarily directed toward gas-phase molecules as the consequence of the limitations of the available experimental spectroscopic techniques.69 The introduction of the ATR-FUV-DUV technique opened a new avenue in the investigation of high-energy electronic transitions in the condensed phase. However, this breakthrough also shifted the attention toward applicability and accuracy of quantum chemical approaches to reproduce the FUV-DUV spectra of liquids and solids.41 This new spectroscopic technique delivers experimental data for benchmarking and validating methods of quantum chemistry in modelling the high-energy states of molecules in the condensed phase. This new possibility was identified early as demonstrated, for example, by Morisawa et al.69 Accordingly, the FUV spectral region of a range of amides in the liquid phase, including formamide (FA), N-methylformamide (NMF), N-methylacetamide (NMA), N,N-dimethylformamide (NdMF), and N,N-dimethylacetamide (NdMA), was investigated to examine the electronic transitions of these molecules.69 A comparison was made between the gas-phase spectra and the corresponding spectra of the samples in the liquid phase, with a focus on the shift in the primary absorption band within the 180–200 nm wavelength window. Quantum chemical calculations using TD-DFT and SAC-CI methods indicated that intermolecular hydrogen-bonding interactions play a significant role in determining the magnitude of the shift. Noteworthily, the study delivered important insights on the accuracy of modelling the chemical surrounding of polar molecules in this context. The state-specific polarizable continuum model (SS-PCM) applied in SAC-CI calculations (i.e., SS-PCM-SAC-CI) yielded more accurate FUV-DUV spectra of non-hydrogen bonding liquids (NdMA, NdMF) than the linear-response-PCM (LR-PCM) approach as the latter describes only the linear component of the polarization (Fig. 6).
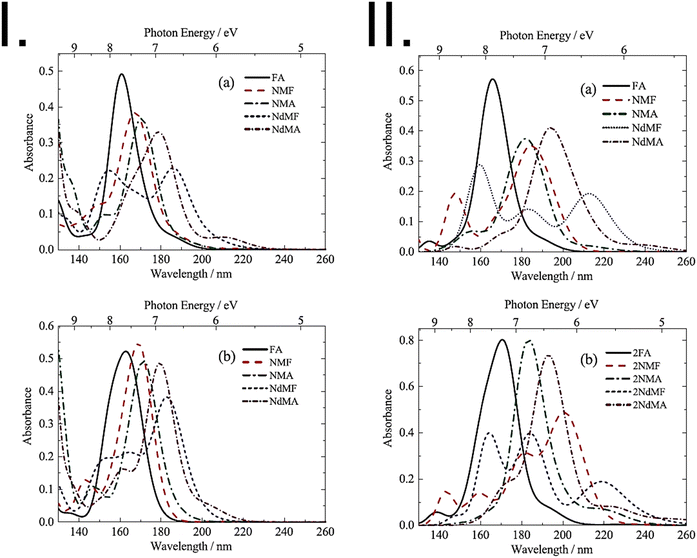 | ||
| Fig. 6 Panel I: theoretical spectra of monomer molecules of amides (FA, NMF, NMA, NdMF, and NdMA) obtained using (a) TDDFT calculations performed in vacuum; (b) LR-PCM-TDDFT calculations. In both cases band broadening was applied through the spectral profile to enable comparison with experimental spectra. Panel II: convoluted theoretical spectra of an amide (a) monomer and (b) dimer molecules in vacuum calculated using SAC-CI. Adapted with permission from ref. 69 from [AIP Publishing], copyright [2013]. | ||
The introduction of ATR-FUV-DUV spectroscopy also marked an important breakthrough into our understanding of sigma orbitals in liquids and solids and the related chemistry. These transitions can be sensitive to changes in molecular geometry, electron density, and electronic environment and can provide valuable information about the electronic structure and properties of molecules. The analysis of sigma transitions in the FUV region can provide insights into the electronic properties, reactivity, and behavior of molecules; however, the knowledge gathered earlier was mostly limited to the gas phase. The ATR-FUV-DUV studies of the behavior of sigma transitions of various types of systems in the presence of specific environments or solvents is currently rapidly unfolding. Accordingly, new challenges are also identified to be standing before the tools of quantum chemistry to provide a relevant description of electronic transitions involving sigma orbitals in the condensed phase. So far, valuable conclusions were delivered by the studies of alkanes by Morisawa et al.70 In that study, TD-DFT calculations were used to interpret the ATR-FUV-DUV spectra manifesting the effects of axial substitutions of cyclohexane, methyl- and dimethyl cyclohexane, and decalin. The study revealed a spectral variation attributed to the escalated orbital energy of HOMO−2, where the electron density is primarily concentrated on the axial C–H bond, as identified through calculations. NBO analysis unveiled a deeper relationship between the second perturbation energies of the interaction between Cα–Hax and Cβ–Hax, indicating a correlation between the orbital energies of HOMO−2 and changes in vicinal interaction by axial substitution. With respect to the further development of quantum chemical methods for the studies of FUV and DUV spectra in the condensed phase, these insights help better identify the specific aspects of molecular properties that ought to be reliably described in order to study the sigma orbitals of complex molecules.
Importantly, ATR-FUV-DUV spectroscopy opened a possibility to deliver new insights into Rydberg states of molecules in the condensed phase.41,71 Unlike in the gas phase, the Rydberg bands observed in condensed phases undergo broadening effects related to the lifetime, presenting difficulties for experimental methods as well.72 Furthermore, in the condensed phase, Rydberg transitions are affected by the environment, such as solvent effect and intermolecular interactions. This can lead to changes in the transition energies and intensities as well as changes in the lifetime and decay pathways of the Rydberg state, resulting in shifts in the excitation energies compared to the gas phase.72 On the other hand, in solids, the Rydberg state can be strongly localized, leading to the formation of excitons and the observation of narrow spectral features.73 Thus, the calculation and interpretation of Rydberg transitions in liquid or solid phase requires the consideration of the surrounding environment and the associated molecular interactions. To account for these effects in an efficient manner, various models of the chemical surrounding have been developed to avoid computationally high cost with explicit representations of the neighboring molecules. Accordingly, implicit solvation models, e.g., polarizable continuum model (PCM), can be used in combination with electronic structure methods to accurately calculate Rydberg transitions in the condensed phase.74–76 A different challenge in calculating UV bands of Rydberg transitions, encountered in gas phase studies as well, is the large size of the basis sets required to accurately describe the excited states involved in these transitions. The basis sets must be large enough to properly capture the electron correlation effects that are important in Rydberg states, increasing the computational cost, particularly the in case of large molecules and heavy atoms.53
In the applied spectroscopic studies of Rydberg states in the condensed phase, efficient TD-DFT method can often be applied with sufficient accuracy.53 In some cases, TD-DFT may be inapplicable to describe the Rydberg states of significant multireference character due to the limitations of the method. In such situations, other approaches such as SAC-CI may be more suitable.53 Furthermore, the development of semi-empirical methods that are specifically tailored to the study of Rydberg states and transitions is an active area of research and may lead to improved accuracy and applicability of these methods in the future.77,78
On the other hand, the effect related to alkali metal coordination is also explicitly manifested in the high-energy electronic transition region. However, alkali metal complexes are challenging systems for the methods of quantum chemistry in this respect. Despite their practical applications, there is a lack of fundamental understanding of the electronic states and electronic structures of alkali-metal complexes, particularly in terms of ground and excitation states near the highest occupied molecular orbital (HOMO) and lowest unoccupied molecular orbital (LUMO) transitions. The study by Morisawa et al.79 investigated the electronic transitions of complexes of lithium with polyethylene glycol (PEG) using attenuated total reflectance spectroscopy in the FUV region. The ATR-FUV spectra of the Li-PEG complex showed a decrease in intensity, while the growth in Li salt concentration resulted in a significant blue shift. This points toward the creation of a complex via coordinated bonding between Li+ and O atoms in PEG. In order to gain deeper insights into the observed patterns, theoretical spectra calculated using the TD-DFT method were compared with experimental ones; a good agreement evidenced that this approach was fully sufficient to provide reasonable interpretation of the observed spectral variations. Accordingly, the TD-DFT study indicated that the changes in the intensity and peak positions of the bands at approximately 155 and 177 nm are due to coordination bonding between Li+ and the O atoms in the molecule of PEG.43 In particular, TD-DFT calculations accurately reproduced the expansion of the electron density of PEG, which is associated with the FUV peak observed at 177 nm.
6. Transitions from σ molecular orbital in saturated molecules—challenge to σ chemistry
6.1. ATR-FUV spectroscopy and quantum chemical calculation studies of electronic structure and transitions of simple organic molecules in liquid and solid states
ATR-FUV spectroscopy has great potential for revealing the electronic transitions and structure of a wide range of molecules.1–6 In a series of studies, various organic molecules were investigated by ATR-FUV spectroscopy, namely, alcohols,80 n- and branched alkanes,81,82 cyclohexane and its derivatives,70 ketones,83 amides,69 imidazolium-based ionic liquids,84 amino acids,85 and glycols and their esters86 in the liquid phase. The measured spectra were compared to those of the corresponding gaseous states, alongside quantum chemical calculations involving molecular electronic transitions, such as TD-DFT and SAC-CI.41,53 Utilizing ATR-FUV spectroscopy, one can investigate the existence of confined Rydberg transitions in within the liquid phase. Table 1 shows the electronic transitions of simple organic molecules observed in the FUV region. As seen in the table, transition from non-bonding electron (n) and sigma electron (σ) to 3s, 3p, and 3d Rydberg transitions were observed for many kinds of molecules in the range of 145–200 nm. The molar absorption coefficient, ε, of σ-3p Rydberg transitions increased with the increase in carbon numbers among the same group. Neville et al.87,88 examined the electronic states of cyclopropane in its gaseous phase through the utilization of FUV spectroscopy and highly precise quantum chemical calculations. They ascribed two cyclopropane transitions within the FUV region and revealed the photo-dissociation mechanism of C–C bonds from the photoexcited state.87,88 The determination of the electronic transitions and underlying electronic structure of cycloalkanes holds importance in discerning their innovative reaction processes.| Group | Ref. | Molecules | Wavelength/nm | Transitions | ε/104 mol−1 dm3 cm−1 |
|---|---|---|---|---|---|
| MEK: 2-butanone, MPK: 2-pentanone, DEK: 3-pentanone, MIPK: 3-methyl-2-butanone, MIBK: 4-methyl-2-pentanone, 22DMB: 2,2-dimethylbutane, 224TMP: 2,2,4-trimethyl-pentane, FA: formamide, NMF: N-methyl formamide, NMA: N-methyl acetamide, NdMF: N,N-dimethylformamide, NdMA: N,N-dimethylacetamide, [C2mim][BF4]: 1-ethyl-3-methylimidazolium tetrafluoroborate, [C4mim][BF4]: 1-butyl-3-methylimidazolium tetrafluoroborate, [C8mim][BF4]: 1-octyl-3-methylimidazolium tetrafluoroborate, DG: diethylene glycol, TG: triethylene glycol, DGDM: diethylene glycol dimethyl, DGDE: diethylene glycol diethyl, TGDM: triethylene glycol dimethyl, Ala: L-alanine, Gly: glycine, Ile: L-isoleucine, Leu: L-leucine, Pro: L-proline, Val: L-valine, Cys: L-cysteine, Met: L-methionine, Ser: L-serine, Thr: L-threonine, cC6: cyclohexane, McC6: methylcyclohexane, dMcC6 dimethyl cyclohexane Ryd.: Rydberg | |||||
| Alcohol | 80 | Methanol | 155.7 | n-3p Ryd. | 0.3 |
| Ketones | 83 | Acetone, MEK, MPK, DEK, MIPK, MIBK | 184–188 | n-3s Ryd. | 0.3–0.7 |
| 141–146 | n-3d Ryd. | 2.2–2.7 | |||
| Branched ketones | 83 | MIPK, MIBK | 164 | n-3p-Ryd. | 1.3–1.5 |
| n-Alkane | 81,82 | CnH2n+1 (n = 5–14) | 146–158 | σ-3p Ryd. | 0.7–2.1 |
| Branched alkane | 81,82 | 22DMB, 223TMP | 164 | σ-3s Ryd. | 0.5 |
| Amides | 69 | FA, NMF, NMA, NdMF, NdMA | 180–197 | π–π* | 6.2–7.9 |
| Imidazolium-based ionic liquids | 84 | [C2mim][BF4], [C4mim][BF4], [C8mim][BF4] | 193.4–194.1 | π–π* | 0.3 |
| 154.8–155.2 | (π + σ)–π* | 1.8–2.2 | |||
| Glycols and their ester | 86 | DG, TG, DGDM, DGDE, TGDM | 173.6–179.0 | n(CH2OCH2)-3s Ryd. | 0.2–0.6 |
| 159.7–162.0 | n(CH2OCH2)-3p Ryd. | 0.6–1.2 | |||
| 86 | DG, TG | 151.4–151.8 | n(OH)-3p Ryd. | 1.0–1.5 | |
| 86 | DGDM, DGDE, TGDM | 154.6–155.4 | n(CH2OHCH2) -3d Ryd. | 1.1–1.6 | |
| Amino acid (ammonium carboxylic acid) | 85 | Ala, Gly, Ile, Leu, Pro, Val | 158 | π–π* | 0.4–0.5 |
| Ala, Ile, Leu, Pro, Val | 169 | σ-3s Ryd. | 0.2–0.3 | ||
| 148 | σ-3p Ryd. | 0.4–0.7 | |||
| Amino acid (zwitterion) | 85 | Ala, Gly, Ile, Leu, Pro, Val | 169 | π–π* | 0.7–0.8 |
| 146 | π–π* | 0.6–0.7 | |||
| Amino acid (amino carboxylate anion) | 85 | Ala, Gly, Ile, Leu, Pro, Val | 171 | π–π* | 0.6–0.8 |
| Amino acids with OH (ammonium carboxylic acid) | 85 | Cys. Met | 158 | π–π* | 0.4 |
| 151 | σ-3p Ryd. | 0.5 | |||
| Amino acid with SH, –S– (ammonium carboxylic acid) | 85 | Ser, Thr | 190-202 | n,σ–σ* | 0.2 |
| 158 | π–π* | 0.7 | |||
| 151 | σ-3p Ryd. | 1.2–1.4 | |||
| Amino acids with OH (zwitterion and amino carboxylic acid) | 85 | Cys. Met, Ser, Thr | 168 | π–π* | 0.7 |
| Amino acid with SH, –S– (zwitterion and amino carboxylic acid) | 85 | Ser, Thr | 205–236 | n,σ–σ* | 0.2–0.4 |
| 169 | π–π* | 0.9–1.2 | |||
| Cyclohexane and its derivative | 70 | cC6, McC6, trans-1,2-dMcC6, cis-1,3-dMcC6 trans-1,4-dMcC6 | 162–163 | σ(HOMO)-3p Ryd. | 0.2–0.7 |
| 151–156 | σ(HOMO−2)-3pRyd. | 0.7–1.7 | |||
| 70 | cis-1,2-dMcC6 trans-1,3-dMcC6 | 163 | σ(HOMO)-3pRyd. | 0.6 | |
| cis-1,4-dMcC6 | σ(HOMO−2)-3p Ryd. | ||||
| Decalin | 70 | trans-Decalin | 165 | σ(HOMO)-3p Ryd. | 2.1 |
| 151 | σ(HOMO−2) -3pRyd. | 0.7 | |||
| cis-Decline | 165 | σ(HOMO) -3pRyd. | 0.8 | ||
| σ(HOMO−2)-3p Ryd. | |||||
6.2. ATR-FUV spectroscopy and quantum chemical investigation: exploring the influence of conformation on the electronic structure and transitions of cyclohexane, methyl and dimethyl cyclohexane, and decalin
The FUV spectra of cycloalkanes (CnH2n; n = 3–8) in the gaseous state were measured by Raymonda et al. in 1960s.89 Since quantum chemical calculations were not well developed at that time, their band assignment was not reported. No report studies the ramifications of hyperconjugation upon the electronic transitions of C–C and C–H bonds prior to the advent of ATR-FUV investigation. The primary barrier that disturbs the revealing σ bonding through FUV spectroscopy is not the difficulty of conducting comprehensive experimental studies on σ bonding for numerous molecular species. ATR-FUV spectroscopy provides systematic information about the excitation states of saturated organic molecules and the hyperconjugation of σ bonds. Using the ATR-FUV, Morisawa et al. measured the FUV spectra of cyclohexane, methyl cyclohexane, six isomers of dimethyl cyclohexane, and cis- and trans-decalin.70 The FUV spectra of both cyclohexane and methyl cyclohexane in the neat liquid states revealed bands characterized by a central wavelength approximately 155 and 162 nm. Through the results of TD-DFT calculations, it is possible to ascribe the 155 and 162 nm band to the transition originating from HOMO−2 to Rydberg 3pz (Tb) and those originating from HOMO and HOMO−1 to Rydberg 3px/3py (Ta), respectively.70In the case of dimethyl cyclohexane, a total of six isomers exists. The authors have claimed that the FUV spectra can be categorized into two groups based on the position of the methyl substitution. The first group includes trans-1,2-, cis-1,3-, and trans-1,4-dimethyl cyclohexane, wherein the two substituents are situated in equatorial positions. Conversely, the second group comprises cis-1,2-, trans-1,3-, and cis-1,4-dimethyl cyclohexane, featuring a substituent located in one equatorial and one axial position. As for decalin, the trans- and cis-conformer correspond to the former and later, respectively. Fig. 7(a) and (b) show the ε spectra of trans-1,2- and cis-1,2-dimethyl cyclohexane after the KK transformation and their second derivatives, respectively.70 In Fig. 7(b), the band at 163 nm was observed in both isomers and that at 151 nm was seen only in the 1,2-trans-isomer.70 The spectra of trans-1,3- and cis-1,4-isomers and trans-decalin had similar features to cis-1,2-dimethyl cyclohexane and those of cis-1,3- and trans-1,4-isomers and cis-decalin were like that of trans-1,2-dimethyl cyclohexane.
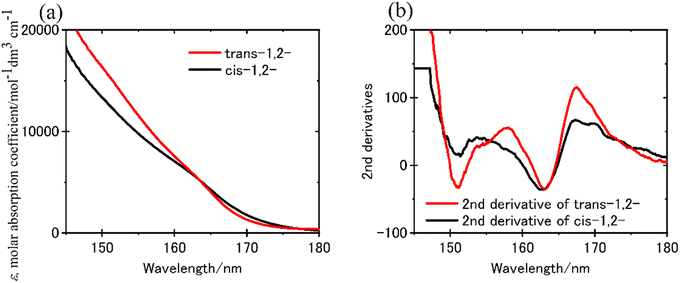 | ||
| Fig. 7 (a) ε spectra of trans-1,2- and cis-1,2-dimethyl cyclohexane derived from the KKT of ATR-FUV spectra, and (b) the second derivatives of (a). Reproduced from ref. 70 with permission from [American Chemical Society], copyright [2021]. | ||
The simulation spectra of trans-1,2- and cis-1,2-dimethyl cyclohexane is shown in Fig. 8(a) and (b), respectively.70 The simulation spectrum was generated through the convolution of the Gaussian function with the excitation energy and oscillator strength obtained from TD-DFT calculations represented by stick diagrams. The linewidth reflects molecular heterogeneity and/or the vibronic function in the ground state of the steeply rising curve of the excitation state and onto the frequency axis;7 here, a linewidth of 0.3 eV was given to reproduce the observed spectrum. Since the simulation spectra of trans-1,2- and cis-1,2-isomers were similar to those of methylcyclohexane in the equatorial and axial conformations, respectively, the effect of axial substitution was apparent in these molecules.70 The simulation spectrum of trans-1,2-dimethyl cyclohexane exhibits two transitions occurring near 148 nm, originating from HOMO−2 to Rydberg 3p (Tb), and one transition at 154 nm arising from HOMO to Rydberg 3p (Ta). Fig. 8(c) and (d) depict the isodensity surfaces of HOMO, HOMO−1, and HOMO−2 for both trans-1,2- and cis-1,2-dimethyl cyclohexane.70 It is worth noting that the isodensity surfaces in HOMO−2 of dimethyl cyclohexane with the two equatorial conformations resemble those of cyclohexane. Consequently, the impact of the equatorial substitution on the isodensity surfaces appears to be minimal. Conversely, the effect of the axial substitution is prominently evident on the isodensity surfaces. The pronounced spectral variation observed in the case of axial substitution may be attributed to an increase in the orbital energy of HOMO−2, which exhibits concentrated electron density at the axial C–H bond.
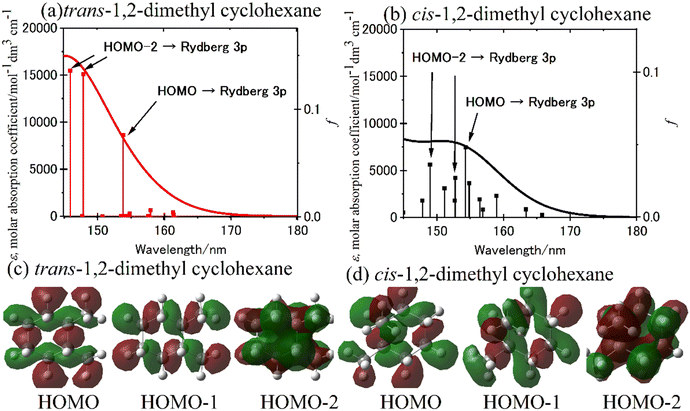 | ||
| Fig. 8 (a) and (b) The simulation spectra calculated for (a) trans-1,2- and (b) cis-1,2-dimethyl cyclohexane using the TD-CAM-B3LYP/aug-cc-pVDZ level of theory. (c) and (d) The computed isodensity surfaces of the HOMO, HOMO−1, and HOMO−2 of (c) trans-1,2-and and (d) cis-1,2-dimethyl cyclohexane. Reproduced from ref. 70 with permission from [American Chemical Society], copyright [2021]. | ||
Concerning the impact of hyperconjugation of C–C and C–H σ orbitals, the second perturbation energies of the interaction between Cα–Hax and Cβ–Hax were evaluated for molecules using natural bond orbital (NBO) analysis. Fig. 9 exhibits the correlation between the stabilization of the calculated orbital energies of HOMO−2 and the augmentation of the second perturbation energies associated with the vicinal interactions between Cα–Hax and Cβ–Hax.70 Consequently, an observed correlation between these energies was established. The measurements of FUV spectra and the quantum chemical calculation proved that differences in the density of σ electrons caused vicinal interaction between Cα–Hax and Cβ–Hax, which is why the methyl substitution in the equatorial position cyclohexane is significantly more stable than the axial substitution.
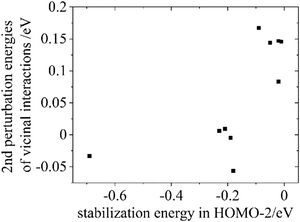 | ||
| Fig. 9 The relationship between the stabilization of orbital energies in HOMO−2 and the augmentation of the second perturbation energies of vicinal interactions involving Cα–Hax and Cβ–Hax. Reproduced from ref. 70 with permission from [American Chemical Society], copyright [2021]. | ||
7. Applications of ATR-FUV spectroscopy to studies on water and aqueous solutions
ATR-FUV spectroscopy has been used for various studies of water and aqueous solutions.1–6,31,32,34–37 The position, intensity, and bandwidth of à ←![[X with combining tilde]](https://www.rsc.org/images/entities/char_0058_0303.gif) band are very sensitive to temperature and concentration and kinds of ions included. Moreover, they change with hydrogen bonds. Therefore, one can investigate the effects of ions and hydrogen bondings with solutes. For example, the effects of cations on the first electronic transition of liquid water and those of s- and p-metal cations on the à ←
band are very sensitive to temperature and concentration and kinds of ions included. Moreover, they change with hydrogen bonds. Therefore, one can investigate the effects of ions and hydrogen bondings with solutes. For example, the effects of cations on the first electronic transition of liquid water and those of s- and p-metal cations on the à ← ![[X with combining tilde]](https://www.rsc.org/images/entities/char_0058_0303.gif) transition of liquid water were studied using ATR FUV spectroscopy.35
transition of liquid water were studied using ATR FUV spectroscopy.35
In this session, several interesting examples of applications of ATR-FUV spectroscopy to studies on water and aqueous solutions are outlined.
7.1. Direct observation of the absorption bands of the first electronic transition in liquid H2O and D2O by ATR-FUV spectroscopy
As shown in Fig. 10, the FUV region yields very strong band near 160 nm.31,32 It is stronger by about several tens of times than the OH stretching band of water in the IR region. The 160 nm band is due to the first electronic transition, Ã ←![[X with combining tilde]](https://www.rsc.org/images/entities/char_0058_0303.gif) , of water because it originates from the electronic transition of the lowest energy site. Based on quantum calculations, this band is due to the electronic transition from 1b, (n) orbital to 4a1 orbital or 3s (Rydberg) orbital (Fig. 11).1,32 The transition from 1b to 4a1 is concerned with the valence electron (nonbonding lone-pair electrons of oxygen atom); thus, it reflects the hydrogen bonding of water. On the other hand, the transition from 1b to 3s (Rydberg) is the transition to the Rydberg series, named as molecular orbital (MO) Rydbergization. The Rydberg states have very large sizes of electron orbitals, which are much larger than those of the corresponding ground state. Therefore, the Rydberg states in condensed phases receive the effects of surrounding molecules. A higher energy shift observed for matrix-isolated water with a decrease in the size of the matrix constituents provided an evidence of Rydberization.32 It is noted that the excited states of valence and Rydberg orbitals are complementary by the OH distances. The Rydberg character of the external molecular orbital becomes dominant as the OH distance becomes shorter (i.e., in the condensed phase).
, of water because it originates from the electronic transition of the lowest energy site. Based on quantum calculations, this band is due to the electronic transition from 1b, (n) orbital to 4a1 orbital or 3s (Rydberg) orbital (Fig. 11).1,32 The transition from 1b to 4a1 is concerned with the valence electron (nonbonding lone-pair electrons of oxygen atom); thus, it reflects the hydrogen bonding of water. On the other hand, the transition from 1b to 3s (Rydberg) is the transition to the Rydberg series, named as molecular orbital (MO) Rydbergization. The Rydberg states have very large sizes of electron orbitals, which are much larger than those of the corresponding ground state. Therefore, the Rydberg states in condensed phases receive the effects of surrounding molecules. A higher energy shift observed for matrix-isolated water with a decrease in the size of the matrix constituents provided an evidence of Rydberization.32 It is noted that the excited states of valence and Rydberg orbitals are complementary by the OH distances. The Rydberg character of the external molecular orbital becomes dominant as the OH distance becomes shorter (i.e., in the condensed phase).
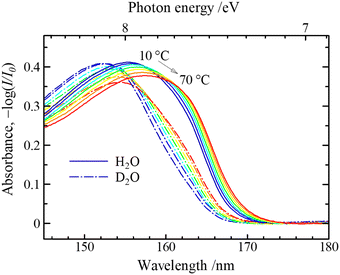 | ||
| Fig. 10 ATR-FUV spectra of H2O and D2O at different temperatures. Reproduced from ref. 31 with permission from [AIP Publisher], copyright [2007]. | ||
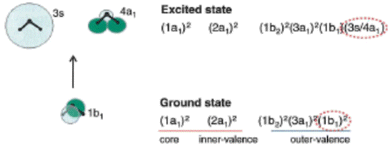 | ||
| Fig. 11 Molecular orbitals of water molecules in the ground state and the first excited states. Reproduced from ref. 1 with permission from [Springer], copyright [2015]. | ||
It can be understood from the peak shifts of the à ← ![[X with combining tilde]](https://www.rsc.org/images/entities/char_0058_0303.gif) band due to phase variations of water that the first electronic transition of water varies with hydrogen bonding and molecular density. The gas, liquid, and solid states of water give the band at 168, 148–150, and 144 nm, respectively. The band shifts to a shorter wavelength region with the increase in the hydrogen bonding. The hydrogen bonding of water changes with temperature, pH, and hydration; thus, the à ←
band due to phase variations of water that the first electronic transition of water varies with hydrogen bonding and molecular density. The gas, liquid, and solid states of water give the band at 168, 148–150, and 144 nm, respectively. The band shifts to a shorter wavelength region with the increase in the hydrogen bonding. The hydrogen bonding of water changes with temperature, pH, and hydration; thus, the à ← ![[X with combining tilde]](https://www.rsc.org/images/entities/char_0058_0303.gif) band is useful in investigating the hydrogen bonding and hydration of water. However, the à ←
band is useful in investigating the hydrogen bonding and hydration of water. However, the à ← ![[X with combining tilde]](https://www.rsc.org/images/entities/char_0058_0303.gif) band is so intense that it was very difficult to observe its band maxima of liquid water and aqueous solutions until we recently developed an ATR-FUV spectrometer.
band is so intense that it was very difficult to observe its band maxima of liquid water and aqueous solutions until we recently developed an ATR-FUV spectrometer.
7.2. ATR-FUV-DUV investigation of the electronic properties of small cation clusters in aqueous solution
The study of hydrated cations provides insight into the interactions between water and ions in solution. Hydration is a fundamental process that affects the physical and chemical properties of water, including its structure, dynamics, and reactivity. The first electronic transition energies of water hydrating group I, II, and XIII cation nitrate electrolyte aqueous solutions are linearly dependent on the hydration energies of the cations.35 Deviations have been observed only for electrolyte solutions of small cations, i.e., H+, Be2+, (deviation toward lower), and Li+ (deviation toward higher transitions energy), as hard cations disrupt hydrogen-bonding network in water.90–92 As demonstrated in Fig. 12, the à ←![[X with combining tilde]](https://www.rsc.org/images/entities/char_0058_0303.gif) energies that are located in the FUV region are noticeably impacted by the electrostatic interaction between the cations and the nonbonding electrons of the water molecule's oxygen atom.35 Therefore, ATR-FUV-DUV spectroscopy offers unique potential to deliver essential insights into structural and electronic properties of water and aqueous solution.36
energies that are located in the FUV region are noticeably impacted by the electrostatic interaction between the cations and the nonbonding electrons of the water molecule's oxygen atom.35 Therefore, ATR-FUV-DUV spectroscopy offers unique potential to deliver essential insights into structural and electronic properties of water and aqueous solution.36
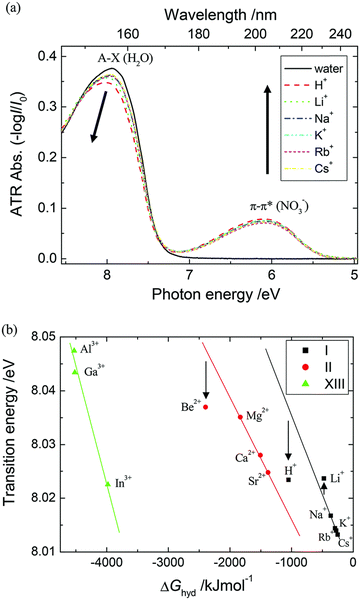 | ||
Fig. 12 (a) ATR spectra of neat water and nitrate aqueous solutions of an alkali metal (1 M) in the FUV region. (b) The energies of à ← ![[X with combining tilde]](https://www.rsc.org/images/entities/char_0058_0303.gif) transitions of nitrate aqueous solutions of groups I, II, and XIII cations against the hydration energies (ΔGhyd) of these cations. Reproduced from ref. 35 with permission from [The Royal Society of Chemistry], copyright [2015]. transitions of nitrate aqueous solutions of groups I, II, and XIII cations against the hydration energies (ΔGhyd) of these cations. Reproduced from ref. 35 with permission from [The Royal Society of Chemistry], copyright [2015]. | ||
Goto et al. studied the electronic transitions of group I cation-water clusters with the aim to explore the impact of cation size on the electronic states of first and second shell water molecules surrounding the cations (M+(H2O)6, M+: H+, Li+, Na+, and K+).58 The electronic states of hydrating water molecules in each shell are influenced by condensed hydration structures. To gain deeper insights into the effects of cation size on the à ← ![[X with combining tilde]](https://www.rsc.org/images/entities/char_0058_0303.gif) transitions, quantum chemical calculations of the hydrated cations were performed for the clusters M+(H2O)6, M+: H+, Li+, Na+, and K+, in which the first shell was composed of two water molecules and the second shell consisted of four water molecules. The study relied on the quantum chemical calculations to provide the physical insights into the investigated phenomena. The ground state molecular geometries of M+(H2O)6 clusters (M+: H+, Li+, Na+, and K+) were determined through the energy minimization using DFT-M062X/6-311++G(d,p) and CCSD/6-311++G(d,p) methods, applied for all the M+ clusters and H+ and Li+ clusters, respectively. Natural population analysis (NPA) was used to determine the formal charge of each atom. The vertical excitation energies of the clusters were calculated using EOM-CCSD with subsequent natural transition orbitals (NTO) analysis of each transition based on TD-DFT calculations using the M06HF functional.
transitions, quantum chemical calculations of the hydrated cations were performed for the clusters M+(H2O)6, M+: H+, Li+, Na+, and K+, in which the first shell was composed of two water molecules and the second shell consisted of four water molecules. The study relied on the quantum chemical calculations to provide the physical insights into the investigated phenomena. The ground state molecular geometries of M+(H2O)6 clusters (M+: H+, Li+, Na+, and K+) were determined through the energy minimization using DFT-M062X/6-311++G(d,p) and CCSD/6-311++G(d,p) methods, applied for all the M+ clusters and H+ and Li+ clusters, respectively. Natural population analysis (NPA) was used to determine the formal charge of each atom. The vertical excitation energies of the clusters were calculated using EOM-CCSD with subsequent natural transition orbitals (NTO) analysis of each transition based on TD-DFT calculations using the M06HF functional.
The calculated NTOs for each cluster provided insights into the electron density distributions of the ground and excited states of the à ← ![[X with combining tilde]](https://www.rsc.org/images/entities/char_0058_0303.gif) transition. The NTOs of the ground state revealed that à ←
transition. The NTOs of the ground state revealed that à ← ![[X with combining tilde]](https://www.rsc.org/images/entities/char_0058_0303.gif) transitions in all clusters are predominantly triggered by the excitation of nonbonding 1b1 electrons localized on the oxygen atoms of water molecule. For H+(H2O)6, the non-centrosymmetric geometry with δ ≠ 0 Å induces asymmetrical NTO shapes of the first and second shell water molecules, which are mainly composed of the 1b1 orbital of one of the water molecules (Fig. 13). In the course of the à ←
transitions in all clusters are predominantly triggered by the excitation of nonbonding 1b1 electrons localized on the oxygen atoms of water molecule. For H+(H2O)6, the non-centrosymmetric geometry with δ ≠ 0 Å induces asymmetrical NTO shapes of the first and second shell water molecules, which are mainly composed of the 1b1 orbital of one of the water molecules (Fig. 13). In the course of the à ← ![[X with combining tilde]](https://www.rsc.org/images/entities/char_0058_0303.gif) transitions of the first shell water molecules, the excited electrons occupy the σ* orbitals of the M+O bonds, which are centered around the central cations, indicating the occurrence of CT transitions (Fig. 13 (top)). Conversely, in the excited second hydration shell, the electrons occupy the σ* orbitals of the OH bonds, which corresponds to the 4a1 orbital of the water monomer, as concluded in the paper discussed here.
transitions of the first shell water molecules, the excited electrons occupy the σ* orbitals of the M+O bonds, which are centered around the central cations, indicating the occurrence of CT transitions (Fig. 13 (top)). Conversely, in the excited second hydration shell, the electrons occupy the σ* orbitals of the OH bonds, which corresponds to the 4a1 orbital of the water monomer, as concluded in the paper discussed here.
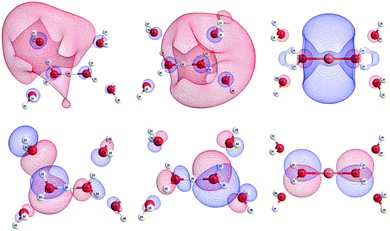 | ||
| Fig. 13 Orbitals of the first shell water molecules in ground (bottom) and excited states (top) of H+(H2O)6 (s) (left), (l) (center), and Li+(H2O)6 (right) obtained through the NTO method. Reproduced from ref. 58 with permission from [The Royal Society of Chemistry], copyright [2017]. | ||
Vertical transition energies and oscillator strengths of M+(H2O)6 clusters showed that the cation size affects the à ← ![[X with combining tilde]](https://www.rsc.org/images/entities/char_0058_0303.gif) transitions of the first shell, and this effect propagates onto water molecules in the second shell. Similar trends were concluded to exist among cations for each shell. The asymmetry of H+(H2O)6 causes à ←
transitions of the first shell, and this effect propagates onto water molecules in the second shell. Similar trends were concluded to exist among cations for each shell. The asymmetry of H+(H2O)6 causes à ← ![[X with combining tilde]](https://www.rsc.org/images/entities/char_0058_0303.gif) transition to split into two transitions for each shell, associated with the (s) and (l) sides, respectively. The DFT-optimized centrosymmetric geometry indicated that a single transition would appear in an undistorted structure. As the cation size decreases from K+ to H+, the à ←
transition to split into two transitions for each shell, associated with the (s) and (l) sides, respectively. The DFT-optimized centrosymmetric geometry indicated that a single transition would appear in an undistorted structure. As the cation size decreases from K+ to H+, the à ← ![[X with combining tilde]](https://www.rsc.org/images/entities/char_0058_0303.gif) energies of the respective clusters increase from 8.16 to 10.50 (s) and 9.55 eV (l) for water molecules in the first shell. Accordingly, the increase in the energies for the second hydration shell were determined to be 8.09 to 8.55 (s) and 8.30 eV (l). This trend is accompanied by the increase in the oscillator strengths determined for both the hydration shells that occurs from K+ to Li+. The dependencies unveiled in the EOM-CC study of à ←
energies of the respective clusters increase from 8.16 to 10.50 (s) and 9.55 eV (l) for water molecules in the first shell. Accordingly, the increase in the energies for the second hydration shell were determined to be 8.09 to 8.55 (s) and 8.30 eV (l). This trend is accompanied by the increase in the oscillator strengths determined for both the hydration shells that occurs from K+ to Li+. The dependencies unveiled in the EOM-CC study of à ← ![[X with combining tilde]](https://www.rsc.org/images/entities/char_0058_0303.gif) transition suggested that the increased orbital overlaps between cations and hydrating water molecules leads to elevated transition energies and probabilities, particularly impacting the first hydration shell in relation to the second one. Furthermore, the à ←
transition suggested that the increased orbital overlaps between cations and hydrating water molecules leads to elevated transition energies and probabilities, particularly impacting the first hydration shell in relation to the second one. Furthermore, the à ← ![[X with combining tilde]](https://www.rsc.org/images/entities/char_0058_0303.gif) energies of the water molecules in the first shell are consistently higher than those of the second shell. This was observed for each cluster, with larger dissimilarities determined for smaller cations.
energies of the water molecules in the first shell are consistently higher than those of the second shell. This was observed for each cluster, with larger dissimilarities determined for smaller cations.
Ultimately, the investigation of group I cation–water clusters (M+(H2O)6) unveiled that in small cation clusters, in particular in that of H+, the à ← ![[X with combining tilde]](https://www.rsc.org/images/entities/char_0058_0303.gif) transitions exhibit a greater degree of splitting compared to larger cation clusters. It was suggested that this could be attributed to the asymmetrical structure of H+(H2O)6 and the differences in à ←
transitions exhibit a greater degree of splitting compared to larger cation clusters. It was suggested that this could be attributed to the asymmetrical structure of H+(H2O)6 and the differences in à ← ![[X with combining tilde]](https://www.rsc.org/images/entities/char_0058_0303.gif) transitions between the shells.58 A large à ←
transitions between the shells.58 A large à ← ![[X with combining tilde]](https://www.rsc.org/images/entities/char_0058_0303.gif) band splitting between the first and second shell water molecules results from the different excited energy trends among the cation species between the shells, caused by the different excited states of each shell (Fig. 14). It was also concluded that the à ←
band splitting between the first and second shell water molecules results from the different excited energy trends among the cation species between the shells, caused by the different excited states of each shell (Fig. 14). It was also concluded that the à ← ![[X with combining tilde]](https://www.rsc.org/images/entities/char_0058_0303.gif) transition energy for each shell is further split in H+(H2O)6 due to its asymmetric hydration structure, which arises from the double well potential energy surface of proton transfer between two water molecules. These conclusions were consistent with the previous literature reports on group I electrolyte solutions and concentration dependence changes in the à ←
transition energy for each shell is further split in H+(H2O)6 due to its asymmetric hydration structure, which arises from the double well potential energy surface of proton transfer between two water molecules. These conclusions were consistent with the previous literature reports on group I electrolyte solutions and concentration dependence changes in the à ← ![[X with combining tilde]](https://www.rsc.org/images/entities/char_0058_0303.gif) bands of aqueous sulfuric acid solutions.58
bands of aqueous sulfuric acid solutions.58
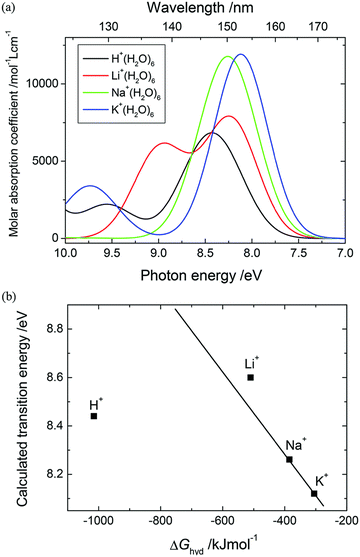 | ||
Fig. 14 (a) The vertical transition energies and oscillator strengths of the M+(H2O)6 clusters obtained using the EOM-CCSD/6-311++G(d,p) method; the band broadening with a bandwidth of 0.333 eV was applied. (b) The plot of the à ← ![[X with combining tilde]](https://www.rsc.org/images/entities/char_0058_0303.gif) transition energies of M+(H2O)6 against the free energy of hydration, (ΔGhyd) of the corresponding cation. The transition energy of Li+(H2O)6 was obtained at the midpoint of the two overlapping bands. Reproduced from ref. 58 with permission from [The Royal Society of Chemistry], copyright [2017]. transition energies of M+(H2O)6 against the free energy of hydration, (ΔGhyd) of the corresponding cation. The transition energy of Li+(H2O)6 was obtained at the midpoint of the two overlapping bands. Reproduced from ref. 58 with permission from [The Royal Society of Chemistry], copyright [2017]. | ||
The distorted and condensed hydration structure of H+(H2O)6 results in an asymmetric distribution of electronic densities in both the excited and ground states, contributing to the unique characteristics of protons in aqueous solutions. The water molecules in the first solvation shell show charge transfer transition of nonbonding electrons toward the central cations, while the water molecules in the second shell exhibit transition toward the σ* orbitals. These interpretations based on computational study provide a comprehensive explanation for the large blue-shift observed in the à ← ![[X with combining tilde]](https://www.rsc.org/images/entities/char_0058_0303.gif) band of aqueous sulfuric acid solutions that were reported earlier.58
band of aqueous sulfuric acid solutions that were reported earlier.58
7.3. Experimental verification of increased electronic excitation energy of water in hydrate-melt water by ATR-FUV spectroscopy
The utilization of highly concentrated aqueous electrolyte solutions is expected to be a highly effective approach in enhancing the safety of Li secondary batteries. This is proved through the utilization of “water-in-salt” (WIS) and “hydrate-melt” (HM) electrolytes, which exhibit a potential window of >3.0 V, making them suitable for practical applications. WIS refers to a solution with an excess concentration of salt and volume compared to those of water molecules. Suo et al. demonstrated the feasibility of achieving a potential window of 3.0 V using a WIS electrolyte consisting of lithium bis(tri-fluoromethane sulfonyl)imide (LiTFSI), thereby enabling the fabrication of batteries in the 2.3 V class.93–95 The ultra-highly concentrated aqueous solutions maintain their solution state at room temperature and possess notable physical properties, including a very low supercooling temperature of −90 °C.96 On the other hand, HM refers to an aqueous solution of alkali metal salts (bi-salt aqueous solution) at high concentrations, such as Li (TFSI)0.6(BETI)0.4·2H2O, as developed by Yamada et al.97 The expansion of the potential window was investigated, with Miyazaki et al. employing quantum chemical calculations to examine the electronic state based on the projected density of states.98 The findings reveal the coordination of Li+ that resulted in the potential energy of the LUMO of water being higher than that of the LUMO of the counteranion.98 As a consequence, the reduction of the water at the anode was impeded due to the formation of a solid electrolyte interphase (SEI) resulting from the reduction of the anions, thus leading to an expanded potential window.99 Morisawa et al. conducted a study on the electronic states of water in superconcentrated aqueous solutions, such as WIS and HM, utilizing ATR-FUV spectroscopy.100Fig. 15(a) and (b) show the ATR-FUV spectra and their second derivative spectra of pure water (represented by the broken line) and bi-salt aqueous solutions (represented by the solid lines) consisting LiTFSI and LiBETI at various ratios within the 145–180 nm range. The value of x was determined as follows.| x = MLisalts/(MLisalts + Mwater) | (8) |
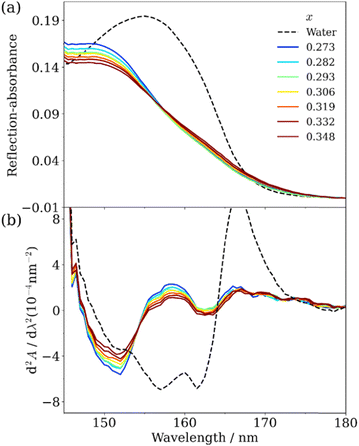 | ||
| Fig. 15 (a) ATR-FUV spectra and (b) second derivative spectra of water and aqueous (LiTFSI/LiBETI) solutions under high concentration (x = 0.273–0.348, Xsalt = 0.00–0.30). Reproduced from ref. 100 with permission from [AIP Publisher], copyright [2022]. | ||
Based on Fig. 15, the electronic states of water in the superconcentrated aqueous electrolyte solutions exhibit significant deviations from those of pure water. The second derivative spectrum of water displays three distinct peaks at about 151.7 nm, 157.4 nm, and 161.7 nm. Similarly, highly concentrated aqueous mono- and bi-salt solutions also manifest three peaks at 149.8 nm, 152.2 nm, and 162.6 nm. As mentioned in the previous section, 157 nm and 162 nm bands in the pure water can be attributed to the à ← ![[X with combining tilde]](https://www.rsc.org/images/entities/char_0058_0303.gif) transition occurring within bulk water and dangling hydrogen bond acceptor at the surface, respectively.36 Morisawa et al., in their investigation of the electronic states of the water molecules hydrated to Group I metal cations in the FUV region through quantum chemical calculations,58 examined the effects of anions, cations, and deuterium on the ATR-FUV spectra of superconcentrated aqueous mono-salt and bi-salt solutions.100 They concluded 150 and 152 nm peak in superconcentrated aqueous salt solutions is assigned to the à ←
transition occurring within bulk water and dangling hydrogen bond acceptor at the surface, respectively.36 Morisawa et al., in their investigation of the electronic states of the water molecules hydrated to Group I metal cations in the FUV region through quantum chemical calculations,58 examined the effects of anions, cations, and deuterium on the ATR-FUV spectra of superconcentrated aqueous mono-salt and bi-salt solutions.100 They concluded 150 and 152 nm peak in superconcentrated aqueous salt solutions is assigned to the à ← ![[X with combining tilde]](https://www.rsc.org/images/entities/char_0058_0303.gif) transition of water molecules involved in the first and the second hydration cells of the central Li ion, respectively.100 The findings suggest that the transition energy of water molecules in highly concentrated aqueous electrolytes containing HM and WIS is augmented by approximately 0.4 eV (equivalent to an energy shift of over 10 nm) in comparison to typical aqueous electrolytes with a standard water concentration.100
transition of water molecules involved in the first and the second hydration cells of the central Li ion, respectively.100 The findings suggest that the transition energy of water molecules in highly concentrated aqueous electrolytes containing HM and WIS is augmented by approximately 0.4 eV (equivalent to an energy shift of over 10 nm) in comparison to typical aqueous electrolytes with a standard water concentration.100
8. Exploration of the electronic structure of ultrathin materials surface using ATR-FUV spectroscopy
8.1. Electronic states of the surface and bulk region of polyethylene with varied crystallinities in the FUV wavelength region.
Prior to the development of ATR-FUV spectroscopy, the spectroscopic examination of polyethylene (PEs) in the FUV region were conducted using transmission measurements for thin films. For instance, Hashimoto et al. conducted a comprehensive review of the transmission spectrum of low-density PE (LDPE) in the 100–200 nm region in 1982 and obtained a range of diverse FUV spectra of LDPE films that prove to be challenging to reproduce.101 In their finding, they observed an absorption band near 140 nm, tentatively ascribed to the σ–σ* transition. They also noted the occasional presence of a shoulder band at about 180–200 nm in the LDPE films, which they attributed to the π–π* transitions of the double bonds in the nonpolymerized section of the polymer film. Sato et al. measured the transmission spectrum of commercial polymer wrap films composed of high-density polyethylene (HDPE), linear low-density PE (LLDPE), and LDPE.102 Regarding the shoulder band, they concluded that the band at 185 nm was a result of the branches of the PE polymer within the film as it was solely observed in the spectra of LLDPE and LDPE. As mentioned in the Section 6.1, Morisawa et al. demonstrated that the absorption bands of n-alkanes can be attributed to the σ-Rydberg 3p transition by comparing them with the outcomes of quantum chemical calculations.81,82 Based on the collective findings of these studies, it can be inferred that the Rydberg transitions from the σ orbital in saturated carbon chains should be observed in solid polyethylene. Additionally, the electronic structure of the surface of polyethylene with varying degrees of crystallinity was investigated using ATR-FUV spectroscopy and quantum chemical calculations. The ATR-FUV spectra measured for the surface of thick films consists of five types of HDPE, six types of LLDPE, and seven types of LDPE, as depicted in Fig. 16.103 All of these spectra exhibited a prominent band peaked at 156 nm resembling the spectra observed in liquid and solid alkanes. The peak wavelength is close to that of the corresponding band found in solid alkanes of CnH2n+2, where n = 30–36.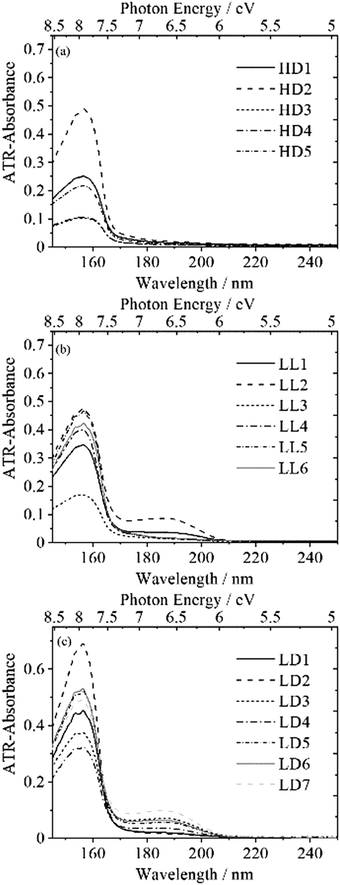 | ||
| Fig. 16 ATR-FUV-DUV spectra of (a) five types of HDPEs, (b) six types of LLDPEs, and (c) seven types of LDPEs. Reproduced from ref. 103 with permission from [Sage], copyright [2021]. | ||
In addition to the 156 nm band, all PEs yield a broad feature near 180–190 nm. In the transmission spectra in the region of 165–250 nm of thin polymer films (30 μm), HDPEs show a very weak feature, LLDPEs give a weak-to-medium band, and LDPEs depict a clear medium band near 180–190 nm, as shown in Fig. 17.103 The absorbance at 188 nm in the transmission spectra decreases with the increase in the crystallinity as seen in Fig. 18, indicating that the 188 nm band is concerned with amorphous parts of PEs.103
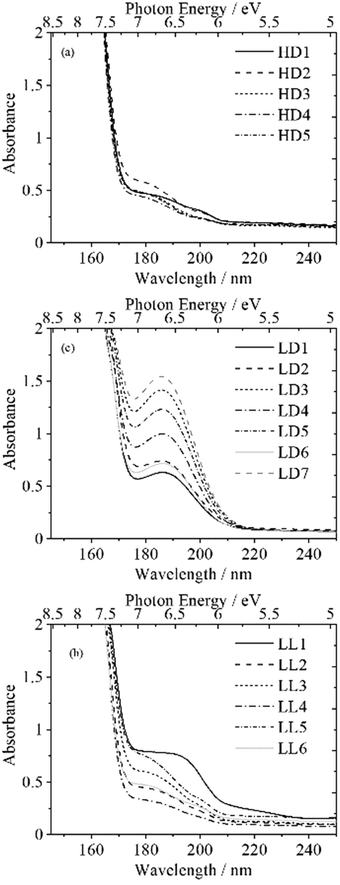 | ||
| Fig. 17 FUV-DUV transmittance spectra in the 165–250 nm of thin HDPEs, LLDPEs, and LDPEs. Reproduced from ref. 103 with permission from [Sage], copyright [2021]. | ||
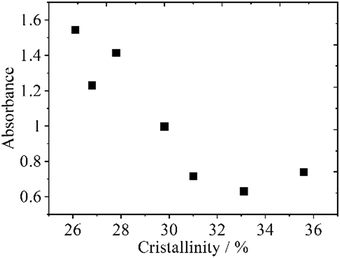 | ||
| Fig. 18 The absorbance of the 188 nm band of LLDPEs versus its crystallinity. Reproduced from ref. 103 with permission from [Sage], copyright [2021]. | ||
To interpret the variations of absorption spectra among HDPEs, LLDPEs, and LDPEs, quantum chemical calculations of the ATR-FUV spectra of PEs were performed with TD-CAM-B3LYP using n-pentane as a model compound. The results indicate that the prominent band at 156 nm can be attributed to the transition from σ(C–H) to Rydberg 3s and 3p.103 To disclose the origin of the 180–200 nm feature, we performed calculation on the spectrum of an n-pentane dimer while varying the distance between the two n-pentane molecules. As the distance decreased from 6 to 3 Å, the intensity of the prominent band diminished, and a new band emerged at a longer wavelength, as depicted in Fig. 19a.103 Additionally, the FUV simulation spectra of n-pentane dimers, trimers, and tetramers were calculated with a fixed distance of 3 Å between the molecules, as depicted in Fig. 19b.103 Remarkably, the intense peak at about 130 nm exhibited a shift toward higher energy as the number of molecules increase. Conversely, the band observed at 150 nm (at lower energies) displayed a shift toward the lower-energy side. Based on these results, the authors conclude that the spectral changes in the 180–200 nm region of LLDPE and LDPE originate from the fact that in the amorphous region, the distances between the molecular chains become partially shorter.
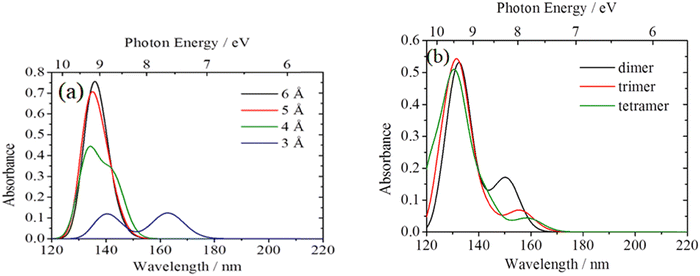 | ||
| Fig. 19 ATR-FUV simulation spectra employing TD-CAM-B3LYP with the basis function of aug-cc-pVDZ (C, N, and O) and cc-pVDZ (H). (a) FUV simulation spectra of n-pentane dimers were acquired by modulating the distance between two n-pentane molecules from 6 Å to 3 Å. (b) FUV simulation spectra of n-pentane dimers, trimers, and tetramers were calculated with a fixed distance of 3 Å between the molecules. Reproduced from ref. 103 with permission from [Sage], copyright [2021]. | ||
8.2. Electronic properties of graphene particles and polymer-graphene nanocomposites in the FUV and DUV region
The exceptional characteristics of graphene capture significant interest.104–106 The examination of electronic and structural properties of graphene nanostructures, as well as their composites with polymers, has formed a remarkable breakthrough enabled by ATR-FUV-DUV spectroscopy.71,107 In particular, the investigation of the FUV-DUV spectra of graphene nanoparticles delivered a novel perspective on the high-energy electronic transitions of carbon nanostructures,107 complementing and extending beyond the previously available knowledge on graphite spectra in the high-energy region.108Graphene-based nanostructures, including flakes and platelets, offer an economical substrate for the production of nanocomposites with polymers, enhancing their material properties.71,109 However, conventional electronic absorption spectroscopy is severely limited when examining such samples.107 Little was known on the high-energy electronic transitions of graphene nanostructures, particularly in the FUV-DUV region, and scarce data about their absorption in wavelengths below 200 nm (above 6.2 eV) was prior available. The study of graphene nanoflakes (with a surface area of 300 m2 g−1) and nanoplatelets (6–8 nm thick, 5 μm wide) by ATR-FUV-DUV spectroscopy revealed a previously unknown FUV peak of low intensity at approximately 165 nm (7.5 eV), in addition to the strong FUV band at about 265 nm (4.65 eV) that was already well-known. The spectra can be classified into three main areas of significance: (1) the primary peak at 4.5–5 eV, (2) the region of photon energies lower than those corresponding to the primary peak (i.e., longer wavelength region), and (3) the region of photon energies higher than those corresponding to the primary peak (i.e., shorter wavelength region). The primary peak is presumed to be similar to the Fresnel peak, which is frequently observed in various studies of nanocarbon structures.108,110,111 The examination of these experimental spectra with aid from quantum chemical calculations study also revealed a dependence of the 165 nm peak on the graphene morphology.107 The presence of the DUV peak in the spectra of graphene and other nanocarbon structures has been previously documented, but its reported position has varied widely, ranging from 227–260 nm (4.65–5.46 eV).112,113 The debate surrounding the case of graphite highlights the need for continued experimental and computational investigations into the specifics of FUV-DUV absorption characteristics in carbon nanostructures.108
Despite the reasonable accuracy and wide applicability of the TD-DFT approach, it faces practical limitations in the case of large π-conjugated systems such as carbon nanostructures, where a considerable number of states are required to capture high-energy vertical transitions responsible for absorption bands in the FUV-DUV region. However, wavefunction-based semi-empirical approaches such as ZINDO/s approach have been proven to be highly efficient and accurate in the treatment of excited states of π-conjugated systems including graphene.114–116
ZINDO/s approach was also applied for the purpose of ATR-FUV-DUV study of carbon nanostructures, with additional evaluation of its reliability compared with TD-FT calculations performed on a limited scale, for selected models that captured all significant structural features that were meaningful for the examined systems.107 A comparison with TD-DFT was conducted for smaller models representing key structural features of graphene nanoflakes, and both methods produced comparable theoretical FUV-DUV spectra, as shown in Fig. 20.107
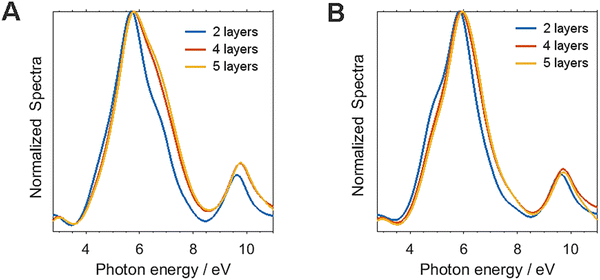 | ||
| Fig. 20 Comparison of ZINDO/s spectra with different number of layers. (A) Spectra of models featuring AA stacking; model I (2 layers), model V (4 layers), and model VII (5 layers). (B) Spectra of models featuring AB stacking; model II (2 layers), model VI (4 layers), and model VIII (5 layers). Adapted with permission from ref. 107. Copyright (2018) American Chemical Society. | ||
In the reviewed study, the ZINDO/s method was used to obtain relative excitation energies, which were in good agreement with the observed peaks in the experimental spectra, with additional linear scaling of the calculated vertical excitation energies54,107 In the case of ATR-FUV-DUV study of graphene nanostructures, wavelength scaling yielded a remarkably good agreement with experimental data, as demonstrated in Fig. 21. ZINDO/s was therefore found to be a reliable method for approximating electronic transitions in graphene flakes, enabling the analysis of their FUV-DUV spectra and correlations with their morphological features.107 The study suggested that the involvement of excited states, where the electronic distribution is uniformly dispersed across atomic centers, is greater for the FUV band, as seen in Fig. 22.
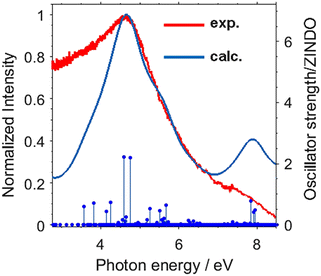 | ||
| Fig. 21 Comparison between the experimental ATR-FUV-DUV spectrum of graphene nanoflakes and ZINDO/s spectrum calculated for model I. The photon energy axis in the calculated spectrum was scaled by a factor of 0.819. Adapted with permission from ref. 107. Copyright (2018) American Chemical Society. | ||
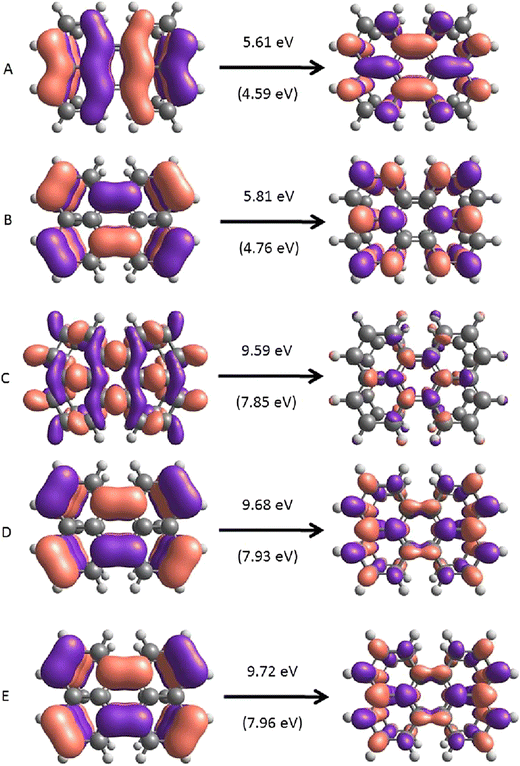 | ||
| Fig. 22 The most relevant initial and final states of model I for the transitions with the five highest oscillator strengths (A–E) as determined using ZINDO/s calculations, presented along with their corresponding transition energies following linear scaling. Scaled transition energies are enclosed in brackets. Adapted with permission from ref. 107. Copyright (2018) American Chemical Society. | ||
The potential of graphene–polymer nanocomposites has attracted widespread interest in recent years.117–119 In particular, the FUV region, which contains electronic bands corresponding to Rydberg orbitals, has shown high sensitivity to the polymer structure. This makes ATR-FUV-DUV spectroscopy a uniquely powerful technique for the investigation of the above-mentioned properties. Recently, Beć et al.71 investigated the high-energy electronic transitions and structural information of poly(3-hydroxybutyrate) (PHB) and graphene nanoflakes in a nanocomposite using ATR-FUV-DUV spectroscopy. Samples with varying graphene content (0.5, 1, 5, and 10 wt%) and pure PHB were studied, with the spectra of the nanocomposites dominated by strong polymer bands and a weak FUV peak observed for pure graphene nanoflakes (Fig. 23). In the DUV region beyond approximately 240 nm, an increased ATR absorption was observed for the nanocomposites where one would expect a DUV peak of graphene nanoflakes. However, it was observed that the intense FUV bands of PHB were more indicative for determining the variations in the electronic transitions and structural features of the polymer in the nanocomposites. Therefore, the study by Beć et al.71 focused on interpreting the 145–180 nm region of PHB, where convoluted, intense bands of PHB with a maximum peak at 171 nm (7.25 eV) were observed. The comparison of the spectra of PHB in its pure form and in the nanocomposite revealed that the dominant FUV peak exhibited a consistent spectral shift toward longer wavelengths (ca. 171 nm) as the concentration of graphene increased. This trend was accompanied by a notable decrease in peak intensity, reaching a shift of 2.2 nm for the sample containing 10 wt% graphene.
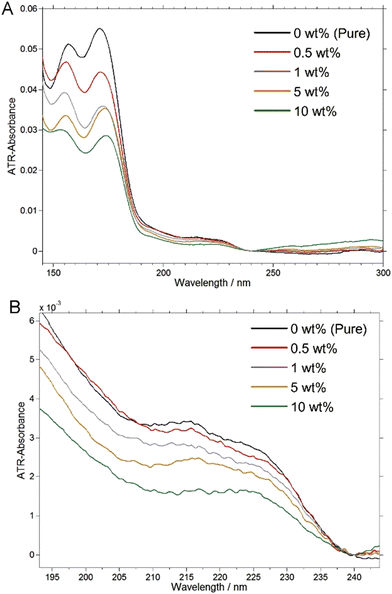 | ||
| Fig. 23 The experimental ATR-FUV-DUV spectra of PHB and PHB-graphene nanocomposites (A: 145–300 nm region; B: the same spectra with focus on the 190–250 nm region). The spectra were smoothed (Savitzky–Golay algorithm, 151 data-points/0.01 nm), and vertical offset at 240 nm was applied. Reproduced from ref. 71 with permission from [The Royal Society of Chemistry], copyright [2018]. | ||
In this study, the interpretation of the ATR-FUV-DUV spectra and important conclusions have been enabled by a quantum chemical study as well. PHB has a semi-crystalline structure dominated by crystalline domains. To conduct TD-DFT calculations of the electronic transitions, a systematic investigation of the model size of the polymer chain was performed. The structural motif was extracted from the structure of the polymer known from X-ray diffraction studies; models reaching 12 polymer units in four parallel chains were compared (Fig. 24). It was also revealed that a Rydberg transition of PHB at 162 nm has a meaningful contribution to the spectral intensity in the FUV region. Therefore, the local structural characteristics of the PHB molecule are the main determinant of its FUV-DUV spectra, and a simple model was adequate for the further stages of the reviewed study. This yielded important insights into the locality of Rydberg states in polymers. Systematic calculation of the structure–energy relationship by means of a relaxed scan was carried out, followed by the calculations of electronic transition using TD-DFT (CAM-B3LYP/aug-cc-pVDZ). As the starting point for this procedure crystalline PHB structure was served, while the energetically favored relaxed geometry was subsequently optimized at a higher-level method (B3LYP/cc-pVTZ) for further study (Fig. 25). Despite the change of the calculated FUV-DUV spectral line shape, the Rydberg transitions of PHB were unveiled to remain an important contribution to the spectral intensity in the FUV region. However, a blueshift of the transition energy to 152 nm was indicated (Fig. 25). The ATR-FUV-DUV spectra of PHB and its nanocomposites were analyzed to determine their correlation with the crystallinity of the polymer.71 The findings revealed that the electronic transitions are highly influenced by the molecular structure of PHB. The crystal structure of PHB has higher strain than its relaxed structure due to the unfolding of the helix, leading to a widened energy gap between the ground state and the Rydberg state. Consequently, a blueshift of the FUV band of the disordered PHB is observed. However, in the nanocomposite, the change in the local conformation of the polymer caused by the presence of graphene results in an increased strain around the ester fragment in the helix of the crystalline PHB. This leads to an enhancement of the local “crystallinity” of the polymer, which is greatly affects the Rydberg transitions.
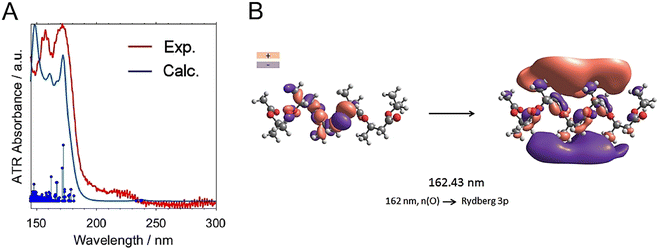 | ||
| Fig. 24 (A) Calculated (TD-CAM-B3LYP/aug-cc-pVDZ) FUV-DUV spectrum of crystalline PHB based on a 6-unit single chain model compared with the experimental spectrum of PHB. (B) The most relevant MOs for the major FUV transition of crystalline PHB, which is Rydberg transition. Reproduced from ref. 71 with permission from [The Royal Society of Chemistry], copyright [2018]. | ||
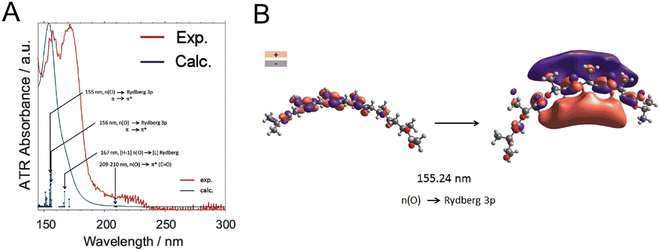 | ||
| Fig. 25 (A) Calculated TD-CAM-B3LYP/aug-cc-pVDZ (after B3LYP/6-31G(d,p) scan and B3LYP/cc-pVTZ re-optimization) FUV-DUV spectrum of the relaxed helix model of PHB. (B) Most relevant MOs for the major FUV transition of amorphous PHB (TD-CAM-B3LYP/aug-cc-pVDZ). Reproduced from ref. 71 with permission from [The Royal Society of Chemistry], copyright [2018]. | ||
9. Solvation structures of ionic liquids with metal ions; combination of ATR-FUV spectroscopy, quantum chemical calculation, molecular dynamic simulation, and multivariate curve resolution-alternating least squares (MCR-ALS)
Ionic liquids (ILs) are composed of cations and anions, and they are expected as new electrolytes used in a Li-ion battery instead of conventional organic solvents.120,121 In order to comprehend the fundamental electrochemical reaction mechanism of Li-ion batteries based on ionic liquids (ILs), it is crucial to investigate the interaction between Li+ ions and the surrounding IL molecules, particularly the anion molecules. The coordination number of anions (CN) has been investigated by Raman spectroscopy.122–124 For example, several studies revealed that bis(trifluoromethanesulfonyl)imide ([TFSI]−) interacted with Li+ at its oxygen atoms.122–124 Density functional theory (DFT)125–127 and molecular dynamics (MD)128–130 were used to investigate the molecular models.Electronic information of ILs with Li+ is also important because chemical reactions occur due to the changing electronic state in molecules. However, it has not been revealed how Li+ influences the electronic states of surrounding anions. Electronic absorption spectroscopy is a powerful method to elucidate electronic structures of target samples. Using ultraviolet-visible (UV-vis) spectroscopy for ILs, inner electronic transitions131 and charge transfers (CT) from anions to cations132–134 were measured in the wavelength region longer than 200 nm. Recently, ATR-FUV-DUV spectroscopic study has been used to investigate the electronic absorption spectra of various ILs.28,84,135 Additionally, ATR-FUV-DUV spectroscopic measurements for 1-butyl-3-methylpyridinium dicyanamide ([BMP][DCA]) with Li+ (Li[TFSI]) electrolyte have revealed their electronic structures around Li+, as described below.136
Fig. 26(a) shows the ATR-FUV-DUV spectra in the 180–300 nm region of pure [BMP][DCA] (the black line) and Li–IL under various ionic concentrations of Li[TFSI].136 The absorption spectrum of pure [BMP][DCA] exhibits a weak band ∼220 nm band (band I) and a strong band at ∼199 nm (band II). TD-DFT calculations have indicated that these bands arise from intramolecular π → Rydberg transitions in [DCA]−, with no significant contribution from [BMP]+ to the absorbance. Hence, the recorded absorption spectra mainly originate from pure [DCA]− and [DCA]− solvated around Li+. Fig. 26(b) illustrates the relationship between the peak position of the band II and the concentration of Li+. Notably, as the Li+ concentration increases, the position gradually shifts toward shorter wavelengths (higher energy), transitioning from 199.3 nm to 198.6 nm.136 It should be emphasized that acquiring quantitative spectra below 200 nm using conventional UV-vis spectroscopy poses significant challenges.
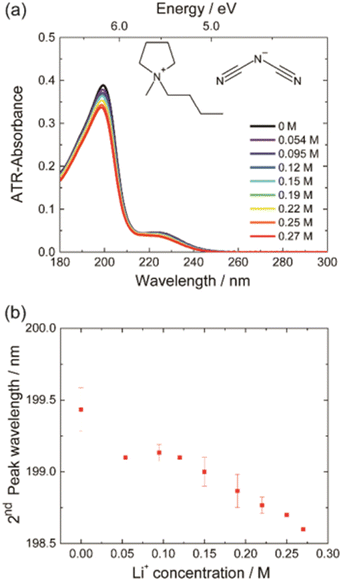 | ||
| Fig. 26 (a) The absorption spectra in the 180–300 nm region obtained via ATR-FUV-DUV spectroscopy are shown for pure [BMP][DCA] (black line) and Li–IL under various ionic concentrations of Li[TFSI] (colored lines). The chemical structures of [BMP]+ and [DCA]− are depicted in the figure. Each spectrum was measured three times and averaged. (b) The peak wavelengths of band II (denoted 2nd in the original figure reproduced here) are plotted against Li+ concentration. Statistical analyses were performed using the band II peak wavelength from three absorption spectra obtained under each ionic concentration. Reproduced from ref. 136 with permission from [The Royal Society of Chemistry], copyright [2020]. | ||
In order to elucidate the origin of the shift, solvated electronic states of Li[DCA] were analyzed by TD-DFT calculations. In Fig. 27(a), similar to the experimental results, Li[DCA] has a large oscillation strength at 185.6 nm, which is shorter than that of [DCA]− (189.3 nm).136 Their electronic transitions were attributed to molecular orbitals summarized in Fig. 27(b). Both initial (ground) states have electrons localized on the π orbital of [DCA]− (HOMO). In the final excited states of Li[DCA] (LUMO+7), a significant portion of electrons is distributed in the combination of Li+ orbitals corresponding to the Rydberg 4p and 5p states. This final electronic state differs from that of [DCA]−, which involves a combination of Rydberg C 4p, N 4p, and N 5p states. It is reasonable to assume that the disparity in the final electronic state distribution on Li+ accounts for the observed spectral shift.
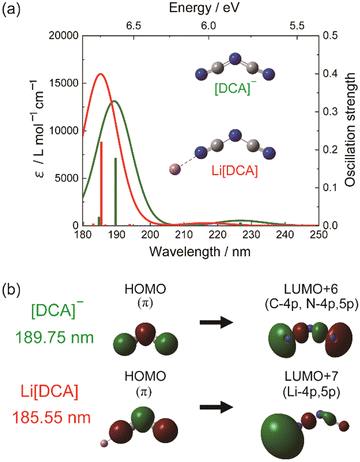 | ||
| Fig. 27 (a) Oscillation strengths and molar extinction coefficients (ε) of [DCA]− (green lines) and Li[DCA] (red lines) calculated using TD-DFT calculations. (b) Primary initial and final molecular orbitals involved in the electronic transition of [DCA]− at 189.75 nm and that of Li[DCA] at 185.55 nm. Reproduced from ref. 136 with permission from [The Royal Society of Chemistry], copyright [2020]. | ||
Subsequently, the acquired spectra were subjected to multivariate curve resolution-alternating least squares (MCR-ALS) analysis, allowing for the decomposition of the spectra into two distinct types of [DCA]− species at the electronic state level: pure [BMP][DCA] and [DCA]− influenced by Li+. The number of [DCA]−, whose electronic states were affected by a solvated Li+, is defined as the electronic coordination number (ECN). A matrix of the obtained absorption spectra A with the size of 8 (types of concentration of Li+ except 0 M) × 701 (the data number of absorption) was separated into two distinct spectra corresponding to [DCA]− in the absence and presence of Li+ at the electronic state level using the following process. Assuming a test value or test parameter of ECN (x), AxIL and ΔAx(:=A − AxIL) were determined using the approach described in the Supporting information. ΔAx was separated into 2 components (α and β) by MCR-ALS calculation as follows.
| ΔAx = CxαSxTα + Nx(Nx:= CxβSxTβ) | (9) |
| A = AxIL + CxαSxTα + Nx | (10) |
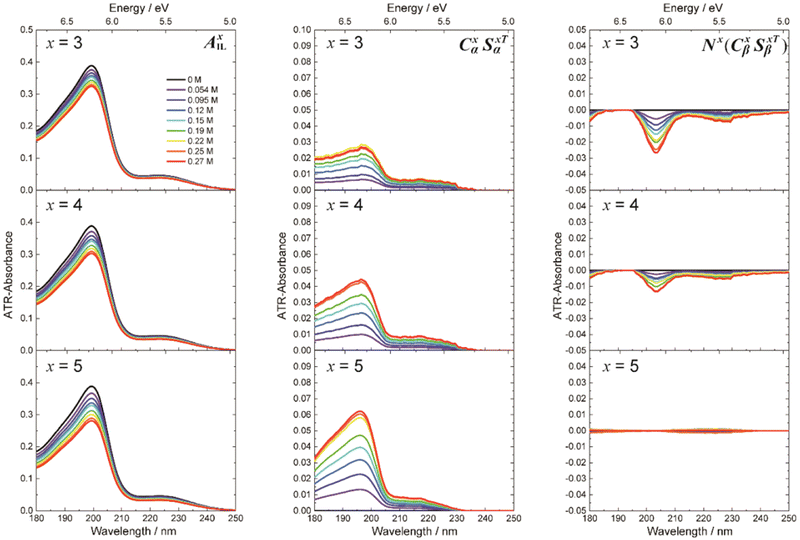 | ||
| Fig. 28 Decomposed AxIL, CxαSxTα, and Nx(CxβSxTβ) in the cases of x = 3, 4, and 5. Reproduced from ref. 136 with permission from [The Royal Society of Chemistry], copyright [2020]. | ||
On the other hand, Huang et al. reported that the CN of [DCA]− around a Li+ was 3–4,124 which is not equal to ECN. In order to discuss the relationships between the solvation structure and ECN obtained by MCR-ALS calculations, TD-DFT calculations were performed. The intermolecular distances between Li+ and the nearest terminal nitrogen (NZ) atom of [DCA]− were precisely manipulated, enabling control over the molecular orbitals associated with the electronic transitions of the original Li[DCA] structure (Fig. 29).136 This suggests that the molecular orbital shapes of [DCA]− in the final states are influenced by Li+ within a radius of approximately 7 Å, indicating that the cutoff radius of the ECN can be estimated to be about 7 Å. Additionally, MD simulation showed that there were 5.24 [DCA]− whose NZ atoms are within 7.00 Å from Li+ (Fig. 30), which corresponded to the obtained ECN. Comparing CN and ECN obtained by our MD simulation, it can be hypothesized that one [DCA]− is out of the 1st layer but changes its electronic states from those in pure [BMP][DCA].
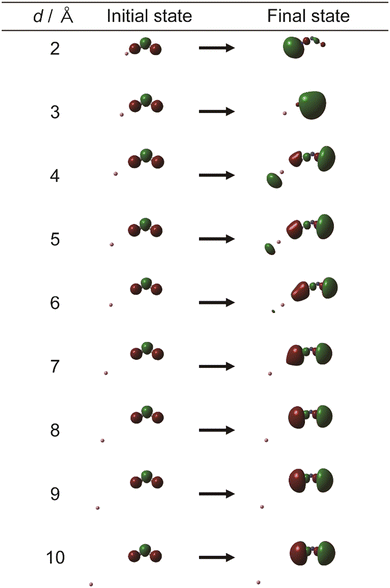 | ||
| Fig. 29 Results of TD-DFT calculations changing the intermolecular distance (d/Å) between Li+ and nearest nitrogen atom of [DCA]−. The intermolecular distances between a Li+ and its nearest terminal nitrogen atom of [DCA]− were changed from 2 to 10 Å along the N–CN of [DCA]− bond with 1 Å step while keeping other geometries of Li[DCA] shown in Fig. 27(a). Compared with the original initial and final molecular orbital in Fig. 27(a), that of the corresponding largest electronic transitions was extracted. Reproduced from ref. 136 with permission from [The Royal Society of Chemistry], copyright [2020]. | ||
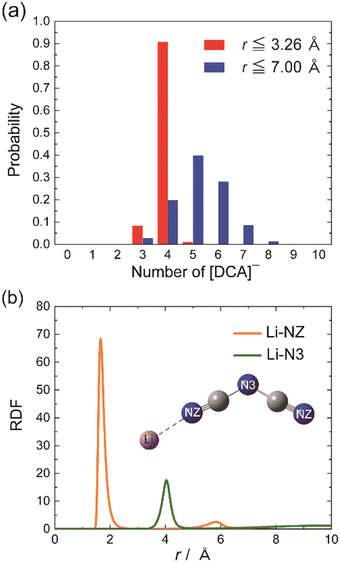 | ||
| Fig. 30 (a) Probability of the number of [DCA]− in MD calculation for 10 ns, whose NZ atoms are within 3.26 Å (cutoff radii of CN) and within 7.00 Å from Li+ (the cutoff radii of ECN). (b) Radial distributional functions (RDFs) between Li–NZ (terminal nitrogen atoms, orange line) and Li–N3 (center nitrogen atoms, green line). Reproduced from ref. 136 with permission from [The Royal Society of Chemistry], copyright [2020]. | ||
In summary, the electronic structure of [DCA]− around Li+ and the value of ECN were revealed by the combination of ATR-FUV-DUV spectroscopy, TD-DFT calculation, and multivariate analysis (MCR-ALS). This is the first work combining ATR-FUV-DUV spectroscopy with MCR-ALS calculation.136 Using the MCR-ALS algorithm, the obtained absorption spectra were successfully decomposed into that of pure [BMP][DCA] and that of [DCA]− affected by Li+, and we concluded that ECN is 5. This value is larger than that of CN (∼4), which is estimated by past Raman measurements and MD simulations.124 With the help of MD simulations, a schematic solvating structure, which can explain the electronic states of [DCA]− around Li+, is established. The quantitative investigation of perturbations, such as the addition of Li in the current study, in the FUV-DUV region can be challenging due to the presence of overlapping absorption bands. However, employing a combination of MCR-ALS calculation and MD simulation to analyze the ATR-FUV-DUV spectra, it was possible to successfully determine the value of ECN. This approach allowed for a more in-depth understanding of the effects of perturbations on the system under study. The experimental method combining ATR-FUV-DUV spectroscopy and MCR-ALS calculation has potentials to apply to the quantitative analysis of various mixtures materials in terms of electronic structures, such as other liquid electrolytes and solid compounds.
10. ATR-FUV-UV-vis spectroscopy focusing on ionic liquid/organic semiconductor interface during transistor operations
Organic field-effect transistors (OFETs) attract much attention due to their attractive properties such as light weight, flexibility, and easy processability.137–139 Electric double-layer OFETs (EDL-OFETs) have garnered significant attention due to their remarkably low operating voltage (<1 V) in comparison to conventional SiO2-gated OFETs (>10 V).140–142 This characteristic has spurred extensive research and exploration in the field. EDL-OFETs rely on the accumulation of charges in the interfacial region between the organic semiconductor and electrolyte, facilitated by a high electric field. This unique feature allows for the operation of EDL-OFETs at significantly lower voltages. Consequently, the interface between the organic semiconductor and electrolyte plays a crucial role in the performance of these devices. IL-gated EDL-OFETs were reported by Takeya's group first in 2008 using rubrene single crystals,143 and then, various organic semiconductors were applied to the IL-gated EDL-OFETs.144–146 IL species are an important factor determining the carrier mobility (μ) of devices.147,148 In EDL-OFETs, interactions between organic semiconductors and ILs are crucial issues for understanding the mechanism of high-performance EDL-OFETs. Interface sensitive spectroscopies such as second harmonic generation (SHG),149,150 sum frequency generation (SFG),151,152 and attenuated total internal reflection Fourier transform infrared (ATR-FTIR)153,154 were used for the studies of organic semiconductor/gate dielectric interfaces. These studies revealed the conformation and electronic state changes of organic semiconductors depending on applied voltages.Recently, electrochemical ATR-UV (EC-ATR-UV) spectroscopy was developed28 and used for the investigations of the organic semiconductor/ILs interface of the EDL-OFET.33 A p-type organic semiconductor (3,11-dinonyldinaphtho[2,3-d:2′,3′-d′]benzo[1,2-b:4,5-b′]dithiophene; C9-DNBDT-NW) film was fabricated on ATR sapphire prisms. The single-crystal like thin films with inch scale can be made by a simple printing technique described in ref. 155 and 156. Subsequently, gold (Au) films were evaporated on the organic films as the source and drain electrodes (counter and reference (gate) electrodes), in the form of a Pt coil and Pt wire, respectively, were immersed in ILs and placed on the pre-coated organic film. The electrodes were then connected to a bipotentiostat. The structural formula of C9-DNBDT-NW and the schematic illustration of the fabricated device are shown in Fig. 31a and b, respectively. As ILs, commercial [EMIM][FSA] and [TMPA][TFSA] were adopted (Fig. 31c).
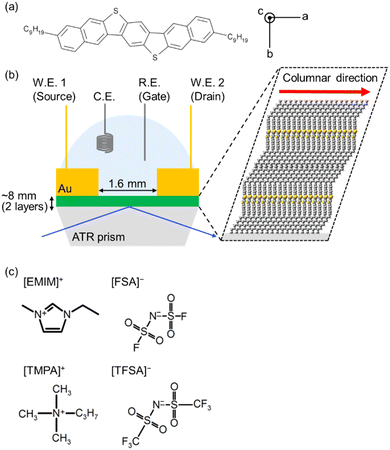 | ||
| Fig. 31 (a) The structural formula of C9-DNBDT-NW and (b) a schematic illustration of the fabricated device on the ATR sapphire prism. (c) The structural formulas of the used ionic liquids. Reproduced from ref. 33. | ||
The fabricated transistor on the ATR prism successfully worked (Fig. 32a). The ATR absorption spectrum of C9-DNBDT-NW films with the IL showed characteristic peaks at about ∼460 and ∼285 nm (Fig. 32b). The strong absorbance at about 220 nm is due to the IL on the C9-DNBDT-NW film. The assignments of these peaks were discussed based on the absorption spectra of C9-DNBDT-NW solutions and TD-DFT calculations in the reference paper.33 The peak wavelengths at ∼460 nm (Fig. 32b) and ∼285 nm (Fig. 32d) were blue-shifted, and the spectral intensities faded upon the applied voltage. These spectral changes depending on the applied voltage were reversible. These results can be interpreted from the decrease in the electrons in the C9-DNBDT-NW molecules upon the carrier (i.e., hole) injection results in the spectral fading. Such positive relationships between the amount of spectral changes and the drain current were reported for OFETs using pentacene157 and rubrene.158 The origins of the peak shifts may be attributed to the Stark effect caused by the applied voltage and changes in the electronic states due to hole injection, which are currently under investigation.
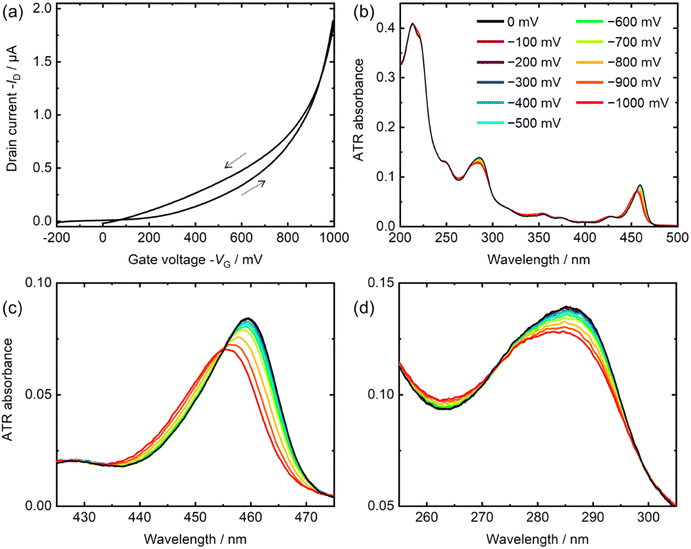 | ||
| Fig. 32 (a) The transfer characteristics of the fabricated device were measured at a drain voltage (VD) of −100 mV and a scan rate of 20 mV s−1. (b) ATR spectra were obtained for a C9-DNBDT-NW film with [EMIM][FSA] on a sapphire substrate. The spectra were then magnified in the ranges (c) 425–475 nm and (d) 255–305 nm at various gate voltages. Reproduced from ref. 33. | ||
[EMIM][FSA] has strong absorbance in the 205–225 nm region.135 As shown in Fig. 33a and b, by the applied voltage, the absorbance at ∼212 nm decreased and that at ∼218 nm increased, indicating the red-shift of the absorption peak of [EMIM][FSA]. In the case of [TMPA][TFSA], there was little spectral change depending on the applied voltage (Fig. 33c and d). Hence, it can be inferred that the observed shift in the spectrum was caused by the Stark effect of [EMIM][FSA] on the C9-DNBDT-NW film.33
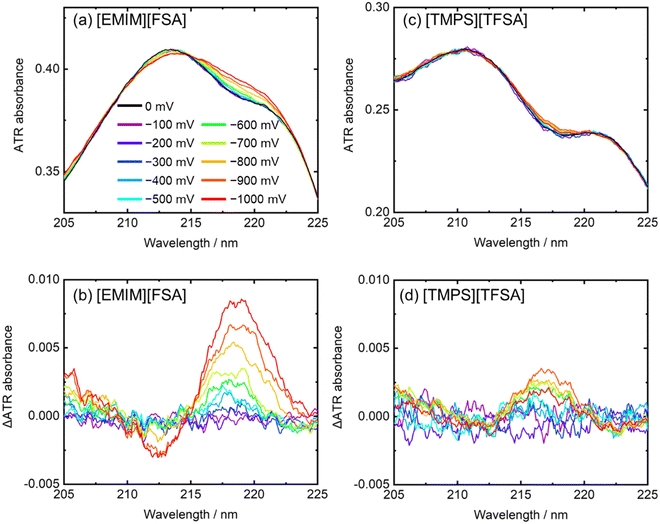 | ||
| Fig. 33 (a) and (c) ATR and (b) and (d) difference spectra of C9-DNBDT-NW films in the range 205–225 nm with (a) and (b) [EMIM][FSA] and (c) and (d) [TMPA][TFSA]. Reproduced from ref. 33. | ||
The absorbance observed at about 210 nm in imidazolium-based ILs with fluorine anions can be attributed to the internal molecular excitation of the imidazolium cation. Another significant observation in Fig. 33a is that the spectral intensity did not decrease upon applying voltage. It is important to highlight that the EC-ATR-UV spectroscopy technique utilized in this study enables the detection of the Stark shift not only in the organic semiconductor thin film but also in the IL near the surface of the thin film. Detecting the shift of the IL is challenging using transmission spectra due to the strong absorbance exhibited by the IL.33
In this study, ILs-gated EDL-OFETs incorporating C9-DNBDT-NW were successfully fabricated on the ATR prism. The devices were operated as transistors, and their performance was characterized using ATR-UV spectroscopy, facilitated by a newly-developed spectroscopic system. By varying the applied gate voltage, shifts, and fading of the spectral peaks of the organic semiconductor were observed, which correlated with changes in the drain current. Moreover, the EC-ATR-UV spectroscopy technique enabled the measurement of absorbance attributed to the ILs near the surface of the C9-DNBDT-NW film. This innovative approach holds promise for investigating other electrochemical devices, such as organic thin film solar cells, where the interfacial region plays a critical role in determining their functionality.
11. FUV-UV-surface plasmon resonance sensors
Surface plasmon resonance (SPR) in the UV region have garnered considerable interest due to their higher energy, diverse electronic resonances of materials, and shorter wavelengths compared to visible light.159–166 Traditionally, gold (Au) and silver (Ag) are used for plasmonics in the visible region, while aluminum (Al) is suitable for UV-SPR investigations because of its high plasma frequency.SPR sensors play a vital role in plasmonics and find wide applications in biochemistry and environmental chemistry by detecting changes in the refractive index near the surface of a metal film.167–169 The commercial SPR sensors predominantly utilize gold (Au) films and were operated using visible light. However, we have recently introduced innovative SPR sensors that utilize shorter wavelength light, specifically in the FUV and DUV regions.170–175 These sensors offer distinct advantages when dealing with analytes such as proteins and nucleobases that exhibit no absorbance in the visible region but display strong and characteristic absorption due to molecular electronic transitions in the FUV-DUV region.176 Notably, certain materials like saccharides solely exhibit absorption in the FUV region.177,178 Although refractive index sensors based on aluminum (Al) LSPR have been reported,179–183 they operate at longer wavelengths where the target molecules lack absorbance.
By harnessing FUV and DUV light, the FUV-DUV-SPR sensor offers three significant advantages: heightened sensitivity, material selectivity, and surface selectivity. Firstly, many materials exhibit strong absorptions in the FUV and DUV regions, leading to large changes in the dielectric constant. Consequently, the FUV-DUV-SPR sensor can achieve higher sensitivity compared to visible SPR sensors. Secondly, each material demonstrates a unique spectral shape in the FUV-DUV region even if it lacks absorption in the visible range. By precisely tuning the SPR wavelength to align with the absorption wavelength, the sensor can achieve material selectivity. Thirdly, employing shorter wavelength light restricts the measurement field (i.e., the evanescent wave range) to a narrower scope compared to visible SPR sensors. As a result, the FUV-DUV-SPR sensor enables surface-selective detection.
Recently, the surface sensitivity of the FUV-DUV-SPR sensor was studied as described below.174 The Kretschmann configuration was employed to induce surface plasmon resonance (SPR) in an aluminum (Al) film that was deposited on a sapphire prism using vapor deposition, resulting in a film thickness of approximately 20 nm. It should be emphasized here that the Al is easily oxidized and the SPR properties are strongly changed by the oxidation. However, the thickness of Al and Al2O3 can be estimated by simulations based on the Fresnel equations.171,174
Fig. 34a–g depict the reflectance spectra of the Al film covered with spin-coated ionic liquid (MTOA-TFSI; methyl-trioctylammonium bis(trifluoromethylsulfonyl)imide) films prepared using methanol solutions of various concentrations (0.1–4.5 wt%).174 As the concentration of the ionic liquid increased, the SPR wavelength exhibited a redshift to longer wavelengths: from ∼169 nm to 237.0 nm. Fig. 34h represents the reflectance spectrum obtained with a bulk quantity of the ionic liquid on the Al film. In Fig. 34i, the relationship between the ionic liquid concentration and the SPR wavelength is summarized. The redshift in the SPR wavelength signifies an increase in the refractive index within the measurement area, specifically the evanescent field. Higher concentration solutions resulted in thicker ionic liquid films, leading to longer SPR wavelengths.
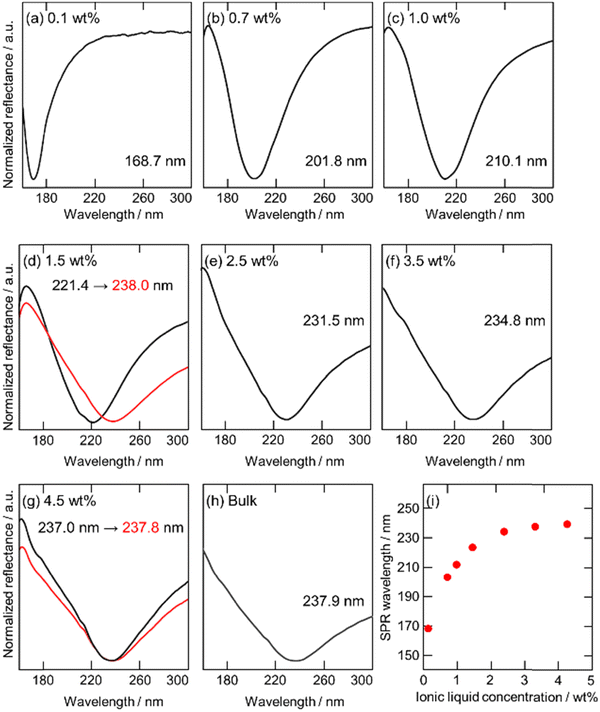 | ||
| Fig. 34 (a)–(h) The reflectance spectra of the Al film (A) are shown, with the film being covered by (a)–(g) spin-coated ionic liquid films prepared using solutions of different concentrations or (h) bulk ionic liquid. The inset values indicate the SPR wavelength. (i) A correlation between the concentration of the ionic liquid and the SPR wavelength is depicted. The red lines in (d) and (h) represent the reflectance spectra obtained after the addition of a bulk quantity of pure ionic liquid. Reproduced from ref. 174 with permission from [Elsevier], copyright [2020]. | ||
Following that, a substantial volume of pure ionic liquid was introduced onto the films, and reflectance spectra were subsequently measured (indicated by the red lines in Fig. 34d and g). As illustrated in Fig. 34d, the thinner films exhibited a noticeable shift toward longer wavelengths by dropping the bulk ionic liquid, specifically from ∼221 nm to 238 nm. This shift suggests that the introduced ionic liquid filled the evanescent field, which was previously unoccupied by the ionic liquid film derived from the 1.5 wt% solution. In contrast, the thicker film displayed a minimal shift in the SPR wavelength relative to the bulk ionic liquid (Fig. 34g). These findings suggest that the ionic liquid films prepared with the 4.5 wt% solution had already reached a saturation point in terms of the SPR shift. Additionally, the estimated thickness of the ionic liquid film prepared with the 0.1 wt% solution was approximately 2 nm. This indicates that the minimum detectable thickness of the organic overlayer for the Al film had reached the 2 nm threshold.
As described above, the high sensitivity and material selectivity are also the expected advantages of the FUV-DUV-SPR sensor. Around the electron resonance peak wavelengths, the refractive index n changes markedly, and thus, the SPR wavelength will shift largely. Therefore, by selecting a specific light wavelength that a target material absorbs, the resonant material may be detected selectively because of the remarkable changes of the refractive index n.175
Fig. 35a shows the ATR absorption spectra of hexafluoro-2-propanol (HFIP, green line), water (red line), 2-propanol (blue line), 2-butanol (yellow line), and 1-octanol (purple line). These liquid samples have no absorbance. Fig. 35b shows the reflections spectra of the Al film on the sapphire prism with HFIP, water, 2-propanol, 2-butanol, and 1-octanol on the Al film. The SPR wavelengths of Al in the presence of HFIP (nD = 1.275), water (nD = 1.333), 2-propanol (nD = 1.374), 2-butanol (nD = 1.396), and 1-octanol (nD = 1.428) were 215.2, 227.5, 238.8, 242.3, and 253.6 nm, respectively. There was obvious positive relationship between the refractive index n of the sample and the SPR wavelength, which corresponded with the general SPR properties.175
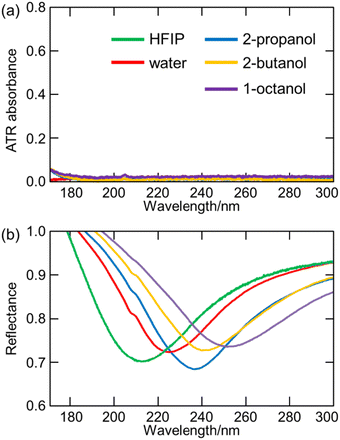 | ||
| Fig. 35 (a) Absorption spectra of (green) HFIP, (red) water, (blue) 2-propanol, (orange) 2-butanol, and (purple) 1-octanol, and (b) reflection spectra of the Al film on the sapphire prism in these liquids. Reproduced from ref. 175. | ||
On the other hand, Fig. 36a shows the ATR absorbance spectra of DMF (purple line), HFIP (as solvent, green line), and 4.3 M- and 6.5 M-DMF solutions (pink lines), respectively. In contrast to samples in Fig. 35a, DMF showed distinct peak at ∼200 nm. Due to the impact of the refractive index (n) of the samples, the ATR spectral shapes around the peak wavelength were subject to distortion depending on the concentration of DMF. The refractive index nD measured by the refractive index sensor of 4.3 M-DMF, 6.5M-DMF, and pure (13.0 M) DMF were 1.328, 1.350, and 1.429, respectively. These DMF solutions were put on the Al film evaporated on the sapphire prism, and the reflection spectra were measured. As shown in Fig. 36b, with the increase in the DMF concentration, i.e., the increase in the refractive index n of the samples, the SPR wavelength shifted to the longer wavelength region. The SPR wavelengths with HFIP, 4.3 M-DMF, 6.5 M-DMF, and pure DMF on the Al film were 215.2, 233.5, 243.0, and 275.6 nm, respectively.175
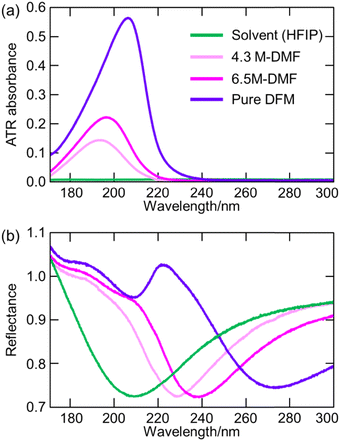 | ||
| Fig. 36 (a) Reflection spectra of DMF and its mixture with HFIP and (b) reflection spectra of the Al film on the sapphire prism in these liquids. Reproduced from ref. 175. | ||
Fig. 37 shows the relationship between the refractive index n of the sample on the Al film and the SPR wavelength. Open circles and filled squares in Fig. 37 were plotted based on the results in Fig. 35b and 36b, respectively. It should be emphasized here that the refractive index n in Fig. 37 is the value in the visible region, and all samples including DMF have no absorbance in the visible region. As noted above, the samples represented by the open circles (HFIP, water, 2-propanol, 2-butanol, and 1-octanol) had no absorbance in the measured wavelength region (170–300 nm, Fig. 35a). On the other hand, DMF had strong absorbance around 200 nm, as shown in Fig. 36a. The refractive index n is changed significantly around the absorption wavelength, which is the anomalous dispersion of the refractive index. Therefore, the large shift of the SPR wavelength is expected using the light around the absorption wavelength. Actually, as shown in Fig. 37, the DMF solutions shifted the SPR wavelength of the Al film more than water and alcohols. For example, even though the refractive index n in the visible region (589.3 nm) was almost the same between pure DMF (1.429) and 1-octanol (1.428), the SPR wavelength shift of pure DMF from HFIP was emphasized compared with 1-octanol: 60.4 nm for pure DMF and 38.4 nm for 1-octanol. The larger shift of the SPR wavelength may result in the higher sensitivity of the SPR sensor.175
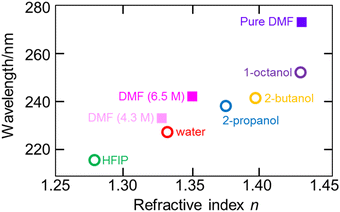 | ||
| Fig. 37 SPR wavelength of Al film depending on the value of n in the visible region. Reproduced from ref. 175. | ||
For comparison, the SPR wavelength of the Au film on the sapphire prism in the visible region was investigated. The liquid samples HFIP, water, 2-propanol, 2-butanol, 1-octanol, 4.3 M-DMF, 6.5 M-DMF, and pure DMF were cast on the Au film, and the reflection spectra were measured in the 470–600 nm range using the same instrument with exchanged light source and diffraction grating. Fig. 38a and b show the obtained reflection spectra, and Fig. 38c summarizes the Au-SPR wavelength depending on the refractive index n. Similar to the results using the Al film in the FUV and DUV regions, there was a clear positive relationship between the refractive index n and the SPR wavelength. However, unlike the case of the Al film in the FUV and DUV regions, DMF induced no dominant shift of the SPR wavelength compared with the other samples, as shown in Fig. 38c. This is because DMF had no absorbance (i.e., no rapid change of the refractive index n) in the visible region, similar to the other samples. Therefore, by adopting the FUV and DUV regions, the enhancement of the SPR wavelength shift due to the absorption of the materials was achieved.175
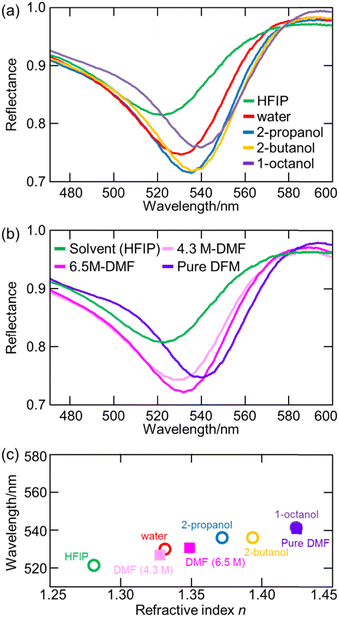 | ||
| Fig. 38 (a) and (b) Reflection spectra of the Au film on the sapphire prims in (a) HFIP, water, 2-propanol, 2-butanol, 1-octanol, and (b) DMF and its mixture with HFIP. (c) SPR wavelength dependence of Au with various refractive indices. Reproduced from ref. 175. | ||
12. Perspectives
ATR-FUV spectroscopy has opened a new area of electronic spectroscopy of liquids and solids. It has become a general method for investigating the electronic structure and transitions in the 140–200![[thin space (1/6-em)]](https://www.rsc.org/images/entities/char_2009.gif) nm region. Spectral data about π–π*, n → σ*, and Rydberg transitions of molecules in liquid and solid phases can be obtained by ATR spectroscopy. Studies on Rydberg transitions are particularly important. Another important advantage of ATR-FUV spectroscopy is that it is a unique technique for investigating ultrathin surfaces (∼50–100 nm) of materials. It may become a powerful method for the exploration of surface structures, properties, and reactions.
nm region. Spectral data about π–π*, n → σ*, and Rydberg transitions of molecules in liquid and solid phases can be obtained by ATR spectroscopy. Studies on Rydberg transitions are particularly important. Another important advantage of ATR-FUV spectroscopy is that it is a unique technique for investigating ultrathin surfaces (∼50–100 nm) of materials. It may become a powerful method for the exploration of surface structures, properties, and reactions.
In this section, perspectives of ATR-FUV spectroscopy are discussed. One can consider a variety of possibilities as the perspectives of ATR-FUV spectroscopy. (i) Expansion of wavelength region and related development of new instruments, (ii) new spectral analysis methods, (iii) new application for top surface research, (iv) combination of ATR-UV spectroscopy, and UV-resonance Raman spectroscopy, (v) open the door to σ-chemistry, (vi) applications to biomedical sciences, food sciences, geochemical and environmental science and technology, (vi) SPR-FUV-UV sensors.
(i) Expansion of wavelength region and related development of new instruments
The first-generation ATR-FUV instruments were available in the 145–300 nm region. It was natural to extend the region to a longer wavelength region. Nowadays, one can measure the FUV-UV-vis spectra in the 145–600 nm region. The extension of the wavelength region has allowed one to explore the electronic structure and transitions of various kinds of molecules and materials. A variety of molecules have absorption bands in both FUV and UV regions. Using ATR-FUV-UV spectroscopy, ionic liquids consisting of various anions and cations can be studied. Simultaneous measurements in the whole FUV-UV-Vis region (140–800 nm) will become more important because it allows to collect information about the electronic structure and transitions of different parts of a molecule.It should be emphasized here that the original advantage (i.e., short penetration depth of the ATR method) is also a strong advantage even in the visible region. The transmission spectra of many materials are easily saturated because of their strong absorbance in the visible region. Using the ATR system, the penetration is shortened to the nanometer order, resulting in spectral measurements without spectral saturation. Concomitant with the extension of the wavelength region, an electrochemical ATR spectrometer (EC-ATR) has become usable with application to the electronic transition spectra of interfacial ionic liquids. The wavelength region extension of time-resolved ATR-FUV spectroscopy is very much expected to probe the photochemical reactions in the FUV region FUV-UV imaging is promising as a novel technique for investigating the structure and reactions on the top surfaces of various materials including biomedical materials.
The expansion of the wavelength region to a shorter wavelength region is down to 120 nm. It may be possible to go down to 120 nm by purging Ar gas instead of N2 gas. Bands due to the σ-σ* transitions may be observed in the 120–145 nm region.
(ii) New trend of spectral analysis methods in the FUV-UV spectra
In the spectral analysis of ATR-FUV-UV spectra, quantum chemical calculations such as TD-DFT are usually used. It has been known that SAC-CI also plays very important roles in the band assignments and studies of electronic transitions and states.41,107 Bec et al. revealed that the ZINDO method is powerful for calculating the FUV-UV spectra of the graphene nanostructure. Therefore, although there is no doubt that the DFT method is a general method, it is also important for some case to consider the use of the SAC-CI method and some other methods such as ZINDO.41,45Goto et al.36 used the ALS method to analyze VA-dependent spectral variations of water on the aluminum surface. Imai et al.29,136 investigated the solvation properties of silver ions in ionic liquids using attenuated total reflectance ultraviolet spectroscopy and MCR analysis. Various chemometrics methods such as ALS, MCR, and PCA should probably be employed more for the analysis of ATR-FUV-UV spectra.
(iii) New application for top surface research
ATR-FUV-UV spectroscopy has become a unique method for exploring a top surface of various materials such as polymers, graphene, and nanocomposites. The comparison of the ATR-FUV-UV spectra of materials and corresponding transmission spectra gives interesting information about the difference in the electronic structure of materials between the top surface and inside. As described above, the combination of imaging technique and VA ATR-FUV-UV spectroscopy may open a new field of surface science.(iv) Combination of ATR-UV spectroscopy and UV-resonance Raman spectroscopy
Unique synergy effects can be expected from the combination of ATR-FUV spectroscopy and UV resonance Raman (RR) spectroscopy because the former provides knowledge about the electronic structure and transition of a molecular while the latter gives information about structure of the molecule. The excitation profile of the UVRR spectra may yield information about the electronic structure of the molecules. From the FUV spectra, one can select a suitable excitation wavelength to measure the RR spectrum. It also enables band assignments in the FUV spectra based on the excitation profile of the UVRR spectra. Thus, the knowledge obtained by the two methods are often complementary. We plan to use this technique for biological applications. Biological samples, including proteins, carbohydrates, lipids, and more complicated samples, such as membrane proteins and cultured cells.(v) Open a door to σ-chemistry
ATR-FUV spectroscopy may open a new world of σ-chemistry. For example, using ATR-FUV spectroscopy, one can investigate the effects of the hyperconjugation on the C–C and C–H bonds on the electronic transitions. ATR-FUV spectroscopy may be used to explore chemical reactions containing the C–H bond, which may shed light on new organic synthetic chemistry. Intermolecular interactions between n-alkanes, such as a CH⋯HC interaction in the condensed phase, may also be investigated by ATR-FUV spectroscopy. It is also noted that ATR-FUV spectroscopy can be used to explore the unique behavior in the phase transition of alkanes.(vi) Applications to biomedical sciences, food science, geochemical, and environmental science and technology
Recently, ATR-FUV spectroscopy has been applied to biological molecules. Hashimoto et al. investigated protein adsorption using ATR-FUV spectroscopy.184 They have also studied the ATR-FUV spectra of carbohydrates in combination with UVRR spectroscopy. ATR-FUV spectroscopy studies will be expanded to lipids and other biological molecules. Also, more complicated biological materials such as blood have been investigated, and probably biomembranes and cultured cell will also be studied by ATR-FUV spectroscopy.In relation to biomedical application, ATR-FUV spectroscopy may be used for food science and technology. For example, the electronic structure, structure, and kinds of proteins, lipids, and carbohydrates in foods and those of food oils and alcohols may be investigated by ATR-FUV spectroscopy. Even the food quality may be probed by ATR-FUV spectroscopy.
It is very likely that geochemical and environmental sciences will become new areas of FUV spectroscopy because the FUV-DUV spectra are sensitive to water structure and ions included. Besides the à ← ![[X with combining tilde]](https://www.rsc.org/images/entities/char_0058_0303.gif) band of water, the CTTS (charge transfer to solvent) bands of halide ions in the 180–230 nm region and the band originating from the π–π* transition of NO3− in the 180–240 nm region may also be used for geochemical and environmental applications. There are some preceding studies, such as those of wastewaters and spring waters.
band of water, the CTTS (charge transfer to solvent) bands of halide ions in the 180–230 nm region and the band originating from the π–π* transition of NO3− in the 180–240 nm region may also be used for geochemical and environmental applications. There are some preceding studies, such as those of wastewaters and spring waters.
(v) FUV-DUV SPR sensors
FUV and DUV light offer the SPR sensor three key advantages: heightened sensitivity, precise material selectivity, and refined surface selectivity. Many materials demonstrate strong absorptions in the FUV and DUV regions, granting the FUV-DUV-SPR sensor superior sensitivity compared to visible SPR sensors. Moreover, each material displays a distinctive spectral profile within the FUV-DUV range, enabling precise material selectivity through the careful adjustment of the SPR wavelength. Additionally, the utilization of shorter wavelengths restricts the measurement field, facilitating the sensor's ability to detect surface-specific changes. Notably, target molecules such as proteins and nucleobases often exhibit absorbance exclusively in the DUV and FUV regions. The field of UV plasmonics has garnered considerable attention, expanding beyond the DUV threshold, and the advent of the newly developed ATR system holds promise for various disciplines, including biochemistry, environmental science, photonics, and analytical chemistry.Conflicts of interest
There are no conflicts to declare.Acknowledgements
The authors thank Prof M. Ehara (Institute for Molecular Science) and Dr. K. B. Bec (University of Innsbruck) for their enlightening discussion on Section 5. Y. O. acknowledges Toyota Physical and Chemical Research Institute for their financial support. The studies in this review were financially supported by JSPS KAKENHI No 21K05013 and 26410167 to Y. M, and 23K04811, 20K15312, 18KK0396, and 18K14251 to I. T.References
- Y. Ozaki and S. Kawata, Far- and Deep-Ultraviolet Spectroscopy, Springer, Tokyo, 2015 Search PubMed.
- Y. Ozaki, Y. Morisawa, A. Ikehata and N. Higashi, Far-Ultraviolet Spectroscopy in the Solid and Liquid States: A Review, Appl. Spectrosc., 2012, 66, 1–25 CrossRef CAS.
- Y. Ozaki and I. Tanabe, Far-ultraviolet spectroscopy of solid and liquid states; characteristics, instrumentations, and applications, Analyst, 2016, 141, 3962–3981 RSC.
- Y. Morisawa, I. Tanabe and Y. Ozaki, Advances in Far-Ultraviolet Spectroscopy in the Solid and Liquid States, in Frontiers and Advances in Molecular Spectroscopy, ed. J. Laane, Elsevier, 2018, pp. 251–285 Search PubMed.
- Y. Ozaki, Recent advances in molecular spectroscopy of electronic and vibrational transitions in condensed phase and its application to chemistry, Bull. Chem. Soc. Jpn., 2019, 92, 629–654 CrossRef CAS.
- Y. Ozaki, Y. Morisawa, I. Tanabe and K. B. Bec, ATR-far-ultraviolet spectroscopy in the condensed phase- The present, status and future perspectives, Spectrochim. Acta, Part A, 2021, 253, 119549 CrossRef CAS PubMed.
- M. B. Robin, Higher Excited States of Polyatomic Molecules, Academic Press. New York, 1974, vol. II Search PubMed.
- M. B. Robin, Higher Excited States of Polyatomic Molecules, Academic Press, New York, 1985, vol. III Search PubMed.
- J. A. Samson and D. L. Ederer, Vacuum Ultraviolet Spectroscopy, Academic Press, New York, 2000 Search PubMed.
- The Role of Rydberg States in Spectroscopy and Photochemistry-Low and High Rydberg States, ed. C. Sandorfy, Kluwer Academic Publishers, Dordrecht, 1999 Search PubMed.
- P. Misra and M. A. Dubinskii, Ultraviolet Spectroscopy and UV Lasers, CRC Press, Boca Raton, FL, 2019 Search PubMed.
- K. Kaya and S. Nagakura, Vacuum ultraviolet absorption spectra of simple amides, Theor. Chim. Acta, 1967, 7, 117–123 CrossRef CAS.
- G. W. Rubloff, H. Fritzsche, U. Gerhardt and J. Freeouf, Far Ultraviolet Spectroscopy of Solids in the Range 6–36 eV Using Synchrotron Radiation from an Electron Storage Ring, Rev. Sci. Instrum., 1971, 42, 1507–1512 CrossRef CAS.
- J. M. Jung and H. Gress, Single-photon absorption of liquid methanol and ethanol in the vacuum ultraviolet, Chem. Phys. Lett., 2002, 359, 153 CrossRef CAS.
- J. M. Jung and H. Gress, Single-photon absorption of liquid cyclohexane, 2,2,4 trimethylpentane and tetramethylsilane in the vacuum ultraviolet, Chem. Phys. Lett., 2003, 377, 495–500 CrossRef CAS.
- Y. P. Kuo, H. C. Lu, Y. J. Wu, B. M. Cheng and F. J. Ogilvie, Absorption spectra in the vaccumu ultraviolet region of methanol in the condensed phase, Chem. Phys. Lett., 2007, 447, 168–174 CrossRef CAS.
- S. Sério, M. E. Melo Jorge, M. L. Coutinho, S. V. Hoffman, P. Limão-Vieria and Y. Nunes, Spectroscopic studies of anatase TiO2 thin films prepared by DC reactive magnetron sputtering, Chem. Phys. Lett., 2011, 508, 71–75 CrossRef.
- R. E. Verrall and W. A. Senior, Vacuum-Ultraviolet Study of Liquid H2O and D2O, J. Chem. Phys., 1969, 50, 2746 CrossRef CAS.
- L. R. Painter, R. D. Birkhoff and E. T. Arakawa, Optical Measurements of Liquid Water in the Vacuum Ultraviolet, J. Chem. Phys., 1969, 51, 243–251 CrossRef CAS.
- L. R. Painter, R. N. Hamm, E. T. Arakawa and R. D. Birkhoff, Electronic Properties of Liquid Water in the Vacuum Ultraviolet, Phys. Rev. Lett., 1968, 21, 282–284 CrossRef CAS.
- G. D. Kerr, J. T. Cox, L. R. Painer and R. D. Birkhoff, A Reflectometer for Studying Liquids in the Vacuum Ultraviolet, Rev. Sci. Instrum., 1971, 42, 1418 CrossRef CAS.
- E. A. Costner, B. K. Long, C. Navar, S. Jockusch, X. Lei, P. Zimmerman, A. Campion, N. J. Turro and C. G. Willson, Fundamental Optical Properties of Linear and Cyclic Alkanes: VUV Absorbance and Index of Refraction, J. Phys. Chem. A, 2009, 113, 9337 CrossRef CAS PubMed.
- K. Weiss, P. S. Baguo and C. Woll, Rydberg transitions in X-ray absorption spectroscopy of alkanes: The importance of matrix effects, J. Chem. Phys., 1999, 111, 6834–6845 CrossRef CAS.
- M. Nobre, A. Fernandes, A. Ferreiru da Silva, R. Antunes, D. Almeida, V. Kokhan, S. V. Hoffmann, N. J. Mason, S. Eden and P. Limao-Vieira, The VUV electronic spectroscopy of acetone studied by synchrotron radiation, Phys. Chem. Chem. Phys., 2008, 10, 550 RSC.
- B.-M. Cheng, M. Bahou, W.-C. Chen, C.-H. Yui, Y.-P. Lee and L. C. Lee, Experimental and theoretical studies on vacuum ultraviolet absorption cross sections and photodissociation of CH3OH, CH3OH, CH3OD, CH3OD, CD3OH, CD3OH, and CD3OD, J. Chem. Phys., 2002, 117, 1633–1640 CrossRef CAS.
- Y. Morisawa, N. Higashi, K. Takaba, N. Kariyama, T. Goto, A. Ikehata and Y. Ozaki, Development of a time-resolved attenuated total reflectance spectrometer in far-ultraviolet region, Rev. Sci. Instrum., 2012, 83, 073103 CrossRef PubMed.
- T. Goto, Y. Morisawa, N. Higashi, A. Ikehata and Y. Ozaki, Pulse Laser Photolysis of Aqueous Ozone in the Microsecond Range Studied by Time-Resolved Far-Ultraviolet Absorption Spectroscopy, Anal. Chem., 2013, 85, 4500–4506 CrossRef CAS PubMed.
- I. Tanabe, A. Suyama, T. Sato and K. Fukui, Potential Dependence of Electronic Transition Spectra of Interfacial Ionic Liquids Studied by Newly Developed Electrochemical Attenuated Total Reflectance Spectroscopy, Anal. Chem., 2019, 91, 3436–3442 CrossRef CAS PubMed.
- M. Imai, I. Tanabe, Y. Ozaki and K. Fukui, Solvation properties of silver ions in ionic liquids using attenuated total reflectance ultraviolet spectroscopy, J. Mol. Liq., 2022, 364, 119998 CrossRef CAS.
- F. M. Mirabella Jr. and N. J. Harrick, Internal Reflection Spectroscopy: Review and Supplement, Harrick Scientific Corp., Ossining, NY, 1985 Search PubMed.
- N. Higashi, A. Ikehata and Y. Ozaki, An attenuated total reflectance far-UV spectrometer, Rev. Sci. Instrum., 2007, 78, 103107 CrossRef PubMed.
- A. Ikehata, Y. Ozaki and N. Higashi, Direct observation of the absorption bands of the first electronic transition in liquid H2O, D2O by attenuated total reflectance far-UV spectroscopy, J. Chem. Phys., 2008, 129, 234510 CrossRef PubMed.
- I. Tanabe, I. Imoto, D. Okaue, M. Imai, S. Kumagai, T. Makita, M. Mitani, T. Okamoto, J. Takeya and K. Fukui, Commun. Chem., 2021, 4, 88 CrossRef CAS PubMed.
- A. Ikehata, M. Mitsuoka, Y. Morisawa, N. Kariyama, N. Higashi and Y. Ozaki, Effect of Cations on Absorption Bands of First Electronic Transition of Liquid Water, J. Phys. Chem. A, 2010, 114, 8319–8322 CrossRef CAS PubMed.
- T. Goto, A. Ikehata, Y. Morisawa, N. Higashi and Y. Ozaki, The effect of metal cations on the nature of the first electronic transition of liquid water as studied by attenuated total reflection far-ultraviolet spectroscopy, Phys. Chem. Chem. Phys., 2012, 14, 8097–8104 RSC.
- T. Goto, A. Ikehata, Y. Morisawa and Y. Ozaki, Surface Effect of Alumina on the First Electronic Transition of Liquid Water Studied by Far-Ultraviolet Spectroscopy, J. Phys. Chem. Lett., 2015, 6, 1022–1026 CrossRef CAS PubMed.
- A. Ikehata, T. Goto and Y. Morisawa, A Correction Method for Attenuated Total Reflection–Far Ultraviolet Spectra Via the Use of Charge Transfer to Solvent Band Intensities of Iodide in the Ultraviolet Region, Appl. Spectrosc., 2017, 71, 1530–1536 CrossRef CAS PubMed.
- Y. Suzuki, H. Shen, Y. Tang, N. Kurahashi, K. Sekiguchi, T. Mizuno and T. Suzuki, Isotope effect on ultrafast charge-transfer-to-solvent reaction from I− to water in aqueous NaI solution, Chem. Sci., 2011, 2, 1094–1102 RSC.
- A. Kothe, M. Wilke, A. Moguilevski, N. Engel, B. Winter, I. Y. Kiyan and E. F. Aziz, Charge transfer to solvent dynamics in iodide aqueous solution studied at ionization threshold, Phys. Chem. Chem. Phys., 2015, 17, 1918 RSC.
- M. J. Blandamer and M. F. Fox, Theory and applications of charge-transfer-to-solvent spectra, Chem. Rev., 1970, 70, 59–93 CrossRef CAS.
- Y. Ozaki, K. B. Beć, Y. Morisawa, S. Yamamoto, I. Tanabe, C. W. Huck and T. S. Hofer, Advances, challenges and perspectives of quantum chemical approaches in molecular spectroscopy of the condensed phase, Chem. Soc. Rev., 2021, 50, 10917–10954, 10.1039/D0CS01602K.
- J. A. Pople, M. Head-Gordon, D. J. Fox, K. Raghavachari and L. A. Curtiss, Gaussian-1 theory: A general procedure for prediction of molecular energies, J. Chem. Phys., 1989, 90, 5622, DOI:10.1063/1.456415.
- S. I. Gorelsky, Electronic Spectroscopy, Calculation, in Encyclopedia of Spectroscopy and Spectrometry, ed. J. C. Lindon, G. E. Tranter and D. W. Koppenaal, 3rd edn, 2017, pp. 447–451 DOI:10.1016/B978-0-12-409547-2.12089-X.
- A. Szabo and N. S. Ostlund, Modern Quantum Chemistry: Introduction to Advanced Electronic Structure Theory, Courier Corporation, 1996 Search PubMed.
- C. J. Cramer, Essentials of Computational Chemistry: Theories and Models, John Wiley & Sons, 2nd edn, 2004 Search PubMed.
- A. Dreuw and M. Head-Gordon, Single-Reference ab Initio Methods for the Calculation of Excited States of Large Molecules, Chem. Rev., 2005, 105, 4009–4037, DOI:10.1021/cr0505627.
- C. Adamo and D. Jacquemin, The calculations of excited-state properties with Time-Dependent Density Functional Theory, Chem. Soc. Rev., 2013, 42, 845, 10.1039/c2cs35394f.
- A. D. Laurent and D. Jacquemin, TD-DFT benchmarks: A review, Int. J. Quantum Chem., 2013, 113, 2019–2039, DOI:10.1002/qua.24438.
- D. Hait and M. Head-Gordon, How Accurate Is Density Functional Theory at Predicting Dipole Moments? An Assessment Using a New Database of 200 Benchmark Values, J. Chem. Theory Comput., 2018, 14, 1969–1981, DOI:10.1021/acs.jctc.7b01252.
- M. Ehara, J. Hasegawa and H. Nakatsuji, SAC-CI Method Applied to Molecular Spectroscopy, in Theory and Applications of Computational Chemistry: The First 40 Years, A Volume of Technical and Historical Perspectives, ed. C. E. Dykstra, G. Frenking, K. S. Kim and G. E. Scuseria, Elsevier, Oxford, 2005, 1099–1141 DOI:10.1016/B978-044451719-7/50082-2.
- H. Nakatsuji and K. Hirao, Cluster expansion of the wavefunction. Symmetry-adapted-cluster expansion, its variational determination, and extension of open-shell orbital theory, J. Chem. Phys., 1978, 68, 2053–2065, DOI:10.1063/1.436028.
- H. Nakatsuji, Cluster expansion of the wavefunction. Calculation of electron correlations in ground and excited states by SAC and SAC CI theories, Chem. Phys. Lett., 1979, 67, 334–342, DOI:10.1016/0009-2614(79)85173-8.
- M. Ehara and Y. Morisawa, Theoretical and Experimental Molecular Spectroscopy of the Far-Ultraviolet Region, in Molecular spectroscopy: A quantum chemistry approach, ed. Y. Ozaki, M. J. Wójcik and J. Popp, Wiley-VCH, Weinheim, Germany, 2019, vol. 1, pp. 119–145 DOI:10.1002/9783527814596.ch13.
- J. F. Stanton and R. J. Bartlett, The equation of motion coupled-cluster method. A systematic biorthogonal approach to molecular excitation energies, transition probabilities, and excited state properties, J. Chem. Phys., 1993, 98, 7029–7039, DOI:10.1063/1.464746.
- R. J. Bartlett and M. Musial, Coupled-cluster theory in quantum chemistry, Rev. Mod. Phys., 2007, 9, 291, DOI:10.1103/RevModPhys.79.291.
- S. Gozem, A. I. Krylov and M. Olivucci, Conical Intersection and Potential Energy Surface Features of a Model Retinal Chromophore: Comparison of EOM-CC and Multireference Methods, J. Chem. Theory Comput., 2013, 9, 284–292, DOI:10.1021/ct300759z.
- J. H. Andersen, K. D. Nanda, A. I. Krylov and S. Coriani, Probing Molecular Chirality of Ground and Electronically Excited States in the UV–vis and X-ray Regimes: An EOM-CCSD Study, J. Chem. Theory Comput., 2022, 18, 1748–1764, DOI:10.1021/acs.jctc.1c00937.
- T. Goto, K. B. Beć and Y. Ozaki, Interpretation of the à ←
![[X with combining tilde]](https://www.rsc.org/images/entities/char_0058_0303.gif) transition of hydrated protons in aqueous solutions observed in the far-UV region with quantum chemical calculations, Phys. Chem. Chem. Phys., 2017, 19, 21490–21499, 10.1039/C7CP01766A.
transition of hydrated protons in aqueous solutions observed in the far-UV region with quantum chemical calculations, Phys. Chem. Chem. Phys., 2017, 19, 21490–21499, 10.1039/C7CP01766A. - M. Caricato, G. W. Trucks, M. J. Frisch and K. B. Wiberg, Oscillator Strength: How Does TDDFT Compare to EOM-CCSD?, J. Chem. Theory Comput., 2011, 7, 456–466, DOI:10.1021/ct100662n.
- P. A. M. Dirac, Note on Exchange Phenomena in the Thomas Atom, Math. Proc. Cambridge Philos. Soc., 1930, 26, 376–385, DOI:10.1017/S0305004100016108.
- H. Sekino and R. J. Bartlett, Frequency dependent nonlinear optical properties of molecules, J. Chem. Phys., 1986, 85, 976, DOI:10.1063/1.451255.
- A. Y. Tolbin, A. V. Dzuban, V. I. Shestov, Y. I. Gudkova, V. K. Brel, L. G. Tomilova and N. S. Zefirov, Peripheral functionalisation of a stable phthalocyanine J-type dimer to control the aggregation behaviour and NLO properties: UV-vis, fluorescence, DFT, TDHF and thermal study, RSC Adv., 2015, 5, 8239–8247, 10.1039/C4RA15239E.
- A. S. Christensen, T. Kubař, Q. Cui and M. Elstner, Semiempirical Quantum Mechanical Methods for Noncovalent Interactions for Chemical and Biochemical Applications, Chem. Rev., 2016, 116, 5301–5337, DOI:10.1021/acs.chemrev.5b00584.
- J. E. Ridley and M. C. Zerner, An intermediate neglect of differential overlap technique for spectroscopy: Pyrrole and the azines, Theor. Chem. Acc., 1973, 32, 111–134, DOI:10.1007/BF00528484.
- J. B. Foresman, M. Head-Gordon, J. A. Pople and M. J. Frisch, Toward a systematic molecular orbital theory for excited states, J. Phys. Chem., 1992, 96, 135–149, DOI:10.1021/j100180a030.
- C. D. Mitchell and T. L. Netzel, CIS INDO/S SCRF Study of Electron Transfer Excited States in a 1-Pyrenyl Substituted 1-Methyluracil-5-Carboxamide Nucleoside Model: Dielectric Continuum Solvation Effects on Electron Transfer States, J. Phys. Chem. B, 2000, 104, 125–136, DOI:10.1021/jp992849b.
- Y. H. Park, K. Yang, Y.-H. Kim and S. K. Kwoon, Ab initio Studies on Acene Tetramers: Herringbone Structure, Bull. Korean Chem. Soc., 2007, 28, 1358–1362, DOI:10.5012/bkcs.2007.28.8.1358.
- L. de, A. Soares, M. Trsic, B. Berno and R. Aroca, Electronic spectra of metal phthalocyanines and configuration interaction ZINDO calculations for tetra-azaporphyrin complexes with the first transition metal series, Spectrochim. Acta, Part A, 1996, 52, 1245–1253, DOI:10.1016/0584-8539(96)01659-5.
- Y. Morisawa, M. Yasunaga, R. Fukuda, M. Ehara and Y. Ozaki, Electronic transitions in liquid amides studied by using attenuated total reflection far-ultraviolet spectroscopy and quantum chemical calculations, J. Chem. Phys., 2013, 139, 154301, DOI:10.1063/1.4824383.
- Y. Morisawa, Y. Higaki and Y. Ozaki, Far-Ultraviolet Spectroscopy and Quantum Chemical Calculation Studies of the Conformational Dependence on the Electronic Structure and Transitions of Cyclohexane, Methyl and Dimethyl Cyclohexane, and Decalin; Effects of Axial Substitutions on the Electronic Transitions, J. Phys. Chem. A, 2021, 125, 8205–8214, DOI:10.1021/acs.jpca.1c05688.
- K. B. Beć, Y. Morisawa, K. Kobashi, J. Grabska, I. Tanabe, E. Tanimura, H. Sato, M. J. Wójcik and Y. Ozaki, Rydberg transitions as a probe for structural changes and phase transition at polymer surfaces: an ATR-FUV-DUV and quantum chemical study of poly(3-hydroxybutyrate) and its nanocomposite with graphene, Phys. Chem. Chem. Phys., 2018, 20, 8859–8873, 10.1039/C7CP07271F.
- M. T. Portella-Oberli, C. Jeannin and M. Chergui, Ultrafast dynamics of Rydberg states in the condensed phase, Chem. Phys. Lett., 1996, 259, 475–481, DOI:10.1016/0009-2614(96)00866-4.
- L. A. P. Gallagher, J. P. Rogers, J. D. Pritchett, R. A. Mistry, D. Pizzey, C. S. Adams, M. P. A. Jones, P. Grünwald, V. Walther, C. Hodges, W. Langbein and S. A. Lynch, Microwave-optical coupling via Rydberg excitons in cuprous oxide, Phys. Rev. Res., 2022, 4, 013031, DOI:10.1103/PhysRevResearch.4.013031.
- B. Mennucci, Polarizable continuum model, Wiley Interdiscip. Rev.: Comput. Mol. Sci., 2012, 2, 386–404, DOI:10.1002/wcms.1086.
- F. Aquilante, V. Barone and B. O. Roos, A theoretical investigation of valence and Rydberg electronic states of acrolein, J. Chem. Phys., 2003, 119, 12323, DOI:10.1063/1.1625363.
- J. A. Pople, Nobel Lecture: Quantum chemical models, Rev. Mod. Phys., 1999, 71, 1267–1274, DOI:10.1103/RevModPhys.71.1267.
- J. D. Head, Inclusion of Rydberg orbitals in semiempirical calculations on excited states?, Int. J. Quantum Chem., 2003, 95, 580–592, DOI:10.1002/qua.10624.
- S. Ghosh, A. Andersen, L. Gagliardi, C. J. Cramer and N. Govind, Modeling Optical Spectra of Large Organic Systems Using Real-Time Propagation of Semiempirical Effective Hamiltonians, J. Chem. Theory Comput., 2017, 13, 4410–4420, DOI:10.1021/acs.jctc.7b00618.
- N. Ueno, T. Wakabayashi, H. Sato and Y. Morisawa, Changes in the Electronic Transitions of Polyethylene Glycol upon the Formation of a Coordinate Bond with Li+, Studied by ATR Far-Ultraviolet Spectroscopy, J. Phys. Chem. A, 2019, 123, 10746–10756, DOI:10.1021/acs.jpca.9b09274.
- Y. Morisawa, A. Ikehata, N. Higashi and Y. Ozaki, Attenuated total reflectance–far ultraviolet (ATR-FUV) spectra of CH3OH, CH3OD, CD3OH and CD3OD in a liquid phase ∼Rydberg states∼, Chem. Phys. Lett., 2009, 476, 205–208 CrossRef CAS.
- S. Tachibana, Y. Morisawa, A. Ikehata, H. Sato, N. Higashi and Y. Ozaki, Far-Ultraviolet Spectra of n-Alkanes and Branched Alkanes in the Liquid Phase Observed by an Attenuated Total Reflectance-Far Ultraviolet Spectrometer, Appl. Spectrosc., 2011, 65, 221–226 CrossRef CAS.
- Y. Morisawa, S. Tachibana, M. Ehara and Y. Ozaki, Elucidating Electronic Transitions from σ Orbitals of Liquid n- and Branched Alkanes by Far-Ultraviolet Spectroscopy and Quantum Chemical Calculations, J. Phys. Chem., 2012, 116, 11957–11964 CrossRef CAS PubMed.
- Y. Morisawa, A. Ikehata, N. Higashi and Y. Ozaki, Low-n Rydberg Transitions of Liquid Ketones Studied by Attenuated Total Reflection Far-Ultraviolet Spectroscopy, J. Chem. Phys. A, 2011, 115, 562–568 CrossRef CAS PubMed.
- I. Tanabe, Y. Kurawaki, Y. Morisawa and Y. Ozaki, Electronic absorption spectra of imidazolium-based ionic liquids studied by far-ultraviolet spectroscopy and quantum chemical calculations, Phys. Chem. Chem. Phys., 2016, 18, 22526–22530 RSC.
- T. Goto, A. Ikehata, Y. Morisawa and Y. Ozaki, Electronic Transitions of Protonated and Deprotonated Amino Acids in Aqueous Solution in the Region 145-300 nm Studied by Attenuated Total Reflection Far-Ultraviolet Spectroscopy, J. Phys. Chem. A, 2013, 117, 2517–2528 CrossRef CAS PubMed.
- N. Ueno, T. Wakabayashi and Y. Morisawa, Elucidation of the electronic states in polyethylene glycol by attenuated Total reflectance spectroscopy in the far-ultraviolet region, Spectrochim. Acta, Part A, 2018, 197, 170–175 CrossRef CAS PubMed.
- M. R. Coates, M. A. B. Larsen, R. Forbes, S. P. Neville, A. E. Boguslavskiy, I. Wilkinson, T. I. Sølling, R. Lausten, A. Stolow and M. S. Schuurman, Vacuum ultraviolet excited state dynamics of the smallest ring, cyclopropane. II. Time-resolved photoelectron spectroscopy and ab initio dynamics, J. Chem. Phys., 2018, 149, 144311 CrossRef PubMed.
- S. P. Neville, A. Stolow and M. S. Schuurman, Vacuum ultraviolet excited state dynamics of the smallest ring, cyclopropane. I. A reinterpretation of the electronic spectrum and the effect of intensity borrowing, J. Chem. Phys., 2018, 149, 144310 CrossRef PubMed.
- J. W. Raymonda and W. T. Simpson, Experimental and theoretical study of sigma-bond electronic transition in alkanes, J. Chem. Phys., 1967, 47, 430–448 CrossRef CAS.
- Y. Marcus, Ion Properties, Marcel Dekker, Inc., New York, NY, USA, 1997 Search PubMed.
- E. V. Vinogradov, P. R. Smirnov and V. N. Trostin, Structure of hydrated complexes formed by metal ions of Groups I—III of the Periodic Table in aqueous electrolyte solutions under ambient conditions, Russ. Chem. Bull., 2003, 52, 1253–1271, DOI:10.1023/A:1024850421598.
- B. Hribar, N. T. Southall, V. Vlachy and K. A. Dill, How Ions Affect the Structure of Water, J. Am. Chem. Soc., 2002, 124, 12302–12311, DOI:10.1021/ja026014h.
- L. Suo, O. Borodin, T. Gao, M. Olguin, J. Ho, X. Fan, C. Luo, C. Wang and K. Xu, “Water-in-salt” electrolyte enables high-voltage aqueous lithium-ion chemistries, Science, 2015, 350, 938–943 CrossRef CAS PubMed.
- L. Suo, F. Han, X. Fan, H. Liu, K. Xu and C. Wang, “Water-in-Salt” electrolytes enable green and safe Li-ion batteries for large scale electric energy storage applications, J. Mater. Chem. A, 2016, 4, 6639–6644 RSC.
- G. Perron, D. Brouillette and J. E. Desnoyers, Comparison of the thermodynamic and transport properties of lithium bis(trifluoromethylsulfonyl)imide (LiTFSI) with LiClO4 and Bu4NBr in water at 25 °C, Can. J. Chem., 1997, 75, 1608–1614 CrossRef CAS.
- Y. Yamada, K. Usui, K. Sodeyama, S. Ko, Y. Tateyama and A. Yamada, Hydrate-melt electrolytes for high-energy-density aqueous batteries, Nat. Energy, 2016, 1, 16129 CrossRef CAS.
- S. Ko, Y. Yamada, K. Miyazaki, T. Shimada, E. Watanabe, Y. Tateyama, T. Kamiya, T. Honda, J. Akikusa and A. Yamada, Lithium-salt monohydrate melt: A stable electrolyte for aqueous lithium-ion batteries, Electrochem. Commun., 2019, 104, 106488 CrossRef CAS.
- K. Miyazaki, N. Takenaka, E. Watanabe, S. Iizuka, Y. Yamada, Y. Tateyama and A. Yamada, First-Principles Study on the Peculiar Water Environment in a Hydrate-Melt Electrolyte, J. Phys. Chem. Lett., 2019, 10, 6301–6305 CrossRef CAS PubMed.
- Y. Yamada and A. Yamada, Superconcentrated Electrolytes to Create New Interfacial Chemistry in Non-aqueous and Aqueous Rechargeable Batteries, Chem. Lett., 2017, 46, 1056–1064 CrossRef.
- N. Ueno, M. Takegoshi, A. Zaitseva, Y. Ozaki and Y. Morisawa, Experimental verification of the increased electronic excitation energy of water in hydrate-melt via ATR-far ultraviolet spectroscopy, J. Chem. Phys., 2022, 156, 07405 CrossRef PubMed.
- S. Hashimoto, K. Seki, N. Sato and H. Inokuchi, Electronic properties of polymers. Anisotropic light absorption and photoelectron emission of oriented polyethylene films in the vacuum ultraviolet region, J. Chem. Phys., 1982, 76, 163–172 CrossRef CAS.
- H. Sato, N. Higashi, A. Ikehata, N. Koide and Y. Ozaki, Potential of Far-Ultraviolet Absorption Spectroscopy as a Highly Sensitive Qualitative and Quantitative Analysis Method for Polymer Films, Part I: Classification of Commercial Food Wrap Films, Appl. Spectrosc., 2007, 61, 780–783 CrossRef CAS PubMed.
- Y. Morisawa, E. Tanimura, M. Ehara and H. Sato, Attenuated Total Reflection–Far-Ultraviolet Spectroscopy and Quantum Chemical Calculations of the Electronic Structure of the Top Surface and Bulk of Polyethylene with Different Crystallinities, Appl. Spectrosc., 2021, 75, 971–979 CrossRef CAS PubMed.
- J. Warner, F. Schaffel, M. Rummeli and A. Bachmatiuk, Graphene: Fundamentals and emergent applications, Elsevier, Amsterdam, 1st edn, 2013 Search PubMed.
- A. H. C. Neto, F. Guinea, N. M. R. Peres, K. S. Novoselov and A. K. Geim, The electronic properties of graphene, Rev. Mod. Phys., 2009, 81, 109–162, DOI:10.1103/RevModPhys.81.109.
- G. Yang, L. Li, W. B. Lee and M. C. Ng, Structure of graphene and its disorders: a review, Sci. Technol. Adv. Mater., 2018, 19, 613–648, DOI:10.1080/14686996.2018.1494493.
- K. B. Beć, Y. Morisawa, K. Kobashi, J. Grabska, I. Tanabe and Y. Ozaki, Electronic Spectra of Graphene in Far- and Deep-Ultraviolet Region: Attenuated Total Reflection Spectroscopy and Quantum Chemical Calculation Study, J. Phys. Chem. C, 2018, 122, 28998–29008, DOI:10.1021/acs.jpcc.8b08089.
- D. M. Applin, M. R. M. Izawa, E. A. Cloutis, J. J. Gillis-Davis, K. M. Pitman, T. L. Roush, A. R. Hendrix and P. G. Lucey, Ultraviolet spectral reflectance of carbonaceous materials, Icarus, 2018, 307, 40–82, DOI:10.1016/j.icarus.2018.02.012.
- N. A. Manikandan, K. Pakshirajan and G. Pugazhenthi, Preparation and characterization of environmentally safe and highly biodegradable microbial polyhydroxybutyrate (PHB) based graphene nanocomposites for potential food packaging applications, Int. J. Biol. Macromol., 2020, 154, 866–877, DOI:10.1016/j.ijbiomac.2020.03.084.
- E. A. Taft and H. R. Philipp, Optical Properties of Graphite, Phys. Rev., 1965, 138, A197–A202, DOI:10.1103/PhysRev.138.A197.
- K. F. Mak, L. Ju, F. Wang and T. F. Heinz, Optical spectroscopy of graphene: From the far infrared to the ultraviolet, Solid State Commun., 2012, 152, 1341–1349, DOI:10.1016/j.ssc.2012.04.064.
- S. Bhandari, M. Deepa, A. G. Joshi, A. P. Saxena and A. K. Srivastava, Revelation of graphene-Au for direct write deposition and characterization, Nanoscale Res. Lett., 2011, 6, 424, DOI:10.1186/1556-276X-6-424.
- S. R. Sahu, M. M. Devi, P. Mukherjee, P. Sen and K. Biswas, Optical Property Characterization of Novel Graphene-X (X = Ag, Au and Cu) Nanoparticle Hybrids, J. Nanomater., 2013, 2013, 232409, DOI:10.1155/2013/232409.
- M. F. Budyka, E. F. Sheka and N. A. Popova, Graphene quantum dots: theory and experiment, Rev. Adv. Mater. Sci., 2017, 51, 35–49 CAS.
- V. Suendo and S. Viridi, Ab initio calculation of UV-vis absorption spectra of a single molecule chlorophyll a: Comparison study between RHF/CIS, TDDFT, and semi-empirical methods, ITB J. Sci., 2012, 44, 93–112, DOI:10.5614/itbj.sci.2012.44.2.1.
- N. Suzuki, Y. Wang, P. Elvati, Z.-B. Qu, K. Kim, S. Jiang, E. Baumeister, J. Lee, B. Yeom, J. H. Bahng, J. Lee, A. Violi and N. A. Kotov, Chiral Graphene Quantum Dots, ACS Nano, 2016, 10, 1744–1755, DOI:10.1021/acsnano.5b06369.
- A. M. Pinto and F. D. Magalhães, Graphene–Polymer Composites, Polymers, 2021, 13, 685, DOI:10.3390/polym13050685.
- T. Ramanathan, A. A. Abdala, S. Stankovich, D. A. Dikin, M. Herrera-Alonso, R. D. Piner, D. H. Adamson, J. Liu, R. S. Ruoff, S. T. Nguyen, I. Lhan, A. Aksay, R. K. Prud’homme and L. C. Brinson, Functionalized graphene sheets for polymer nanocomposites, Nat. Nanotechnol., 2008, 3, 327–331, DOI:10.1038/nnano.2008.96.
- H. Kim, A. A. Abdala and C. W. Macosko, Graphene/Polymer Nanocomposites, Macromolecules, 2010, 43, 6515–6530, DOI:10.1021/ma100572e.
- T. Welton, Chem. Rev., 1999, 99, 2071 CrossRef CAS PubMed.
- P. Hapiot and C. Lagrost, Chem. Rev., 2008, 108, 2238 CrossRef CAS PubMed.
- A. Shirai, K. Fujii, S. Seki, Y. Umebayashi, S. Ishiguro and Y. Ikeda, Anal. Sci., 2008, 24, 1377 CrossRef PubMed.
- M. Castriota, T. Caruso, R. G. Agostino, E. Cazzanelli, W. A. Henderson and S. Passerini, J. Phys. Chem. A, 2005, 109, 92 CrossRef CAS PubMed.
- Q. Huang, T. C. Lourenço, L. T. Costa, Y. Zhang, E. J. Maginn and B. Gurkan, J. Phys. Chem. B, 2019, 123, 516 CrossRef CAS PubMed.
- Y. Umebayashi, T. Mitsugi, S. Fukuda, T. Fujimori, K. Fujii, R. Kanzaki, M. Takeuchi and S. Ishiguro, J. Phys. Chem. B, 2007, 111, 13028 CrossRef CAS PubMed.
- J.-C. Lassègues, J. Grondin, C. Aupetit and P. Johansson, J. Phys. Chem. A, 2009, 113, 305 CrossRef PubMed.
- C. W. Bauschlicher, Jr., J. B. Haskins, E. W. Bucholz and J. W. Lawson, J. Phys. Chem. B, 2014, 118, 10785 CrossRef PubMed.
- O. Borodin, G. D. Smith and W. Henderson, J. Phys. Chem. C, 2006, 110, 16879 CrossRef CAS PubMed.
- V. Lesch, Z. Li, D. Bedrov, O. Borodind and A. Heuer, Phys. Chem. Chem. Phys., 2016, 18, 382 RSC.
- O. Borodin, G. A. Giffin, A. Moretti, J. B. Haskins, J. W. Lawson, W. A. Henderson and S. Passerini, J. Phys. Chem. C, 2018, 122, 2010 CrossRef PubMed.
- T. Ogura, N. Akai, A. Kawai and K. Shibuya, Chem. Phys. Lett., 2013, 555, 110 CrossRef CAS.
- R. Katoh, Y. Yoshida, Y. Katsumura and K. Takahashi, J. Phys. Chem. B, 2007, 111, 4770 CrossRef CAS PubMed.
- R. Katoh, M. Hara and S. Tsuzuki, J. Phys. Chem. B, 2008, 112, 15426 CrossRef CAS PubMed.
- T. Ogura, N. Akai, K. Shibuya and A. Kawai, J. Phys. Chem. B, 2013, 117, 8547 CrossRef CAS PubMed.
- I. Tanabe, A. Suyama, T. Sato and K. Fukui, Analyst, 2018, 143, 2539 RSC.
- M. Imai, I. Tanabe, A. Ikehata, Y. Ozaki and K. I. Fukui, Phys. Chem. Chem. Phys., 2020, 22, 21768 RSC.
- G. Horowitz, Organic field-effect transistors, Adv. Mater., 1998, 10, 365–377 CrossRef CAS.
- M. Muccini, A bright future for organic field-effect transistors, Nat. Mater., 2006, 5, 605–613 CrossRef CAS PubMed.
- H. Li, W. Shi, J. Song, H. J. Jang, J. Dailey, J. Yu and H. E. Katz, Chemical and Biomolecule Sensing with Organic Field-Effect Transistors, Chem. Rev., 2019, 119, 3–35 CrossRef CAS PubMed.
- H. Shimotani, G. Diguet and Y. Iwasa, Direct comparison of field-effect and electrochemical doping in regioregular poly(3-hexylthiophene), Appl. Phys. Lett., 2005, 86, 022104 CrossRef.
- M. J. Panzer and C. D. Frisbie, Polymer electrolyte gate dielectric reveals finite windows of high conductivity in organic thin film transistors at high charge carrier densities, J. Am. Chem. Soc., 2005, 127, 6960–6961 CrossRef CAS PubMed.
- E. Said, X. Crispin, L. Herlogsson, S. Elhag, N. D. Robinson and M. Berggren, Polymer field-effect transistor gated via a poly(styrenesulfonic acid) thin film, Appl. Phys. Lett., 2006, 89, 143507 CrossRef.
- T. Uemura, R. Hirahara, Y. Tominari, S. Ono, S. Seki and J. Takeya, Electronic functionalization of solid-to-liquid interfaces between organic semiconductors and ionic liquids: Realization of very high performance organic single-crystal transistors, Appl. Phys. Lett., 2008, 93, 263305 CrossRef.
- Y. Xia, J. H. Cho, J. Lee, P. P. Ruden and C. D. Frisbie, Comparison of the Mobility-Carrier Density Relation in Polymer and Single-Crystal Organic Transistors Employing Vacuum and Liquid Gate Dielectrics, Adv. Mater., 2009, 21, 2174–2179 CrossRef CAS.
- S. Maruyama, Y. Takeyama and Y. Matsumoto, Electrochemical Characterization of Pentacene Thin Films in Vacuum with an Ionic Liquid as Electrolyte, Appl. Phys. Express, 2011, 4, 051602 CrossRef.
- K. Eguchi, M. M. Matsushita and K. Awaga, Ionic liquid thin layer-induced memory effects in organic field-effect transistors, Phys. Chem. Chem. Phys., 2019, 21, 18823–18829 RSC.
- T. Fujimoto, M. M. Matsushita and K. Awaga, Ionic-Liquid Component Dependence of Carrier Injection and Mobility for Electric-Double-Layer Organic Thin-Film Transistors, J. Phys. Chem. C, 2012, 116, 5240–5245 CrossRef CAS.
- S. Ono, K. Miwa and S. Seki, Determination of optimal ionic liquid for organic single-crystal field-effect transistors, Appl. Phys. Lett., 2016, 108, 063301 CrossRef.
- E. Lim, T. Manaka and M. Iwamoto, Analysis of carrier injection into a pentacene field effect transistor by optical second harmonic generation measurements, J. Appl. Phys., 2007, 101, 024515 CrossRef.
- T. Manaka, E. Lim, R. Tamura and M. Iwamoto, Modulation in optical second harmonic generation signal from channel of pentacene field effect transistors during device operation, Appl. Phys. Lett., 2005, 87, 222107 CrossRef.
- H. Ye, J. Huang, J.-R. Park, H. E. Katz and D. H. Gracias, Correlations between SFG Spectra and Electrical Properties of Organic Field Effect Transistors, J. Phys. Chem. C, 2007, 111, 13250–13255 CrossRef CAS.
- H. Ye, A. Abu-Akeel, J. Huang, H. E. Katz and D. H. Gracias, Probing organic field effect transistors in situ during operation using SFG, J. Am. Chem. Soc., 2006, 128, 6528–6529 CrossRef CAS PubMed.
- L. G. Kaake, Y. Zou, M. J. Panzer, C. D. Frisbie and X. Y. Zhu, Vibrational spectroscopy reveals electrostatic and electrochemical doping in organic thin film transistors gated with a polymer electrolyte dielectric, J. Am. Chem. Soc., 2007, 129, 7824–7830 CrossRef CAS PubMed.
- J. Lee, L. G. Kaake, J. H. Cho, X. Y. Zhu, T. P. Lodge and C. D. Frisbie, Ion Gel-Gated Polymer Thin-Film Transistors: Operating Mechanism and Characterization of Gate Dielectric Capacitance, Switching Speed, and Stability, J. Phys. Chem. C, 2009, 113, 8972–8981 CrossRef CAS.
- S. Kumagai, A. Yamamura, T. Makita, J. Tsurumi, Y. Y. Lim, T. Wakimoto, N. Isahaya, H. Nozawa, K. Sato, M. Mitani, T. Okamoto, S. Watanabe and J. Takeya, Scalable Fabrication of Organic Single-Crystalline Wafers for Reproducible TFT Arrays, Sci. Rep., 2019, 9, 15897 CrossRef PubMed.
- T. Makita, S. Kumagai, A. Kumamoto, M. Mitani, J. Tsurumi, R. Hakamatani, M. Sasaki, T. Okamoto, Y. Ikuhara, S. Watanabe and J. Takeya, High-performance, semiconducting membrane composed of ultrathin, single-crystal organic semiconductors, Proc. Natl. Acad. Sci. U. S. A., 2020, 117, 80–85 CrossRef CAS PubMed.
- S. Matsuoka, J. Tsutsumi, T. Kamata and T. Hasegawa, Microscopic gate-modulation imaging of charge and field distribution in polycrystalline organic transistors, J. Appl. Phys., 2018, 123, 135301 CrossRef.
- T. L. Atallah, M. V. Gustafsson, E. Schmidt, C. D. Frisbie and X. Y. Zhu, Charge Saturation and Intrinsic Doping in Electrolyte-Gated Organic Semiconductors, J. Phys. Chem. Lett., 2015, 6, 4840–4844 CrossRef CAS PubMed.
- M. W. Knight, L. F. Liu, Y. M. Wang, L. Brown, S. Mukherjee, N. S. King, H. O. Everitt, P. Nordlander and N. J. Halas, Nano Lett., 2012, 12, 6000–6004 CrossRef CAS PubMed.
- J. R. Lakowicz, B. Shen, Z. Gryczynski, S. D'Auria and I. Gryczynski, Biochem. Biophys. Res. Commun., 2001, 286, 875–879 CrossRef CAS PubMed.
- M. Kikawada, A. Ono, W. Inami and Y. Kawata, Anal. Chem., 2016, 88, 1407–1411 CrossRef CAS PubMed.
- T. Dorfer, M. Schmitt and J. Popp, J. Raman Spectrosc., 2007, 38, 1379–1382 CrossRef.
- S. K. Jha, Z. Ahmed, M. Agio, Y. Ekinci and J. F. Loffler, J. Am. Chem. Soc., 2012, 134, 1966–1969 CrossRef CAS PubMed.
- B. Sharma, M. F. Cardinal, M. B. Ross, A. B. Zrimsek, S. V. Bykov, D. Punihaole, S. A. Asher, G. C. Schatz and R. P. Van Duyne, Nano Lett., 2016, 16, 7968–7973 CrossRef CAS PubMed.
- J. Malicka, I. Gryczynski, Z. Gryczynski and J. R. Lakowicz, J. Phys. Chem. B, 2004, 108, 19114–19118 CrossRef CAS PubMed.
- Y. Watanabe, W. Inami and Y. Kawata, J. Appl. Phys., 2011, 109, 023112 CrossRef.
- B. Liedberg, C. Nylander and I. Lunström, Sens. Actuators, 1983, 4, 299–304 CrossRef CAS.
- K. S. Phillips and Q. Cheng, Anal. Bioanal. Chem., 2007, 387, 1831–1840 CrossRef CAS PubMed.
- J. Homola, Chem. Rev., 2008, 108, 462–493 CrossRef CAS PubMed.
- I. Tanabe, Y. Y. Tanaka, K. Watari, T. Hanulia, T. Goto, W. Inami, Y. Kawata and Y. Ozaki, Far- and deep-ultraviolet surface plasmon resonance sensors working in aqueous solutions using aluminum thin films, Sci. Rep., 2017, 7, 5934, DOI:10.1038/s41598-017-06403-9.
- I. Tanabe, Y. Y. Tanaka, T. Ryoki, K. Watari, T. Goto, M. Kikawada, W. Inami, Y. Kawata and Y. Ozaki, Opt. Express, 2016, 24, 21886–21896 CrossRef CAS PubMed.
- I. Tanabe, Y. Y. Tanaka, K. Watari, T. Hanulia, T. Goto, W. Inami, Y. Kawata and Y. Ozaki, Chem. Lett., 2017, 46, 1560–1563 CrossRef CAS.
- I. Tanabe and Y. Y. Tanaka, Chem. Rec., 2019, 19, 1210 CrossRef CAS PubMed.
- I. Tanabe, M. Shimizu, R. Kawabata, C. Katayama and K. Fukui, Sens. Actuators, A, 2020, 301, 111661 CrossRef CAS.
- I. Tanabe, Y. Y. Tanaka, K. Watari, W. Inami, Y. Kawata and Y. Ozaki, Sci. Rep., 2020, 10, 9938 CrossRef CAS PubMed.
- S. P. A. Fodor, R. P. Rava, T. R. Hays and T. G. Spiro, J. Am. Chem. Soc., 1985, 107, 1520–1529 CrossRef CAS.
- T. Goto, A. Ikehata, Y. Morisawa and Y. Ozaki, J. Phys. Chem. A, 2013, 117, 2517–2528 CrossRef CAS PubMed.
- Y. Uchiho, Y. Goto, M. Kamahori, T. Aota, A. Morisaki, Y. Hosen and K. Koda, J. Chromatogr. A, 2015, 1424, 86–91 CrossRef CAS PubMed.
- G. H. Chan, J. Zhao, G. C. Schatz and R. P. Van Duyne, J. Phys. Chem. C, 2008, 112, 13958–13963 CrossRef CAS.
- M. Norek, M. Wlodarski and P. Matysik, Curr. Appl. Phys., 2014, 14, 1514–1520 CrossRef.
- W. B. Li, L. Zhang, J. H. Zhou and H. K. Wu, J. Mater. Chem. C, 2015, 3, 6479–6492 RSC.
- W. B. Li, Y. C. Qiu, L. Zhang, L. L. Jiang, Z. K. Zhou, H. J. Chen and J. H. Zhou, Biosens. Bioelectron., 2016, 79, 500–507 CrossRef CAS PubMed.
- M. Couture, K. K. Ray, H. P. Poirier-Richard, A. Crofton and J. F. Masson, ACS Sens., 2016, 1, 287–294 CrossRef CAS.
- K. Hashimoro, Y. Morisawa, M. Tortora, B. Roaai, Y. Ozaki and H. Sto, Appl. Spectrosc., 2022, 76, 793 CrossRef PubMed.
| This journal is © The Royal Society of Chemistry 2024 |


