
 Open Access Article
 This Open Access Article is licensed under a
 Creative Commons Attribution 3.0 Unported Licence
Density functional calculations of diffusion paths of CH3Sad on c(2 × 2)-Cl and -Br covered Cu(100) surfaces†
Falk
Wendorff
 *a and
Eckhard
Pehlke
ab
*a and
Eckhard
Pehlke
ab
aInstitut für Theoretische Physik und Astrophysik, Christian-Albrechts-Universität zu Kiel, Olshausenstr. 40, 24098 Kiel, Germany. E-mail: wendorff@physik.uni-kiel.de
bKiel Nano, Surface and Interface Science KiNSIS, Kiel University, Germany
First published on 27th November 2024
Abstract
Identification of the atomic-scale mechanisms of surface diffusion at interfaces covered by co-adsorbates is relevant for understanding electrochemical processes at these interfaces. The surface dynamics of CH3Sad on c(2 × 2)-Cl covered Cu(100) surfaces has been studied with video-STM in electrochemical environment by Yang, Taranowski, and Magnussen [Langmuir, 2012, 28, 14143]. We present density functional calculations to predict diffusion paths and energy barriers of CH3Sad substitutionally adsorbed on c(2 × 2)-Cl or -Br covered Cu(100) surfaces and compare them to the case of Sad. Additional vacancies in the halogen adlayer enable further diffusion paths with significantly lower DFT energy barriers (i.e. energy barriers in case of uncharged surfaces vs. vacuum). We argue that at least in case of Cl-covered surfaces this preference for vacancy-assisted diffusion of CH3Sad persists when the energy for creating a Cl-vacancy is accounted for. However, we have not yet been able to include the effect of the electric field on the computed energy barriers for this system, which might affect the preferred diffusion mechanism.
1 Introduction
Given their crucial role in the fields of e.g. energy conversion, corrosion, electro-catalysis, and electro-deposition, processes at electrochemical interfaces are investigated intensely.2–4 In particular, an atomic-scale understanding of the diffusion mechanism of ad-particles at the interfaces is needed.5 This can be complicated by the presence of a mono-layer of specifically adsorbed (e.g. halide) ions from the electrolyte, which are blocking adsorption sites of the diffusing species. Halides are known to affect growth (e.g. damascene Cu plating,6,7 electrochemical annealing8) as well as electrocatalytical processes2,9 at interfaces.Rahn et al.1 have studied the diffusion of Sad on a Cu(100) surface with a c(2 × 2) halide coverage. Despite the chemical similarity of Cl and Br, they found distinct differences of Sad tracer atom diffusion between these co-adsorbates. These differences have been traced back to qualitatively different (i.e. rotation and exchange) diffusion paths of the sulfur adatom.
Furthermore, the diffusion dynamics of CH3Sad on c(2 × 2)-Cl covered Cu(100) surfaces has been studied with video-STM by Yang et al.10 Here we present density functional calculations in order to compare diffusion paths of CH3Sad on Cu(100) surfaces covered by either a c(2 × 2)-Cl or a c(2 × 2)-Br monolayer. A diffusion path similar to the rotation diffusion path by Rahn et al. of the sulfur adatom will be examined. In addition, further diffusion paths enabled by the presence of a nearby vacancy in the c(2 × 2) halogen adlayer will be presented. Results for CH3Sad will be compared with the diffusion of Sad. The probability of vacancies in the halogen layer will be discussed. Our findings emphasize the need to consider vacancy-assisted diffusion and pave the way for future calculations including electrolyte and electric field effects.
2 Computational details
All DFT calculations have been performed with codes from the Quantum ESPRESSO program package, version 6.7.11–13 The electronic structure has been assumed spin-unpolarized. This has been confirmed by two test calculations allowing for spin-polarization for a configuration with CH3Sad in the adsorption configuration and at the transition state. In both cases an initial spin polarization at the S-atom disappeared during the electronic relaxation (i.e. it is transferred to the unique Fermi level of the non-magnetic Cu substrate). The generalized gradient approximation (GGA) for the exchange correlation energy-functional according to Perdew–Burke–Ernzerhof (PBE)14 has been used. Ultra-soft PBE-GGA pseudopotentials (USPP) have been taken from the databases.15–17 The surfaces are simulated by a slab geometry with a p(6 × 6) surface unit cell of the Cu(100) substrate and six Cu layers. The supercell is charge-neutral, i.e. any local ionic charges are compensated by a surface image charge density of the metal substrate. Atoms of the bottom two Cu layers are fixed at their bulk positions. The theoretical Cu bulk lattice constant amounts to 3.637 Å, which compares well to other authors.18–23 The top four substrate layers as well as all adsorbate positions are relaxed. A grid of 4 × 4 × 1 k-points evenly distributed over the first 2D-Brillouin zone of the surface lattice according to Monkhorst and Pack24 is used. This results in eight inequivalent k-points (only making use of time-reversal symmetry, but disregarding any spacial symmetries). The Fermi surface smearing method according to Methfessel and Paxton is applied.25 The width of the vacuum between the slabs amounts to at least 16 Å. As the slabs are asymmetric, a dipole correction is applied. The cut-off energy of the plane-waves basis set is set to 35 Ry.The equilibrium atomic geometries of the initial and final configurations and further energy minimum-configurations along the diffusion paths are found by ionic relaxation, where the residual forces on the ions must be smaller than 10−4 Ry a0−1 and the estimated error of the energy due to the electronic convergence must be smaller than 10−6 Ry.
To calculate the diffusion paths and the corresponding variations of energy and dipole moment along the paths, the nudged elastic band (NEB) method together with a climbing image (CI) as implemented in PWneb (neb.x) from Quantum ESPRESSO has been used.26–28 The NEB calculations are assumed to have converged if the force perpendicular to the path on every image is smaller than 0.05 eV Å−1 ≈ 2 × 10⁻³ Ry a0−1. Dipole moments are calculated with the threshold for the electronic convergence set to 10−8 Ry. The change in surface dipole moment Δμ is defined as the difference between the component of the electric dipole moment perpendicular to the surface in the transition state and in the initial state. It is related to the induced change in the workfunction of the surface ΔW, Δμ = −(ε0A/|e|)ΔW where A is the surface area of the periodically repeated supercell and ε0 the vacuum permittivity.
With these convergence parameters the estimated accuracy of energy differences between a single adsorbate atom at the bridge or hollow site amounts to about ±0.02 eV and the accuracy of dipole moment differences amounts to about ±4 me Å with respect to plane-wave energy cutoff, k-point set, width of vacuum and number of substrate layers (for the convergence analysis, see ESI†). Note that in case of Sad and CH3Sad diffusion paths with a larger number of adsorbate atoms dislocated along the diffusion path the uncertainties will be larger than for above simple configurations, the authors of ref. 1 obtain an uncertainty of ±0.1 eV for the Sad rotation diffusion path. The above estimate does not include any inaccuracy due to the choice of the approximate exchange correlation-energy functional, which is expected to be larger.‡![[thin space (1/6-em)]](https://www.rsc.org/images/entities/char_2009.gif) 29–32 Moreover, the electrolyte has not been accounted for in our DFT computations.
29–32 Moreover, the electrolyte has not been accounted for in our DFT computations.
3 Results
3.1 Diffusion on the Cu(100) surface
CH3Sad, either emerging from the dissociation of methanethiol (CH3SH)33,34 or dimethyl disulfide (CH3SSCH3)35 deposited on the Cu(100) surface, adsorbs with the sulfur atom in a hollow position of the substrate surface and the S–C bond perpendicular to the surface.33–35 Similar to the case of Sad on Cu(100),36 we have investigated the diffusion of the CH3Sadvia the bridge site of the Cu(100) substrate as shown in Fig. 1. | ||
| Fig. 1 Atomic configurations (initial, transition and final state) along the diffusion path of CH3Sad on the Cu(100) surface (brown: Cu, yellow: S, black: C, white: H). | ||
The energy barrier for CH3Sad is 511 meV. It is less than the energy barrier of 904 meV for Sad (see Fig. 2). Our calculated value is in good agreement with the 881 meV diffusion energy barrier for Sad calculated by Bernard Rodríguez et al.,36 despite the different cell size and the different exchange correlation functional. We suppose that the reduction of the energy barrier can be rationalized in the following way: in case of CH3Sad one of the three p-orbitals of the sulfur atom is bonding to the carbon atom of the methyl group. When the sulfur atom approaches the bridge site, the CH3Sad tilts with respect to the surface normal. Thereby a more favorable bonding configuration between the two p-orbitals perpendicular to the S–C direction and the Cu substrate atoms is achieved.37 Thus the energy barrier is smaller for a molecule that is tilted than for one artificially kept upright along the diffusion path. At the transition state, on the Cu(100) surface without a halogen adlayer, the S–C bond is tilted by 55° with respect to the surface normal, which is similar to the tilt angle on an unreconstructed Au(111) surface.37,38 The diffusion energy barrier of CH3Sad is significantly reduced as compared to the diffusion of Sad. The additional motion of the methyl group along the diffusion path leads to a distinctly longer path in case of CH3Sad than for Sad (for more information see ESI†). Note that in Fig. 2 the energy is plotted versus a scaled reaction coordinate.
 | ||
| Fig. 2 Variation of the total energy along the diffusion path for Sad and CH3Sad on Cu(100). | ||
3.2 Diffusion in the presence of a c(2 × 2) halogen adlayer
The diffusion path of CH3Sad on a Cu(100) surface in the presence of a c(2 × 2) adlayer of halogen coadsorbates has been constructed starting from the rotation path of Sad diffusing on such a surface proposed by Rahn et al.1 We have reproduced their results (for a comparison see ESI†). Then we have added a methyl group on top of the sulfur. Note that this procedure does not apply to their exchange diffusion path, thus we restrict ourselves to a single CH3Sad diffusion path on the elsewise completely halogen-covered Cu substrate (Fig. 3). | ||
| Fig. 3 Atomic configurations along the rotation diffusion path of CH3Sad on a Cu(100) surface covered by a c(2 × 2) adlayer of Cl (green) or Br (red). Cl and Br relate to the halogen coverage, the number relates to the number of the image. The dashed line denotes the mirror to obtain the complete diffusion path. The last image shows the final state after the diffusion hop on the Br-covered Cu(100) surface. For details see ESI.† | ||
The energy variation along the rotation diffusion path of Sad and CH3Sad on the c(2 × 2)-Cl or -Br covered Cu(100) surface is compared in Fig. 4. In the first part of the path the sulfur atom moves to an adjacent hollow site of the substrate lattice. In the remaining (calculated) part of the diffusion path the halogen adatoms rearrange. The collective distortion and rearrangement of the halogens results in a variety of shallow local energy minima with energy barriers between them much smaller than the barrier evoked by the initial hop of the Sad. This is consistent with the known small Cl and Br diffusion energy barrier (Table S2 in ESI†). However, also the repulsion of the adsorbates determines the reaction path. Finally, the complete diffusion path is obtained from the calculated configurations (solid markers in Fig. 4) by application of a mirror symmetry. (A video showing the energy variation together with the atomic configurations for CH3Sad for the full path is available in the ESI.†) When the sulfur atom transverses the bridge site the CH3Sad becomes tilted. Consistent with the observation for diffusion on the clean surface, the corresponding (i.e. the first) energy barrier along the diffusion path is smaller in case of CH3Sad on c(2 × 2) halogen covered Cu(100) than for Sad on the halogen covered surface. The tilt angle between the S–C bond and the surface normal is slightly smaller than in the case of diffusion without halogen co-adsorbates. In case of the Cl adlayer it amounts to 42° and in case of the Br adlayer it is 24°.
 | ||
| Fig. 4 Variation of the total energy (top) and the surface dipole moment (bottom) along the diffusion path of Sad and CH3Sad on the c(2 × 2)-Cl or -Br covered Cu(100) surface. | ||
In an electrochemical environment, the activation energy for diffusion is known to depend on the sample potential ϕ.10,39 For constant (i.e. full c(2 × 2)) halide coverage and small potential difference with respect to the potential of zero charge of metal and adsorbate together, the expression by Giesen et al.40 reads
 | (1) |
3.3 Diffusion in the presence of a nearest neighbour vacancy in the halogen adlayer
If there is a vacancy in the halogen adlayer nearest neighbour to the Sad or the CH3Sad further diffusion paths emerge. As the halogens just relax (but do not have to rearrange as they do not occupy different adsorption sites along the diffusion path) the corresponding energy barriers are distinctly smaller than those found in case of the complete c(2 × 2) halogen layer. In case of Sad, vacancy-assisted diffusion paths have already been calculated by Stremme and Deuchler.1 In order to compare diffusion activation energies of CH3Sad to those of Sad, we have re-calculated the Sad diffusion paths using a p(6 × 6) surface unit cell and the PBE-GGA for the exchange–correlation energy functional. Our results for the diffusion of Sad in Table 1 are fully consistent with their previous data.1| Diffusion path | ΔEdiffDFT in eV | ΔμTS in e Å |
|---|---|---|
| a Note that a sign change of Δμ can occur along the diffusion path.1 | ||
| Sadc(2 × 2)-Cl rotation path | 1.24 | −0.30 |
| Sadc(2 × 2)-Cl exchange path1 | 1.831,43 | −0.23a1,43 |
| Sadc(2 × 2)-Br rotation path | 1.57 | −0.27 |
| Sadc(2 × 2)-Br exchange path1 | 1.481,43 | −0.29a1,43 |
| Sadc(2 × 2)-Cl vacancy path I | 0.95 | −0.04 |
| Sadc(2 × 2)-Cl vacancy path II | 1.28 | ≈0 |
| Sadc(2 × 2)-Br vacancy path I | 0.96 | −0.03 |
| Sadc(2 × 2)-Br vacancy path II | 1.14 | 0.01 |
| CH3Sadc(2 × 2)-Cl rotation path | 1.17 | −0.35 |
| CH3Sadc(2 × 2)-Br rotation path | 1.59 | −0.30 |
| CH3Sadc(2 × 2)-Cl vacancy path A | 0.69 | −0.11 |
| CH3Sadc(2 × 2)-Cl vacancy path B | 0.83 | −0.13 |
| CH3Sadc(2 × 2)-Cl vacancy path C | 0.66 | −0.09 |
| CH3Sadc(2 × 2)-Br vacancy path A | 0.81 | −0.05 |
| CH3Sadc(2 × 2)-Br vacancy path B | 0.78 | −0.09 |
| CH3Sadc(2 × 2)-Br vacancy path C | 0.69 | −0.05 |
We consider two paths (I and II) for the diffusion of Sad, as shown in Fig. 5 and 6. In path I, the Sad diffuses via the bridge positions to the vacancy site, while in path II a Cu atom is temporarily pushed out of the surface and the Sad can diffuse through the resulting Cu vacancy.
 | ||
| Fig. 5 Atomic configurations along the diffusion paths I and II of Sad on a Cu(100) surface covered by a c(2 × 2)-Cl adlayer with a vacancy in the halogen adlayer. Diffusion paths for the c(2 × 2)-Br adlayer are similar. Such paths have been investigated before.1 I and II relates to the path. Cl relates to the halogen coverage, the number relates to the number of the image. The dashed line denotes the mirror to obtain the complete diffusion path. The last image shows the final state after the diffusion hop. For details see ESI.† | ||
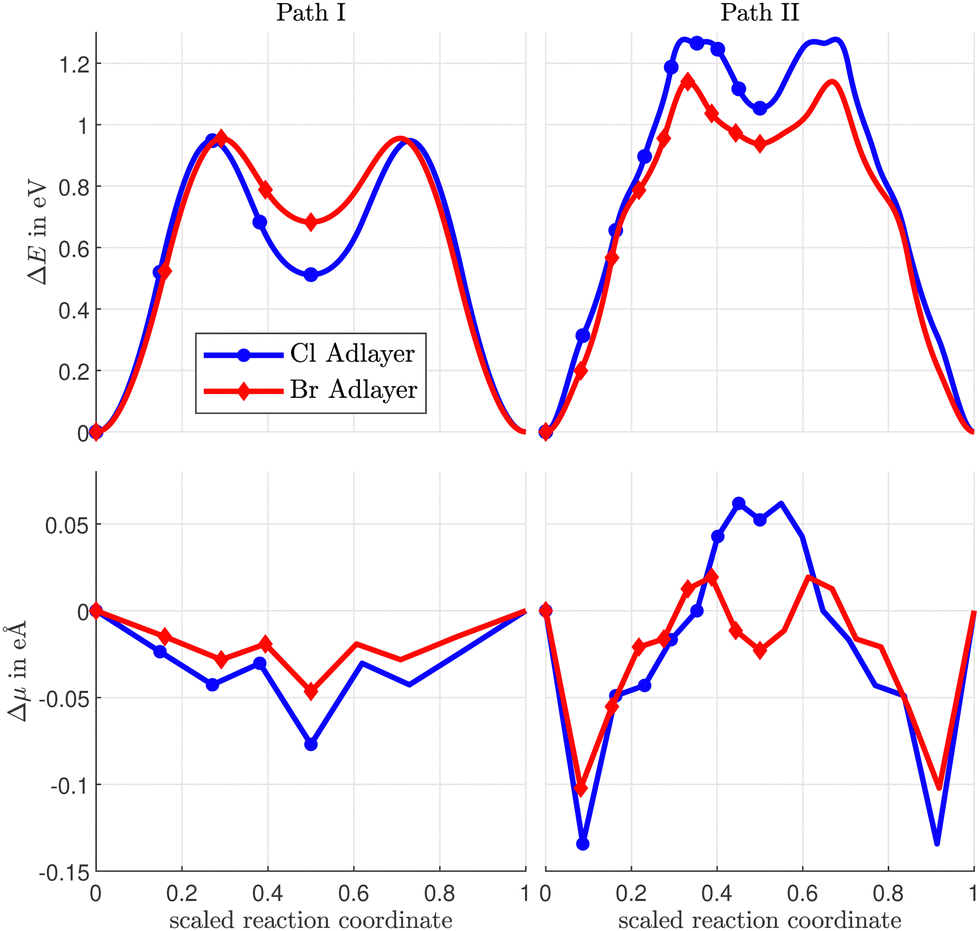 | ||
| Fig. 6 Variation of the total energy (top) and the electric dipole moment (bottom) along the Sad diffusion paths I and II on a Cu(100) surface with a vacancy in the Cl- or Br-coverage. | ||
Three different vacancy assisted diffusion paths for CH3Sad, A, B, and C are shown in Fig. 7, and the corresponding variation of total energy along the diffusion paths in Fig. 8. The energy expense needed to create the nn-vacancy in the halogen layer will be considered further below.
 | ||
| Fig. 7 Atomic configurations along the diffusion paths A, B and C of CH3Sad on a Cu(100) surface covered by a c(2 × 2)-Cl adlayer with a vacancy in the halogen adlayer. Diffusion paths for the c(2 × 2)-Br adlayer are similar. A, B and C relates to the path. Cl relates to the halogen coverage, the number relates to the number of the image. The dashed line denotes the mirror to obtain the complete diffusion path. The last image shows the final state after the diffusion hop. For details see ESI.† | ||
 | ||
| Fig. 8 Variation of the total energy (top) and the electric dipole moment (bottom) along the CH3Sad diffusion paths A, B and C on a Cu(100) surface with a vacancy in the Cl- or Br-coverage. | ||
Diffusion paths A and C differ in that path A has an additional energy minimum in the middle of the path, where the CH3Sad is close to neighboring halogens. Path B takes a more direct route between the initial and final states. As a result, path B is shorter than path A and C. The paths also differ in the direction in which the CH3-group is tilted. While in path A the CH3-group is tilted in the direction of the diffusion path, the tilting in path B and path C is partially at an angle to the diffusion path. (Videos of the diffusion paths can be found in the ESI.†)
The diffusion energy barriers (i.e. the maximum of the total energy increase ΔEdiffDFT along the diffusion paths) and the corresponding induced electric dipole moments ΔμTS = μ(TS) − μ(ads) are summarized in Table 1. In case of CH3Sad the diffusion paths A, B and C for the vacancy-assisted diffusion have significantly lower energy barriers than the rotation diffusion path. Among all considered calculated paths A, B, and C, in case of both halogen adlayers the diffusion path C turns out to be the most favorable one. However, vacancy assisted diffusion paths with energy barriers within some tens of meV can all contribute simultaneously to diffusion, and, moreover, are not distinguishable within the accuracy of DFT calculations, in particular in view of the approximate XC energy functionals. For all CH3Sad diffusion paths the variation of the electric dipole moment ΔμTS is negative. This is consistent with the displacement in the z-direction (i.e. perpendicular to the surface) of the negatively charged sulfur and halogen ad-atoms along the diffusion path. The effect is larger in case of the rotation path, due to the large outward displacements of the halogens in the z-direction. The z-coordinates of the halogens change less during diffusion of CH3Sad in the presence of a nearest neighbour halogen vacancy (see ESI†). ΔμTS is slightly positive in case of path II for the Br coadsorbate showing an inward motion of the diffusing Sad, in agreement with previous calculations.1
The energy barriers in the rotation paths differ only slightly between Sad and CH3Sad, since the CH3-group is not tilted in the transition state (1.24 eV vs. 1.17 eV for Cl and 1.57 eV vs. 1.59 eV for Br). The situation is different for the energy barriers of the vacancy paths over the bridge position. Since the CH3-group is tilted in the transition state, the energy barrier for CH3Sad is lower than for Sad. This is consistent with the results from the clean Cu(100) surface. As pointed out above, there is no analogue to the Sad exchange diffusion path on the c(2 × 2) halogen-covered surface in case of CH3Sad due to geometrical constraints.
3.4 Estimate of the frequency of halogen vacancies and its effect on vacancy-assisted diffusion
To obtain a rough estimate for the vacancy-assisted hopping rate of the CH3Sad on the halogen-covered Cu(100) surface we start from the expression| νhop = κν0e−βEdiff(ϕ) | (2) |
| ν = pvacκν0e−βEdiff(ϕ). | (3) |
To estimate the probability of a halogen vacancy in the c(2 × 2) halogen adlayer (without any co-adsorbed CH3Sad) as a function of sample potential in an electrochemical environment we follow the approach of Mitchell et al.,50,51 who applied an Ising-type lattice gas Hamiltonian,
 | (4) |
 the number of adsorbates, Jij the adatom interaction between sites i and j, and
 | (5) |
![[small mu, Greek, macron]](https://www.rsc.org/images/entities/i_char_e0cd.gif) 0 an energy reference.50 For above model Hamiltonian, with increasing potential there occurs a phase transition from a disordered (1 × 1) halide adlayer into a c(2 × 2) reconstructed adlayer.50 If the sample voltage where the order–disorder transition occurs is known from experiment, this can be used to adjust the μ(ϕ)-scale in eqn (5) to the sample voltage scale used in experiment. We shall make use of this procedure in case of the Cl-adlayer on Cu(100) further below.
0 an energy reference.50 For above model Hamiltonian, with increasing potential there occurs a phase transition from a disordered (1 × 1) halide adlayer into a c(2 × 2) reconstructed adlayer.50 If the sample voltage where the order–disorder transition occurs is known from experiment, this can be used to adjust the μ(ϕ)-scale in eqn (5) to the sample voltage scale used in experiment. We shall make use of this procedure in case of the Cl-adlayer on Cu(100) further below.
The Hamiltonian (4) can be re-formulated in terms of vacancies in the nearly complete c(2 × 2) adlayer. To this purpose the ci are set equal to zero for all sites of the unoccupied sublattice, and ci = 1 − σi, for all i running over the sites of the halide c(2 × 2) sublattice. Finally, interactions between different vacancies are neglected. This conforms to a Langmuir adsorption isotherm model applied to a low coverage of approximately non-interacting halide vacancies. The probability p(0)vac to observe a vacancy at a particular site (e.g. the i = 1 site) in the c(2 × 2) sublattice in this case becomes
 | (6) |
 | (7) |
 | (8) |
| Adsorbate | ΔEvacnn,DFT in meV | Δμvac in me Å |
|---|---|---|
| Sad/c(2 × 2)-Cl | −2 | 23 |
| Sad/c(2 × 2)-Br | 26 | 16 |
| CH3Sad/c(2 × 2)-Cl | 10 | 12 |
| CH3Sad/c(2 × 2)-Br | 33 | 5 |
In experiment, an effective activation energy of the diffusion process is derived by assuming an exponential relation between the hopping rate and −β times the effective activation energy. Then the activation energy can be plotted versus the sample potential ϕ.10 Using eqn (5) and (8) and neglecting any ϕ-dependence of the transmission factor κ, the slope of this curve is determined by the derivative of the energy in the exponent in eqn (8) with respect to the sample potential ϕ,
 | (9) |
 is expected to be positive.
Next we connect the zero of our halogen chemical potential scale with the sample potential as measured in experiment by using the order–disorder transition as a reference point. In the following we focus solely on the case of the Cl− adlayer on Cu(100). In surface X-ray diffraction experiments of Cl−-adsorption on Cu(100) the c(2 × 2) superstructure intensity is observed at sample potential more positive than ≈−0.62 VAg/AgCl and the Cl− adsorption/desorption with remaining c(2 × 2) superstructure is detected over a range of about 0.3 V before it saturates.65 As pointed out by Mitchell et al., in their Monte Carlo simulations the (1 × 1) to c(2 × 2) transition occurs at a halogen coverage similar to the critical coverage of the respective hard square model, Θcrit = 0.368.51,66 We roughly approximate the Cl coverage of the Cu(100) surface (at high coverage) by a Frumkin isotherm with adsorption sites restricted to a single c(2 × 2) sublattice of adsorption sites and the Cl–Cl interaction energy parameter  . The interaction energy b has been derived from the difference of the DFT adsorption energies of a Cl atom on either the clean (EClads(Cu(100))) or the elsewise fully c(2 × 2)-Cl covered Cu(100) surface (EClads(c(2 × 2)Cl/Cu(100))),
| b = EClads(c(2 × 2)Cl/Cu(100)) − EClads(Cu(100)). | (10) |
| = 0.29 [eV] − eγ(ϕAg/AgCl + 0.62 [V]). | (11) |
− 0.357 [eV], which is added to the barrier height Ediff(ϕ)) stays below 0.36 eV. Thus, as long as the effect of the electric field on the diffusion energy barriers is ignored, the vacancy assisted diffusion path of CH3Sad on c(2 × 2)-Cl/Cu(100) is preferred by at least 0.15 eV. However, as the electric dipole moment change along the diffusion path is distinctly more negative for the rotation path than for the vacancy-assisted diffusion path (see Table 1) we cannot exclude that a strong negative charge density on the sample surface might lead to a preference for the rotation path. At present we cannot quantify the electric field effect due to reasons explained above.
4 Conclusions
In this paper we have presented DFT-calculations for various diffusion paths of CH3Sad on c(2 × 2)-Cl or -Br covered Cu(100) surfaces and compare to the case of Sad diffusion on these surfaces. For CH3Sad substitutionally adsorbed in an elsewise complete c(2 × 2) overlayer of the halogen, we have generalized the rotation diffusion path by Rahn et al.1 for Sad. The DFT diffusion energy barrier (i.e. the diffusion energy barrier on an adsorbate-covered surface versus vacuum) for CH3Sad is 1.17 eV in case of the Cl-coadsorbate and 1.59 eV in case of Br. Furthermore, we have found diffusion paths assisted by vacancies in the halogen layer with considerably lower DFT diffusion energy barriers. For CH3Sad, in case of the Cl-coadsorbate the vacancy lowers the DFT energy barrier of the diffusion hop by 0.51 eV to a value of 0.66 eV and, in case of the Br-coadsorbate, by 0.89 eV to 0.69 eV. For Sad the reduction in the energy barrier is smaller, it amounts to 0.29 eV in case of the Cl adlayer and 0.52 eV in case of the Br adlayer.Within the range of Cl chemical potential covered by the video STM data by Yang et al.10 the energy expense to create vacancies in the c(2 × 2) adlayer is small enough so that, as long as variation of the energy barrier heights due to electric field effects are ignored, a vacancy-assisted diffusion path of the CH3Sad is preferred. However, including the variation of the energy barriers as a function of sample potential could alter this.
Experimentally, Yang et al. have reported a linear potential dependence of +0.5 eV V−1 for the diffusion barrier of CH3Sad on a Cu(100) surface with a c(2 × 2)-Cl adlayer.10 The sign of the slope is compatible with both diffusion mechanisms, the rotation diffusion path and the vacancy-assisted diffusion. Future calculations taking care of the electrochemical environment are thus desirable, which include the electrolyte and quantify the variation of the diffusion energy barriers Ediff(ϕ) with the sample potential ϕ.
Author contributions
Supervision by EP, DFT calculations and visualizations by FW, writing of manuscript by FW and EP.Data availability
The data that support the findings of this study are available from the corresponding author upon reasonable request.Conflicts of interest
There are no conflicts to declare.Acknowledgements
We are grateful to O. M. Magnussen for pointing out the diffusion systems to us and sharing his insights, and to L. Deuchler for providing his DFT data for Sad diffusion on halogen covered Cu(100). Helpful discussions with S. Buttenschön, in particular on his Monte Carlo data before publication, and M. Funk are gratefully acknowledged. This research was supported in part through high-performance computing resources available at the Kiel University Computing Centre.Notes and references
- B. Rahn, R. Wen, L. Deuchler, J. Stremme, A. Franke, E. Pehlke and O. M. Magnussen, Angew. Chem., Int. Ed., 2018, 57, 6065–6068 CrossRef CAS PubMed.
- A. S. Varela, W. Ju, T. Reier and P. Strasser, ACS Catal., 2016, 6, 2136–2144 CrossRef CAS.
- O. M. Magnussen, Chem. – Eur. J., 2019, 25, 12865 CrossRef CAS PubMed.
- O. M. Magnussen and A. Groß, J. Am. Chem. Soc., 2019, 141, 4777 CrossRef CAS.
- A.-K. Henß, S. Sakong, P. K. Messer, J. Wiechers, R. Schuster, D. C. Lamb, A. Groß and J. Wintterlin, Science, 2019, 363, 715 CrossRef.
- T. P. Moffat, D. Wheeler and D. Josell, J. Electrochem. Soc., 2004, 151, C262 CrossRef CAS.
- P. M. Vereecken, R. A. Binstead, H. Deligianni and P. C. Andricacos, IBM J. Res. Dev., 2005, 49, 3–18 CAS.
- E. Pichardo-Pedrero, G. L. Beltramo and M. Giesen, Appl. Phys. A: Mater. Sci. Process., 2007, 87, 461 CrossRef CAS.
- J. J. Masana, B. Peng, Z. Shuai, M. Qiu and Y. Yu, J. Mater. Chem. A, 2022, 10, 1086–1104 RSC.
- Y.-C. Yang, A. Taranovskyy and O. M. Magnussen, Langmuir, 2012, 28, 14143–14154 CrossRef CAS.
- P. Giannozzi, S. Baroni, N. Bonini, M. Calandra, R. Car, C. Cavazzoni, D. Ceresoli, G. L. Chiarotti, M. Cococcioni, I. Dabo, A. Dal Corso, S. de Gironcoli, S. Fabris, G. Fratesi, R. Gebauer, U. Gerstmann, C. Gougoussis, A. Kokalj, M. Lazzeri, L. Martin-Samos, N. Marzari, F. Mauri, R. Mazzarello, S. Paolini, A. Pasquarello, L. Paulatto, C. Sbraccia, S. Scandolo, G. Sclauzero, A. P. Seitsonen, A. Smogunov, P. Umari and R. M. Wentzcovitch, J. Phys.: Condens. Matter, 2009, 21, 395502 CrossRef PubMed.
- P. Giannozzi, O. Andreussi, T. Brumme, O. Bunau, M. B. Nardelli, M. Calandra, R. Car, C. Cavazzoni, D. Ceresoli, M. Cococcioni, N. Colonna, I. Carnimeo, A. D. Corso, S. de Gironcoli, P. Delugas, R. A. DiStasio, A. Ferretti, A. Floris, G. Fratesi, G. Fugallo, R. Gebauer, U. Gerstmann, F. Giustino, T. Gorni, J. Jia, M. Kawamura, H.-Y. Ko, A. Kokalj, E. Küçükbenli, M. Lazzeri, M. Marsili, N. Marzari, F. Mauri, N. L. Nguyen, H.-V. Nguyen, A. O. de-la Roza, L. Paulatto, S. Poncé, D. Rocca, R. Sabatini, B. Santra, M. Schlipf, A. P. Seitsonen, A. Smogunov, I. Timrov, T. Thonhauser, P. Umari, N. Vast, X. Wu and S. Baroni, J. Phys.: Condens. Matter, 2017, 29, 465901 CrossRef CAS PubMed.
- Quantum Espresso Foundation, Quantum Espresso v. 6.7, 2020, https://gitlab.com/QEF/q-e/-/releases/qe-6.7MaX-Release, accessed on May 24, 2021 Search PubMed.
- J. P. Perdew, K. Burke and M. Ernzerhof, Phys. Rev. Lett., 1996, 77, 3865–3868 CrossRef CAS.
- K. F. Garrity, J. W. Bennett, K. M. Rabe and D. Vanderbilt, Comput. Mater. Sci., 2014, 81, 446–452 CrossRef CAS.
- A. Dal Corso, Comput. Mater. Sci., 2014, 95, 337–350 CrossRef CAS.
- Quantum Espresso Foundation, Original QE PP library, 2008, https://pseudopotentials.quantum-espresso.org/legacy_tables/original-qe-pp-library, accessed on March 1, 2022 Search PubMed.
- K. Lejaeghere, V. V. Speybroeck, G. V. Oost and S. Cottenier, Crit. Rev. Solid State Mater. Sci., 2014, 39, 1–24 CrossRef CAS.
- P. Janthon, S. M. Kozlov, F. Viñes, J. Limtrakul and F. Illas, J. Chem. Theory Comput., 2013, 9, 1631–1640 CrossRef CAS.
- M. Harrison, D. Woodruff and J. Robinson, Surf. Sci., 2008, 602, 226–234 CrossRef CAS.
- S. Chen, S. Sun, B. Lian, Y. Ma, Y. Yan and S. Hu, Surf. Sci., 2014, 620, 51–58 CrossRef CAS.
- J. P. Perdew, S. Kurth, A. Zupan and P. Blaha, Phys. Rev. Lett., 1999, 82, 2544–2547 CrossRef CAS.
- A. Migani and F. Illas, J. Phys. Chem. B, 2006, 110, 11894–11906 CrossRef CAS PubMed.
- H. J. Monkhorst and J. D. Pack, Phys. Rev. B: Condens. Matter Mater. Phys., 1976, 13, 5188–5192 CrossRef.
- M. Methfessel and A. T. Paxton, Phys. Rev. B: Condens. Matter Mater. Phys., 1989, 40, 3616–3621 CrossRef CAS PubMed.
- G. Mills, H. Jónsson and G. K. Schenter, Surf. Sci., 1995, 324, 305–337 CrossRef CAS.
- D. Sheppard, R. Terrell and G. Henkelman, J. Chem. Phys., 2008, 128, 134106 CrossRef PubMed.
- G. Henkelman, B. P. Uberuaga and H. Jónsson, J. Chem. Phys., 2000, 113, 9901–9904 CrossRef CAS.
- J. J. Mortensen, K. Kaasbjerg, S. L. Frederiksen, J. K. Nørskov, J. P. Sethna and K. W. Jacobsen, Phys. Rev. Lett., 2005, 95, 216401 CrossRef CAS PubMed.
- K. Yang, J. Zheng, Y. Zhao and D. G. Truhlar, J. Chem. Phys., 2010, 132, 164117 CrossRef.
- Z. Wei, F. Göltl and P. Sautet, J. Chem. Theory Comput., 2021, 17, 7862–7872 CrossRef CAS PubMed.
- M. Schwarzer, N. Hertl, F. Nitz, D. Borodin, J. Fingerhut, T. N. Kitsopoulos and A. M. Wodtke, J. Phys. Chem. C, 2022, 126, 14500–14508 CrossRef CAS PubMed.
- A. Imanishi, S. Takenaka, T. Yokoyama, Y. Kitajima and T. Ohta, J. Phys. IV, 1997, 7, C2-701–C2-702 CrossRef.
- M. S. Kariapper, C. Fisher, D. P. Woodruff, B. C. C. Cowie and R. G. Jones, J. Phys.: Condens. Matter, 2000, 12, 2153–2161 CrossRef CAS.
- F. Bussolotti, M. G. Betti and C. Mariani, Phys. Rev. B: Condens. Matter Mater. Phys., 2006, 74, 125422 CrossRef.
- C. R. Bernard Rodríguez and J. A. Santana, J. Chem. Phys., 2018, 149, 204701 CrossRef.
- A. Franke and E. Pehlke, Phys. Rev. B: Condens. Matter Mater. Phys., 2010, 81, 075409 CrossRef.
- A. Franke and E. Pehlke, Phys. Rev. B: Condens. Matter Mater. Phys., 2009, 79, 235441 CrossRef.
- T. Tansel and O. M. Magnussen, Phys. Rev. Lett., 2006, 96, 026101 CrossRef CAS PubMed.
- M. Giesen, G. Beltramo, S. Dieluweit, J. Müller, H. Ibach and W. Schmickler, Surf. Sci., 2005, 595, 127–137 CrossRef CAS.
- M. Vogt, A. Lachenwitzer, O. Magnussen and R. Behm, Surf. Sci., 1998, 399, 49–69 CrossRef CAS.
- K. Schwarz, M. C. Groenenboom, T. P. Moffat, R. Sundararaman and J. Vinson, J. Phys. Chem. Lett., 2021, 12, 440–446 CrossRef CAS.
- L. Deuchler, private communication.
- G. H. Vineyard, J. Phys. Chem. Solids, 1957, 3, 121–127 CrossRef CAS.
- H. O. Pritchard, J. Phys. Chem. A, 2005, 109, 1400–1404 CrossRef CAS PubMed.
- D. G. Truhlar, B. C. Garrett and S. J. Klippenstein, J. Phys. Chem., 1996, 100, 12771–12800 CrossRef CAS.
- A. Franke and E. Pehlke, Phys. Rev. B: Condens. Matter Mater. Phys., 2010, 82, 205423 CrossRef.
- S. Kenny, J. Pethica and R. Edgell, Surf. Sci., 2003, 524, 141–147 CrossRef CAS.
- A. D. Leclaire and A. B. Lidiard, Philos. Mag., 1956, 1, 518–527 CrossRef CAS.
- S. Mitchell, G. Brown and P. Rikvold, J. Electroanal. Chem., 2000, 493, 68–74 CrossRef CAS.
- S. Mitchell, G. Brown and P. Rikvold, Surf. Sci., 2001, 471, 125–142 CrossRef CAS.
- N. G. Hörmann, N. Marzari and K. Reuter, npj Comput. Mater., 2020, 6, 136 CrossRef.
- M. Ávila, M. F. Juárez and E. Santos, ChemElectroChem, 2020, 7, 4269–4282 CrossRef.
- Z. Shi and J. Lipkowski, J. Electroanal. Chem., 1996, 403, 225–239 CrossRef.
- C. Nguyen Van Huong, C. Hinnen and A. Rousseau, J. Electroanal. Chem. Interfacial Electrochem., 1983, 151, 149–162 CrossRef CAS.
- R. Adzić, E. Yeager and B. Cahan, J. Electroanal. Chem. Interfacial Electrochem., 1977, 85, 267–276 CrossRef.
- T. Wandlowski, J. Wang and B. Ocko, J. Electroanal. Chem., 2001, 500, 418–434 CrossRef CAS.
- Z. Shi, J. Lipkowski, S. Mirwald and B. Pettinger, J. Chem. Soc., Faraday Trans., 1996, 92, 3737–3746 RSC.
- J. Lipkowski, Z. Shi, A. Chen, B. Pettinger and C. Bilger, Electrochim. Acta, 1998, 43, 2875–2888 CrossRef CAS.
- N. M. Marković, C. A. Lucas, H. A. Gasteiger and P. N. Ross, Surf. Sci., 1996, 365, 229–240 CrossRef.
- H. A. Gasteiger, N. M. Marković and P. N. Ross, Langmuir, 1996, 12, 1414–1418 CrossRef CAS.
- O. M. Magnussen, B. M. Ocko, R. R. Adzic and J. X. Wang, Phys. Rev. B: Condens. Matter Mater. Phys., 1995, 51, 5510–5513 CrossRef CAS PubMed.
- R. Gomez, J. M. Feliu and H. D. Abruna, J. Phys. Chem., 1994, 98, 5514–5521 CrossRef CAS.
- G. M. Brisard, E. Zenati, H. A. Gasteiger, N. M. Marković and P. N. Ross, Langmuir, 1997, 13, 2390–2397 CrossRef CAS.
- Y. Gründer, D. Kaminski, F. Golks, K. Krug, J. Stettner, O. M. Magnussen, A. Franke, J. Stremme and E. Pehlke, Phys. Rev. B: Condens. Matter Mater. Phys., 2010, 81, 174114 CrossRef.
- F. H. Ree and D. A. Chesnut, J. Chem. Phys., 1966, 45, 3983 CrossRef CAS.
Footnotes |
| † Electronic supplementary information (ESI) available: (i) A convergence analysis to determine the accuracy of the calculations, (ii) details for the diffusion of CH3Sad on the Cu(100) surface without coadsorbates, (iii) a comparison to the results of Rahn et al.1 for the rotation path of Sad diffusion and (iv) details on the examined diffusion paths. See DOI: https://doi.org/10.1039/d4cp03884c |
| ‡ Corresponding calculations are underway. |
| § γCl = −0.7 ± 0.3 on Au(100);53γCl = −0.5 ± 0.3 on Au(111);54γBr = −0.76 on Au(111);55γBr = −0.63 on Au(100);55γBr = −0.4 on Au(110);55γBr = −0.7 on Au(311);55γBr = −0.54 ± 0.05 on Au;56γBr = −0.7 ± 0.15 on Ag(100);57γBr = −0.75 ± 0.5 on Au(100);58γCl = −0.5 ± 0.2 on Au(111);59γBr = −0.7 ± 0.2 on Au(111);59γBr = −0.99 on Pt(100);60γBr = −0.99 on Pt(111);61γCl = −1.0 ± 0.2 on Au(111);62γCl = −1 on Pt(111);63γBr = −0.73 ± 0.03 on Ag(100).50 |
| This journal is © the Owner Societies 2024 |