An experimental and computational study of the unimolecular-decay reaction of diethyl-substituted Criegee intermediate (C2H5)2COO†
Received
18th September 2024
, Accepted 27th October 2024
First published on 28th October 2024
Abstract
We have performed direct kinetic measurements to determine the thermal unimolecular-decay rate coefficient of (C2H5)2COO as a function of temperature (223–296 K) and pressure (4–100 torr) using time-resolved UV-absorption spectroscopy. The stabilised (C2H5)2COO Criegee intermediate was produced by photolysing 3-bromo-3-iodopentane ((C2H5)2CIBr) with 213 nm radiation in the presence of O2. We performed quantum-chemistry calculations and master-equation simulations to complement the experimental work. At 296 K and 100 torr, we measure 1530 ± 440 s−1 (2σ) for the unimolecular-decay rate coefficient, and both the experiments and simulations indicate that the reaction is effectively at the high-pressure limit under these conditions. Key parameters in the master-equation model were optimised using the experimental results, and phenomenological rate coefficients were then computed to facilitate the use of the present results in modelling. A roaming channel that forms (R/S)-2-hydroxypentan-3-one was included in the master-equation model. We also performed similar calculations for the unimolecular-decay reaction of (CH3)2COO to improve the kinetic modelling of our previous work [J. Peltola et al., Phys. Chem. Chem. Phys., 2022, 24, 5211–5219].
1 Introduction
Gas-phase ozonolysis is a major sink of atmospheric alkenes. In general, the ozonolysis reaction is very exothermic and forms a stable aldehyde compound and a chemically activated carbonyl oxide (Crigee intermediate (CI),1 see Fig. 1), the latter of which can promptly isomerise or decompose before being collisionally stabilised. For collisionally stabilised CIs (sCIs), unimolecular reactions are often their dominant atmospheric sink, but for some sCIs (H2COO, for example) these reactions are slow, in which case bimolecular reactions with atmospheric trace species such as H2O, (H2O)2, or SO22,3 can be important loss channels. Alkyl-substituted sCIs have been extensively studied in recent years, and it is increasingly clear that they are an important source of tropospheric hydroxyl radicals (OH˙).2,4–18
 |
| | Fig. 1 Structures of the carbonyl oxides (Criegee intermediates) studied in this work. | |
If a 1,4-hydrogen-shift reaction is possible (see Fig. 2), it is by far the kinetically most important isomerisation pathway for carbonyl oxides. This is both due to its comparatively low barrier and a huge tunnelling effect; tunnelling increases the thermal unimolecular-decay rate coefficient by 1–2 orders of magnitude at room temperature.7 The alkene-hydroperoxide (peroxol) species formed by the hydrogen-shift reaction are typically tens of kJ mol−1 more stable than the parent carbonyl oxides, but are nonetheless fairly unstable species that readily decompose by cleavage of the O–O bond. This cleavage reaction has a well-defined saddle point12 because the fragments – alkenoxy and hydroxyl radicals – form hydrogen-bonded van der Waals (vdW) complexes after the O–O bond dissociates. The bimolecular-product channel is the main sink of carbonyl oxides at high energies/temperatures, but as demonstrated by Kuwata et al.,10 at low energies/temperatures a roaming-type mechanism5,19 can compete with the decomposition reaction.5,10 This is a consequence of the saddle points for hydroperoxide–hydroxycarbonyl isomerisation lying below the energy of the bimolecular-product asymptote (carbonyl radical + OH˙). The reaction mechanism discussed above is depicted graphically in Fig. 3. This figure also introduces the abbreviations we use to refer to some of the species.
 |
| | Fig. 2 Reaction mechanism for the unimolecular-decay of alkyl-substituted Criegee intermediates. | |
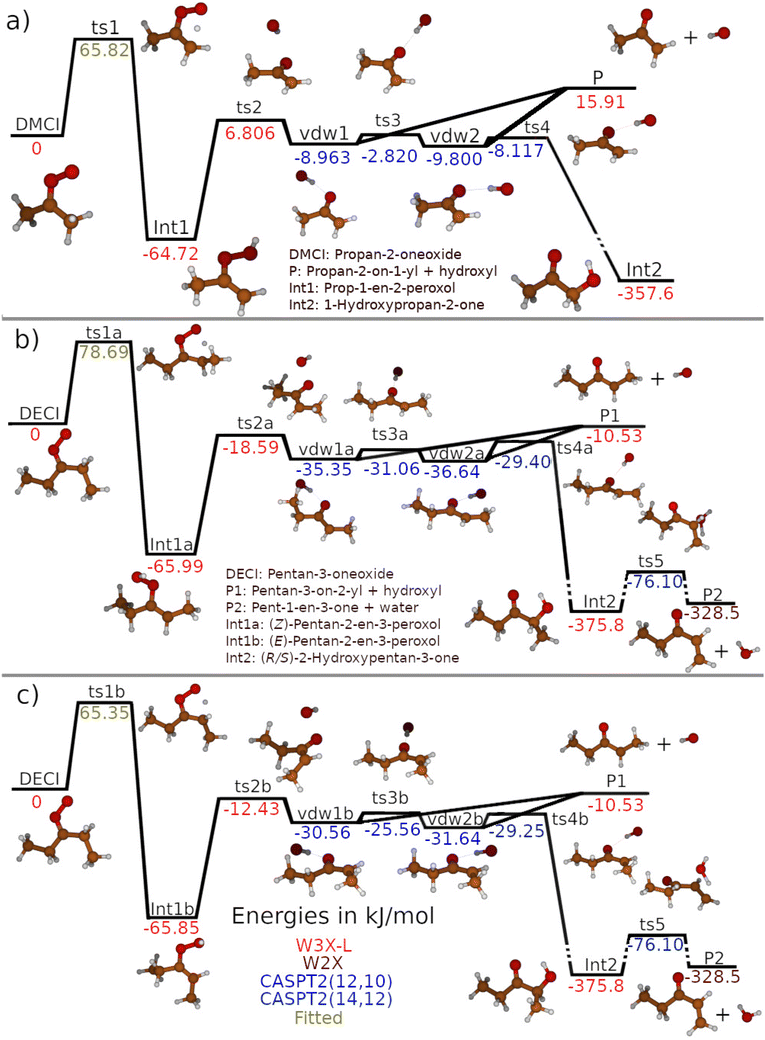 |
| | Fig. 3 Potential-energy profiles for the unimolecular-decay mechanisms of (a) DMCI (propan-2-oneoxide) and (b) and (c) DECI (pentan-3-oneoxide). The geometries in the DMCI and DECI systems were optimised at the CASPT2(8,7)/aug-cc-pVTZ and MN15/Def2TZVP level of theory, respectively. See the text and ESI† for details about the single-point-energy calculations. Different text colours are used to show which level of theory was used to determine the relative energy of a given stationary point. | |
In this work, we present direct kinetic measurements for the thermal unimolecular decay of DECI (diethyl Criegee intermediate, pentan-3-oneoxide),
| |  | (1) |
which is produced in the ozonolysis of 2-ethyl-1-butene and any larger alkene with an R
1R
2C
![[double bond, length as m-dash]](https://www.rsc.org/images/entities/char_e001.gif)
C(C
2H
5)
2 moiety, such as 3-ethyl-2-pentene, but it is not strictly atmospherically important.
20,21 We complement the experimental work with quantum-chemistry calculations and master-equation (ME) simulations to determine yields of the various product channels. For comparison purposes, we also perform such calculations for the thermal unimolecular decay of DMCI (dimethyl Criegee intermediate, propan-2-oneoxide),
| |  | (2) |
which we have investigated in a previous work.
6 The smaller size of this system allows one to use high-level quantum-chemistry methods, and so provides a useful way of assessing the accuracy of lower-level methods needed for the DECI system. We also improve the kinetic modelling of our previous work by incorporating the roaming mechanism into the ME model.
2 Methods
2.1 Experimental
The experimental approach we employ is essentially the same as in our previous study of the unimolecular decay of DMCI, so here we focus only on the experimental details pertinent to the current work. A detailed description of the time-resolved, broadband, cavity-enhanced absorption spectrometer (TR-BB-CEAS) apparatus (see Fig. S1, ESI†) has been given previously.6,22 DECI was produced by the reaction| | | (C2H5)2CI˙ + O2 → (C2H5)2COO + I˙, | (3) |
where [O2] was set to roughly 4 × 1016 cm−3 to ensure that the above reaction is much faster than the unimolecular decay of DECI. We produced the 3-iodopentan-3-yl radical ((C2H5)2CI˙) by the photolysis reaction| |  | (4) |
The (C2H5)2CIBr precursor is not commercially available and was thus synthesised in this work. The addition of iodide to 3-bromopent-2-ene gives pure 3-bromo-3-iodopentane if the reaction is carried out in an acid with a non-nucleophilic conjugate base, and the reaction is stopped when approximately 50% conversion is reached. We used trifluoroacetic acid as the solvent and concentrated aqueous hydroiodic acid as the iodide source. The residual trifluoroacetic acid concentration in the product was negligible due to vacuum distillation (70 °C, 8 torr). The synthesis is explained in more detail in the ESI.†
The premixed gas mixture flowing through the reactor contained the radical precursor (C2H5)2CIBr and O2 diluted in nitrogen (N2) carrier gas. The gas flows were controlled with calibrated mass-flow controllers. The total flow rate was set to roughly 1 m s−1 in order to replace the gas mixture between laser pulses (the laser was operated at 1 Hz). In measurements below room temperature, the gas mixture entering the temperature-controlled reactor was precooled close to a set point temperature. The temperature uncertainty in the measurement range 223–296 K was ≤±1.2 K (2σ).
All the kinetic traces (concentration-time profiles) were measured at 340 nm, where DECI absorbs strongly. The kinetic traces were probed with a time resolution of 67–150 microseconds and averaged between 1000 and 9000 shots. The statistical fitting uncertainties reported in this study are 2σ. This includes uncertainties of all the measured exponential decays (kDECI) and linear least-squares fits. The estimated overall uncertainty in the reported unimolecular-rate-coefficient values is ±25%.
2.2 Quantum-chemistry calculations
For the unimolecular-decay mechanism of DMCI, stationary-point geometries were first sought and optimised at the MN15/Def2TZVP level of theory.23,24 These geometries were further refined at the CASPT2(8,7)/aug-cc-pVTZ level of theory.25 The MN15/Def2TZVP and CASPT2(8,7)/aug-cc-pVTZ geometry optimisations were ran with the Gaussian 16 and MOLPRO 2022.3 software packages, respectively.26–29 Hindered-rotor potentials were evaluated at the MN15/Def2TZVP level of theory. The MN15/Def2TZVP and CASPT2(8,7)/aug-cc-pVTZ harmonic frequencies were scaled by 0.979 and 0.957, respectively, to partially account for anharmonic effects.30
Single-point energies were calculated for the MN15 and CASPT2(8,7) geometries with the CASPT2(12,10) method using the aug-cc-pVTZ and aug-cc-pVQZ basis sets. We ran these calculations with the ORCA software package 5.0.3 using the default settings (no IPEA or level shifts).31 The energy differences were extrapolated to the complete-basis-set (CBS) limit using the expression32
| |  | (5) |
For DMCI, the active space consisted of the bonding and antibonding C–O and O–O sigma orbitals (4,4), the two non-bonding lone-pair orbitals on the terminal oxygen (4,2), the bonding and antibonding C–O pi orbitals (2,2), and the bonding and antibonding C–H sigma orbitals of one of the hydrogens available for the 1,4-hydrogen-shift reaction. The corresponding orbitals were used for the other species. For the O–O-bond-cleavage saddle point – as well as the subsequent structures in the vdW region – CASPT2 calculations were performed both for the singlet and triplet states. The singlet and triplet calculations were state-averaged over the two lowest singlet and triplet states, respectively. In the CASPT2 geometry optimisations, we removed one of the lone-pair orbitals and the bonding and antibonding C–O sigma orbitals from the active space to speed up computations and facilitate convergence. The occupation numbers of these orbitals are close to two or zero, and so we expect the geometry-optimisation results to be insensitive to whether or not these orbitals are included in the active space. To determine the barrier height for the decomposition of 2-hydroxypentan-3-one to water and pent-1-en-3-one in the DECI system, the (12,10) active space was expanded to include the bonding and antibonding C–H orbital of one of the hydrogens available for abstraction by the leaving OH˙ group.
We also calculated single-point energies with the W2X, and W3X-L protocols for some species (see Fig. 3).33 These calculations were run with the MRCC program package34,35 interfaced with MOLPRO. The W2X protocol provides an accurate approximation for the all-electron scalar-relativistic CCSD(T)/CBS energy, and the W3X-L protocol improves on this by computing CCSDT and CCSDT(Q) correction terms. The post-CCSD(T) corrections are important in improving the energies of species for which multi-reference effects are significant but not overwhelming.
For the unimolecular-decay mechanism of DECI, the larger size of the system made W3X-L single-point-energy calculations and CASPT2(8,7)/aug-cc-pVTZ geometry optimisations prohibitively costly. Thus, geometry optimisations were only performed at the MN15/Def2TZVP level of theory, and single-point energies were evaluated with the CASPT2(12,10)/CBS and W2X methods. However, to approximate W3X-L//CASPT2(8,7)/aug-cc-pVTZ and CASPT2(12,10)/CBS//CASPT2(8,7)/aug-cc-pVTZ relative energies for the DECI system, we adopted an isodesmic scheme36 in which the energies were estimated using the relations
| | | ΔDECIEW3X-LCASPT2(8,7)/aug-cc-pVTZ ≈ ΔDECIEW2XMN15/Def2TZVP + ΔW3X-LcorrE and | (6) |
| | | ΔDECIECASPT2(12,10)/CBSCASPT2(8,7)/aug-cc-pVTZ ≈ ΔDECIECASPT2(12,10)/CBSMN15/Def2TZVP + ΔCASPT2corrE, | (7) |
where the corrections are
| | | ΔW3X-LcorrE = ΔDMCIEW3X-LCASPT2(8,7)/aug-cc-pVTZ − ΔDMCIEW2XMN15/Def2TZVP and | (8) |
| | | ΔCASPT2corrE = ΔDMCIECASPT2(12,10)/CBSCASPT2(8,7)/aug-cc-pVTZ − ΔDMCIECASPT2(12,10)/CBSMN15/Def2TZVP, | (9) |
respectively. It was not possible to compute energy corrections for P2 and TS5 as these species do not have analogues in the DMCI system. Thus, we used the uncorrected W2X//MN15/Def2TZVP and CASPT2(14,12)/CBS//MN15/Def2TZVP values for P2 and TS5, respectively.
2.3 Master-equation modelling
The ME simulations were run with MESMER 7.1.37 MESMER is a one-dimensional ME solver, meaning that there is no explicit treatment of angular-momentum effects. However, if experimental barrier heights and collisional-energy-transfer parameters are optimised with experimental data, as is done in this work, some angular-momentum effects are implicitly captured. The differential-equation system we solved with MESMER is| |  | (10) |
where M is the transition matrix and p is a vector that contains the populations of the energy grains of all species. The transition matrix contains, at the microcanonical level, all the information needed to describe losses and gains for each energy grain due to chemical reactions and collisions. Microcanonical rate coefficients were computed with RRKM theory,| |  | (11) |
Here k(E), N‡(E), and ρ(E) are the microcanonical rate coefficient, state sum of the transition state (TS), and the density of states of the reactant, respectively. The TSs were placed on saddle-points for all reactions that had one.
In the DMCI and DECI systems, the prop-2-on-1-yl + OH˙ and pentan-3-on-2-yl + OH˙ recombination reactions that form the vdW complexes are barrieless (see Fig. 3), and thus the TS locations are not obvious. For these reactions, we determined TS state sums (N‡outer) with the inverse-Laplace-transform (ILT) technique implemented in MESMER.38,39 To use this method, the user needs to provide a modified Arrhenius expression for reaction's canonical rate coefficient. Fortunately, Liu et al.5 have investigated the kinetics of the analogous butan-2-on-1-yl + OH˙ → vdW complex reaction with VRC-TST,40 and the canonical rate coefficient they report can be reproduced with the expression
| |  | (12) |
Because the prop-2-on-1-yl, butan-2-on-1-yl, and pentan-3-on-2-yl structures are very similar, we expect the above expression to approximately apply for the prop-2-on-1-yl + OH˙ and pentan-3-on-2-yl + OH˙ reactions, and so we use this expression in our ILT calculations. Note that the butan-2-on-1-yl + OH˙ reaction can form two distinct vdW complexes, and Liu
et al. made the simplifying assumption that half of the reactive flux across the dividing surface goes into one of the vdW-complex wells and the other half to the other. Or put differently,
N‡outer was apportioned equally to the two vdW-complex forming reactions. In our case, the DMCI and DECI systems have two and four distinct vdW complexes (shown in
Fig. 3), respectively, and we also made the assumption that
N‡outer could be divided equally among the vdW-complex forming reactions.
Another subtlety discussed by Liu et al. is the role excited electronic states play in the vdW region. In this region, the two lowest singlet (S0 and S1) and triplet (T0 and T1) states are nearly degenerate (see Tables S3 and S4 in the ESI†), and the question is whether the conversions between these states are fast compared to the lifetime of the vdW complexes. If fast, the four states remain statistically populated as the isomerisation/decomposition reaction occurs and their near-degeneracy needs to be considered in state-sum calculations. If slow, only the singlet ground state needs to be considered. Liu et al. performed ME simulations with both assumptions, but considered the rapid-conversion case to be physically more realistic. Investigating this matter in detail is beyond the scope of the current work, so here we split the difference and assume rapid conversion between the two singlet states, but slow conversion between singlet and triplet states. Whilst this matter is a source of non-negligible uncertainty in our calculations, we expect the computed saddle-point energies to be a larger source of uncertainty.
Collisional energy transfer was treated with the traditional single-exponential-down model with the temperature dependent parameter
| | 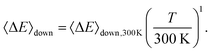 | (13) |
Because experimental rate-coefficient data is available over a limited temperature range, less than 100 K, it was not possible to optimise the value of the temperature exponent; a value equal to unity is assumed. Collision frequencies were calculated using Lennard-Jones (LJ) interaction potentials. We computed the LJ parameters of propane-2-peroxol (2-hydroperoxy propane) and pentane-3-peroxol (3-hydroperoxy pentane) with the Joback method, as implemented in RMG (reaction mechanism generator),
41 and assigned these values to the species in the DMCI and DECI systems, respectively. The LJ parameters for He and N
2 were obtained from the literature.
42 We list in
Table 1 the LJ parameters used in the ME simulations.
Table 1 The Lennard-Jones parameters used in the master-equation simulations
| Species |
ε
LJ (K) |
σ
LJ (Å) |
| He |
10.22 |
2.551 |
| N2 |
71.4 |
3.798 |
| C3H6O2 (DMCI) |
423 |
6.06 |
| C5H10O2 (DECI) |
457 |
6.68 |
Coupling between internal rotations and between internal and external rotations was treated with the method of Gang et al., as implemented in MESMER.43 The current implementation specifies the multi-dimensional hindered-rotor potential as a sum of one-dimensional hindered-rotor potentials – potential coupling is not explicitly treated. However, as we used relaxed scans to determine the one-dimensional hindered-rotor potentials, some potential coupling is implicitly captured. The method of Gang et al. is fully classical, so to avoid double counting zero-point-energy (ZPE) contributions when determining state sums and densities, we subtracted from each species the ZPEs corresponding to the hindered-rotor modes. These were obtained from one-dimensional quantum-mechanical hindered-rotor calculations.
MESMER has automated fitting routines that can be employed to optimise the values of ME parameters if experimental data is supplied. In this work, the merit function that is minimised in the fits is
| |  | (14) |
where
ki,exp and
ki,ME are the experimental and simulated unimolecular-decay rate coefficient, respectively, and
σi is the error associated with experiment number
i. All simulations were run with an energy-grain size of 20 cm
−1 and a cut-off energy of 25
kBT. Eckart-tunnelling corrections were computed for the 1,4-hydrogen-shift reactions. We plot in
Fig. 4 the microcanonical and canonical 1,4-hydrogen-shift rate coefficients with and without tunnelling corrections to highlight the importance of tunnelling. At 300 K, the rate-increasing effect of tunnelling is about a factor of 50 for both DMCI and DECI.
 |
| | Fig. 4 (a) Microcanonical and (b) canonical 1,4-hydrogen-shift rate coefficients plotted as a function of energy and temperature, respectively, for the DMCI (propan-2-oneoxide) and DECI (pentan-3-oneoxide) systems. This figure illustrates the importance of tunnelling for this reaction. There are two distinct hydrogen-shift reactions for DECI, and here we show the sum of the two microcanonical/canonical rate coefficients. | |
With MESMER, the standard way of determining phenomenological rate coefficients for a given system is to perform a Bartis–Widom analysis.44,45 This analysis exploits and relies on the fact that chemically-significant eigenvalues (CSEs) of the transition matrix M are often much smaller in magnitude than the internal-energy-relaxational eigenvalues (IEREs). That is to say, a rate-coefficient description of the system is valid if timescales relating to collisional relaxation and chemical transformations are well separated in magnitude. In the present investigation, the shallow vdW wells (see Fig. 3) complicate matters as their inclusion in the ME models result in CSEs not being well separated from IEREs, and thus some or all of the rate coefficients obtained with Bartis–Widom analysis might not be physically meaningful. We resolved this problem by using “effective” ME models in which the vdW regions are omitted and replaced with direct reactions that describe the chemical transformations between the hydroperoxide (Int1), bimolecular-product (P), and hydroxycarbonyl (Int2) wells. This can be done because the vdW complexes are only ever present at small steady-state concentrations. Due to the absence of the shallow vdW wells in the effective ME models, the CSEs are now well separated from the IEREs under all conditions of interest (0.01–100 bar and 200–500 K), and so Bartis–Widom analysis can be applied to extract phenomenological rate coefficients. We explain below how the effective model was constructed for the DMCI system; the procedure is perfectly analogous for the DECI system.
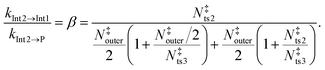
We assume here that the roaming process can be treated with statistical methods and use the expressions derived by Klippenstein et al.19 At all energies of interest, the state sum of the O–O-bond-cleavage TS (N‡ts2) is always significantly smaller than that of the TS that connects the two vdW complexes (N‡ts3), the 1-hydroxypropan-2-one-forming TS (N‡ts4), and/or the TS between the vdW complexes and the bimolecular products (N‡outer). To illustrate this graphically, we plot these state sums as a function of energy in the ESI† (see Fig. S4 and S5). Thus, N‡ts2 determines the overall kinetics out of the prop-1-ene-2-peroxol well (Int1), and N‡ts3, N‡ts4, and N‡outer determine the yields of the different product channels. The energy-dependent branching ratio of the 1-hydroxypropan-2-one (Int2) and bimolecular-product (P) channels can be calculated by applying eqn (7) in ref. 19,
| |  | (15) |
The yields of the two channels are obtained from
| |  | (16) |
which are then multiplied with
N‡ts2 to obtain the effective TS state sums for the two product channels,
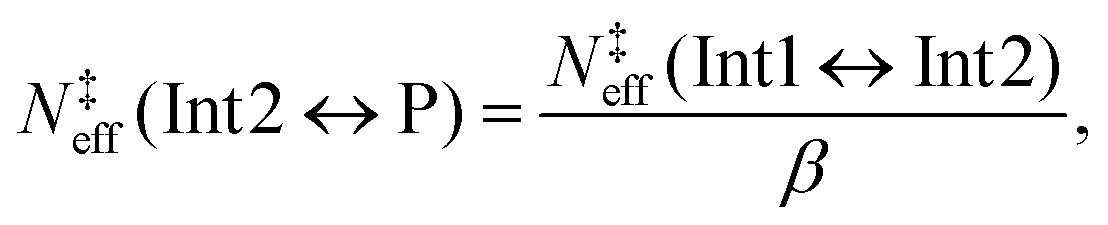
| | | N‡eff(Int1 ↔ Int2) = xInt2N‡ts2 and | (17) |
| | | N‡eff(Int1 ↔ P) = xPN‡ts2. | (18) |
Having obtained
N‡eff(Int1 ↔ Int2) in this way, it is now possible to reapply
eqn (15) to determine an effective state sum for the reaction that forms the bimolecular products from the 1-hydroxypropan-2-one well (Int2). From this well, the branching ratio to form prop-1-ene-2-peroxol (Int1) and the bimolecular products (P) is given by
| |  | (19) |
The microcanonical rate coefficients can be replaced with state sums by applying the RRKM expression, and after a straightforward manipulation, one obtains
| |  | (20) |
which is the effective TS state sum for the
| | | CH3C(O)CH2OH ⇌ CH3C(O)CH2˙ + OH˙ | (21) |
reaction. To test how reasonable the effective model is, we performed simulations in which both the effective and full ME models were integrated over time to determine time-dependent mole fractions for DMCI, Int1, Int2, and P. We found that the results produced by the two models are virtually identical. An example comparison simulated at 300 K and 1 bar is given in Fig. S6 in the ESI.
† Note that time-dependent mole fractions output by ME simulations are valid even when CSEs and IEREs are not well separated. The lack of separation is an issue only if one wants to use the eigenvalues and eigenvectors of the transition matrix to determine phenomenological rate coefficients (Bartis–Widom analysis).
We ran some preliminary ME simulations for the DECI system that included a second bimolecular-product channel; the decomposition of (R/S)-2-hydroxypentan-3-one to water and pent-1-en-3-one (see Fig. 3). The simulations showed that the yield of this channel is negligible under all conditions of interest (0.01–100 bar and 200–500 K), and so we decided not to include it in our final ME simulations. Our finding is consistent with that of Liu et al. for the analogous butan-2-oneoxide (methyl-ethyl Criegee intermediate) system.5 However, as noted by Liu et al., the yield of this channel is likely to significantly increase as pressure is lowered below 0.01 bar.
3 Results and discussion
3.1 Experimental
The absorption spectrum of DECI measured in this work is shown with black circles in Fig. 5 together with the fitted IO spectrum (red line). We measured the spectrum in the time interval 0.2–0.3 milliseconds after the photolysis laser pulse and averaged it 1000 times. The absorption spectrum of DECI has not been measured or theoretically calculated previously. In addition to the UV spectrum of DECI, the spectrum contains other overlapping spectral features. The largest interference comes from iodine monoxide (IO), and by fitting its spectrum to the measured data, we determined [IO] = 4.0 × 1010 cm−3. Under the experimental conditions of the present work, IO does not react with DECI or any other species to a significant degree, and its main loss channel is slow diffusive loss out of the measurement volume. However, IO absorbs very weakly at 340 nm, and so its presence did not affect the kinetic measurements. The photolytic precursor, (C2H5)2CIBr, absorbs very weakly in the 300–450 nm region, and thus its depletion did not impede the kinetic measurements. The low cavity transmission (see Fig. S2, ESI†) – especially below 330 nm – inhibits accurate measurement of the spectrum at short wavelengths. Thus, the shape of the absorption profile is distorted (there is also a dip at 350 nm), and the absorption is most likely stronger at shorter wavelengths than Fig. 5 suggests. More details about the absorption-spectrum measurements are given in the ESI.†
 |
| | Fig. 5 The absorption spectrum of (C2H5)2COO measured at 296 K and 10 torr (N2) using the (C2H5)2CIBr photolytic precursor. The spectrum is averaged 1000 times over the time interval 200–300 microseconds after the photolysis laser pulse. The low cavity transmission prevents the accurate measurement of the spectrum in the gray shaded areas. The initial (C2H5)2COO concentration was estimated to be smaller than 2.0 × 1011 cm−3. The O2 concentration was 4.0 × 1016 cm−3. | |
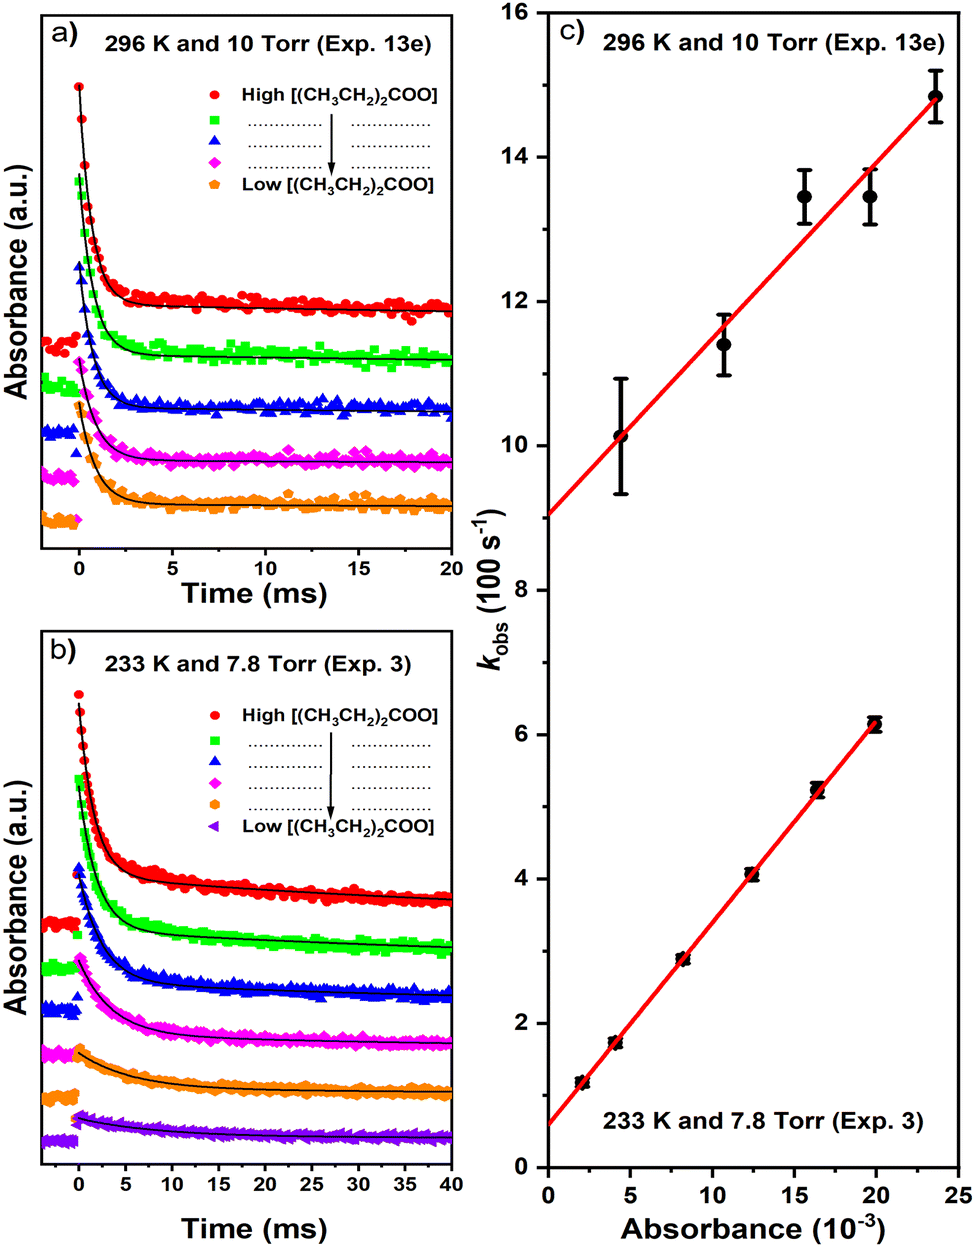
The unimolecular-decay rate coefficient (kuni) of DECI was measured as a function of temperature (223–296 K) and pressure (4–100 torr). Fig. 6 shows typical decay traces obtained at various initial DECI concentrations (peak absorbances) at 296 K and 10 torr (a) and 233 K and 7.8 torr (b). The initial DECI concentrations was varied by adjusting the concentration of the photolytic precursor. We estimate the initial DECI concentration to be smaller than 2 × 1011 cm−3 in all kinetic measurements. The decay of the absorption signal mainly contains contributions from the unimolecular-decay reaction of DECI and its self-reaction. The diffusive loss of DECI and its possible reactions with other reactive species also contribute to the decay rate, but these contributions are small. We observed that the measured decay traces contain two distinct components – a fast decay followed by a much slower decay – so we used the equation
| |  | (22) |
to fit the kinetic traces. Here
A(
t) is the measured absorbance at time
t,
kDECI is the first-order-decay rate coefficient of DECI,
ADECI0 is proportional to the initial concentration of DECI,
kNR is the overall loss rate coefficient of nonreactive species,
ANR is a fitting parameter, and
AOS is a possible measurement offset caused by the TR-BB-CEAS apparatus. The fast-decay component of the absorbance signal arises from the unimolecular-decay reaction, the self-reaction, and the diffusive loss of DECI, whereas the slow-decay component describes the absorbance caused by nonreactive specie(s) formed by the photolysis event and/or the unimolecular decay of DECI. The slow-decay component was observed especially in the kinetic measurements close to room temperature using high [DECI]
0 (see
Fig. 6). We explain the fitting procedure more thoroughly in the ESI.
† In our recent study,
46 we investigated an alternative fitting model to analyse the measured transient absorption signal, which corresponded to a situation where the nonreactive species are assumed to be formed at
t = 0 (photolytically from the precursor). Both fitting models returned essentially the same values for the first-order-decay rate coefficient, indicating that the results we obtain are not particularly sensitive to how the slow-decaying component is handled in the fits.
 |
| | Fig. 6 (C2H5)2COO decay traces for various initial [(C2H5)2COO]0 at (a) 296 K and 10 torr (N2), and at (b) 233 K and 7.8 torr (N2). The traces were probed at 340 nm. The black curves are first-order exponential fits to the traces. In subfigure (c) we plot the obtained first-order rate coefficients (kDECI) as a function of [(C2H5)2COO]0, and the red lines are linear fits to the data. The statistical uncertainties shown are 2σ. | |
To obtain the unimolecular-decay rate coefficient (kuni) for DECI, we extrapolated kDECI to zero peak absorbance ([DECI]0 → 0), which corresponds to the situation in which all radical–radical reactions have been suppressed. We then subtracted from this value the diffusive-loss rate coefficient kloss. The kuni values so obtained are tabulated in Table 2 and depicted graphically in Fig. 7b. For comparison, Table S2 (ESI†) shows also the retabulated results of DMCI from our previous publication.6 At low temperatures, there is increased scatter in the experimental results. There are two main reasons for this. Firstly, at low temperatures the kuni = kDECI − kloss difference becomes increasingly smaller, making it difficult to extract a reliable value for kuni (the relative error associated with the value becomes increasingly large). Secondly, low temperatures and/or high pressures favour the stabilisation of the (C2H5)2CIOO* adduct over its decomposition to DECI + I˙, which results in lower DECI yields. Thus, at low temperatures the DECI absorption signals are of poorer quality, and so the kinetic parameters extracted from these signals have larger uncertainties.
Table 2 The experimental conditions and results of our kinetic measurements for the unimolecular decay of DECI (pentan-3-oneoxide)
|
T (K) |
Exp. # |
[N2] (× 1017 cm−3) |
p
(torr) |
k
DECI (s−1) |
k
loss (s−1) |
k
(exp)uni (s−1) |
k
(ME)uni (s−1) |
|
The fixed [O2] was ∼4 × 1016 cm−3.
|

|
| 223 |
1 |
3.3 |
7.50 |
58.0 ± 40.0 |
9 |
49.0 |
32.9 |
|
|
| 233 |
2 |
1.6 |
3.90 |
83.0 ± 46.0 |
13 |
70.0 |
52.2 |
| 3 |
3.3 |
7.80 |
60.0 ± 4.0 |
9 |
51.0 |
52.6 |
|
|
| 243 |
4 |
1.6 |
4.10 |
74.0 ± 95.0 |
13 |
61.0 |
83.5 |
| 5 |
3.3 |
8.20 |
85.0 ± 18.0 |
9 |
76.0 |
84.4 |
|
|
| 253 |
6 |
1.6 |
4.30 |
217 ± 130 |
13 |
204 |
134 |
| 7a |
3.3 |
8.50 |
189 ± 86 |
9 |
180 |
136 |
| 7b |
3.3 |
8.50 |
152 ± 19 |
9 |
143 |
136 |
| 8 |
16 |
42.6 |
271 ± 86 |
4 |
267 |
139 |
|
|
| 273 |
9a |
1.6 |
4.60 |
371 ± 48 |
13 |
358 |
339 |
| 9b |
1.6 |
4.60 |
437 ± 69 |
13 |
424 |
339 |
| 10a |
3.3 |
9.20 |
365 ± 44 |
9 |
356 |
352 |
| 10b |
3.3 |
9.20 |
371 ± 106 |
9 |
362 |
352 |
| 11 |
16 |
46.0 |
896 ± 185 |
4 |
892 |
370 |
|
|
| 296 |
12 |
1.6 |
5.00 |
922 ± 323 |
13 |
909 |
942 |
| 13a |
3.3 |
10.0 |
1070 ± 230 |
9 |
1060 |
1010 |
| 13b |
3.3 |
10.0 |
921 ± 46 |
9 |
912 |
1010 |
| 13c |
3.3 |
10.0 |
1310 ± 160 |
9 |
1300 |
1010 |
| 13d |
3.3 |
10.0 |
1280 ± 140 |
9 |
1270 |
1010 |
| 13e |
3.3 |
10.0 |
905 ± 94 |
9 |
896 |
1014 |
| 14a |
16 |
50.0 |
1460 ± 240 |
4 |
1450 |
1130 |
| 14b |
16 |
50.0 |
1240 ± 330 |
4 |
1230 |
1130 |
| 14c |
16 |
50.0 |
1310 ± 140 |
4 |
1300 |
1130 |
| 15 |
33 |
100 |
1530 ± 440 |
3 |
1530 |
1160 |
 |
| | Fig. 7 Experimental and simulated fall-off curves for the unimolecular decay of (a) DMCI (propan-2-oneoxide) and (b) DECI (pentan-3-oneoxide) plotted at different temperatures. The experimental results for DMCI are previously published data.6,17,18 | |
3.2 Quantum-chemistry calculations
The results of our quantum-chemistry calculations are tabulated in Tables S3–S5 in the ESI,† and the values used in our ME models are shown in Fig. 3. In general, the different levels of theory employed give very consistent relative energies; the results are typically within several kJ mol−1 and their expected uncertainties overlap. The O–O-bond-cleavage saddle points are a notable exception. MN15/Def2TZVP predicts a significantly shorter O–O distance (1.9 Å) than CASPT2(8,7)/aug-cc-pVTZ (2.5 Å) for ts2, and the single-point energies evaluated for these structures differ by more than 10 kJ mol−1. For the CASPT2 structure, the weights of the two lowest CASSCF configurations are 0.83 and 0.07, and it is clear that multi-reference effects are significant. Thus, we expect the CASPT2 geometry to be more reliable. For this geometry, the CASPT2 or W3X-L single-point-energy evaluations differ by about 5 kJ mol−1, and it is difficult to conclusively say which result is more reliable, but we lean towards the W3X-L result. This protocol provides a better estimate of the dynamic correlation, and with the inclusion of post-CCSD(T) corrections, we expect it to also capture most of the static correlation.
In the ME models, we opted to use W3X-L//CASPT2(8,7)/aug-cc-pVTZ relative energies for the stable species and the relatively tight saddle points ts1, ts1a, ts1b, ts2, ts2a, and ts2b. For the loosely bound structures in the vdW region, we consider the CASPT2(12,10)/CBS/CASPT2(8,7)/aug-cc-pVTZ values – evaluated relative to the bimolecular-product asymptote – to be sufficiently accurate. It is not obvious that W3X-L evaluations would be significantly better than CASPT2 evaluations for these structures, and the former calculations are much more costly.
We also explored the importance of hydrogen abstraction from the terminal carbon, but found the barrier for this reaction to be roughly twice as large as for the 1,4-hydrogen-shift reaction at the MN15/Def2TZVP level of theory. Thus, we expect hydrogen abstraction from the terminal carbon to be kinetically irrelevant and did not include this channel in our ME model.
3.3 Master-equation simulations
We utilised published experimental data6,17,18 for the unimolecular decay of DMCI to optimise the 1,4-hydrogen-shift barrier height (ts1), the imaginary frequency of this saddle point, and the 〈ΔE〉down,300K parameter. For the DECI system, we utilised the experimental data of the present work to optimise the 1,4-hydrogen-shift barrier heights ts1a and ts1b and their imaginary frequencies. Fitting the 〈ΔE〉down,300K parameter for the DECI system was not feasible because the experiments were performed close to the high-pressure limit (HPL), so we needed to choose a value for it. 〈ΔE〉down,300K values tend to increase with molecular size, and since we obtained 66.1 cm−1 (N2) for the DMCI system, we chose the slightly larger value 90 cm−1 for the DECI system. The results of the fits are given in Table 3.
Table 3 Master-equation parameters obtained from fits to experimental data. The fitting uncertainties are 1σ
| Fitted parameter |
Fitted value |
Computed value |
The fit was performed so that the differences between  and and  and ν‡ts1a and ν‡ts1b were fixed to the computed differences.
W3X-L//CASPT2(8,7)/aug-cc-pVTZ (see Section 2.2 for details).
CASPT2(8,7)/aug-cc-pVTZ.
MN15/Def2TZVP. and ν‡ts1a and ν‡ts1b were fixed to the computed differences.
W3X-L//CASPT2(8,7)/aug-cc-pVTZ (see Section 2.2 for details).
CASPT2(8,7)/aug-cc-pVTZ.
MN15/Def2TZVP.
|

|
| 〈ΔE〉(He)down,300K (cm−1) |
37.9 ± 5.4 |
— |
|
66.1 ± 24.5 |
— |

|
65.8 ± 0.5 |
68.61b |
|
ν
‡ts1 (i cm−1) |
1610 ± 20 |
1780c |

|

|
78.7 ± 0.5 |
81.03b |
|
ν
‡ts1a (i cm−1) |
1580 ± 30 |
1593d |

|
65.4 ± 0.5a |
67.70b |
|
ν
‡ts1b (i cm−1) |
1590 ± 30a |
1606d |
The optimised barrier heights are within 3 kJ mol−1 of our computed values, and the optimised and computed imaginary frequencies are also quite similar. We note, however, that the imaginary frequencies and barrier heights are strongly correlated in the fits, and it is difficult to assess how physical the values returned by the fits are. Furthermore, the often-used Eckart model is a fairly crude way to treat tunnelling, and so the fits also adjust the barrier heights and imaginary frequencies to correct for the inherent deficiencies in the Eckart model. Still, the relatively small adjustments needed for these parameters indicate that the ME models are essentially correct in describing the unimolecular decays of DMCI and DECI. Fall-off curves obtained with our optimised ME models are displayed in Fig. 7 together with the experimental results.
In Fig. 8 we plot the rate coefficients and product yields of the unimolecular reactions that take place in the DMCI and DECI systems as a function of temperature at selected pressures. The yields were calculated with the phenomenological rate coefficients obtained from the ME models. For DMCI, we find that formation of the bimolecular products is the dominant sink, but low pressures and temperatures increase the yield of 1-hydroxypropan-2-one, whereas increasing pressure results in a larger prop-1-en-2-peroxol yield. For the DECI system, we find that the yield of (R/S)-2-hydroxypentan-3-one formed by well-skipping is always negligible. This is because the 1,4-hydrogen-shift reaction almost exclusively forms (E)-pentan-2-en-3-peroxol (Int1b), and the subsequent O–O-bond cleavage barrier is close to the energy of the bimolecular-product asymptote (within 2–3 kJ mol−1). Thus, if the excited Int1b reacts further before being collisionally stabilised (well skips), it almost certainly goes on to form the bimolecular products rather than the roaming product. In contrast, for the unimolecular decay of collisionally stabilised Int1b, the yield of the roaming product is non-negligible – especially at lower temperatures.
 |
| | Fig. 8 Unimolecular rate coefficients and reaction yields plotted as a function of temperature at selected pressures for the (a) DMCI (propan-2-oneoxide) and (b) DECI (pentan-3-oneoxide) systems. | |
We provide in the ESI† the ME input files and modified-Arrhenius representations of the modelled phenomenological rate coefficients at selected pressure between 0.01 bar and 100 bar. The representations are valid in the temperature range 200–500 K. Canonical (HPL) rate coefficients are also provided. We plot in Fig. S7 (ESI†) the canonical rate coefficients for the carbonyl radical + OH˙ reactions.
3.3.1 Comparisons with previous works.
In Fig. 9 we plot simulated mole-fraction profiles for the DMCI and DECI systems at 250 K and 1 bar. As mentioned above, the 1,4-hydrogen-shift reaction in the latter system almost exclusively forms Int1b, and the subsequent O–O-bond cleavage barrier (ts2b) is about 20 kJ mol−1 lower in energy than the corresponding barrier in the former system (ts2). Thus, far less of the alkene-hydroperoxide intermediate is formed in the latter system, and the little that is formed more rapidly reacts further. The roaming channel is also seen to be far less important in the DECI system. Because the relative energy of ts2b is close to the energy of the bimolecular asymptote and entropy factors favour decomposition, there is only a very narrow energy range in which the roaming channel is able to compete with the bimolecular-product channel (see Fig. S5, ESI†).
 |
| | Fig. 9 Simulated mole-fraction profiles for the (a) DMCI and (b) DECI systems at 250 K and 1 bar. The dashed lines are simulation results by Kuwata et al.,10 whereas the solid lines are present results. | |
Subfigure a compares our simulated mole-fraction profiles to those of Kuwata et al.10 for the DMCI system. The Kuwata et al. simulations predict a slightly faster DMCI decay, which is consistent with the ∼1 kJ mol−1 lower 1,4-hydrogen-shift barrier in their model. Despite their larger 〈ΔE〉down parameter (300 cm−1), they predict less stabilisation of Int1 (prop-1-en-2-peroxol) because the O–O-bond-cleavage saddle-point (ts2) in their model is ∼15 kJ mol−1 lower in energy than in our model.§ As mentioned in the Methods section, multi-reference effects are important for ts2; the single-point energies we calculated for the MN15/Def2TZVP geometry were over 10 kJ mol−1 lower than for the CASPT2(8,7) geometry. Kuwata et al. used EOM-SF-CCSD(dT)//M06-2X/Def2TZVP level of theory in their calculations, and we think the lower energy they predict for ts2 is most likely explained by them using a single-reference approach (M06-2X/Def2TZVP) to determine the geometry of this saddle-point.
Liu et al.5,47 investigated the unimolecular-decay reactions of (E)- and (Z)-butan-2-oneoxide (methylethyl Criegee intermediates, MECI), and due to structural similarities (see Fig. 10), one expects the E and Z isomers to react analogously to DMCI and DECI, respectively. We plot in Fig. 10 the temperature-dependent reaction yields predicted by the ME models of Liu et al. and compare the results with ours. Qualitative agreement is seen for DMCI and (E)-butan-2-oneoxide (subfigure a), but less so for DECI and (Z)-butan-2-oneoxide (subfigure b). To rationalise the observed differences, it is useful to compare the values of some key parameters in the ME models (see Table 4). The 1,4-hydrogen-shift barrier heights (ts1/ts1b), imaginary frequencies, and the bimolecular-product-asymptote energies are very similar in both ME models, so we believe that the discrepant results are mainly explained by the differences in the 〈ΔE〉(300K)down(N2) values and O–O-bond-cleavage barriers. For the DMCI and (E)-butan-2-oneoxide systems (subfigure a), the significantly larger 〈ΔE〉(300K)down(N2) value used by Liu et al. explains the more efficient collisional stabilisation of the hydroperoxide intermediate (Int1); the 4 kJ mol−1 lower O–O-bond-cleavage barrier is not able to fully offset this effect. For the DECI and (Z)-butan-2-oneoxide systems (subfigure b), the O–O-bond-cleavage barrier in their model is significantly lower (10 kJ mol−1) than in ours, and so our model predicts more stabilisation of the hydroperoxide intermediate – despite our smaller 〈ΔE〉(300K)down(N2) value. In the Liu et al. models, the O–O-bond-cleavage barriers are lower in energy also relative to the bimolecular-product asymptote, which explains why their models predict larger hydroxycarbonyl yields (the roaming product).
 |
| | Fig. 10 Reaction yields for the unimolecular decays of (a) propan-2-oneoxide (DMCI) and (E)-butan-2-oneoxide and (b) pentan-3-oneoxide (DECI) and (Z)-butan-2-oneoxide plotted as a function of temperature at 1 bar (N2). The results for DMCI and DECI are from the present work, and those for (E/Z)-butan-2-oneoxide are by Liu et al.5 | |
Table 4 Values of key parameters used in the master-equation simulations of this work and those of Liu et al.5
| Parameter |
This work |
Liu et al. |
|
|
(CH3)2COO |
(E)-C2H5C(OO)CH3 |

|
66.1 |
300 |

|
65.8 |
67.5 |
|
ν
‡ts1 (i cm−1) |
1610 |
1573 |

|
6.81 |
2.59 |

|
15.9 |
16.2 |
|
|
(C2H5)2COO |
(Z)-C2H5C(OO)CH3 |

|
90.0 |
300 |

|
65.4 |
64.5 |
|
ν
‡ts1b (i cm−1) |
1590 |
1584 |

|
−12.4 |
−22.3 |
|
−10.5 |
−8.03 |
For the unimolecular decay of (E)-MECI, Liu et al. also performed experiments to determine the yield of 1-hydroxybutan-2-one product. At 300 K and 0.013 bar, they obtained 0.07 ± 0.03 for the yield, and as shown in Fig. 11, this result is very close to our 1-hydroxypropan-2-one yield prediction for the unimolecular decay of DMCI under similar conditions. Although such good agreement is probably partly fortuitous, it nonetheless lends confidence that our description of the roaming process is essentially correct.
 |
| | Fig. 11 Reaction yields for the unimolecular decays of propan-2-oneoxide (DMCI, this work, solid lines) and (E)-butan-2-oneoxide ((E)-MECI, Liu et al.,5 dashed lines) plotted as a function of temperature at 0.01 bar. The simulated branching ratios are shown alongside with the 1-hydroxybutan-2-one branching ratio measured by Liu et al. | |
The unimolecular-decay reactions of DMCI, DECI, and (E)- and (Z)-MECI have also been studied computationally by Vereecken et al.,48 and in Fig. 12, we compare their HPL results with those of the present work and Liu et al.5,47 at 1 bar. In the temperature range 200–400 K, the unimolecular-decay reactions are sufficiently close to the HPL at 1 bar to make the comparison with the Vereecken et al. results meaningful. In the considered temperature range, the rate coefficients output by our experimentally constrained models are about 1.5–3 times larger than those reported by Vereecken et al. and Liu et al. for the same or analogous reactions. For the DMCI/(E)-MECI systems, the several kJ mol−1 higher 1,4-hydrogen-shift barriers in their models largely explain the observed differences. However, in the DECI/(Z)-MECI models all the barrier heights are virtually the same, yet our model predicts a larger unimolecular-decay rate coefficient. At present, we do not have a good explanation for this.
 |
| | Fig. 12 Computed unimolecular-decay rate coefficients of (a) propan-2-oneoxide (DMCI) and (E)-butan-2-oneoxide and (b) pentan-3-oneoxide (DECI) and (Z)-butan-2-oneoxide plotted as a function of temperature. Our results, and those of Liu et al.,5 are computed at 1 bar of N2, whereas the Vereecken results are at the high-pressure limit (HPL). | |
4 Conclusions
We have performed direct kinetic measurements to determine the unimolecular-decay rate coefficient of (C2H5)2COO. Both the temperature (223–296 K) and pressure (4–100 torr) dependence of this rate coefficient was investigated. At 296 K and 100 torr, the reaction is already at the high-pressure limit and was found to be fast; kuni = 1530 ± 440 s−1. This value is 2–3 times larger than a previous theoretical determination. Thus, we expect the unimolecular-decay reaction to be the main atmospheric sink of this Criegee intermediate. Master-equation simulations were performed to complement the experimental work – particularly by determining reaction-product yields for the unimolecular-decay channels. We report phenomenological rate coefficients for the different reaction channels to facilitate the use of the present results in atmospheric modelling.
Author contributions
J. P.: performed experiments and wrote the manuscript. T. T. P.: performed quantum-chemistry calculations and master-equation simulations and wrote the manuscript. P. H.: synthesised the 2-bromo-2-iodopropane and 3-bromo-3-iodopentane precursors. Reviewed the manuscript. P. S.: performed experiments. Reviewed the manuscript. N. R.: performed quantum-chemistry calculations. Reviewed the manuscript. G. L.: supervised the computational work. Acquired funding. Reviewed and edited the manuscript. A. J. E.: conceptualised the research and supervised the experiments. Acquired funding. Reviewed and edited the manuscript.
Data availability
The data supporting this article have been included as part of the ESI.† The relative enthalpies calculated with different methods can be found in the ESI.† The saddle-point geometries, Hessians, hindered-rotor potentials, and the effective state sums can be found in the MESMER input files. Other data for this article have been made available at https://zenodo.org/records/13928643.
Conflicts of interest
There are no conflicts to declare.
Acknowledgements
We thank Dr Stephen Klippenstein for many helpful discussions, for sending us rate-coefficient data from his publication that facilitated the comparisons in Fig. 10 and 11, as well as providing us with the canonical estimate for the butan-2-en-1-yl + OH˙ → vdW complex rate coefficient (see eqn (12)). We also thank professor Keith Kuwata for useful discussions, as well as sending us trace data from his publication,10 which we used to do the comparison in Fig. 9. We thank professor Theo Kurtén for reviewing the manuscript. This work was largely funded by the Research Council of Finland (previously Academy of Finland in English) with grant numbers 298910, 325250 and (VILMA center of excellence grant) 346374. Project no. K129140 for T. T. P. and G. L. has been implemented with the support provided by the Ministry of Innovation and Technology of Hungary from the National Research, Development and Innovation Fund, financed under the OTKA funding scheme. Additional funding has been provided by project no. RRF-2.3.1-21-2022-00009, titled the National Laboratory for Renewable Energy, and has been implemented with the support provided by the Recovery and Resilience Facility of the European Union within the framework of Programme Széchenyi Plan Plus. The authors also acknowledge CSC – IT Center for Science, Finland, for computational resources.
Notes and references
- R. Criegee, Angew. Chem., Int. Ed. Engl., 1975, 14, 745–752 CrossRef.
- D. L. Osborn and C. A. Taatjes, Int. Rev. Phys. Chem., 2015, 34, 309–360 Search PubMed.
- C. A. Taatjes, Annu. Rev. Phys. Chem., 2017, 68, 183–207 CrossRef CAS PubMed.
- D. Johnson and G. Marston, Chem. Soc. Rev., 2008, 37, 699–716 RSC.
- T. Liu, S. N. Elliott, M. Zou, M. F. Vansco, C. A. Sojdak, C. R. Markus, R. Almeida, K. Au, L. Sheps, D. L. Osborn, F. A. F. Winiberg, C. J. Percival, C. A. Taatjes, R. L. Caravan, S. J. Klippenstein and M. I. Lester, J. Am. Chem. Soc., 2023, 145, 19405–19420 CrossRef CAS.
- J. Peltola, P. Seal, N. Vuorio, P. Heinonen and A. Eskola, Phys. Chem. Chem. Phys., 2022, 24, 5211–5219 RSC.
- M. I. Lester and S. J. Klippenstein, Acc. Chem. Res., 2018, 51, 978–985 CrossRef CAS PubMed.
- T. A. Stephenson and M. I. Lester, Int. Rev. Phys. Chem., 2020, 39, 1–33 Search PubMed.
- C. A. Taatjes, F. Liu, B. Rotavera, M. Kumar, R. Caravan, D. L. Osborn, W. H. Thompson and M. I. Lester, J. Phys. Chem. A, 2017, 121, 16–23 CrossRef CAS PubMed.
- K. T. Kuwata, L. Luu, A. B. Weberg, K. Huang, A. J. Parsons, L. A. Peebles, N. B. Rackstraw and M. J. Kim, J. Phys. Chem. A, 2018, 122, 2485–2502 CrossRef CAS PubMed.
- G. Wang, T. Liu, A. Caracciolo, M. F. Vansco, N. Trongsiriwat, P. J. Walsh, B. Marchetti, T. N. V. Karsili and M. I. Lester, J. Chem. Phys., 2021, 155, 174305 CrossRef CAS PubMed.
- T. Kurtén and N. M. Donahue, J. Phys. Chem. A, 2012, 116, 6823–6830 CrossRef.
- N. M. Kidwell, H. Li, X. Wang, J. M. Bowman and M. I. Lester, Nat. Chem., 2016, 8, 509–514 CrossRef CAS.
- B. Long, J. L. Bao and D. G. Truhlar, Nat. Chem., 2019, 10, 509–514 Search PubMed.
- G. T. Drozd, J. Kroll and N. M. Donahue, J. Phys. Chem. A, 2011, 115, 161–166 CrossRef CAS PubMed.
- M. C. Smith, W. Chao, K. Takahashi, K. A. Boering and J. J.-M. Lin, J. Phys. Chem. A, 2016, 120, 4789–4798 CrossRef CAS PubMed.
- T. Berndt, T. Jokinen, M. Sipilä, R. L. Mauldin, H. Herrmann, F. Stratmann, H. Junninen and M. Kulmala, Atmos. Environ., 2014, 89, 603–612 CrossRef CAS.
- M. J. Newland, A. R. Rickard, T. Sherwen, M. J. Evans, L. Vereecken, A. Muñoz, M. Ródenas and W. J. Bloss, Atmos. Chem. Phys., 2018, 18, 6095–6120 CrossRef CAS.
- S. J. Klippenstein, Y. Georgievskii and L. B. Harding, J. Phys. Chem. A, 2011, 115, 14370–14381 CrossRef CAS PubMed.
- R. I. Martinez, J. T. Herron and R. E. Huie, J. Am. Chem. Soc., 1981, 103, 3807–3820 CrossRef CAS.
- E. Grosjean and D. Grosjean, Atmos. Environ., 1998, 32, 3393–3402 CrossRef CAS.
- J. Peltola, P. Seal, A. Inkilä and A. Eskola, Phys. Chem. Chem. Phys., 2020, 22, 11797–11808 RSC.
- H. Yu, X. He, S. Louis Li and D. G. Truhlar, Chem. Sci., 2016, 7, 5032–5051 RSC.
- F. Weigend and R. Ahlrichs, Phys. Chem. Chem. Phys., 2005, 7, 3297–3305 RSC.
- T. H. Dunning, J. Chem. Phys., 1989, 90, 1007–1023 CrossRef CAS.
-
M. J. Frisch, et al., Gaussian 16 Revision B.01, Gaussian Inc., Wallingford, CT, 2016 Search PubMed.
- H.-J. Werner, P. J. Knowles, G. Knizia, F. R. Manby and M. Schütz, Wiley Interdiscip. Rev.: Comput. Mol. Sci., 2012, 2, 242–253 CAS.
- H.-J. Werner, P. J. Knowles, F. R. Manby, J. A. Black, K. Doll, A. Heßelmann, D. Kats, A. Köhn, T. Korona, D. A. Kreplin, Q. Ma, I. Miller, F. Thomas, A. Mitrushchenkov, K. A. Peterson, I. Polyak, G. Rauhut and M. Sibaev, J. Chem. Phys., 2020, 152, 144107 CrossRef CAS.
-
H.-J. Werner, P. J. Knowles, P. Celani, W. Györffy, A. Hesselmann, D. Kats, G. Knizia, A. Köhn, T. Korona, D. Kreplin, R. Lindh, Q. Ma, F. R. Manby, A. Mitrushenkov, G. Rauhut, M. Schütz, K. R. Shamasundar, T. B. Adler, R. D. Amos, S. J. Bennie, A. Bernhardsson, A. Berning, J. A. Black, P. J. Bygrave, R. Cimiraglia, D. L. Cooper, D. Coughtrie, M. J. O. Deegan, A. J. Dobbyn, K. Doll, M. Dornbach, F. Eckert, S. Erfort, E. Goll, C. Hampel, G. Hetzer, J. G. Hill, M. Hodges, T. Hrenar, G. Jansen, C. Köppl, C. Kollmar, S. J. R. Lee, Y. Liu, A. W. Lloyd, R. A. Mata, A. J. May, B. Mussard, S. J. McNicholas, W. Meyer, T. F. Miller III, M. E. Mura, A. Nicklass, D. P. O'Neill, P. Palmieri, D. Peng, K. A. Peterson, K. Pflüger, R. Pitzer, I. Polyak, M. Reiher, J. O. Richardson, J. B. Robinson, B. Schröder, M. Schwilk, T. Shiozaki, M. Sibaev, H. Stoll, A. J. Stone, R. Tarroni, T. Thorsteinsson, J. Toulouse, M. Wang, M. Welborn and B. Ziegler, MOLPRO, 2022.3, a package of ab initio programs, see https://www.molpro.net Search PubMed.
-
J. L. Bao, J. Zheng, I. M. Alecu, B. J. Lynch, Y. Zhao and D. G. Truhlar, Database of Frequency Scale Factors for Electronic Model Chemistries, Version 5, https://comp.chem.umn.edu/freqscale/.
- F. Neese, Wiley Interdiscip. Rev.: Comput. Mol. Sci., 2012, 2, 73–78 CAS.
- A. Halkier, T. Helgaker, P. Jørgensen, W. Klopper, H. Koch, J. Olsen and A. K. Wilson, Chem. Phys. Lett., 1998, 286, 243–252 CrossRef CAS.
- B. Chan and L. Radom, J. Chem. Theory Comput., 2015, 11, 2109–2119 CrossRef CAS PubMed.
- M. Kállay, P. R. Nagy, D. Mester, Z. Rolik, G. Samu, J. Csontos, J. Csóka, P. B. Szabó, L. Gyevi-Nagy, B. Hégely, I. Ladjánszki, L. Szegedy, B. Ladóczki, K. Petrov, M. Farkas, P. D. Mezei and A. Ganyecz, J. Chem. Phys., 2020, 152, 074107 CrossRef PubMed.
- MRCC, a quantum chemical program suite written by M. Kállay, P. R. Nagy, D. Mester, L. Gyevi-Nagy, J. Csóka, P. B. Szabó, Z. Rolik, G. Samu, J. Csontos, B. Hégely, Á. Ganyecz, I. Ladjánszki, L. Szegedy, B. Ladóczki, K. Petrov, M. Farkas, P. D. Mezei and R. A. Horváth, see https://www.mrcc.hu.
- V. D. Knyazev, J. Phys. Chem. A, 2003, 107, 11082–11091 CrossRef CAS.
- D. R. Glowacki, C.-H. Liang, C. Morley, M. J. Pilling and S. H. Robertson, J. Phys. Chem. A, 2012, 116, 9545–9560 CrossRef CAS PubMed.
- W. Forst, J. Phys. Chem., 1972, 76, 342–348 CrossRef CAS.
- J. W. Davies, N. J. Green and M. J. Pilling, Chem. Phys. Lett., 1986, 126, 373–379 CrossRef CAS.
- Y. Georgievskii and S. J. Klippenstein, J. Chem. Phys., 2003, 118, 5442–5455 CrossRef CAS.
- C. W. Gao, J. W. Allen, W. H. Green and R. H. West, Comput. Phys. Commun., 2016, 203, 212–225 CrossRef CAS.
-
B. E. Poling, J. M. Prausnitz and J. P. O'Connell, The Properties of Gases and Liquids, McGraw-Hill, 5th edn, 2001 Search PubMed.
- J. Gang, M. J. Pilling and S. H. Robertson, Chem. Phys., 1998, 231, 183–192 CrossRef CAS.
- J. T. Bartis and B. Widom, J. Chem. Phys., 1974, 60, 3474–3482 CrossRef CAS.
- S. H. Robertson, M. J. Pilling, L. C. Jitariu and I. H. Hillier, Phys. Chem. Chem. Phys., 2007, 9, 4085–4097 RSC.
- J. Peltola, P. Heinonen and A. Eskola, J. Phys. Chem. Lett., 2024, 15, 5331–5336 CrossRef CAS.
- T. Liu, S. N. Elliott, M. Zou, M. F. Vansco, C. A. Sojdak, C. R. Markus, R. Almeida, K. Au, L. Sheps, D. L. Osborn, F. A. F. Winiberg, C. J. Percival, C. A. Taatjes, R. L. Caravan, S. J. Klippenstein and M. I. Lester, J. Am. Chem. Soc., 2024, 146, 18184–18185 CrossRef CAS PubMed.
- L. Vereecken, A. Novelli and D. Taraborrelli, Phys. Chem. Chem. Phys., 2017, 19, 31599–31612 RSC.
Footnotes |
| † Electronic supplementary information (ESI) available. See DOI: https://doi.org/10.1039/d4cp03620d |
| ‡ These authors contributed equally to this work. |
| § In fact, Kuwata et al. found two distinct O–O-bond-cleavage saddle-points, and here we refer to the structure that is lower in energy. In the lower-energy structure, the leaving OH˙ group is on the same side with the carbon–carbon double bond, and in the higher-energy structure it is on the same side with the carbon–carbon single bond. Our calculations found only the latter structure. |
|
| This journal is © the Owner Societies 2024 |
Click here to see how this site uses Cookies. View our privacy policy here. 
 Open Access Article
 This Open Access Article is licensed under a
  a,
Timo T.
Pekkanen‡
ab,
Petri
Heinonen
a,
Timo T.
Pekkanen‡
ab,
Petri
Heinonen


 and
and  and ν‡ts1a and ν‡ts1b were fixed to the computed differences.
b W3X-L//CASPT2(8,7)/aug-cc-pVTZ (see Section 2.2 for details).
c CASPT2(8,7)/aug-cc-pVTZ.
d MN15/Def2TZVP.
and ν‡ts1a and ν‡ts1b were fixed to the computed differences.
b W3X-L//CASPT2(8,7)/aug-cc-pVTZ (see Section 2.2 for details).
c CASPT2(8,7)/aug-cc-pVTZ.
d MN15/Def2TZVP.