 Open Access Article
Creative Commons Attribution 3.0 Unported Licence
Valence-band hybridization in sulphides†
Lothar
Weinhardt
 *abc,
Dirk
Hauschild
 abc,
Constantin
Wansorra
 ac,
Ralph
Steininger
a,
Monika
Blum
cde,
Wanli
Yang
 d and
Clemens
Heske
abc
aInstitute for Photon Science and Synchrotron Radiation (IPS), Karlsruhe Institute of Technology (KIT), Kaiserstraße 12, 76131 Karlsruhe, Germany. E-mail: Lothar.Weinhardt@kit.edu
bInstitute for Chemical Technology and Polymer Chemistry (ITCP), Karlsruhe Institute of Technology (KIT), Kaiserstraße 12, 76131, Karlsruhe, Germany
cDepartment of Chemistry and Biochemistry, University of Nevada, Las Vegas (UNLV), 4505 Maryland Parkway, Las Vegas, NV 89154-4003, USA
dAdvanced Light Source (ALS), Lawrence Berkeley National Laboratory, 1 Cyclotron Road, Berkeley, CA 94720, USA
eChemical Sciences Division, Lawrence Berkeley National Laboratory, 1 Cyclotron Road, Berkeley, CA 94720, USA
First published on 27th September 2024
Abstract
The hybridization state in solids often defines the critical chemical and physical properties of a compound. However, it is difficult to spectroscopically detect and evaluate hybridization beyond just general fingerprint signatures. Here, the valence-band hybridization of metal d-derived bands (short: “metal d bands”) in selected metal sulphides is studied with a combined spectroscopic and theoretical approach to derive deeper insights into the fundamental nature of such compounds. The valence bands of the studied sulphides are comprised of hybrid bands derived from the metal d, S 3s, and S 3p states. Employing S K and L2,3 X-ray emission spectroscopy and spectra calculations based on density functional theory, the degree of hybridization (i.e., the covalency) of these bands can be directly probed as a function of their relative energies. We find that the relative intensity of the “metal d band” features in the spectra scales with the inverse square of the energy separation to the respective sulfur-derived bands, which can be analytically derived from a simple two-orbital model. This study demonstrates that soft X-ray emission spectroscopy is a powerful tool to study valence state hybridization, in particular in combination with hard X-ray emission spectroscopy, promising a broad impact in many research fields.
Introduction
Understanding chemical bonding in molecules and crystalline solids is fundamental in chemistry and physics. When atoms are brought together, their electronic orbitals can interact by forming hybrid orbitals, chemical bonds, and, accordingly, the electronic structure of the molecule or compound.1 This electronic structure governs many of the material properties, and its characterization is thus at the centre of both fundamental and applied research. This is particularly true for the electronic valence-band structure; however, determining it in all aspects is very challenging.In general, and as highlighted by our study, the energies and wave functions of the valence bands are crucial for hybridization and covalency (i.e., the amount of admixture of the bonding partner states in the hybrid functions) and thus the bonding within the solid. They also dictate the interactions at interfaces or between adsorbates and surfaces. Many of these aspects are not yet understood and subject to intensive current research. For example, the catalytic activity of a material crucially depends on the wave-function overlap and energetic alignment between catalyst and adsorbate states. Theories rationalizing the catalytic activity based on the electronic structure, such as the d-band centre model2–4 exist, but are still not fully understood and intensely debated.5–7 Hybridization and covalency are also broadly studied in bulk materials, such as lanthanide and actinide compounds involving 4f and 5f bands,8–10 battery materials,11 and many other materials research fields. Despite the intensive research efforts, many questions remain unanswered, since our understanding strongly relies on calculations, most commonly based on density functional theory (DFT) that faces some challenges in formulating a quantitative and sometimes even qualitative description of hybridization/covalency. This (and most other) limitation(s) of DFT can be traced back to the delocalization error, i.e., the tendency of approximate functionals to artificially delocalize the electron density,12–15 which can be particularly critical for localized d- or f-bands/orbitals (as discussed in this paper).
Experimental techniques probing hybridization/covalency, and bonding are usually indirect and thus often require theory to extract meaningful information. In the following, several established spectroscopic techniques that study some aspects of orbitals and hybridization are discussed. Other aspects are much more difficult to access, especially when a fundamental understanding of the characterization methods and their interplay with the electronic structure (e.g., resonant excitations) is required for a correct interpretation of the experimental results. Taking photoionization cross sections into account, photoelectron spectroscopy (PES) can be used to derive the total density of states in the valence band. This is often done with UV excitation (UPS), and angle-resolved UPS (AR-UPS) can be further employed to study the k-dependent valence-band structure of single-crystal systems. Studying the valence state wave functions, their localization, and hybridization is more challenging, in particular for multi-element compounds. For molecular systems, much can be learned from molecular orbital theory, and electron and X-ray spectroscopy are helpful experimental tools that give direct insights. In the case of highly-ordered systems, like molecular monolayers on single-crystal metal surfaces, AR-UPS supported by density functional theory has been used to map the molecular orbitals.16–18 For disordered molecular systems, including in the gas and liquid phases, soft X-ray emission spectroscopy (XES) and resonant inelastic soft X-ray scattering (RIXS) have become powerful tools to study valence orbitals as well, providing information from the viewpoint of a selected core level, i.e., in an atom-specific way.19–22 This can be exploited to derive a detailed understanding of the orbitals of specific functional groups, which often give a characteristic spectral “fingerprint”.21,23,24 To study the unoccupied states, X-ray absorption spectroscopy has been used extensively, e.g., for studying metal–ligand covalency.8–10,25
For inorganic crystalline materials, angle-resolved hard X-ray photoelectron spectroscopy has been employed for “imaging of valence orbitals”, similar to the AR-UPS studies of molecular systems.26 Some information on the atom-projected density of states can be gained by using X-ray standing wave excited photoemission.27–29 However, these techniques are only applicable to well-defined, single-crystal samples. Again, XES and RIXS provide a very direct access and allow us to paint a very detailed picture of valence-band hybridization.
In this paper, we use XES to directly probe the hybridization in the valence bands of metal sulphides. The experimental data allows us to optimize our DFT spectra calculations and derive a simplified two-state model that gives very general, semi-quantitative rules for the “atomic” contributions to the hybrid bands (i.e., the covalency).
Experimental and computational methods
α-HgS, β-HgS, In2S3, and Ga2S3 powders were acquired from Thermo Fisher Scientific and pressed to thin pellets. A hexagonal CdS and a cubic ZnS single crystal were purchased from MaTecK.The S L2,3 X-ray emission spectra were recorded in the solid and liquid spectroscopic analysis (SALSA) roll-up experimental station30 at beamline 8.0.1 of the ALS using its high-transmission spectrometer.31 The spectrometer resolution was better than 0.2 eV and the energy scales of beamline and spectrometer were carefully calibrated as described in ref. 32 for ZnS, CdS, Ga2S3, and In2S3, which gives an emission energy scale with an absolute uncertainty of 0.1 eV and a relative uncertainty of 0.03 eV between the measurements. The HgS spectra were measured in a second experimental run, and their energy scale was adjusted (with a relative uncertainty of 0.1 eV) to that of the other sulphides by CaSO4 reference measurements conducted in both runs.
Band structures, projected density of states (PDOS), and XES spectra were calculated with the full-potential linearized augmented plane wave plus local orbitals (FLAPW + lo) method to solve the Kohn–Sham DFT equations as implemented in the WIEN2k software package.33 Crystal structures were taken from the Materials Project Database.34 The generalized gradient approximation (GGA), as parameterized by Perdew, Burke, and Ernzerhof (PBE),35 was used to describe the electronic exchange–correlation effects. The self-consistent field (SCF) calculation was run with 1000 k points for CdS, ZnS, α-HgS, and β-HgS, while 200 k points were used for In2S3 and Ga2S3 with their much larger unit cells. PDOS were calculated with 10![[thin space (1/6-em)]](https://www.rsc.org/images/entities/char_2009.gif) 000 k points for CdS, ZnS, α-HgS, and β-HgS, as well as 5000 k points for In2S3 and Ga2S3. In addition to these DFT-only calculations, calculations including a Hubbard U36,37 (DFT+U) were performed to adjust the positions of the metal d-derived bands. The Hubbard U values were adjusted to align the emission energies of the theory to the experiment, as described in more detail below. The S K and L2,3 XES intensities were calculated with the utility xspec, as implemented in Wien2k. This utility calculates the XES intensity as IXES/(hν)3 from the PDOS using the formulas derived by Schwarz et al.38–40IXES was determined by multiplying with (hν)3 derived from the experimental emission energy scale after aligning the energy scale of the theory with that of the experiment, as shown in Fig. 2. Since, in the final state of the XES process, the core level is filled and the valence hole is well screened, this “ground-state approach” gives a very good description of the XES spectra of semiconductors and metals.33,41
000 k points for CdS, ZnS, α-HgS, and β-HgS, as well as 5000 k points for In2S3 and Ga2S3. In addition to these DFT-only calculations, calculations including a Hubbard U36,37 (DFT+U) were performed to adjust the positions of the metal d-derived bands. The Hubbard U values were adjusted to align the emission energies of the theory to the experiment, as described in more detail below. The S K and L2,3 XES intensities were calculated with the utility xspec, as implemented in Wien2k. This utility calculates the XES intensity as IXES/(hν)3 from the PDOS using the formulas derived by Schwarz et al.38–40IXES was determined by multiplying with (hν)3 derived from the experimental emission energy scale after aligning the energy scale of the theory with that of the experiment, as shown in Fig. 2. Since, in the final state of the XES process, the core level is filled and the valence hole is well screened, this “ground-state approach” gives a very good description of the XES spectra of semiconductors and metals.33,41
Results and discussion
Experimental spectra
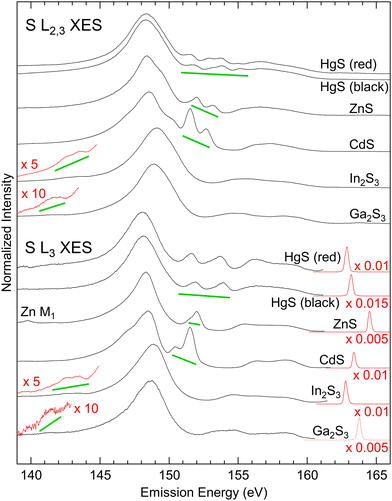
The S L2,3 (top) and L3 (bottom) XES spectra of the investigated sulphides are shown in Fig. 1. The S L2,3 spectra were excited well above the absorption edge, while the S L3 spectra were excited with photon energies in-between the L3 and L2 edges. XES probes the local partial density of states, and thus only transitions from valence states that possess a wave function overlap with the involved core levels can occur, provided that they obey the dipole selection rule Δl = ±1 (here: S 2p core levels, selecting valence states with s and d symmetry).The electronic valence structure of the investigated metal sulphides is formed from the S 3s and 3p states, while the metals contribute with d states (Ga and Zn 3d, In and Cd 4d, and Hg 5d, respectively), s states (Ga and Zn 4s, In and Cd 5s, and Hg 6s, respectively), and p states (Ga 4p and In 5p). Due to the higher electronegativity of sulfur as compared to the metals (1.65, 1.69, 2.00, 1.81, 1.78, and 2.58 Pauling units for Zn, Cd, Hg, Ga, In, and S, respectively42), a part of the metal s and p electrons are transferred to the sulfur atoms. All states hybridize and form three groups of bands within the periodic crystal structure of the metal sulphides. In the following, we will name these groups of bands according to the dominating contribution from the atomic states listed above, i.e., “S 3s bands”, “metal d bands”, and “S 3p bands”, while a more refined discussion of these hybrid states/bands will be given further below.
These three groups of bands can be distinguished as three well-separated spectral regions in the S L2,3 XES spectra of all investigated compounds: The main emission line related to the “S 3s bands” with its maximum between 148 and 149 eV, emission from the “metal d bands” marked with green lines in Fig. 1, and the “S 3p bands” between ∼153 and ∼161 eV. In the S L2,3 spectra, all these features appear twice, separated by the S 2p spin–orbit splitting of 1.2 eV and with a relative intensity ratio of ∼2![[thin space (1/6-em)]](https://www.rsc.org/images/entities/char_2009.gif) :
:![[thin space (1/6-em)]](https://www.rsc.org/images/entities/char_2009.gif) 1 (L3
1 (L3![[thin space (1/6-em)]](https://www.rsc.org/images/entities/char_2009.gif) :
:![[thin space (1/6-em)]](https://www.rsc.org/images/entities/char_2009.gif) L2), while they only appear once in the S L3 spectra. Taking a closer look at the S L3 spectra, we find the “metal d bands” to be split into two features. This splitting corresponds to the spin–orbit splitting of these bands, which is most prominent for HgS.
L2), while they only appear once in the S L3 spectra. Taking a closer look at the S L3 spectra, we find the “metal d bands” to be split into two features. This splitting corresponds to the spin–orbit splitting of these bands, which is most prominent for HgS.
Comparison with calculated spectra
The S L3 (bottom panels) and S K (top panels) spectra of CdS are analysed using calculations based on DFT and DFT+U in Fig. 2(a) (left) and Fig. 2(b) (right), respectively. Starting with the band structure calculation at the bottom, we find the weakly dispersing “S 3s bands” at ∼12 eV (DFT-only) and ∼11 eV (DFT+U) below the valence-band maximum (VBM). Above, between 8–6.5 eV (DFT-only) and 9.5–7 eV (DFT+U), the “metal d bands” are found, which also only weakly disperse. Finally, between 4 eV and the VBM, the “S 3s bands” are found, which exhibit much stronger dispersion.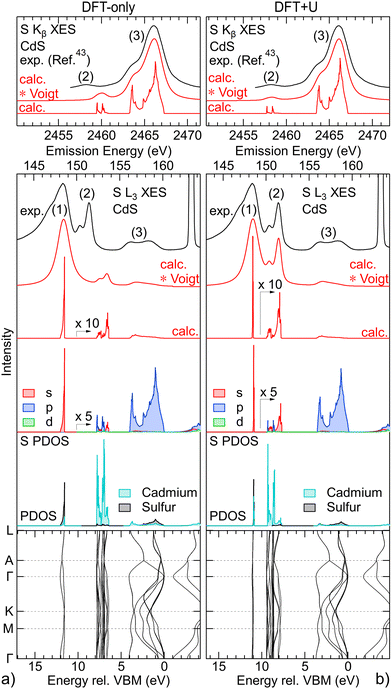 | ||
| Fig. 2 Analysis of the experimental S L3 (bottom panels) and S K (top panels) XES spectra of CdS with calculations based on DFT-only (left) and DFT+U (right). From bottom to top, bottom panels: calculated k-resolved band structure, density of states projected onto cadmium and sulfur (PDOS), density of states projected onto s, p, and d symmetries for the sulfur atom (S PDOS), calculated S L3 XES spectrum without (calc.) and with convolution with Voigt profiles (calc. * Voigt), experimental S L3 XES spectrum; top panels: calculated S K XES spectrum without (calc.) and with convolution with Voigt profiles (calc. * Voigt), experimental S K XES spectrum (digitized from ref. 43). | ||
Above the band structure, the densities of states, projected onto sulfur and cadmium (PDOS), are shown in grey and turquoise, respectively. As expected, the “S 3s bands” predominantly give S PDOS, while for the “metal d bands” mostly Cd PDOS is found. Further separating the S PDOS into s, p, and d symmetry contributions, we find that the “S 3s bands” nearly exclusively contribute with s symmetry to the S PDOS, while mainly p symmetry S PDOS is found in region of the “S 3p bands” (also as expected). In the region of the “metal d bands”, we find mainly s and p symmetry S PDOS, which can be attributed to the “metal d bands” hybridizing with the “S 3s bands”, as well as “metal d bands” hybridizing with the “S 3p bands”. Only a very small contribution of d symmetry S PDOS is found in the region of the Cd 4d-derived bands.
From the S PDOS, the S L2,3 (directly above the S PDOS) and S K (top panel) XES spectra (red) are computed in a Fermi-golden-rule approach,38–40 which are dominated by contributions from s (S L2,3) and p (S K) symmetry states, respectively. The calculation is then convoluted with Voigt line profiles to account for experimental and lifetime broadening with Gaussian and Lorentzian profiles adjusted to fit the experimental spectra.
While the DFT-only calculation in Fig. 2(a) qualitatively reproduces the three main features of the experiment, i.e., emission from “S 3s bands” (1), “metal d bands” (2), and “S 3p bands” (3), the quantitative agreement is not satisfying. First, the S L2,3 intensity in the “S 3p bands” (3) region is strongly underestimated by the calculation. This has been attributed to different origins,44e.g., resonant effects present at this excitation energy (but not accounted for in the calculation) and an underestimation of the relative s vs. p character of the upper valence band. Second, the calculation of the S L2,3 spectra is missing intensity on the low-energy side of the “S 3s bands” (1). This experimentally observed intensity can be attributed to “semi-Auger” satellites, which we have previously discussed in the S L2,3 emission of alkaline earth metal sulphides.45 Third, and most important for the discussion in this paper, the emission from the “metal d bands” (2) is found at higher energies in the calculation as compared to the experimental S L2,3 and K spectra. Furthermore, the calculated intensity of these features is significantly too low for S L2,3 and too high for S K, respectively.
Such an underestimation of binding energies of the rather localized “metal d bands” is commonly observed when using DFT with LDA or GGA approximation.46 The situation can be improved by different approaches, including GW,47 exact-exchange,46 or self-interaction and relaxation-corrected pseudopotentials,48 which are good approaches to also “predict” the properties and spectra of new compounds. Here, we have chosen a different approach, namely DFT+U,36,37 which is computationally “cheap” and allows us to systematically vary the energies of the d bands. The accuracy of DFT+U largely depends on a good choice of the effective Hubbard Ueff = U − J, with U representing the on-site Coulomb repulsion and J the exchange interaction. To study the influence of the position of the “metal d bands” within the band structure, we have not attempted to use any ab initio method49 to determine a good Ueff, but instead use Ueff as our “turning knob” to study hybridization as a function of “metal d band” energies.
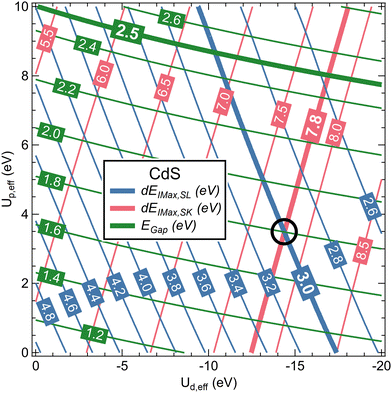
Metal d and sulfur p states were treated independently with Ud,eff and Up,eff, respectively. For CdS, twenty-one Ud,eff and eleven Up,eff values were used, giving a matrix of 231 individual calculations. Using an automated approach as described in the ESI,† the band gap energies EGap as well as the intensities and energies of the “S 3s bands”, the “metal d bands”, and “S 3p bands” for S L3 and S K XES were determined for all calculations. The energies were determined in two different ways (see also description in the ESI†): by deriving (1) the centre of mass (e.g., E3s,COM,SL for the centre of mass energy of the “S 3s bands” in S L3 XES), as well as (2) the intensity maxima after convolution with Voigt profiles (e.g., E3s,Imax,SL for the energy of the peak maximum of the “S 3s bands” in S L3 XES). The former is best suited for discussing hybridization, while the latter is best suited for a direct comparison with experimental peak positions. From these energies, the following four energy separations were computed: dECOM,SL = Ed,COM,SL − E3s,COM,SL, dEImax,SL = Ed,Imax,SL − E3s, Imax, SL, dECOM,SK = E3p,COM,SK − Ed,COM,SK, and dEImax,SK = E3p,Imax,SK − Ed,Imax,SK.
In Fig. 3, Egap, dEImax,SL, and dEImax,SK for CdS are shown as a function of Ud,eff and Up,eff in a contour plot after polynomial interpolation. The thick lines highlight the experimental values. We find that, with Ud,eff = −14.4 eV and Up,eff = 3.5 eV as marked with a black circle in Fig. 3, both dEImax,SL and dEImax,SK correspond to the experimental values. For these parameters, EGap also improves to 1.8 eV as compared to 1.2 eV for the DFT-only calculation, but is still below the experimental value of 2.5 eV.50 This, however, is not critical for the present study.
The calculation with optimized Hubbard U values in Fig. 2(b) shows a clear improvement over the DFT-only calculation. By construction, the relative experimental positions of the emission from the “S 3s bands” and “metal d bands” in the S L2,3 XES and the “S 3p bands” and “metal d bands” in the S K XES are reproduced by the calculation. At the same time, we now find a good agreement of their relative intensities.
Using the same procedure, suitable Ud,eff and Up,eff values for ZnS, β-HgS, and α-HgS were determined. For In2S3 and Ga2S3, only Ud,eff was optimized, since no features related to “metal d bands” are visible in the S K spectra. In Fig. 4, the experimental S L3 (left) and literature S K (right) XES spectra of all compounds are shown in black and are compared with spectra calculated by DFT-only (gray) and DFT+U (green). In the calculated spectra, the features related to the “metal d bands” are shaded for better visibility. For all compounds, the “metal d bands” appear too high in energy for the DFT-only calculation, which is corrected in the DFT+U calculation. In parallel, the corresponding line intensities strongly depend on their energy separation from the “S 3s bands” and “S 3p bands”, respectively. These relative intensities are well reproduced in the DFT+U calculations. As a general trend, the relative intensities of the “metal d bands” increase with proximity to the “S 3s bands” and “S 3p bands”, respectively, indicating an increasing degree of hybridization.
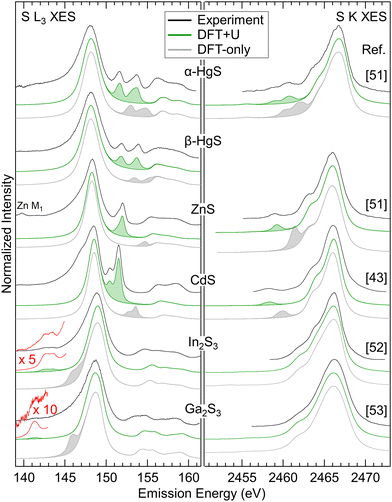 | ||
| Fig. 4 S L3 (left) and S K (right) XES spectra for the compounds listed in the centre. Experimental spectra are shown in black, spectra calculated by DFT-only in gray, and spectra calculated by DFT+U in green. Features related to the “metal d bands” are shaded. The experimental S K spectra are digitized from ref. 43 and 51–53 as indicated next to the corresponding spectra. | ||
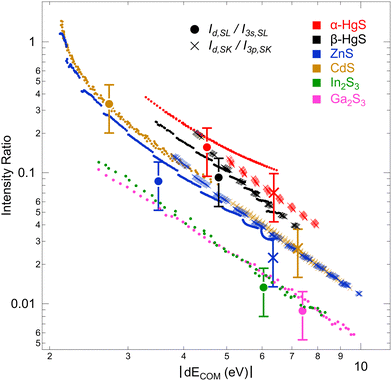
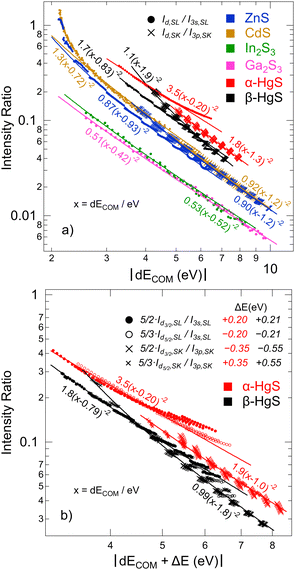
To further study this dependency, which reflects the covalency of the different bands, Fig. 5 shows the intensity ratio of the “metal d bands” and the “S 3s bands”, Id,SL/I3s,SL, as a function of dECOM (for S L2,3 XES); also, the intensity ratio of the “metal d bands” and the “S 3p bands”, Id,SK/I3p,SK, is shown (for S K XES). By using the data for all Ud,eff and Up,eff, we obtain a prediction of the area ratios for arbitrary (hypothetical) dECOM for each compound. The plot contains calculated ratios for S L3 (small, filled circles) and S K (small crosses), as well as the experimental values (large symbols with error bars). As already discussed above, the experimental values are close to the calculation. In the double-logarithmic plot in Fig. 5, the data appear mostly linear (except at small dECOM), indicating a power-law dependency. In the following, we will use a simple hybridization model to discuss the dependency of the intensity ratios on dECOM.
Hybridization model
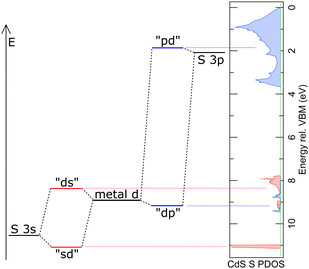
As a simple model, we describe the hybrid bands as hybrid orbitals formed by hybridization of “atomic” S 3s, S 3p, and metal d orbitals with wave functions φS3s, φS3p, and φd, respectively. We limit the model to hybrid orbitals formed by two separate orbital “pairs”, i.e., S 3s with metal d and metal d with S 3p, respectively. Analogous to the treatment of the hydrogen molecule by Heitler and London,54 we then assume that the wave function ψx of the hybrid orbital x can be described as a linear combination of the “atomic” orbitals, e.g., ψsd = c1φS3s + c2φd. With the Schrödinger equation, the Hamiltonian Ĥ of the system, and the energy Ex of the hybrid orbital x, we obtain 〈ψx|Ĥ|ψx〉 = 〈ψx|Ex|ψx〉. Using the variational Ritz method,55 we can derive the following hybrid orbital energies and wave functions (for the calculation see ESI†):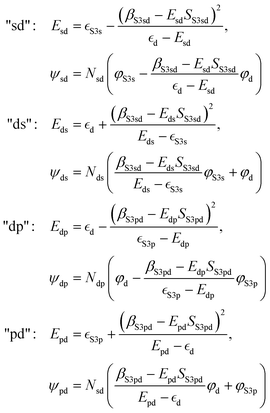 | (1) |
The emission intensity of photons of energy E generated by transitions from an initial state |i〉 to a final state |f〉 is proportional to E3|〈f|![[x with combining circumflex]](https://www.rsc.org/images/entities/i_char_0078_0302.gif) |i〉|2, as derived by Dirac.56,57 With the S 2p wave function φS2p, the “S 3s bands” represented by the “sd” orbital, the “metal d bands” by the “ds” and “dp” orbitals, and the “S 3p bands” by the “pd” orbital, we can now simulate the area ratios shown in Fig. 5 within our model. For S L2,3 XES, this gives
|i〉|2, as derived by Dirac.56,57 With the S 2p wave function φS2p, the “S 3s bands” represented by the “sd” orbital, the “metal d bands” by the “ds” and “dp” orbitals, and the “S 3p bands” by the “pd” orbital, we can now simulate the area ratios shown in Fig. 5 within our model. For S L2,3 XES, this gives
 | (2) |
Using the energies and wavefunctions given in (1), we find the following simple relationship as derived in the (ESI†):
 | (3) |
 and
and  . ΔEsd accounts for the difference in energy between the S 3s and the “sd” levels (see Fig. 6). Cds contains the wave function normalization constants and the resonance integral βS3sd, which might be interpreted as a measure for the bonding strength between S 3s and the metal d states.
Similarly, the intensity ratio of the “metal d bands” and the “S 3p bands” in the S K emission can be approximated by
 | (4) |
With formulas (3) and (4), we will now discuss the data of Fig. 5 in detail. To do this, this data is fitted in Fig. 7(a) using (3) and (4) with Cds (Cdp) and ΔEsd (ΔEpd) as fitting parameters. Overall, the observed dependency on dECOM of the DFT+U calculated intensity ratios is well reproduced by the fits, which suggests that our simple model indeed describes the main effect. This is remarkable since the model contains quite strong simplifications. In particular, it only treats the hybridization of two discrete states, while the electronic structures of the actual compounds are characterized by a multitude of dispersing bands. As one consequence visible in Fig. 7(a), the S L2,3 XES intensity ratios of ZnS and CdS deviate from the fit for small dECOM, indicating that, at small dECOM, the widths of the “metal d bands” would need to be taken into account when parts of the bands are significantly closer to the “S 3s bands” than dECOM.
With some caution, we might now interpret larger values for  to indicate larger βS3sd and thus stronger bonding contributions of the “ds” hybrid orbitals (likewise for
  , βS3pd, and the “dp” hybrid orbitals). Most prominently, the “metal d bands” of In2S3 and Ga2S3 exhibit smaller Cds than all other compounds. The reason for this is that in these two compounds, the “metal d bands” are located at higher binding energies below the “S 3s bands”, which makes these bands more localized at the metal site and reduces overlap and consequently bonding contributions as compared to the other investigated sulphides where the “metal d bands” are located at lower binding energies than the “S 3s bands”.
In α-HgS and β-HgS, the spin–orbit splitting of the (relativistic) “metal d bands” is strong enough that the contributions of Hg 5d3/2 (“d3/2”) and 5d5/2 (“d5/2”) derived bands are well separated. We will use this in the following to study their individual contributions in conjunction with Fig. 7(b). The relative spectral weights of “d3/2” and “d5/2” will depend on three main factors: first the multiplicity of the states according to 2j + 1, second their separation from (and thus hybridization strength with) the “S 3s” and “S 3p” bands, which differ by the d-band spin–orbit splitting, and third the hybridization between “d3/2” and “d5/2” themselves. The multiplicity is considered in Fig. 7(b) by multiplying the “d3/2” and “d5/2” values with 5/2 and 5/3, respectively. The other two factors are taken into account by correcting the common dECOM (i.e., including “d3/2” and “d5/2”) by the ΔE values given in Fig. 7(b) to shift the data points of “d3/2” and “d5/2” on top of each other. This was done symmetrically, i.e., with the total shift evenly distributed to “d3/2” and “d5/2”. In one extreme, if exclusively hybridization with the “S 3s” and “S 3p” bands would occur and hybridization between the “d3/2” and “d5/2” bands could be neglected, the overall shift should correspond to the d-band spin–orbit splitting. In the other extreme, with strongly dominating hybridization between the “d3/2” and “d5/2” bands and much weaker hybridization with the “S 3s” and “S 3p” bands, the ΔE values would approach 0. Since the total shifts in Fig. 7(b), ranging from 0.40 eV for the S L2,3 of α-HgS to 1.1 eV for S K of β-HgS, are considerable smaller than the spin–orbit splitting of ∼2 eV for α-HgS and β-HgS, a strong role of the hybridization between “d3/2” and “d5/2” is indicated. This is expected from the formulas derived for the two-state model, since the energy distance is small between “d3/2” and “d5/2” and their resonance integrals are large. The fits of the data are shown as lines in Fig. 7(b), with the corresponding parameters given next to the curves; these parameters are very similar to the ones derived without separating “d3/2” and “d5/2” (see Fig. 7(a)).
Conclusions
Using comprehensive X-ray emission spectroscopy (XES), we have taken a detailed look at the hybridization and covalency in the valence band of metal sulphides, i.e., between sulphur 3s, 3p, and metal d-derived states. Analysing XES at both the S K and L2,3 edges, the s-, p-, and d-type (projected) density of states can be derived. Spectra calculations based on DFT+U reveal the strong dependence of the covalency on the relative energies of the involved valence states. This dependence is studied by varying the position of the metal d states within the valence band using different Hubbard U parameters. We show that this effect can be very well described by a simple two-state model. One of the results of this model, namely that the admixture of the respective “other” state to the hybrid orbital, i.e., the covalency, scales with the inverse energy separation of the two hybridizing states, is in excellent quantitative agreement with the experimentally observed behaviour of the investigated metal sulphides. In fact, this finding is likely applicable to many other compounds as well. Furthermore, as a second important outcome of the model, it is now possible to derive quantitative insights into the overlap between the hybridizing wave functions themselves, including those “only” separated by spin–orbit splitting in the valence band. Again, this approach is expected to be transferable to many other compounds, especially if heavy atoms are involved (i.e., with substantial spin–orbit splitting in the valence states). Overall, our approach thus demonstrates a new pathway towards a deeper understanding of valence hybridization, based on a powerful, yet established, photon-in–photon-out spectroscopic method. In particular combining soft and hard X-ray spectroscopy techniques is expected to have a strong impact in various research fields.Author contributions
L. W., D. H., and C. H. conceptualized the study. L. W., D. H., C. W., R. S., M. B., and W. Y. performed the experiments. L. W. analysed the data and performed the DFT calculations. L. W. wrote the manuscript with contributions of all authors.Data availability
All data supporting the findings of this study are available from the corresponding authors upon reasonable request.Conflicts of interest
There are no conflicts to declare.Acknowledgements
This research used resources of the Advanced Light Source, which is a DOE Office of Science User Facility under contract no. DE-AC02-05CH11231. We gratefully acknowledge the outstanding support by the ALS safety team, in particular Doug Taube and Alyssa Brand. D. Hauschild, L. Weinhardt, and C. Heske thank the Deutsche Forschungsgemeinschaft (DFG) for funding in projects GZ:INST 121384/65-1 FUGG and GZ:INST 121384/66-1 FUGG.Notes and references
- L. Pauling, The Nature of the Chemical Bond and the Structure of Molecules and Crystals: An Introduction to Modern Structural Chemistry, Cornell University Press, 1960 Search PubMed.
- B. Hammer and J. K. Nørskov, Surf. Sci., 1995, 343, 211–220 CrossRef CAS.
- B. Hammer and J. K. Norskov, Nature, 1995, 376, 238–240 CrossRef CAS.
- J. K. Nørskov, F. Abild-Pedersen, F. Studt and T. Bligaard, Proc. Natl. Acad. Sci. U. S. A., 2011, 108, 937–943 CrossRef PubMed.
- T. Hofmann, T. H. Yu, M. Folse, L. Weinhardt, M. Bär, Y. Zhang, B. V. Merinov, D. J. Myers, W. A. Goddard and C. Heske, J. Phys. Chem. C, 2012, 116, 24016 CrossRef CAS.
- S. Bhattacharjee, U. V. Waghmare and S.-C. Lee, Sci. Rep., 2016, 6, 35916 CrossRef CAS PubMed.
- H. Chen, Q. Wu, Y. Wang, Q. Zhao, X. Ai, Y. Shen and X. Zou, Chem. Commun., 2022, 58, 7730–7740 RSC.
- T. Vitova, I. Pidchenko, D. Fellhauer, P. S. Bagus, Y. Joly, T. Pruessmann, S. Bahl, E. Gonzalez-Robles, J. Rothe, M. Altmaier, M. A. Denecke and H. Geckeis, Nat. Commun., 2017, 8, 16053 CrossRef CAS PubMed.
- J. Su, E. R. Batista, K. S. Boland, S. E. Bone, J. A. Bradley, S. K. Cary, D. L. Clark, S. D. Conradson, A. S. Ditter, N. Kaltsoyannis, J. M. Keith, A. Kerridge, S. A. Kozimor, M. W. Löble, R. L. Martin, S. G. Minasian, V. Mocko, H. S. La Pierre, G. T. Seidler, D. K. Shuh, M. P. Wilkerson, L. E. Wolfsberg and P. Yang, J. Am. Chem. Soc., 2018, 140, 17977–17984 CrossRef CAS PubMed.
- T. Vitova, P. W. Roesky and S. Dehnen, Commun. Chem., 2022, 5, 1–4 CrossRef PubMed.
- Z. Lv, B. Peng, X. Lv, Y. Gao, K. Hu, W. Dong, G. Zheng and F. Huang, Adv. Funct. Mater., 2023, 33, 2214370 CrossRef CAS.
- A. J. Cohen, P. Mori-Sánchez and W. Yang, Science, 2008, 321, 792–794 CrossRef CAS PubMed.
- K. R. Bryenton, A. A. Adeleke, S. G. Dale and E. R. Johnson, Wiley Interdiscip. Rev.: Comput. Mol. Sci., 2023, 13, e1631 CAS.
- Q. Zhao and H. J. Kulik, J. Chem. Theory Comput., 2018, 14, 670–683 CrossRef CAS PubMed.
- P. Verma and D. G. Truhlar, Trends Chem., 2020, 2, 302–318 CrossRef CAS.
- P. Puschnig, E.-M. Reinisch, T. Ules, G. Koller, S. Soubatch, M. Ostler, L. Romaner, F. S. Tautz, C. Ambrosch-Draxl and M. G. Ramsey, Phys. Rev. B: Condens. Matter Mater. Phys., 2011, 84, 235427 CrossRef.
- M. Wießner, D. Hauschild, C. Sauer, V. Feyer, A. Schöll and F. Reinert, Nat. Commun., 2014, 5, 4156 CrossRef PubMed.
- X. Yang, M. Jugovac, G. Zamborlini, V. Feyer, G. Koller, P. Puschnig, S. Soubatch, M. G. Ramsey and F. S. Tautz, Nat. Commun., 2022, 13, 5148 CrossRef CAS PubMed.
- J. Nordgren and J.-E. Rubensson, in Synchrotron Light Sources and Free-Electron Lasers, ed. E. Jaeschke, S. Khan, J. R. Schneider and J. B. Hastings, Springer International Publishing, Cham, 2015, pp. 1–27 Search PubMed.
- O. Fuchs, M. Zharnikov, L. Weinhardt, M. Blum, M. Weigand, Y. Zubavichus, M. Bär, F. Maier, J. D. Denlinger, C. Heske, M. Grunze and E. Umbach, Phys. Rev. Lett., 2008, 100, 027801 CrossRef CAS PubMed.
- F. Meyer, M. Blum, A. Benkert, D. Hauschild, S. Nagarajan, R. G. Wilks, J. Andersson, W. Yang, M. Zharnikov, M. Bär, C. Heske, F. Reinert and L. Weinhardt, J. Phys. Chem. B, 2014, 118, 13142–13150 CrossRef CAS PubMed.
- F. Gel’mukhanov and H. Ågren, Phys. Rep., 1999, 312, 87 CrossRef.
- F. Meyer, L. Weinhardt, M. Blum, M. Bär, R. G. Wilks, W. Yang, C. Heske and F. Reinert, J. Chem. Phys., 2013, 138, 034306 CrossRef CAS PubMed.
- F. Meyer, M. Blum, A. Benkert, D. Hauschild, Y. L. Jeyachandran, R. G. Wilks, W. Yang, M. Bär, C. Heske, F. Reinert, M. Zharnikov and L. Weinhardt, J. Phys. Chem. B, 2017, 121, 6549–6556 CrossRef CAS PubMed.
- T. Glaser, B. Hedman, K. O. Hodgson and E. I. Solomon, Acc. Chem. Res., 2000, 33, 859–868 CrossRef CAS PubMed.
- D. Takegami, L. Nicolaï, Y. Utsumi, A. Meléndez-Sans, D. A. Balatsky, C.-A. Knight, C. Dalton, S.-L. Huang, C.-S. Chen, L. Zhao, A. C. Komarek, Y.-F. Liao, K.-D. Tsuei, J. Minár and L. H. Tjeng, Phys. Rev. Res., 2022, 4, 033108 CrossRef CAS.
- Y. Chen, L. O. Jones, T. L. Lee, A. Das, M. A. Mosquera, D. T. Keane, G. C. Schatz and M. J. Bedzyk, Phys. Rev. Lett., 2022, 128, 206801 CrossRef CAS PubMed.
- J. C. Woicik, E. J. Nelson and P. Pianetta, Phys. Rev. Lett., 2000, 84, 773–776 CrossRef CAS PubMed.
- J. C. Woicik, E. J. Nelson, L. Kronik, M. Jain, J. R. Chelikowsky, D. Heskett, L. E. Berman and G. S. Herman, Phys. Rev. Lett., 2002, 89, 077401 CrossRef CAS PubMed.
- M. Blum, L. Weinhardt, O. Fuchs, M. Bär, Y. Zhang, M. Weigand, S. Krause, S. Pookpanratana, T. Hofmann, W. Yang, J. D. Denlinger, E. Umbach and C. Heske, Rev. Sci. Instrum., 2009, 80, 123102 CrossRef CAS PubMed.
- O. Fuchs, L. Weinhardt, M. Blum, M. Weigand, E. Umbach, M. Bär, C. Heske, J. Denlinger, Y. D. Chuang, W. McKinney, Z. Hussain, E. Gullikson, M. Jones, P. Batson, B. Nelles and R. Follath, Rev. Sci. Instrum., 2009, 80, 63103 CrossRef CAS PubMed.
- L. Weinhardt, D. Hauschild, R. Steininger, N. Jiang, M. Blum, W. Yang and C. Heske, Anal. Chem., 2021, 93, 8300–8308 CrossRef CAS PubMed.
- P. Blaha, K. Schwarz, F. Tran, R. Laskowski, G. K. H. Madsen and L. D. Marks, J. Chem. Phys., 2020, 152, 074101 CrossRef CAS PubMed.
- A. Jain, S. P. Ong, G. Hautier, W. Chen, W. D. Richards, S. Dacek, S. Cholia, D. Gunter, D. Skinner, G. Ceder and K. A. Persson, APL Mater., 2013, 1, 011002 CrossRef.
- J. P. Perdew, K. Burke and M. Ernzerhof, Phys. Rev. Lett., 1996, 77, 3865–3868 CrossRef CAS PubMed.
- V. I. Anisimov, J. Zaanen and O. K. Andersen, Phys. Rev. B: Condens. Matter Mater. Phys., 1991, 44, 943–954 CrossRef CAS PubMed.
- A. I. Liechtenstein, V. I. Anisimov and J. Zaanen, Phys. Rev. B: Condens. Matter Mater. Phys., 1995, 52, R5467–R5470 CrossRef CAS PubMed.
- A. Neckel, K. Schwarz, R. Eibler, P. Rastl and P. Weinberger, in Siebentes Kolloquium über metallkundliche Analyse mit besonderer Berücksichtigung der Elektronenstrahl-Mikroanalyse, ed. M. K. Zacherl, Springer, Vienna, 1975, pp. 257–291 Search PubMed.
- K. Schwarz, A. Neckel and J. Nordgren, J. Phys. F: Met. Phys., 1979, 9, 2509–2521 CrossRef CAS.
- K. Schwarz and E. Wimmer, J. Phys. F: Met. Phys., 1980, 10, 1001–1012 CrossRef CAS.
- U. von Barth and G. Grossmann, Phys. Rev. B: Condens. Matter Mater. Phys., 1982, 25, 5150 CrossRef CAS.
- A. L. Allred, J. Inorg. Nucl. Chem., 1961, 17, 215–221 CrossRef CAS.
- C. Sugiura, Y. Gohshi and I. Suzuki, Phys. Rev. B: Solid State, 1974, 10, 338–343 CrossRef CAS.
- L. Weinhardt, O. Fuchs, E. Umbach, C. Heske, A. Fleszar and W. Hanke, Phys. Rev. B: Condens. Matter Mater. Phys., 2007, 75, 165207 CrossRef.
- L. Weinhardt, D. Hauschild, O. Fuchs, R. Steininger, N. Jiang, M. Blum, J. D. Denlinger, W. Yang, E. Umbach and C. Heske, ACS Omega, 2023, 8, 4921–4927 CrossRef CAS PubMed.
- A. Qteish, A. I. Al-Sharif, M. Fuchs, M. Scheffler, S. Boeck and J. Neugebauer, Phys. Rev. B: Condens. Matter Mater. Phys., 2005, 72, 155317 CrossRef.
- M. Rohlfing, P. Krüger and J. Pollmann, Phys. Rev. B: Condens. Matter Mater. Phys., 1998, 57, 6485–6492 CrossRef CAS.
- D. Vogel, P. Krüger and J. Pollmann, Phys. Rev. B: Condens. Matter Mater. Phys., 1996, 54, 5495–5511 CrossRef CAS PubMed.
- K. Yu and E. A. Carter, J. Chem. Phys., 2014, 140, 121105 CrossRef PubMed.
- S. Ninomiya and S. Adachi, J. Appl. Phys., 1995, 78, 1183–1190 CrossRef.
- R. A. Mori, E. Paris, G. Giuli, S. G. Eeckhout, M. Kavčič, M. Žitnik, K. Bučar, L. G. M. Pettersson and P. Glatzel, Inorg. Chem., 2010, 49, 6468–6473 CrossRef CAS PubMed.
- A. N. Gusatinskii, A. A. Lavrentyev, M. A. Blokhin and V. Y. Slivka, Solid State Commun., 1986, 57, 389 CrossRef CAS.
- C. Sugiura, H. Yorikawa and S. Muramatsu, J. Phys. Soc. Jpn., 1997, 66, 503–504 CrossRef CAS.
- W. Heitler and F. London, Z. Phys., 1927, 44, 455–472 CrossRef CAS.
- W. Ritz, Reine Angew. Math., 1909, 1909, 1–61 CrossRef.
- P. A. M. Dirac, Proc. R. Soc. London, Ser. A, 1927, 114, 243–265 CAS.
- P. A. M. Dirac, The Principles of Quantum Mechanics, Oxford University Press, Oxford, New York, 3rd edn, 1948 Search PubMed.
Footnote |
| † Electronic supplementary information (ESI) available: escription of the automated data evaluation and detailed derivation of the two orbital hybridization model. See DOI: https://doi.org/10.1039/d4cp02894e |
| This journal is © the Owner Societies 2024 |

