On assessing the carbon capture performance of graphynes with particle swarm optimization†
Received
18th July 2024
, Accepted 16th August 2024
First published on 19th August 2024
Abstract
Tackling climate change is one of the greatest challenges of current times and therefore the development of efficient technologies to limit anthropogenic emissions is of utmost urgency. Recent research towards this goal has alluded to the use of carbon-based solid sorbents for carbon capture. Graphynes (GYs), an interesting class of porous carbon membranes, have recently proven their potential as excellent membranes for gas adsorption and separation. Herein, we explored the CO2 and N2 adsorption characteristics and CO2/N2 selectivities of a class of GYs, namely γ-GY-1, γ-GY-2 and γ-GY-4. We investigated the putative global minimum geometries of adsorbed unary (n = 2–10) and binary (n![[thin space (1/6-em)]](https://www.rsc.org/images/entities/char_2009.gif) :m; n, m ∈ [1, 8]) clusters of CO2 and N2 by employing a stochastic global optimization method called particle swarm optimization in conjunction with empirical intermolecular force field formulations. The intervening interactions are modeled using various pairwise potentials, including Lennard-Jones potential, improved Lennard-Jones potential, Buckingham potential and Coulombic potential. The binding energies for both unary and binary clusters are highest for adsorption on γ-GY-1, followed by γ-GY-2. The putative global minimum geometries suggested that N2 molecules preferred binding over the pore centres while CO2 molecules showed higher clustering propensity than any binding site preference. The predicted interaction energies suggested higher selectivity for CO2 over N2 for all the three γ-GYs.
:m; n, m ∈ [1, 8]) clusters of CO2 and N2 by employing a stochastic global optimization method called particle swarm optimization in conjunction with empirical intermolecular force field formulations. The intervening interactions are modeled using various pairwise potentials, including Lennard-Jones potential, improved Lennard-Jones potential, Buckingham potential and Coulombic potential. The binding energies for both unary and binary clusters are highest for adsorption on γ-GY-1, followed by γ-GY-2. The putative global minimum geometries suggested that N2 molecules preferred binding over the pore centres while CO2 molecules showed higher clustering propensity than any binding site preference. The predicted interaction energies suggested higher selectivity for CO2 over N2 for all the three γ-GYs.
Introduction
With the rising concerns on meeting the target of the 2015 Paris Agreement,1 wherein 2 °C above pre-industrial levels is defined as the upper limit for global warming, the need for concrete technologies to curb anthropogenic emissions is more apparent than ever. As well established through numerous research and agreed upon by various nations, going beyond this limit will result in catastrophic effects including heat waves, droughts, extreme precipitation and even extinction of several species.2 One of the major sources of these emissions is the burning of fossil fuels and hence, efficient CO2 capture from post-combustion mixtures is vital in realizing the goals set by the Intergovernmental Panel on Climate Change. When the combustion of fossil fuels occurs in ambient air, the flue gas, comprising primarily dinitrogen, carbon dioxide and water vapour, is emitted.3 The current method for separating CO2 from flue gas in order to reduce the carbon content in atmosphere is via chemical absorption using aqueous amines.4 However, this method is costly and highly energy expensive, and researchers are on the lookout for solid sorbents as an alternative.
Through selective physisorption of CO2 on the surface or within the porous networks, solid sorbents have proven to be highly energy efficient for carbon capture.5 A solid sorbent designed for this purpose should preferably be of high thermal and mechanical stability so as to withstand numerous desorption cycles and must possess good adsorption capacity even under humid conditions since flue gas contains vapor content. Presently, nanoporous materials such as zeolites and metal–organic frameworks are the front-runners in this area, albeit with certain drawbacks.6,7 Despite being used industrially for carbon capture owing to its high CO2 uptake, zeolite 13X has poor CO2/N2 selectivity.8 Carbon-based sorbents are an emerging class of promising materials for post-combustion CO2 separation. The high stability, large surface area for adsorption, and scope of functionalization make graphene a substrate worth exploring. However, the small size of the hexagonal pores of graphene considerably limits its gas-uptake capacity. The introduction of large pores in the carbon frameworks can offer an interesting alternative. Pirani and co-workers demonstrated the excellent capacity of the graphtriyne multilayers for CO2/N2 separation using molecular dynamics simulations.9 Graphynes (GYs), with their uniform and well-architectured intrinsic pores are therefore an excellent choice for efficient carbon capture.
GYs exist in various structural patterns and are classified according to the number and arrangement of acetylenic linkages.10 Theoretical investigations have revealed GYs to be ideal substrates for gas storage and separation.11 For instance, Bartolomei et al. have characterized the hydrogen storage capacity of GYs with the help of first-principles calculations.12 Similarly, hydrogen purification from a mixture of methane and carbon monoxide was investigated by Jiao et al. using density functional theory (DFT).13 The inferences drawn from these theoretical studies regarding the physisorption strengths of gases on GYs further signify the promising nature of GYs for carbon capture. Interactions between CO2 molecules and GYs have been investigated under two scenarios: (i) sensing of CO2 through physisorption on GYs, and (ii) separation of CO2 from multicomponent gaseous mixtures via permeation through GY membranes. The well-known GYs such as γ-GY-114 and T4,4,4-GY15 have been explored for the physisorption of CO2, whereas γ-GY-2 and rhombic-GY have been investigated for separation and purification of CO2 from gas mixtures based on permeability.16 Two recent studies employing first-principles and molecular dynamics simulations have reported the preferential physisorption of CO2 molecules on γ-GY-3 over N2 and H2O.9,17 Research on carbon capture using various metal-decorated GYs is also on the rise. CO2 capture using alkali/alkaline earth metal-decorated γ-GY-1,18 transition metal-decorated γ-GY-1,19–21 transition metal-decorated γ-GY-222 and Li-decorated β1-GY23 are some of the recent examples.
In view of the pressing need for reducing carbon emissions and taking into cognizance of the recent research on GYs, herein, we investigate a series of one-atom-thick carbon membranes, namely, γ-GY-1, γ-GY-2 and γ-GY-4 for CO2 and N2 adsorption. It is pertinent to note that all the three above-mentioned forms of GYs have been synthesised in recent times.24–26 The different types of γ-GYs are considered in order to investigate the effects of variation in carbon density and pore size of the sheets on the energetics and adsorption pattern of the clusters. To explore the preferential binding sites and energetics of adsorption of unary and binary clusters of CO2 and N2 on the GYs, we employ a swarm intelligence technique called particle swarm optimization (PSO).27–31 Swarm intelligence techniques can be considered as a sub-field of artificial intelligence that work on the principle of ‘emergence’, wherein the members of the swarm act with traits of intelligence.32 This property enables swarm intelligence techniques such as PSO to efficiently locate the global minimum structure of a high-dimensional chemical system. The population-based nature of the algorithm provides the researchers with an added benefit of parallel processing which can considerably reduce the computational complexity of the problem. Researchers have successfully applied PSO to predict minimum energy geometries of sizeable atomic and molecular clusters in their bare, adsorbed and intercalated forms.33–42 Very recently, we looked into the binding of dinitrogen clusters on monolayer and bilayer graphene with the help of PSO.42 Majority of the theoretical studies related to adsorption of CO2 on GYs reported till date are carried out using DFT, molecular dynamics or grand canonical Monte Carlo simulations.9,17–19,43–45 Our work offers a new strategy through which CO2/N2 adsorption features and selectivity of GYs can be ascertained.
Methodology
In the current study, we obtained the most favourable geometries of (i) bare CO2 clusters, (ii) bare binary clusters of CO2 and N2 as well as (iii) CO2 clusters, N2 clusters, and their binary clusters adsorbed over GY model systems. For the bare and adsorbed unary clusters, we have considered 2–10 molecules in the cluster, while for binary clusters, we have studied two cases: (a) binary clusters with equal number of CO2 and N2 molecules ranging from 1 to 5, and (b) binary clusters in the ratio n:m where n + m = 10. We have carried out the adsorption studies on molecular models of three different γ-GYs, namely, γ-GY-1, γ-GY-2, and γ-GY-4 (Fig. 1). The geometries of the annulenic molecular models of the GYs are optimized at the ωB97X-D/6-311G(d,p) level of DFT using the Gaussian 16 software.46 This level of theory was used previously in many studies for geometry optimization, especially in closely related systems including graphene.47–49 The Cartesian coordinates of the molecular models are provided in the ESI.†
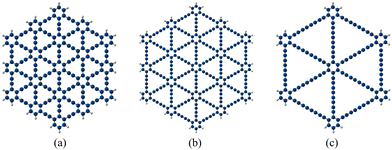 |
| | Fig. 1 Molecular model systems of GYs: (a) γ-GY-1 (C198H30), (b) γ-GY-2 (C282H30), and (c) γ-GY-4 (C138H18). | |
Modeling the clustering and adsorption of small molecules is a complex multidimensional problem and the use of ab initio techniques for this is computationally prohibitive. While, a metaheuristic technique such as PSO can track down the putative global minimum, i.e., the most stable geometry, comparatively faster when used with the right objective function. A study on predicting the geometry of carbon clusters by Chattaraj and co-workers has shown that PSO is less computationally expensive and has a faster convergence rate when compared to genetic algorithm. The same study pointed out the higher tendency of simulated annealing to get trapped in local minima when compared to PSO.34 Recently, we have also reported the merits of PSO over various global optimization techniques including differential evolution, basin-hopping and dual annealing for evaluating the putative global minimum configurations of adsorbed and intercalated noble gas clusters on graphdiyne model systems.38 In PSO, we begin by randomly initializing a set of particles, called swarm, in the desired search domain and the initial velocity of each particle is taken to be zero. These particles represent various points on the potential energy surface; the total intermolecular interaction energy constitutes the objective function. The position of each particle is an n-dimensional vector where n is the number of variables of the objective function. The velocity of a particle at a given iteration is also an n-dimensional vector that determines the direction in which the particle should move next. At each iteration t, each member of the swarm keeps a record of the best position that it has achieved (Pbest,i) and the swarm has achieved (Gbest) over the iterations. With this knowledge, the particles communicate with each other and update their positions (xi) and velocities (vi) using the equations,
| | | vt+1i = χ[vti + c1rt1(Ptbest,i − xti) + c2rt2(Gtbest − xti)] | (2) |
where
i is the index used to represent the particle. Here,
c1 and
c2 are the cognitive and the social acceleration constants, respectively, that determine the contributions of
Pbest and
Gbest to the velocity. The values of
c1 and
c2 are taken as 2.05, whereas
r1 and
r2 are random numbers generated between 0 and 1.
28,50 The constriction factor,
χ that takes the value 0.729 is a modification to the basic PSO algorithm in order to improve the convergence.
50 The sharing of information among the members of the swarm is dependent on the neighbourhood topology. In the present study, we employ the star topology, where all the members of the swarm are connected to each other.
i.e., the best solution of the entire swarm is known to all the members of the swarm.
29 As the iterations proceed, the particles converge to the putative global minimum, which is then considered as the starting point for a deterministic search using the limited-memory Broyden–Fletcher–Goldfarb–Shanno (L-BFGS) method.
51 All the PSO calculations are performed using an in-house code written in Python. The local optimizations using L-BFGS are performed using an in-built package in the SciPy module.
52 Since we investigated both bare and adsorbed clusters of various sizes, we have considered a range of swarm sizes (500–4000) and iteration numbers (500–1000). For each system, we have carried out 20–25 independent PSO-L-BFGS runs (20 for CO
2 bare clusters and 25 for the remaining systems) and the lowest energy structure among them is reported. The rationale behind choosing 25 independent PSO-L-BFGS runs is provided in the Results and discussion section.
Since the study involves clusters of molecules, we use a rigid-body approximation to include both translational and rotational degrees of freedom of the molecules during the global optimization.53 For a molecular cluster of size n, each particle of the swarm has 6n dimensions arising from the Cartesian coordinates of the centre of mass of the molecule and the three Euler angles (θ, φ and ϕ) describing the orientation of each molecule, i.e., the position of a swarm particle is a vector with these 6n variables as elements and at each iteration of PSO, all particles update their positions by updating these 6n variables. This step is then followed by the function evaluation, which in the current study is the total interaction energy. Once the centre of mass Cartesian coordinates (rCOM) and Euler angles of each molecule are defined, it is easy to obtain the Cartesian coordinates of each atom of the molecule which is essential for calculating the interaction energy. The Cartesian coordinate of the ith atom of a molecule is given by
| | | ri = rCOM + R−1(θ, φ, ϕ)rrel,i | (3) |
where
rrel,i is the Cartesian coordinate vector of the
ith atom of the molecule relative to the centre of mass of the molecule (body-fixed coordinates) and
R−1(
θ,
φ,
ϕ) is the inverse of the rotation matrix. Throughout the process, we bound the values of
rCOM to the positive half-space of the GY model system in order to restrict the adsorption to a single side of the model system of GY. This restriction is prompted by many experimental studies on the applications of graphene, including adsorption studies, wherein graphene supported on a substrate is preferred over the free-standing graphene.
54–56 Furthermore, there are recent reports suggesting that the synthesis of GYs can be facilitated on supported substrates.
57,58 Here, the adsorption is restricted to a single side by clamping the
Z-coordinate of centre of mass of the molecule between 0 Å and 5 Å. The position elements corresponding to the
X and
Y coordinates of centre of mass of the molecule were clamped between the maximum and minimum values of the
X and
Y coordinates of the molecular models of GYs. For the Euler angles, we clamped their values in the range of possible rotations which depends on the choice of the rotation matrix. For the current study, we considered the same rotation matrix and the bounds as in our previous work.
42 Even though this approach works for adsorption over γ-GY-1 and γ-GY-2, the large pore size of γ-GY-4 can lead to putative global minima with the molecules being aligned vertically in the centre of the triangular pore with one of the atoms of the molecule in the negative half-space of the annulenic model of γ-GY-4. Hence, in the case of γ-GY-4, we additionally constrained the position of each atom to the positive half-space of the sheet. Apart from this, to improve the exploration of the algorithm, we have incorporated dynamic velocity clamping. Here, we initially define an upper bound for each velocity element which is the average of the maximum and minimum value for the corresponding position element. The same multiplied with (−1) serves as a lower bound for the velocity elements. Later, in each iteration,
t, we multiply both the upper and the lower bound of each velocity component by a factor of (
t − 1)/
tmax, where
tmax is the total number of iterations.
The objective function that needs to be minimized in our case is the total intermolecular interaction energy of the system. The details of the interaction energy terms of the various systems are given below:
Interactions in bare CO2 clusters
For modelling CO2 clusters, we used the TraPPE model,59,60 wherein the intermolecular interactions in bare CO2 clusters are represented by the sum of electrostatic and non-electrostatic interactions. The model was proposed to reproduce the vapour–liquid equilibria of CO2 and it's mixture with alkanes and it has been validated recently against experimental data using molecular dynamics simulations.61 The total interaction energy is given by| |  | (4) |
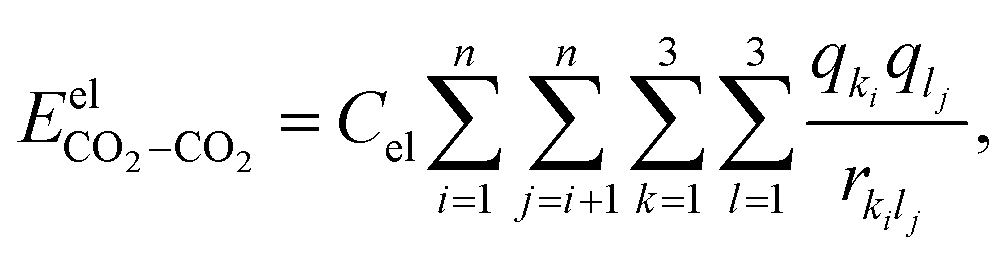
The electrostatic interactions  are modeled using the Coulombic pair potential between the partial charges residing on each atom of the two interacting CO2 molecules. A representative model of the charge distribution in CO2 is given in Fig. S1 of the ESI.† For a cluster of size n, the electrostatic interactions are calculated using
| | 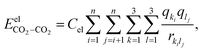 | (5) |
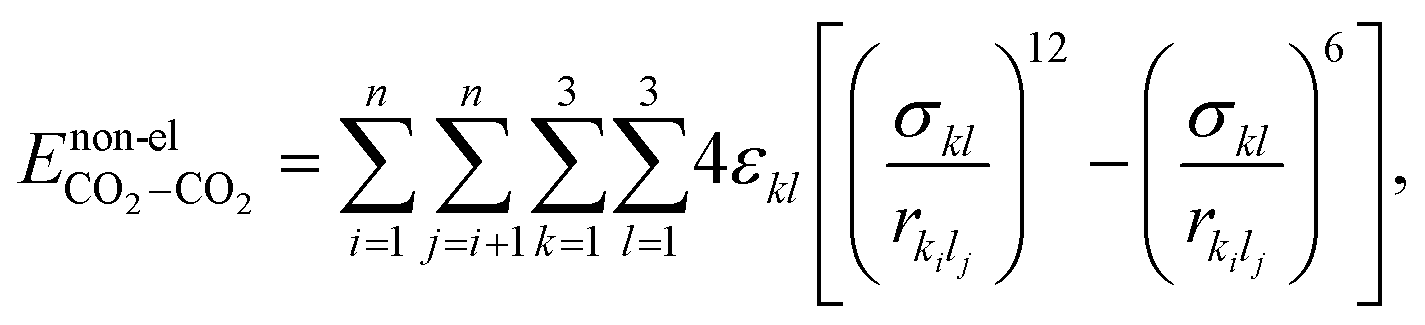
where Cel = 332 kcal Å mol−1 e−2, qki (or qli) represents the partial charge on the kth (lth) atom of the ith (jth) molecule and rkilj is the distance between the kth and lth atoms of the ith and jth molecules, respectively. The non-electrostatic contribution to the interaction energy is described using the Lennard-Jones (LJ) potential as follows:| |  | (6) |
where k and l represent the atoms of the ith and jth molecules, respectively. εkl and σkl are the LJ parameters describing the well depth and the van der Waals distance of the k–l atom–atom interaction, respectively. The numerical values of the parameters corresponding to C–C interactions and O–O interactions are taken from the literature and are provided in Table 159 and the parameters for C–O interactions are obtained using the Lorentz–Berthelot mixing rules.62
Table 1 Numerical values of the parameters used for calculating the intermolecular interaction energies
| LJ potential |
|
|
ε (kcal mol−1) |
σ (Å) |
| C–C |
0.0535 |
2.80 |
| O–O |
0.1570 |
3.05 |
| Buckingham-type potential |
|
|
A (kcal mol−1) |
α (Å−1) |
C
6 (kcal Å6 mol−1) |
| N–N |
29995.9 |
3.4614 |
392.274 |
| ILJ potential |
|
|
ε (kcal mol−1) |
σ (Å) |
β
|
| CCO2–N |
0.0784 |
3.548 |
9.00 |
| O–N |
0.1038 |
3.699 |
9.00 |
| CCO2–CGY |
0.0820 |
3.564 |
6.75 |
| O–CGY |
0.1156 |
3.676 |
6.75 |
| N–CGY |
0.0916 |
3.828 |
7.50 |
Interactions in bare N2 clusters
Recently, we predicted the energetics and geometries of bare N2 clusters using PSO.42 For the sake of completeness, we provide the details here. The N2–N2 interactions are modeled as follows: the N2–N2 interaction energy (EN2–N2) is described as the sum of electrostatic and non-electrostatic interaction terms, i.e.,| |  | (7) |
The electrostatic interactions in EN2–N2 arise from the quadrupole moment of the nitrogen molecule. It can be described using a four-point charge model (Fig. S1 of the ESI†). This model was previously used by Bertolus et al. for studying N2 clusters using the Monte Carlo growth method.63 Thus, the electrostatic contributions are given by| |  | (8) |
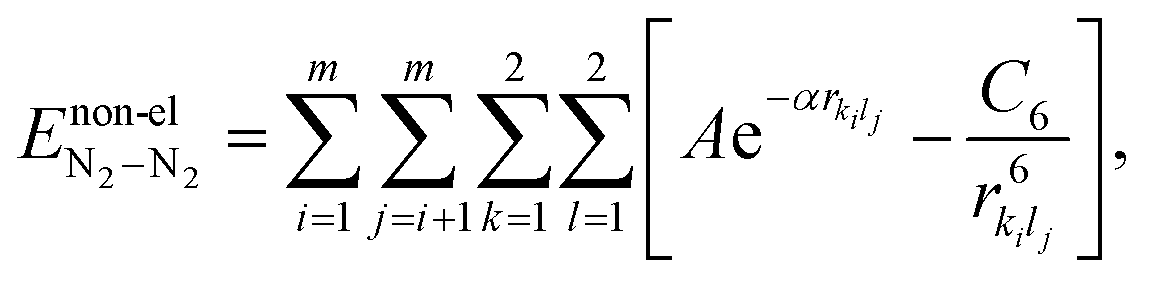
Here, m represents the number of N2 molecules in the cluster. The non-electrostatic part is described using a Buckingham-type potential, which is commonly employed for diatomic molecules.64 Hence, the non-electrostatic contributions in N2 clusters are expressed as| |  | (9) |
where A, α and C6 are the parameters of the Buckingham-type potential which are taken from literature and are provided in Table 1.63 The Buckingham-type potential was previously used for studying the structural and thermodynamic properties of N2 clusters.65 A study by Calvo et al. compared the structural properties of N2 clusters using both (i) Monte Carlo simulations with interactions described using Buckingham-type potential, and (ii) electron diffraction experiments, and observed a good agreement for diffraction patterns from lowest-energy structures.66
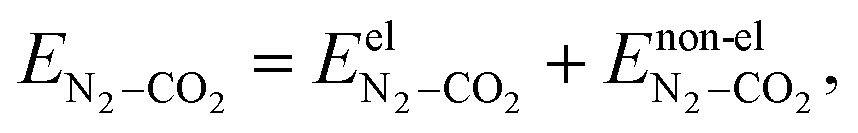
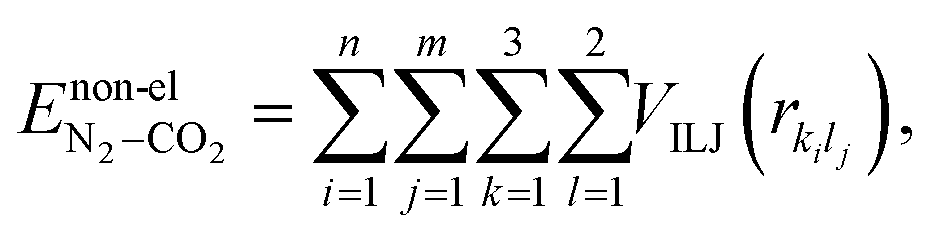
Interactions in bare CO2–N2 binary clusters
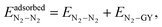
In CO2–N2 binary clusters, there are three types of possible interactions: CO2–CO2, N2–N2 and CO2–N2. Therefore, the total interaction energy is given by the following equation:| | | Ebinary = ECO2–CO2 + EN2–N2 + EN2–CO2 | (10) |
The CO2–CO2 and N2–N2 interactions are modeled as described earlier. EN2–CO2 corresponds to the interaction energy contributions from N2–CO2 interactions, which in itself contain electrostatic and non-electrostatic contributions. The N2–CO2 interaction energy is given as| |  | (11) |
where the electrostatic contributions are described using the Coulomb's law as given by| |  | (12) |
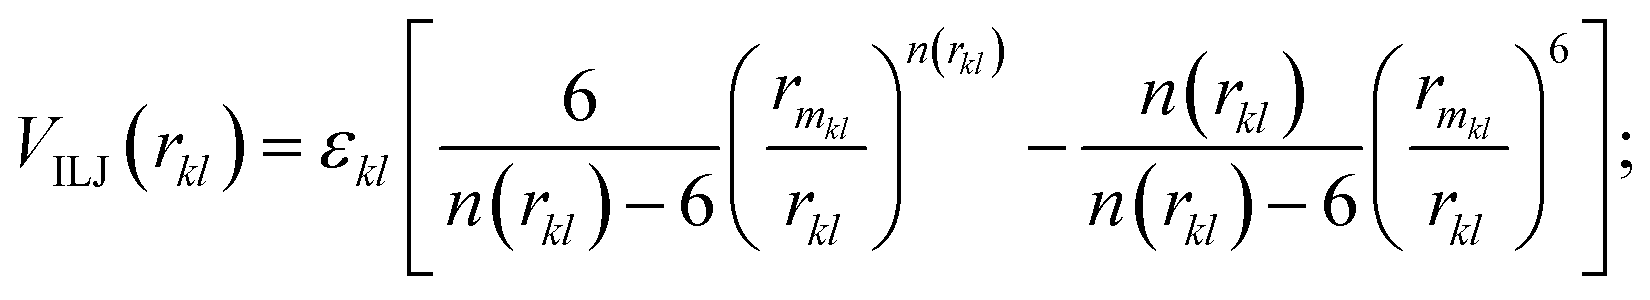
Here, m and n indicate the number of N2 and CO2 molecules in the cluster. The non-electrostatic contribution in the N2–CO2 interaction is modeled using an improved Lennard-Jones (ILJ) potential. The ILJ potential is a modified version of the LJ potential as it provides a better description of the long-range and short-range interactions.67 The form of the ILJ potential and the total non-electrostatic N2–CO2 interaction energy are given by the following equations:| |  | (13) |
| |  | (14) |
| |  | (15) |
where εkl, rmkl and βkl are the ILJ parameters for the k–l atom–atom interaction, whose values are also taken from literature and are also provided in Table 1.9
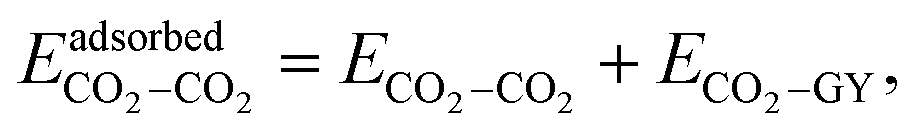
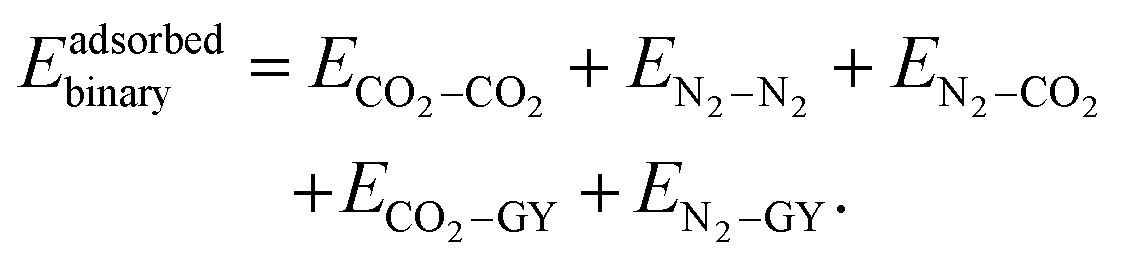
Interactions in adsorbed clusters
When a molecular cluster gets adsorbed on a molecular model of GY, an additional interaction term, arising from the interaction of the cluster with the GY, needs to be accounted for. Therefore, the total intermolecular interaction energy of an adsorbed unary/binary cluster is given as| |  | (16) |
| |  | (17) |
and| | 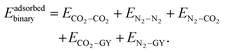 | (18) |
In the above, both ECO2–GY and EN2–GY are expressed using the ILJ potential9 as
| |  | (19) |
and
| |  | (20) |
Here,
p represents the number of atoms in the annulenic model of GY. The ILJ parameters of CO
2–GY and N
2–GY interactions (
Table 1) are taken from a literature report that fits the potential against MP2C calculations for describing the interactions of CO
2 and N
2 with γ-GY-3.
9 We assessed the transferability of these potentials to the GY models considered in our study, γ-GY-1, γ-GY-2, and γ-GY-4. For this, we used single-pore models of γ-GY-1, γ-GY-2, γ-GY-3, and γ-GY-4 (Fig. S2 of the ESI
†), and performed single-point energy scans for the passage of both CO
2 and N
2 in three different orientations (along
X,
Y, and
Z axes) towards the centre of the model systems. The calculations were performed at the B3LYP-D3/aug-cc-pVTZ (hereafter denoted as B3LYP-D3/aTZ) level of theory since the results obtained at this level of theory for the interactions of CO
2/N
2 with the model compound of γ-GY-3 were in close agreement with the MP2C results reported in the literature
9 (Fig. S3–S5 of the ESI
†). A comparison of the energy profiles for the CO
2–GY and N
2–GY complexes obtained using the ILJ potential with those of DFT is also shown in Fig. S3–S5 of the ESI.
† The interaction energy profiles evaluated using the ILJ potential are in reasonable agreement with those obtained using DFT, especially at the equilibrium points, establishing the transferability of the ILJ parameters across the various GY systems. Additionally, we performed DFT calculations at the B3LYP-D3/aTZ level of theory to generate potential energy profiles for the CO
2–CO
2, N
2–N
2, and CO
2–N
2 dimers. When compared against the profiles evaluated using DFT, our corresponding empirical potential profiles showed good agreement as shown in Fig. S6 of the ESI,
† validating the use of the above-mentioned empirical potentials for modeling the intermolecular interactions in molecular clusters.
Results and discussion
Global optimization of bare unary and binary clusters
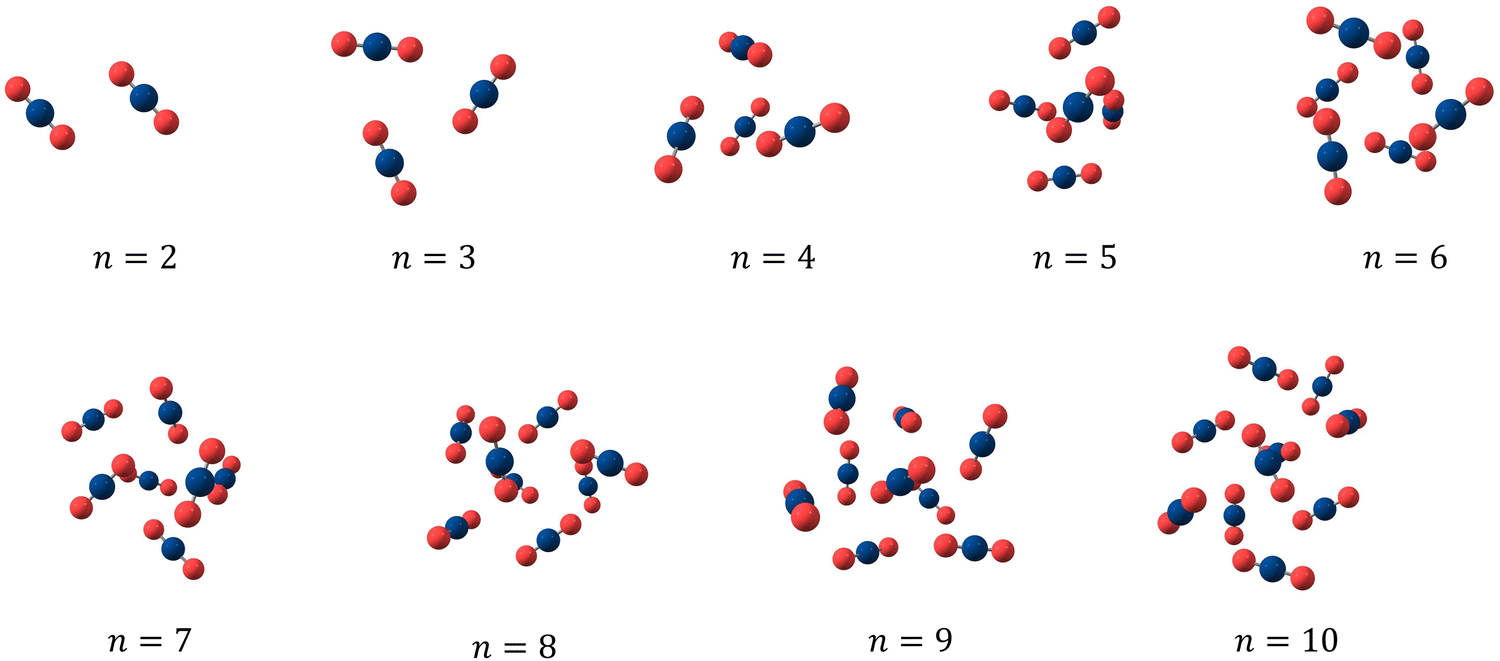
To begin with, we investigated the putative global minimum geometries of bare CO2 clusters using PSO. The obtained putative global minimum geometries are shown in Fig. 2. As we can see from Fig. 2, the CO2 dimer has a slipped parallel structure with C2h symmetry and the CO2 trimer has a planar cyclic structure with C3h symmetry, both of which are consistent with previous high-resolution spectroscopic studies.68 The (CO2)6 cluster also showed a symmetric structure with S6 point group. All clusters, except n = 2, 3 and 6, belongs to C1 point group. A closer look at them, however, reveals that some of the geometries are close to high-symmetry structures when we consider the symmetry with respect to the centre of mass of the molecules. For example, the (CO2)4 and (CO2)5 clusters possess geometries very close to those of trigonal pyramidal and trigonal bipyramidal structures, respectively. The geometries are same as those predicted by Takeuchi in 2008, wherein he optimized CO2 clusters of size 4–40 using a heuristic and unbiased method in which the CO2 molecules were described using the Murthy–O’Shea–McDonald model.69 The trends in energetics of these clusters are depicted in Fig. 3. Due to the larger number of possible interactions, the magnitude of interaction energy (Fig. 3a) as well as interaction energy per molecule (Fig. 3b) increase as we go from n = 2 to 10. In Fig. 3, for comparison, we have also included the interaction energies of bare N2 clusters from our previous study.42 The interaction energies of CO2 clusters are nearly four times those of the N2 clusters, revealing the strong binding between CO2 molecules. Fig. 3c represents the variation of the second difference in interaction energy as a function of cluster size. For a cluster of size n with an interaction energy E(n), the second difference of interaction energy is calculated as Δ2E(n) = E(n + 1) + E(n − 1) − 2E(n). The second difference of interaction energy helps to identify clusters of high stability, known as magic number clusters. Magic number clusters are the clusters for which a maximum is observed in the plot. For bare CO2 clusters, we obtained maxima at cluster sizes 4, 6 and 8 making them the magic number clusters, whereas for N2, the magic number clusters obtained are clusters of size 4 and 7. As suggested by Bretón and co-workers in their study on rare gases adsorbed over graphene,70 however, caution is warranted while we interpret these data. The putative global minimum geometries of N2 clusters that we had obtained in our previous study are given in Fig. S7 of the ESI.† The obtained geometries were isomorphic to Arn clusters (n = 2–10), and exhibited symmetric structures when the centre of mass of each molecule is considered.
 |
| | Fig. 2 Putative global minimum geometries of bare CO2 clusters evaluated using PSO. | |
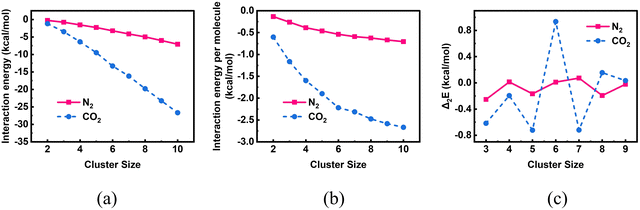 |
| | Fig. 3 A comparison of the (a) interaction energies, (b) interaction energies per molecule and (c) second difference of interaction energies of bare CO2 and N242 clusters of size n = 2–10 evaluated using PSO. | |
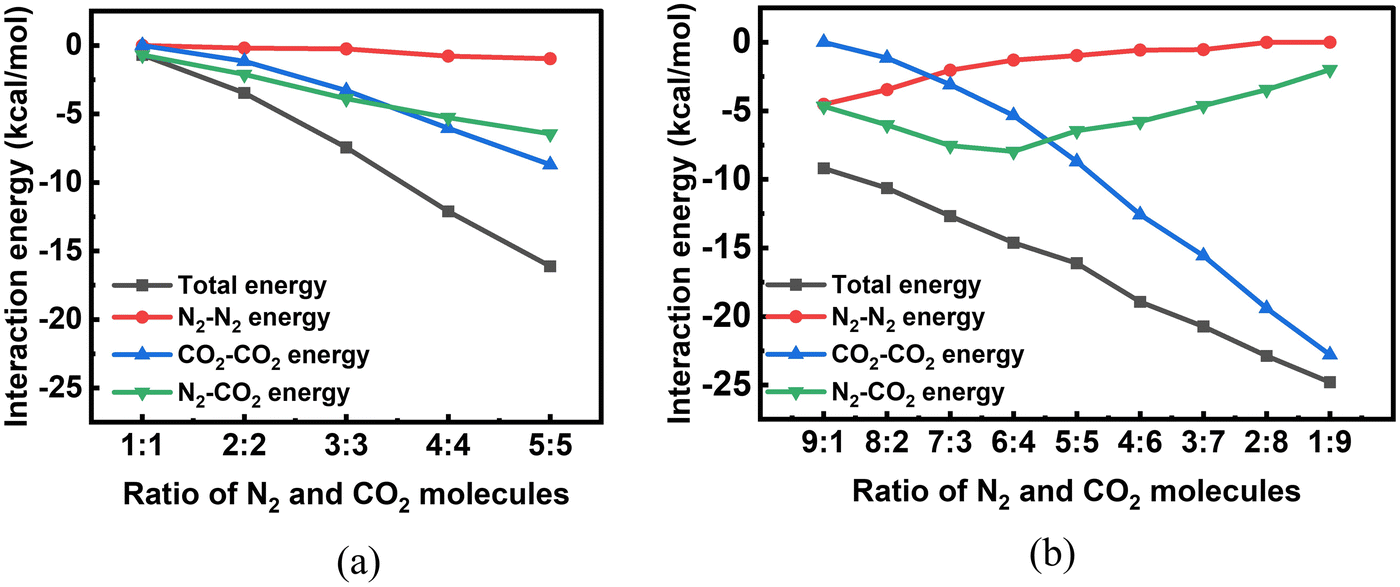
We then looked into the putative global minimum geometries of bare binary clusters of CO2 and N2 molecules. There are no studies in literature reporting the global minimum geometries of bare binary clusters of CO2 and N2 and thus we explored the same using PSO. As mentioned in the methodology, we considered two cases: clusters with equal number of CO2 and N2 molecules and clusters with a total of 10 molecules with different ratios of CO2 and N2 molecules. As is evident from the putative global minimum geometries of these clusters given in Fig. 4, in most of the cases, CO2 molecules form clusters while N2 molecules prefer to surround the CO2 molecules. For example, in a mixture containing 9 CO2 molecules and 1 N2 molecule, a cluster of CO2 molecules with the N2 molecule lying outside the cluster is observed, and for a mixture of 9 N2 molecules and 1 CO2 molecule, the single CO2 molecule is surrounded by all the N2 molecules. This observation can be explained on the basis of the interaction strengths of the various intermolecular components. The magnitude of the various interaction energy components follows the order: CO2–CO2 > CO2–N2 > N2–N2. The same accounts for the trends seen in Fig. 5 depicting the variation in the interaction energies and their various contributing energy terms of binary clusters. The various contributing energy terms include the interaction energies resulting from the interactions among the CO2 molecules (CO2–CO2 energy), the interactions among the N2 molecules (N2–N2 energy), and the interactions between the N2 and the CO2 molecules (N2–CO2 energy). For clusters with equal number of CO2 and N2 molecules, as the cluster size increases, the interaction energies showed a linear decrease, which is similar to the trend observed for unary clusters of CO2 and N2 molecules. For clusters of size 10 with varying CO2:N2 ratios, with an increase in the number of CO2 molecules, more negative interaction energies are obtained (see Fig. 5b). In order to validate the trends in energetics of the intervening interactions, we performed symmetry-adapted perturbation theory (SAPT)71 calculations. Using SAPT, the interaction energies and the various contributing terms including electrostatic, exchange, induction and dispersion of CO2–CO2, N2–N2 and CO2–N2 dimers obtained using PSO were evaluated. The calculations were performed at the SAPT0/AUG-cc-pVDZ level of theory using the Psi4 program package.72 The interaction energies and their components obtained are tabulated in Table S1 of the ESI.† With respect to all the contributions, the magnitudes of the derived interaction energies follow the same order as previously mentioned, i.e., CO2–CO2 > CO2–N2 > N2–N2. A major contribution from electrostatic (which is the leading contribution) and dispersion interactions makes the CO2–CO2 interaction most stable among all the three. For the N2–N2 interaction, the most significant contribution to the total interaction energy arises from the dispersion energy with the induction and electrostatic contributions being relatively small. Whilst for the CO2–N2 interaction, even though dispersion interaction forms a major contribution to the total interaction energy, electrostatic interactions also have a substantial role to play.
 |
| | Fig. 4 Putative global minimum geometries of bare CO2 and N2 binary clusters of different N2:CO2 (n![[thin space (1/6-em)]](https://www.rsc.org/images/entities/i_char_2009.gif) :m) ratios evaluated using PSO. :m) ratios evaluated using PSO. | |
 |
| | Fig. 5 Variation of interaction energies and constituent contributions of bare CO2 and N2 binary clusters as a function of N2:CO2 ratio (n:m) for (a) n = m = 1 to 5 and (b) n + m = 10, evaluated using PSO. | |
Global optimization of adsorbed unary clusters
Next, we investigated the structures and energetics of putative global minimum geometries of unary N2 and CO2 clusters of size 2 to 10 adsorbed over molecular models of three GYs namely γ-GY-1, γ- GY-2 and γ-GY-4. The adsorption features are strongly governed by the molecular size as well as the pore size of the GY substrate. Hence, we obtained the kinetic diameters of N2 and CO2 from literature,73 and the pore diameters of the triangular pores of various γ-GYs using a Python library, namely pywindow.74 The kinetic diameter of N2 molecule is 3.64 Å while that of CO2 is 3.30 Å. The triangular pore diameters of the GYs are 0.78 Å, 2.27 Å and 5.19 Å for γ-GY-1, γ-GY-2 and γ-GY-4, respectively. From this, we infer that the closest binding of the molecules will be observed in the case of γ-GY-4. Since the pore size of γ-GY-4 is larger than the diameters of N2 and CO2 molecules, the γ-GY-4 sheet allows easy passage of the molecules through its triangular pores. However, we restricted the current study to a single-sided adsorption by adding constraints in the algorithm, as mentioned in the Methodology section. This allowed us to probe the adsorption features, rather than the permeation features.
A few representative global minimum geometries of adsorbed N2 and CO2 clusters are shown in Fig. 6 and 7, respectively and the geometries of the rest of the adsorbed clusters are given in Fig. S8–S10 of the ESI.† Since we have carried out multiple PSO trials, we found other local minimum geometries which are very close in energy to the reported global minimum geometries. For example, in the ESI,† as a representative case, we have provided a few local minimum geometries of (N2)4 adsorbed on γ-GY-4 (Fig. S11 of the ESI†). The interaction energies corresponding to the various local minima geometries are very close to the interaction energy of the reported putative global minimum. The predicted geometries are also in good correspondence. The N2 molecules, when adsorbed over γ-GY-1, showed an interesting pattern of adsorption by occupying the positions above both the hexagonal and triangular pore centres. The patterns followed by N2 clusters of size n = 2–7, except n = 3, adsorbed over γ-GY-1 are similar to those of N2 clusters adsorbed on circumcircumcoronene, which represents a model for graphene.42 Although the molecules are seen to adsorb as a monolayer on γ-GY-1 similar to that of adsorption on graphene, they adsorb much closer to the γ-GY-1 sheet (∼3.1 Å) when compared to graphene (∼3.4 Å).42 This can be attributed to the lower carbon atom density of γ-GY-1 when compared to graphene, which leads to reduced repulsive interactions in γ-GY-1 that impede the molecules from being proximal to the sheets. Upon moving to γ-GY-2, the pattern fades and the molecules even adsorb over the carbon skeleton along with the positions above the triangular pore centres. Unlike the case of adsorption on γ-GY-1 sheet where N2 clusters nearly formed planar configurations, on γ-GY-2, the clusters form configurations in which some of the N2 molecules are tilted towards the sheet. The adsorption configurations on γ-GY-4 are found to be different from those on both γ-GY-1 and γ-GY-2. This can be attributed to the larger pore size of γ-GY-4 which forces the molecules to cluster around the carbon skeleton of the sheet.
 |
| | Fig. 6 Putative global minimum geometries (top and side views) of N2 clusters of size n = 2, 4, 7 and 10 adsorbed on (a) γ-GY-1, (b) γ-GY-2 and (c) γ-GY-4 evaluated using PSO. | |
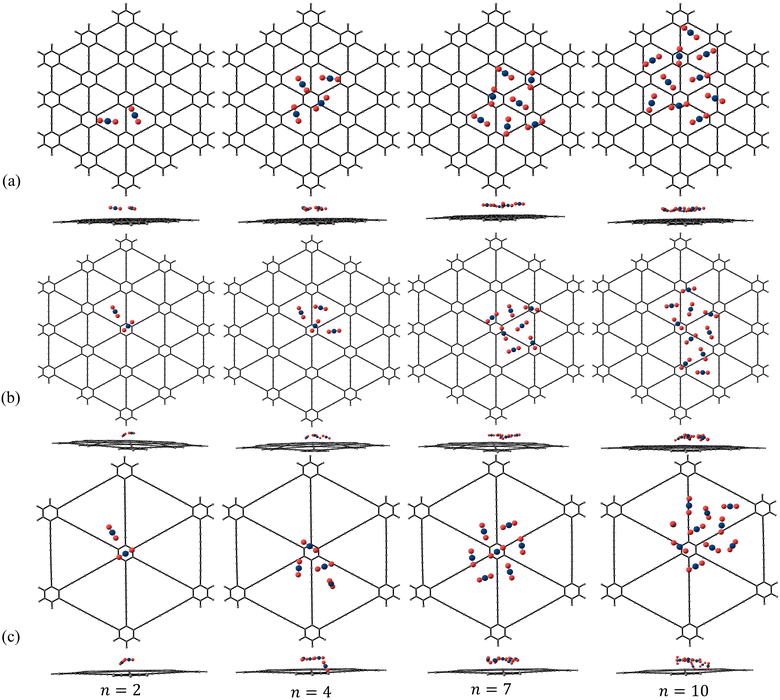 |
| | Fig. 7 Putative global minimum geometries (top and side views) of CO2 clusters of size n = 2, 4, 7 and 10 adsorbed on (a) γ-GY-1, (b) γ-GY-2 and (c) γ-GY-4 evaluated using PSO. | |
The adsorption of CO2 molecules over γ-GY-1 and γ-GY-2 sheets showed an entirely different behaviour. The CO2 molecules showed more preference for clustering without any specific binding site preferences. This is a result of strong CO2–CO2 interactions present in adsorbed CO2 clusters. Interesting growth patterns for CO2 clusters over γ-GY-1 and γ-GY-2 can be observed in Fig. 7. For γ-GY-1, the molecules adsorbed at around 3 Å from the sheet forming a monolayer. As explained before for the case of N2 adsorption over γ-GY-4, the CO2 molecules also prefer to adsorb near the carbon skeleton of γ-GY-4. There are few reports in literature that have studied CO2 adsorption on pristine γ-GYs. In 2017, Kwon et al. studied the adsorption of CO2 and H2 on γ-GY-1 using DFT-D3 (PBE/DNP) and they predicted that CO2 adsorbs over the triangular pore site.14 Similar conclusion is drawn from our PSO calculations too. In 2018, Lu et al. also predicted a similar geometry in their DFT study.75 Later, Reisi-Vanani and co-workers investigated three different sites on γ-GY-1 for CO2 adsorption using DFT-D3 (PBE/DNP), namely, hexagonal pore centre, triangular pore centre and a site above the acetylenic linkage.20 They considered both horizontal and vertical orientations of a single CO2 with respect to GY for optimization and they found the most favourable geometry to be the one in which CO2 is adsorbed horizontally above the triangular pore, which is concordant with our PSO calculations. In their successive studies on γ-GY-1 too, they have reported the same site with the horizontal orientation as the most favourable geometry for CO2 adsorption.19,44,76 A very recent study by the same group has investigated the adsorption of single CO2 molecule on γ-GY-2 as well using a DFT-D2 method.22 The geometry obtained is consistent with the putative global minimum geometry we obtained wherein the CO2 molecule occupies a position above the triangular pore. Similar results have been obtained by Fang et al. for γ-GY-2 in their DFT-D3 study.77 In the same study, they have analysed single N2 adsorption as well and have predicted that N2 also prefers to adsorb above the triangular pore centre, which is again similar to our PSO result. Reisi-Vanani and co-workers, have also analysed the structure and energy of CO2 trimer adsorbed on γ-GY-120 and have reported a geometry similar to the one we have obtained using PSO. All the above observations validate that PSO is a viable approach for investigating gas molecule adsorption on GYs.
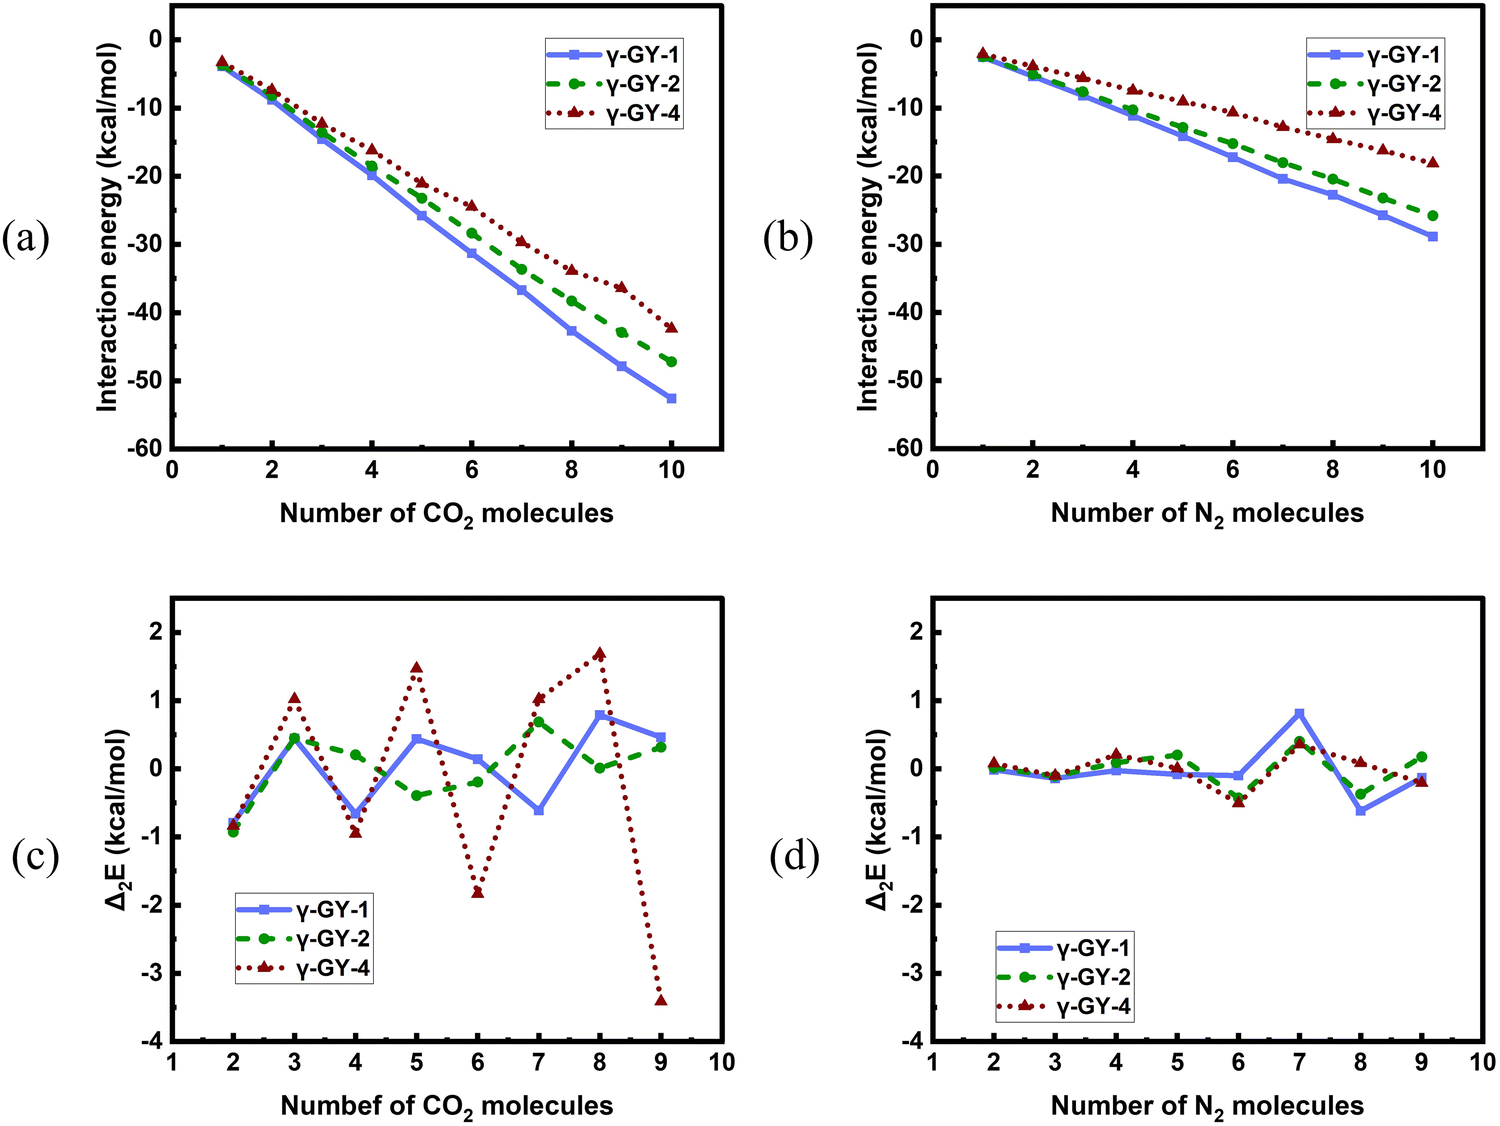
We have also looked into the energetics of adsorbed N2 and CO2 unary clusters. The plots comparing the interaction energies for the adsorption over the model systems of three different GYs for both N2 and CO2 clusters are given in Fig. 8. Interaction energies for adsorbed CO2 clusters are lower than those of N2 clusters for all the three GYs, indicating that these GYs can be considered as potential candidates for the selective adsorption of CO2 over N2, enabling separation of CO2 and N2. Among the GYs, the magnitudes of interaction energies are higher for γ-GY-1 followed by γ-GY-2. A closer look at Fig. 8a and b reveals that the decrease in the magnitudes of interaction energies as we go from γ-GY-2 to γ-GY-4 is more pronounced for N2 clusters than for CO2 clusters. This is a consequence of the increase in pore size which reduces the possible interactions of N2 molecules with the γ-GY-4 sheet. The trends obtained for the adsorption over GYs are related to the carbon densities of the sheet considered. The higher the carbon density of the sheet, the higher the magnitude of the interaction energy. In order to ascertain this, we further compared the energetics of adsorption of N2 and CO2 over GYs with that over graphene. For this, we modeled the adsorption of CO2 unary clusters on circumcircumcoronene, where the interaction of CO2 with circumcircumcoronene is described using the LJ potential.60 The further details of the same are provided in the ESI.† The interaction energies associated with putative global minimum geometries obtained using PSO for CO2 adsorption over circumcircumcoronene are also given in the ESI† (Fig. S12). The energetics and geometries of N2 clusters adsorbed on circumcircumcoronene are already reported in our previous study.42 Since γ-GY-1 has the closest carbon density to graphene, we deemed it to be prudent to compare the interaction energies of the clusters adsorbed on graphene with those adsorbed on γ-GY-1. Fig. S12 of the ESI† clearly shows how close the interaction energies of N2 clusters adsorbed on the graphene model system are with respect to γ-GY-1 for all cluster sizes. Graphene can indeed serve as a better adsorbent than γ-GY-1 for CO2. Nevertheless, γ-GY-1 can be considered as a preferable alternative to graphene, since the selective separation of CO2 from N2 can be better achieved using γ-GY-1.
 |
| | Fig. 8 A comparison of variation of interaction energies of (a) CO2 clusters and (b) N2 clusters adsorbed on γ-GY-1, γ-GY-2 and γ-GY-4 as a function of cluster size evaluated using PSO. Variation of second difference of interaction energies of (c) CO2 clusters and (d) N2 clusters adsorbed on γ-GY-1, γ-GY-2, and γ-GY-4 as a function of cluster size. | |
Then, in order to study the relative stabilities of the adsorbed N2 and CO2 clusters, we calculated the second difference of interaction energies. The plots of Δ2E(n) for the adsorbed N2 and CO2 clusters are shown in Fig. 8(c and d). In our current study, the magic number clusters (maxima of the plot) in case of adsorbed N2 are 4 and 7 for γ-GY-1, 5 and 7 for γ-GY-2 and 4 and 7 for γ-GY-4 whereas for adsorbed CO2 clusters the magic numbers are 3, 5 and 8 for γ-GY-1, 3 and 7 for γ-GY-2 and 3, 5 and 8 for γ-GY-4.
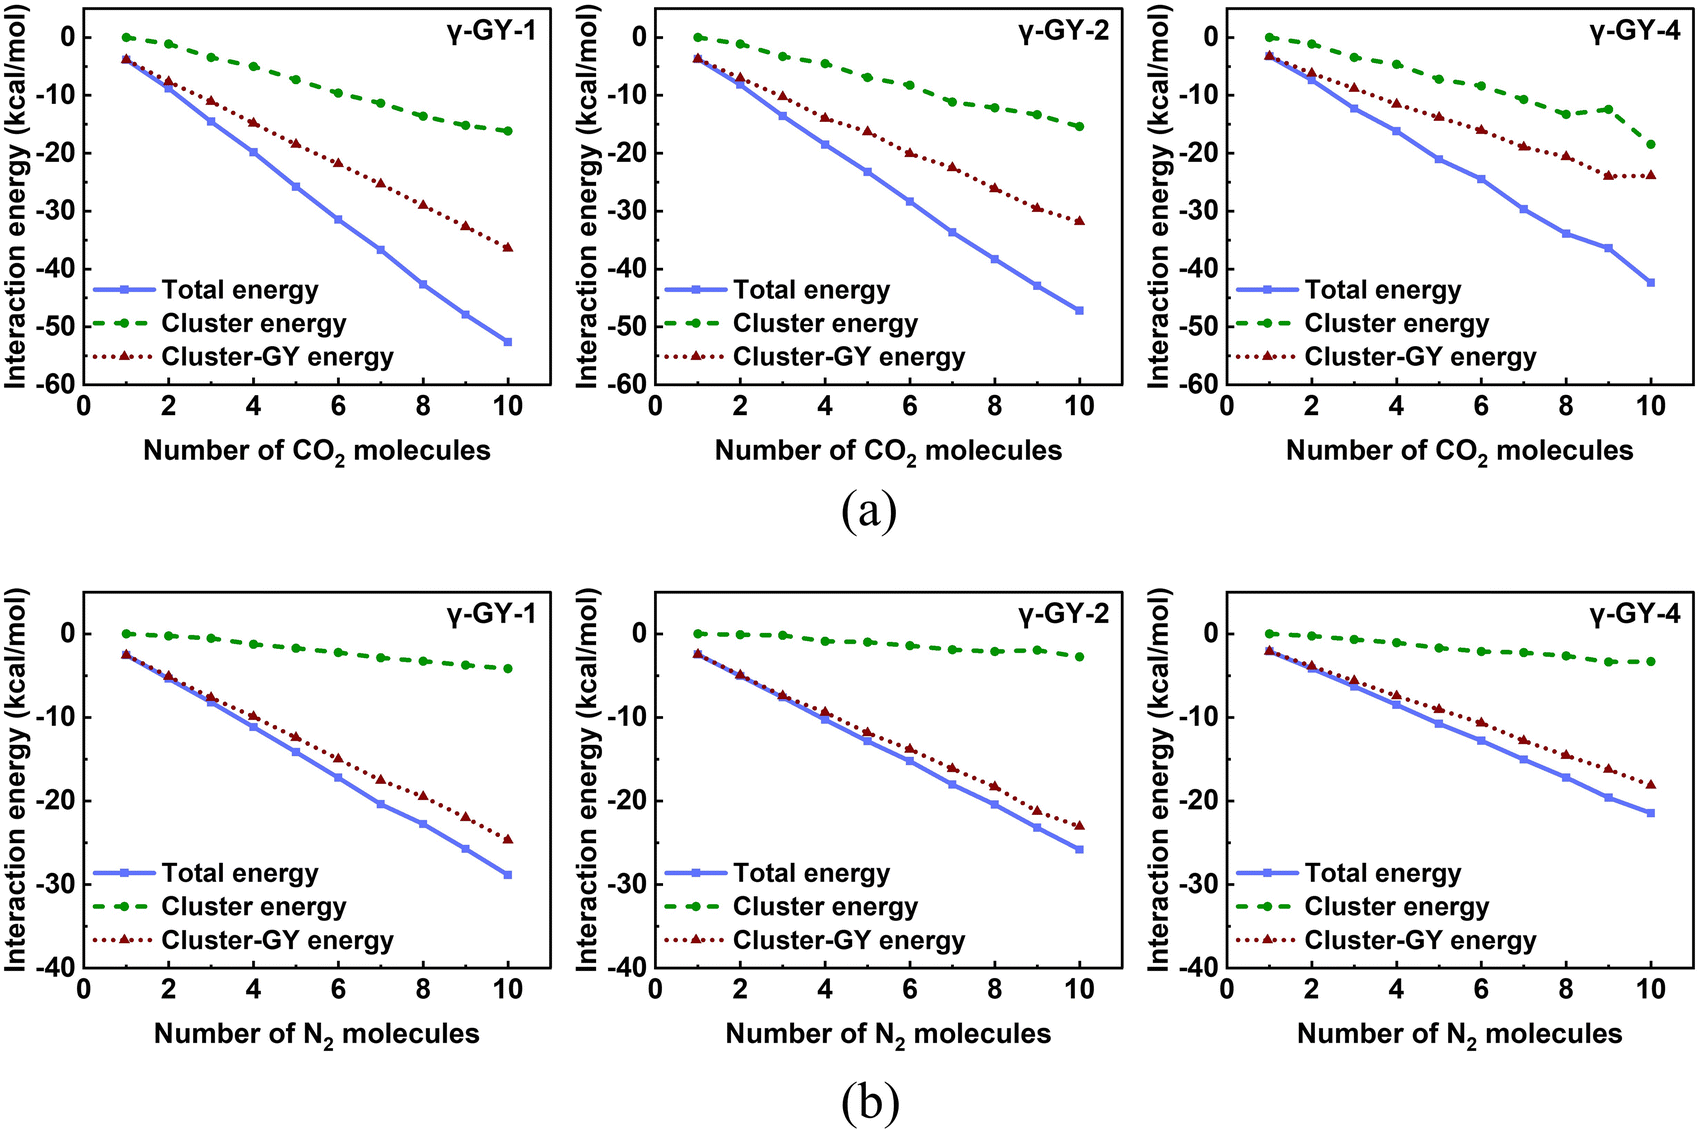
We also analysed the components of the total interaction energy for a deeper understanding of the adsorption patterns. The total interaction energy comprises of contributions from the interactions within the gas molecules (cluster energy) and the interactions between the cluster and the molecular model of GY (cluster–GY energy). Fig. 9 depicts the contribution of each of these to the total interaction energies for the N2 and CO2 adsorption over GYs. For N2 clusters, the contribution from cluster energy is so small that the total interaction energy is derived mainly from the cluster–GY interactions. The smaller slope in Fig. 8b for N2 adsorption over γ-GY-4 when compared to γ-GY-1 and γ-GY-2 can also be attributed to the lower cluster-γ-GY-4 interaction energy contribution (Fig. 9b). While adsorbed N2 clusters featured very less cluster energy, adsorbed CO2 clusters feature a significant cluster energy contribution which is manifest in the form of clustering configurations of CO2 observed in Fig. 7. In order to explicitly elucidate the same, we plotted the percentage relative contributions of cluster energy and cluster–GY energy to the total interaction energy in Fig. S13 of the ESI.† For adsorbed N2 clusters, the cluster energy contributions are always less than 17% while in the case of adsorbed CO2 clusters, a maximum contribution of up to 44% from the cluster energy was observed. We can also see that the increase in cluster energy contribution and the decrease in cluster–GY energy contribution with an increase in the cluster size is more pronounced in the case of CO2 than N2.
 |
| | Fig. 9 Variation in the contributions of various terms to the total interaction energies for the adsorption of (a) CO2 and (b) N2 clusters on γ-GY-1, γ-GY-2, and γ-GY-4 as a function of cluster size. | |
All of the above analysis was performed for the putative global minimum geometries obtained using PSO. The reported energy minimum is the best value obtained from 25 independent PSO-L-BFGS runs. The choice of the number of independent runs was validated by comparing the putative global minimum energies obtained from 25 trial runs to those obtained after 100 trial runs for CO2 and N2 clusters of size 10 adsorbed on γ-GY-1, γ-GY-2, and γ-GY-4 (Fig. S14 of the ESI†). The interaction energies at minima predicted after 100 trials were in good agreement (deviations within 2 kcal mol−1) with those obtained after 25 trials. As we can see, there are slight improvements in certain cases (for example, in the case of (CO2)10-γ-GY-1). However, achieving this slight improvement demands high computational resources. If we weigh the improvement in the results with respect to the computational resources required in running 100 vs. 25 trials, we note that the changes in geometries/energetics are not significant enough to warrant the use of these additional resources. Bearing these factors in mind, we concluded that 25 runs are adequate for reliably locating the structures of adsorbed CO2 and N2 clusters.
Next, we validated our choice of the annulenic model systems of γ-GY-1, γ-GY-2, and γ-GY-4 by comparing the interaction energies of molecular clusters of size 5 and 10 adsorbed on the currently employed model systems and a set of larger annulenic models of GYs, namely C402H42, C582H42, and C450H30. The geometries of the larger models of γ-GY-1, γ-GY-2, and γ-GY-4 are given in Fig. S15 of the ESI.† The interaction energies obtained for the adsorption of molecular clusters on the larger model systems showed good agreement with those obtained for our chosen model systems (Fig. S16 of the ESI†), implying the adequacy of our current model systems in representing GY sheets.
Global optimization of adsorbed binary clusters
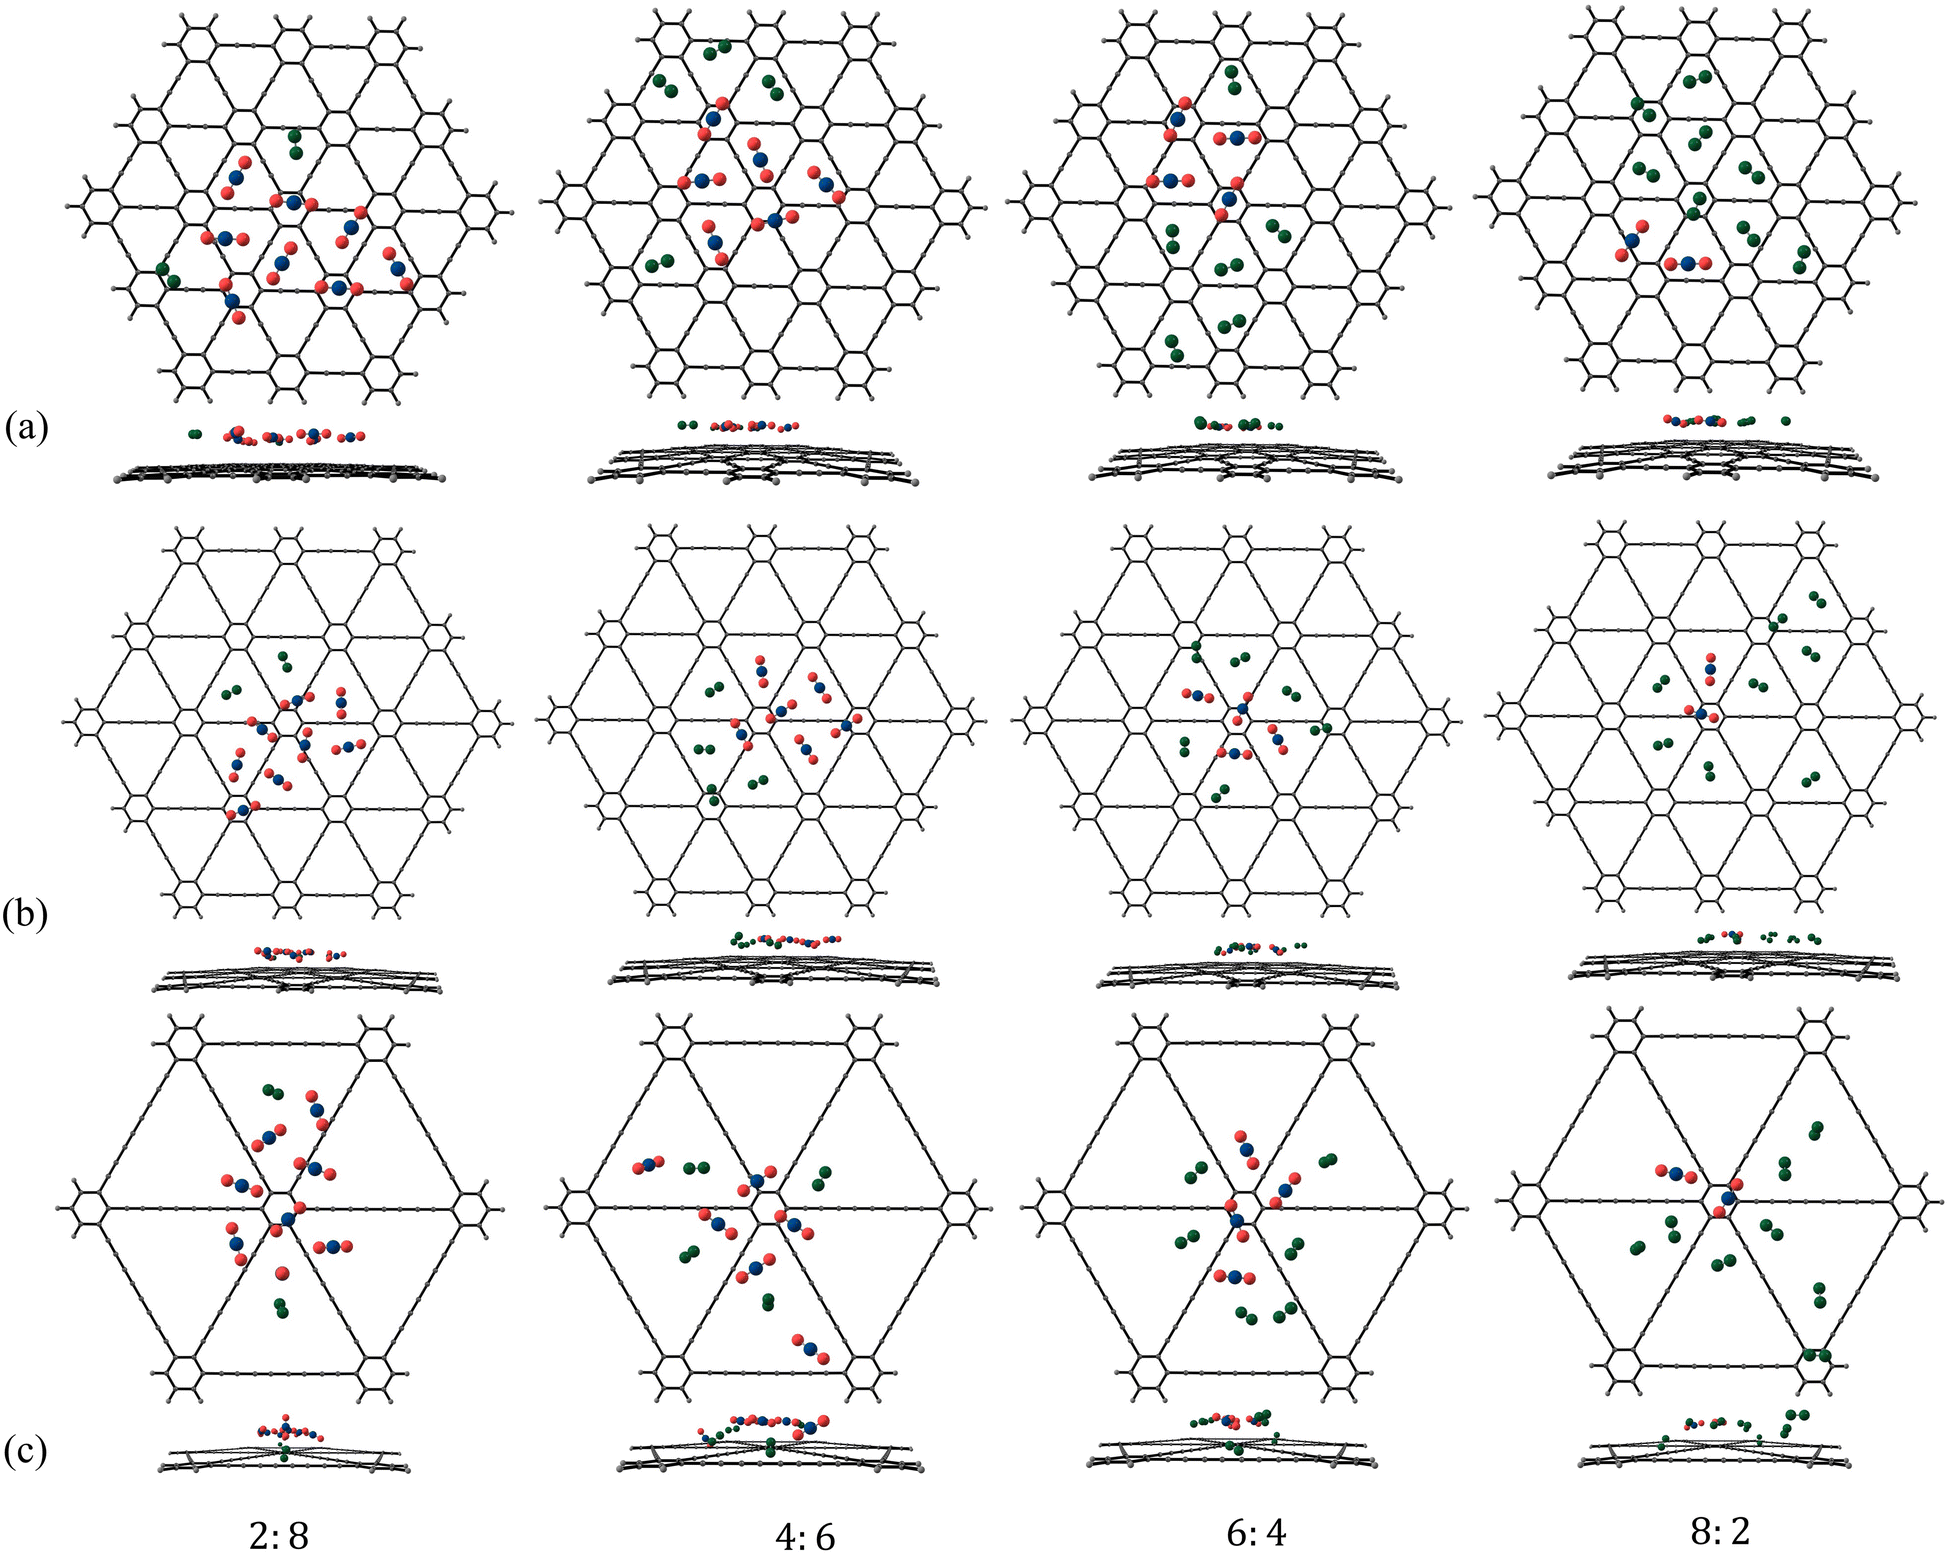
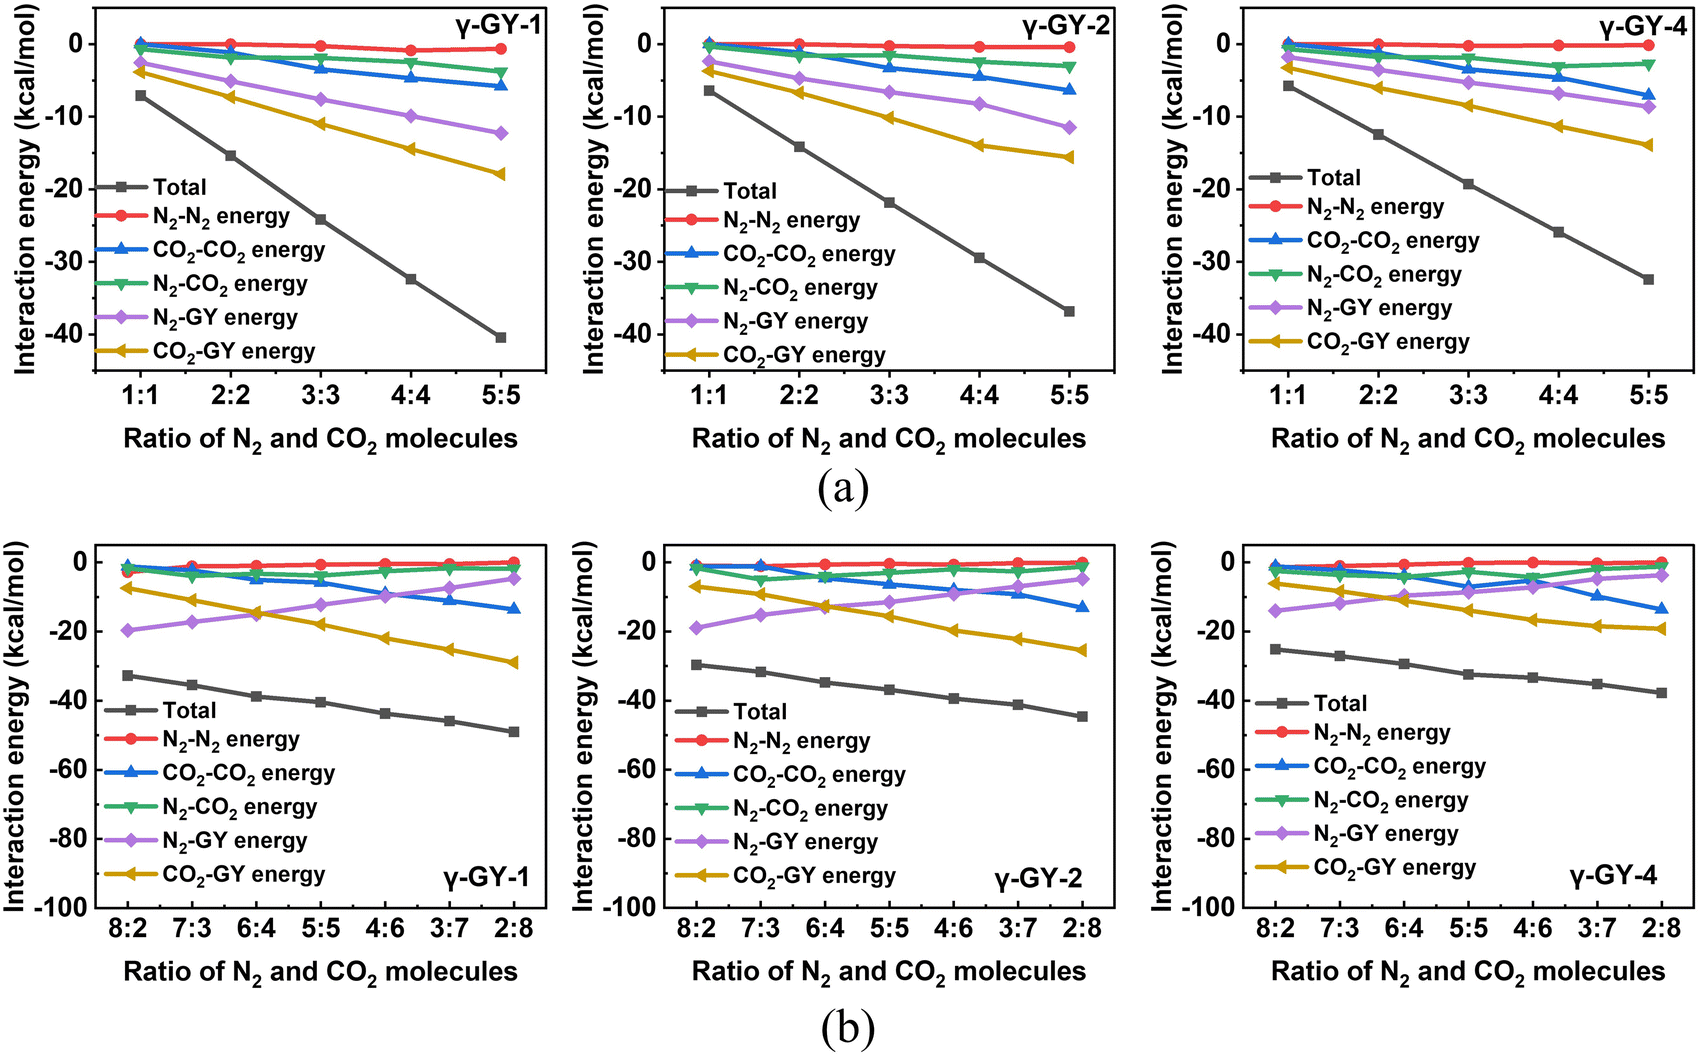
Finally, we moved on to investigate the adsorption of binary mixtures of N2 and CO2 on γ-GYs. The putative global minimum geometries that we obtained for the binary mixtures of CO2 and N2 in various ratios are given in Fig. 10, 11 and Fig. S17 of the ESI.† In case of almost all the binary clusters considered, we observed that the N2 molecules are scattered over different pore centres whereas CO2 molecules prefer to cluster together as they did in their unary clusters but to a lesser extent. It is essentially the presence of the CO2 molecules that scatter the N2 molecules. The scattering of N2 molecules is more apparent in the cases of adsorption on γ-GY-2 and γ-GY-4. The origin of these configurations can be explained with the help of the various contributing energy terms. For an adsorbed binary cluster, the total interaction energy includes energy contributions arising from: (i) the interactions between the CO2 molecules and the model system of GY (CO2–GY energy), (ii) the interactions between the N2 molecules and the model system of GY (N2–GY energy), (iii) the interactions among the CO2 molecules (CO2–CO2 energy), (iv) the interactions among the N2 molecules (N2–N2 energy), and (v) the interactions between the N2 and the CO2 molecules (N2–CO2 energy). Fig. 12 shows the total interaction energies and their components for all the adsorbed binary clusters we have considered in our study. An analysis of the interaction energy contributions for the mixtures with equal number of CO2 and N2 molecules revealed the strengths of the various interactions. Among the different terms, the CO2–GY contribution is found to be the largest, which is followed by the N2–GY term. The N2–N2 contribution is the lowest of them all. The CO2–CO2 interactions and CO2–N2 interactions compete with each other in order to arrive at the most favoured configuration. A similar analysis can be performed for the binary clusters of size 10 with unequal numbers of N2 and CO2 molecules. A crossover between the CO2–GY and N2–GY contributions can be observed in the plot at 6:4 (N2:CO2) ratio (Fig. 12b). If we look at the leading terms of the total interaction energy for the 6:4 cluster, we can observe an interesting feature: even though there is a larger concentration of N2 than CO2, the contribution of CO2–GY and N2–GY interactions are almost the same. The contribution from N2–N2 interactions is always the lowest, even for mixtures with a larger concentration of N2 molecules. For a deeper understanding, we have also plotted the variation of cluster energies and cluster–GY energies of CO2 and N2 in adsorbed binary mixtures (with equal number of N2 and CO2 molecules) with respect to adsorbed unary clusters in Fig. S18 of the ESI.† A relatively high reduction in cluster energies of N2 molecules is observed upon forming binary mixtures, which is a direct consequence of the scattered arrangement of N2 molecules seen in the putative global minimum geometries of the adsorbed binary clusters.
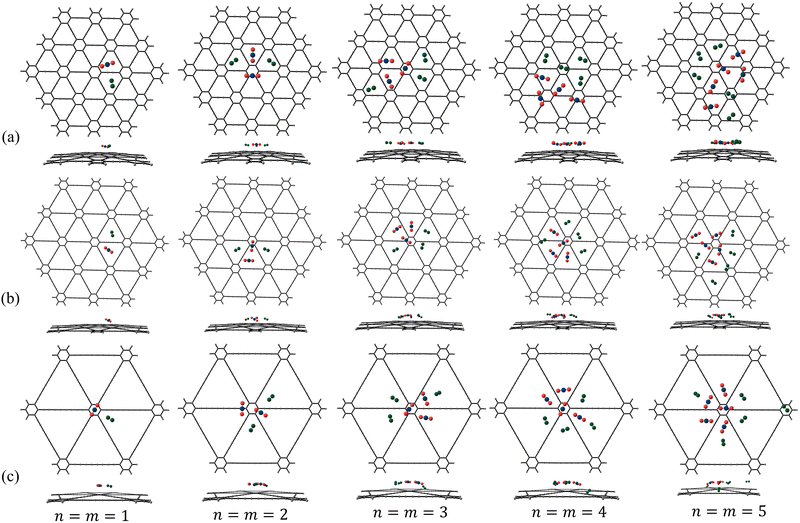 |
| | Fig. 10 Putative global minimum geometries (top and side views) of binary clusters of N2 and CO2 in the ratio n:m where n = m = 1–5 adsorbed on (a) γ-GY-1, (b) γ-GY-2 and (c) γ-GY-4 evaluated using PSO. | |
 |
| | Fig. 11 Putative global minimum geometries (top and side views) of binary clusters of N2 and CO2 in the ratio 2:8, 4:6, 6:4, 8:2 adsorbed on (a) γ-GY-1, (b) γ-GY-2 and (c) γ-GY-4 evaluated using PSO. | |
 |
| | Fig. 12 Variation in the contributions of various terms to the total interaction energies for the adsorption of binary clusters of CO2 and N2 adsorbed on γ-GY-1, γ-GY-2, and γ-GY-4 evaluated using PSO as a function of N2:CO2 ratio, n:m where (a) n = m = 1–5 and (b) n + m = 10. | |
Conclusions
In conclusion, we have investigated three γ-GYs namely, γ-GY-1, γ-GY-2 and γ-GY-4, for the adsorption of unary and binary clusters of CO2 and N2 molecules up to a cluster size of 10. A swarm intelligence technique along with empirical force field formulations was implemented to obtain the putative global minimum geometries of the adsorbed clusters. The non-electrostatic interactions between CO2–CO2, N2–N2 and CO2–N2 were modeled using LJ, Buckingham and ILJ potentials, respectively, while the electrostatic interactions were described using the Coulombic potential. The interactions of the molecules with the molecular models of GYs were described using the ILJ potential. The putative global minimum geometries obtained for adsorbed unary clusters of CO2 and N2 indicated their higher affinity to γ-GY-1 followed by γ-GY-2. When adsorbed on γ-GY-1, CO2 and N2 molecules formed a monolayer at ∼3 Å from the sheet, while no such monolayer formation was observed in the case of γ-GY-2 and γ-GY-4. For γ-GY-1 and γ-GY-2, N2 preferred adsorption over the pore centres, while CO2 preferred clustering without any site preference. Clustering was prominently observed for CO2 molecules due to the stronger CO2–CO2 interactions. The same was observed in case of adsorbed binary clusters, wherein, the clustering of CO2 molecules scattered the N2 molecules of the mixture. The predicted energetics demonstrate the high affinity of CO2 in binding to all the three γ-GYs when compared to N2 suggesting the higher adsorption selectivity of γ-GYs for CO2 than for N2. The ease of implementation of swarm intelligence technique along with the promising selectivity offered by GYs boosts our confidence towards designing efficient membranes for carbon capture in the near future.
Author contributions
The manuscript was written through contributions of all the authors. All authors have given approval to the final version of the manuscript.
Data availability
The data supporting this article have been included as part of the ESI.† The Python code executing global optimization of bare and adsorbed molecular cluster configurations using particle swarm optimization can be found at the GitHub repository https://github.com/SMMACG-IISER/PSO_N2_CO2_GY/tree/main.
Conflicts of interest
There are no conflicts to declare.
Acknowledgements
The authors acknowledge use of the Padmanabha cluster at the Centre for High-performance Computing at IISER TVM. R. S. S. acknowledges the Science and Engineering Research Board (SERB), Government of India for financial support of this work, through the SERB Core Research Grant (CRG/2022/006873). M. R. and C. J. thank IISER TVM for their fellowships.
References
- UNFCCC, 1/Cp. 21, Adoption of the Paris Agreement, https://unfccc.int/resource/docs/2015/cop21/eng/l09r01.pdf.
- Y. Gao, X. Gao and X. Zhang, Engineering, 2017, 3, 272–278 CrossRef.
-
J. G. Speight, Natural Gas (Second Edition), Gulf Professional Publishing, Boston, 2019, pp. 59–98 Search PubMed.
- M. R. M. Abu-Zahra, L. H. J. Schneiders, J. P. M. Niederer, P. H. M. Feron and G. F. Versteeg, Int. J. Greenhouse Gas Control, 2007, 1, 37–46 CrossRef.
- P. J. E. Harlick and F. H. Tezel, Microporous Mesoporous Mater., 2004, 76, 71–79 CrossRef.
- R. V. Siriwardane, M.-S. Shen, E. P. Fisher and J. Losch, Energy Fuels, 2005, 19, 1153–1159 CrossRef CAS.
- K. Sumida, D. L. Rogow, J. A. Mason, T. M. McDonald, E. D. Bloch, Z. R. Herm, T.-H. Bae and J. R. Long, Chem. Rev., 2012, 112, 724–781 CrossRef CAS PubMed.
- S. Cavenati, C. A. Grande and A. E. Rodrigues, J. Chem. Eng. Data, 2004, 49, 1095–1101 CrossRef CAS.
- Y. B. Apriliyanto, N. F. Lago, A. Lombardi, S. Evangelisti, M. Bartolomei, T. Leininger and F. Pirani, J. Phys. Chem. C, 2018, 122, 16195–16208 CrossRef CAS.
- R. H. Baughman, H. Eckhardt and M. Kertesz, J. Chem. Phys., 1987, 87, 6687–6699 CrossRef CAS.
- A. James, C. John, C. Owais, S. N. Myakala, S. Chandra Shekar, J. R. Choudhuri and R. S. Swathi, RSC Adv., 2018, 8, 22998–23018 RSC.
- M. Bartolomei, E. Carmona-Novillo and G. Giorgi, Carbon, 2015, 95, 1076–1081 CrossRef CAS.
- Y. Jiao, A. Du, M. Hankel, Z. Zhu, V. Rudolph and S. C. Smith, Chem. Commun., 2011, 47, 11843–11845 RSC.
- H. J. Kwon, Y. Kwon, T. Kim, Y. Jung, S. Lee, M. Cho and S. Kwon, AIP Adv., 2017, 7, 125013 CrossRef.
- R. Majidi and U. Sarkar, Mol. Simul., 2020, 46, 1383–1389 CrossRef CAS.
- S. J. Mahdizadeh and E. K. Goharshadi, RSC Adv., 2020, 10, 24255–24264 RSC.
- M. Bartolomei and G. Giorgi, ACS Appl. Mater. Interfaces, 2016, 8, 27996–28003 CrossRef CAS PubMed.
- S. Zhou, M. Wang, S. Wei, H. Xin, W. Zhai, S. Xu, S. Liu, S. Liu, Z. Wang, C.-M. Lawrence Wu and X. Lu, Mater. Today Phys., 2021, 21, 100539 CrossRef CAS.
- M. H. Darvishnejad and A. Reisi-Vanani, Int. J. Quantum Chem., 2020, 120, e26342 CrossRef CAS.
- M. H. Darvishnejad and A. Reisi-Vanani, Comput. Mater. Sci., 2020, 176, 109539 CrossRef CAS.
- C. He, R. Wang, D. Xiang, X. Li, L. Fu, Z. Jian, J. Huo and S. Li, Appl. Surf. Sci., 2020, 509, 145392 CrossRef CAS.
- Z. Tabandeh and A. Reisi-Vanani, Fuel, 2023, 333, 126295 CrossRef CAS.
- S. Xu, S. Wei, L. Wang, S. Liu, M. Wang, S. Liu, Z. Wang, T. Yang and X. Lu, Appl. Surf. Sci., 2022, 605, 154724 CrossRef CAS.
- G. Li, Y. Li, H. Liu, Y. Guo, Y. Li and D. Zhu, Chem. Commun., 2010, 46, 3256–3258 RSC.
- Y. Hu, C. Wu, Q. Pan, Y. Jin, R. Lyu, V. Martinez, S. Huang, J. Wu, L. J. Wayment, N. A. Clark, M. B. Raschke, Y. Zhao and W. Zhang, Nat. Synth., 2022, 1, 449–454 CrossRef.
- J. Gao, J. F. Li, Y. H. Chen, Z. C. Zuo, Y. J. Li, H. B. Liu and Y. L. Li, Nano Energy, 2018, 43, 192–199 CrossRef CAS.
-
J. Kennedy and R. Eberhart, Particle Swarm Optimization, in Proceedings of ICNN'95 - International Conference on Neural Networks, 1995, vol. 4, pp. 1942–1948 Search PubMed.
-
R. C. Eberhart and S. Yuhui, Particle Swarm Optimization: Developments, Applications and Resources, in Proceedings of the 2001 Congress on Evolutionary Computation (IEEE Cat. No. 01TH8546), 2001, vol. 1, pp. 81–86 Search PubMed.
-
A. P. Engelbrecht, Computational Intelligence, John Wiley & Sons, Ltd, England, 2nd edn, 2007, pp. 289–358 Search PubMed.
-
M. Clerc, Particle Swarm Optimization, ISTE Ltd, UK, 2006 Search PubMed.
-
X.-S. Yang, Nature-Inspired Metaheuristic Algorithms, Luniver Press, Engelbrech, 2nd edn, 2008 Search PubMed.
-
H. Iba, AI and Swarm: Evolutionary Approach to Emergent Intelligence, CRC Press, Boca Raton, 2019 Search PubMed.
-
R. J. W. Hodgson, Partical Swarm Optimization Applied to the Atomic Cluster Optimization Problem, in Proceedings of the 4th Annual Conference on Genetic and Evolutionary Computation, 2002, pp. 68–73 Search PubMed.
- G. Jana, A. Mitra, S. Pan, S. Sural and P. K. Chattaraj, Front. Chem., 2019, 7, 485 CrossRef CAS PubMed.
- C. Owais, C. John and R. S. Swathi, Eur. Phys. J. D, 2021, 75, 16 CrossRef CAS.
- C. Owais, C. John and R. S. Swathi, Phys. Chem. Chem. Phys., 2020, 22, 20693–20703 RSC.
- C. John, C. Owais, A. James and R. S. Swathi, J. Phys. Chem. C, 2021, 125, 2811–2823 CrossRef CAS.
- C. John, M. Rajeevan and R. S. Swathi, Chem. – Asian J., 2022, 17, e202200625 CrossRef CAS PubMed.
- S. T. Call, D. Y. Zubarev and A. I. Boldyrev, J. Comput. Chem., 2007, 28, 1177–1186 CrossRef CAS PubMed.
- L.-T. Shi, M. Tang, X.-R. Chen, C.-E. Hu and Y. Cheng, Comput. Theor. Chem., 2017, 1120, 102–111 CrossRef CAS.
- Y.-M. Wen, S.-K. Zhang, C.-E. Hu and Y. Cheng, Theor. Chem. Acc., 2019, 138, 83 Search PubMed.
- C. John and R. S. Swathi, J. Phys. Chem. A, 2023, 127, 4632–4642 CrossRef CAS.
- S. Zhou, M. Wang, S. Wei, S. Cao, Z. Wang, S. Liu, D. Sun and X. Lu, Mater. Today Phys., 2021, 16, 100301 CrossRef CAS.
- M. H. Darvishnejad and A. Reisi-Vanani, J. CO2 Util., 2021, 46, 101469 CrossRef CAS.
- L. Fu, R. Wang, C. Zhao, J. Huo, C. He, K.-H. Kim and W. Zhang, Chem. Eng. J., 2021, 414, 128857 CrossRef CAS.
-
M. J. Frisch, G. W. Trucks, H. B. Schlegel, G. E. Scuseria, M. A. Robb, J. R. Cheeseman, G. Scalmani, V. Barone, G. A. Petersson, H. Nakatsuji, X. Li, M. Caricato, A. V. Marenich, J. Bloino, B. G. Janesko, R. Gomperts, B. Mennucci, H. P. Hratchian, J. V. Ortiz, A. F. Izmaylov, J. L. Sonnenberg Williams, F. Ding, F. Lipparini, F. Egidi, J. Goings, B. Peng, A. Petrone, T. Henderson, D. Ranasinghe, V. G. Zakrzewski, J. Gao, N. Rega, G. Zheng, W. Liang, M. Hada, M. Ehara, K. Toyota, R. Fukuda, J. Hasegawa, M. Ishida, T. Nakajima, Y. Honda, O. Kitao, H. Nakai, T. Vreven, K. Throssell, J. A. Montgomery Jr., J. E. Peralta, F. Ogliaro, M. J. Bearpark, J. J. Heyd, E. N. Brothers, K. N. Kudin, V. N. Staroverov, T. A. Keith, R. Kobayashi, J. Normand, K. Raghavachari, A. P. Rendell, J. C. Burant, S. S. Iyengar, J. Tomasi, M. Cossi, J. M. Millam, M. Klene, C. Adamo, R. Cammi, J. W. Ochterski, R. L. Martin, K. Morokuma, O. Farkas, J. B. Foresman and D. J. Fox, Gaussian 16, 2016 Search PubMed.
- J. Mawwa, S. U. D. Shamim, S. Khanom, M. K. Hossain and F. Ahmed, RSC Adv., 2021, 11, 32810–32823 RSC.
- R. Amin, R. Ghiasi and A. Marjani, Russ. J. Phys. Chem. A, 2020, 94, 2760–2769 CrossRef.
- P. K. Ramya and C. H. Suresh, J. Phys. Chem. A, 2023, 127, 2511–2522 CrossRef PubMed.
-
K.-L. Du and M. N. S. Swamy, Search and Optimization by Metaheuristics, Springer International Publishing, Switzerland, 2016 Search PubMed.
- D. C. Liu and J. Nocedal, Math. Program., 1989, 45, 503–528 CrossRef.
- P. Virtanen, R. Gommers, T. E. Oliphant, M. Haberland, T. Reddy, D. Cournapeau, E. Burovski, P. Peterson, W. Weckesser, J. Bright, S. J. van der Walt, M. Brett, J. Wilson, K. J. Millman, N. Mayorov, A. R. J. Nelson, E. Jones, R. Kern, E. Larson, C. J. Carey, I. Polat, Y. Feng, E. W. Moore, J. VanderPlas, D. Laxalde, J. Perktold, R. Cimrman, I. Henriksen, E. A. Quintero, C. R. Harris, A. M. Archibald, A. H. Ribeiro, F. Pedregosa and P. van Mulbregt, Nat. Methods, 2020, 17, 261–272 CrossRef CAS PubMed.
- J. L. Llanio-Trujillo, J. M. C. Marques and F. B. Pereira, J. Phys. Chem. A, 2011, 115, 2130–2138 CrossRef CAS PubMed.
- H. R. Soni, J. Gebhardt and A. Görling, J. Phys. Chem. C, 2018, 122, 2761–2772 CrossRef CAS.
- M. Lafkioti, B. Krauss, T. Lohmann, U. Zschieschang, H. Klauk, K. v Klitzing and J. H. Smet, Nano Lett., 2010, 10, 1149–1153 CrossRef CAS PubMed.
- A. Chakradhar, N. Sivapragasam, M. T. Nayakasinghe and U. Burghaus, J. Vac. Sci. Technol., A, 2015, 34, 021402 CrossRef.
- X. Gao, Y. Zhu, D. Yi, J. Zhou, S. Zhang, C. Yin, F. Ding, S. Zhang, X. Yi, J. Wang, L. Tong, Y. Han, Z. Liu and J. Zhang, Sci. Adv., 2018, 4, eaat6378 CrossRef PubMed.
- J. Gao, J. Li, Y. Chen, Z. Zuo, Y. Li, H. Liu and Y. Li, Nano Energy, 2018, 43, 192–199 CrossRef CAS.
- J. J. Potoff and J. I. Siepmann, AIChE J., 2001, 47, 1676–1682 CrossRef CAS.
- G. M. Meconi and R. N. Zangi, Phys. Chem. Chem. Phys., 2020, 22, 21031–21041 RSC.
- G. M. Meconi, R. Tomovska and R. Zangi, J. CO2 Util., 2019, 32, 92–105 CrossRef CAS.
-
A. J. Stone, The Theory of Intermolecular Forces, Oxford University Press, Oxford, 2nd edn, 2013 Search PubMed.
- M. Bertolus, V. Brenner, P. Millie and J. B. Maillet, Z. Phys. D, 1997, 39, 239–250 CrossRef CAS.
- H.-J. Böhm and R. Ahlrichs, Mol. Phys., 1985, 55, 1159–1169 CrossRef.
- J.-B. Maillet, A. Boutin, S. Buttefey, F. Calvo and A. H. Fuchs, J. Chem. Phys., 1998, 109, 329–337 CrossRef CAS.
- F. Calvo, G. Torchet and M.-F. de Feraudy, J. Chem. Phys., 1999, 111, 4650–4658 CrossRef CAS.
- F. Pirani, S. Brizi, L. F. Roncaratti, P. Casavecchia, D. Cappelletti and F. Vecchiocattivi, Phys. Chem. Chem. Phys., 2008, 10, 5489–5503 RSC.
- M. J. Weida, J. M. Sperhac and D. J. Nesbitt, J. Chem. Phys., 1995, 103, 7685–7699 CrossRef CAS.
- H. Takeuchi, J. Phys. Chem. A, 2008, 112, 7492–7497 CrossRef CAS PubMed.
- E. García-Arroyo, M. I. Hernández, T. González-Lezana, J. H.-R. Campos-Martínez and J. Bretón, Theor. Chem. Acc., 2021, 140, 79 Search PubMed.
- B. Jeziorski, R. Moszynski and K. Szalewicz, Chem. Rev., 1994, 94, 1887–1930 CrossRef CAS.
- D. G. A. Smith, L. A. Burns, A. C. Simmonett, R. M. Parrish, M. C. Schieber, R. Galvelis, P. Kraus, H. Kruse, R. Di Remigio, A. Alenaizan, A. M. James, S. Lehtola, J. P. Misiewicz, M. Scheurer, R. A. Shaw, J. B. Schriber, Y. Xie, Z. L. Glick, D. A. Sirianni, J. S. O'Brien, J. M. Waldrop, A. Kumar, E. G. Hohenstein, B. P. Pritchard, B. R. Brooks, H. F. Schaefer, A. Y. Sokolov, K. Patkowski, A. E. DePrince, U. Bozkaya, R. A. King, F. A. Evangelista, J. M. Turney, T. D. Crawford and C. D. Sherrill, J. Chem. Phys., 2020, 152, 184108 CrossRef CAS PubMed.
- N. Mehio, S. Dai and D. E. Jiang, J. Phys. Chem. A, 2014, 118, 1150–1154 CrossRef CAS PubMed.
- M. Miklitz and K. E. Jelfs, J. Chem. Inf. Model., 2018, 58, 2387–2391 CrossRef CAS PubMed.
- Z. S. Lu, P. Lv, D. W. Ma, X. W. Yang, S. Li and Z. X. Yang, J. Phys. D: Appl. Phys., 2018, 51, 065109 CrossRef.
- M. H. Darvishnejad and A. Reisi-Vanani, Chem. Eng. J., 2021, 406, 126749 CrossRef CAS.
- L. Fang and Z. X. Cao, J. Phys. Chem. C, 2020, 124, 2712–2720 CrossRef CAS.
Footnote |
| † Electronic supplementary information (ESI) available: Cartesian coordinates of the molecular models (text files), additional theoretical details, models, putative global minimum geometries and plots (PDF). See DOI: https://doi.org/10.1039/d4cp02843k |
|
| This journal is © the Owner Societies 2024 |
Click here to see how this site uses Cookies. View our privacy policy here. 
 Open Access Article
 This Open Access Article is licensed under a Creative Commons Attribution-Non Commercial 3.0 Unported Licence
 ,
Chris
John
,
Chris
John


 are modeled using the Coulombic pair potential between the partial charges residing on each atom of the two interacting CO2 molecules. A representative model of the charge distribution in CO2 is given in Fig. S1 of the ESI.† For a cluster of size n, the electrostatic interactions are calculated using