
 Open Access Article
 This Open Access Article is licensed under a Creative Commons Attribution-Non Commercial 3.0 Unported Licence
Photoisomerization mechanism of iminoguanidinium receptors from spectroscopic methods and quantum chemical calculations†‡
Duy-Khoi
Dang§
 a,
Jeffrey D.
Einkauf§
b,
Xinyou
Ma
b,
Radu
Custelcean
b,
Ying-Zhong
Ma
*b,
Paul M.
Zimmerman
*a and
Vyacheslav S.
Bryantsev
*b
a,
Jeffrey D.
Einkauf§
b,
Xinyou
Ma
b,
Radu
Custelcean
b,
Ying-Zhong
Ma
*b,
Paul M.
Zimmerman
*a and
Vyacheslav S.
Bryantsev
*b
aDepartment of Chemistry, University of Michigan, Ann Arbor, MI 48109, USA. E-mail: paulzim@umich.edu
bChemical Sciences Division, Oak Ridge National Laboratory, Oak Ridge, TN 37831-6119, USA. E-mail: may1@ornl.gov; bryantsevv@ornl.gov
First published on 2nd September 2024
Abstract
The hydrazone functional group, when coupled with a pyridyl substituent, offers a unique class of widely tunable photoswitches, whose E-to-Z photoisomerization equilibria can be controlled through intramolecular hydrogen bonding between the N–H hydrazone donor and the pyridyl acceptor. However, little is known about the photoisomerization mechanism in this class of compounds. To address this issue, we report a pyridine-appended iminoguanidinium photoswitch that is functionally related to acylhydrazones and provides insight into the photoisomerization processes between the E and Z configurations. The E-to-Z photoisomerization of the E-2-pyridyl-iminoguanidinium cation (2PyMIG) in DMSO, prepared as the bromide salt, was quantified by 1H NMR, and probed in real time with ultrafast laser spectroscopy. The photoisomerization process occurs on a picosecond timescale, resulting in low fluorescence yields. The multiconfigurational reaction path found with the growing string method features a small barrier (4.3 or 6.5 kcal mol−1) that the E isomer in the π–π* state must overcome to reach the minimum energy conical intersection (MECI) connecting the E and Z isomers of 2PyMIG. While two possible pathways exist depending on the orientation of the pyridine ring, both exhibit the same qualitative features along the path and at their MECIs, involving simultaneous changes in the CCNN and CNNC dihedral angles. Furthermore, the ground state barrier for pyridine ring rotation is readily accessible, thus a low barrier pathway to the experimentally observed Z isomer exists for both MECIs leading to a transition from the E isomer to photoproduct. Combining multiconfigurational reaction path calculations using growing string method with time-resolved fluorescence spectroscopy provided crucial insights into the photoisomerization process of 2PyMIG, resulting in both the computational and experimental results pointing to rapid photoisomerization via a surface crossing between the singlet π–π* and the ground states.
Introduction
Inducing a structural rearrangement of a molecule through the absorption of light plays a crucial role in numerous processes, from fundamental science to applied technologies. This has been observed in fields ranging from biochemistry such as photopharmacology1 to molecular machines,2,3 and separations that often involve chromophores such as azobenzenes, stilbenes, and hydrazones.4–6 The pioneering works by Courtot et al. and Pichon et al. demonstrating intramolecular hydrogen bonding in 2-arylhydrazones-1,2-diketones,7,8 were taken further by Chaur et al. by appending a pyridine moiety near an imine functional group to produce a photoswitch that responded effectively to light stimulus.9 As a result of adding the pyridyl group, this led to longer lived Z isomers that required forcing conditions involving refluxing in acid to regenerate the E isomer. The overall relative simplicity of synthesis via imine condensation and minimal energy input required to induce a configurational change has led to an increased interest in the field of hydrazone photoswitches.The fundamental understanding of the hydrazone family of photoswitches has been pushed forward beyond those pioneering works, particularly by the Aprahamian, Hecht, and Lehn. Aprahamian and Lehn have reported the ability to increase the half-lives of the Z isomer up to 2700 years10 by strengthening the intramolecular hydrogen bond, or decreasing the lifetime to a few hours by inducing strain in the Z isomer through appending bulky groups near the imine nitrogen.9,11,12 Hecht and coworkers have focused on tuning the photochromic ability of these classes of compounds and have published a large series of acylhydrazones with tunable photoisomerization ratios and absorption properties that can be pushed into the near infrared range.13,14 Together, these works have opened the door on utilizing hydrazones for real-world applications ranging from pharmacology15 to data storage.9,16
A crucial step towards further expanding the applicability of photoswitchable hydrazone molecules is building upon the precedents set by similar systems that undergo geometric or configurational transformations.17–20 Often studied are azo molecules, such as azobenzene, where theory has established that photoisomerization involves a conical intersection where the central –N![[double bond, length as m-dash]](https://www.rsc.org/images/entities/char_e001.gif) N– bond has a geometry intermediate between E and Z forms.21,22 These conical intersections affect the transition from the excited to ground state surfaces with the transformation of electronic energy to vibrational energy and a resulting change between E and Z isomers. It has been reported in azobenzene systems that the rapid deactivation of the excited state in solution is attributed to passing through a conical intersection and the formation of a photoisomer, which reverts to the most stable E isomer over several hundred picoseconds.23
N– bond has a geometry intermediate between E and Z forms.21,22 These conical intersections affect the transition from the excited to ground state surfaces with the transformation of electronic energy to vibrational energy and a resulting change between E and Z isomers. It has been reported in azobenzene systems that the rapid deactivation of the excited state in solution is attributed to passing through a conical intersection and the formation of a photoisomer, which reverts to the most stable E isomer over several hundred picoseconds.23
Investigations into the mechanism of photoswitching and the subsequent reversion processes of the family of hydrazones by both experimental and computational methods are not as widely present in the literature. Lluch et al.,24 approached the problem through a theoretical perspective and were able to classify acylhydrazones by their differing photochemistry including the change of the peak absorbance wavelength between E and Z isomers. Here, a change greater than 100 nm between isomers is attributed to an intramolecular proton transfer process, while an intermolecular proton transfer with solvent molecules results in a minor absorbance change. Recently, works by Mravec and Cigáň have dealt with a series of benzoylpyridine hydrazones, focusing on the structure–property relationships on the para position of the benzoyl or phenyl rings that can help control the thermal stability, photoconversion efficiency, and fatigue resistance through combined experimental and theoretical approaches including computations of potential energy surfaces and conical intersections.25,26
We have recently discovered a new class of diiminoguanidinium photoswitches showing unprecedented photoswitched recognition of the sulfate anion (2PyDIG, Fig. 1).27 However, little is known about the mechanism of photoisomerization of this ligand. Important insights about the mechanism can be obtained from reaction path optimization using multireference electronic structure theory. To enable such calculations we have developed a simplified version of the 2PyDIG ligand, a monosubstituted 2-pyridyl-iminoguanidinium salt (2PyMIG, Fig. 1). In this contribution, we explore the isomerization and thermal relaxation behavior of the hydrazone-containing 2PyMIG, prepared as the bromide salt, by combining 1H NMR, steady-state and time-resolved optical spectroscopy coupled with computational methods including density functional theory (DFT) and complete active space self-consistent field (CASSCF) calculations to explore the pathways for photoexcitation and thermal relaxation of the 2PyMIG cation. The resulting computational and experimental insights point to rapid photoisomerization of 2PyMIG through a an internal conversion process via conical intersections.
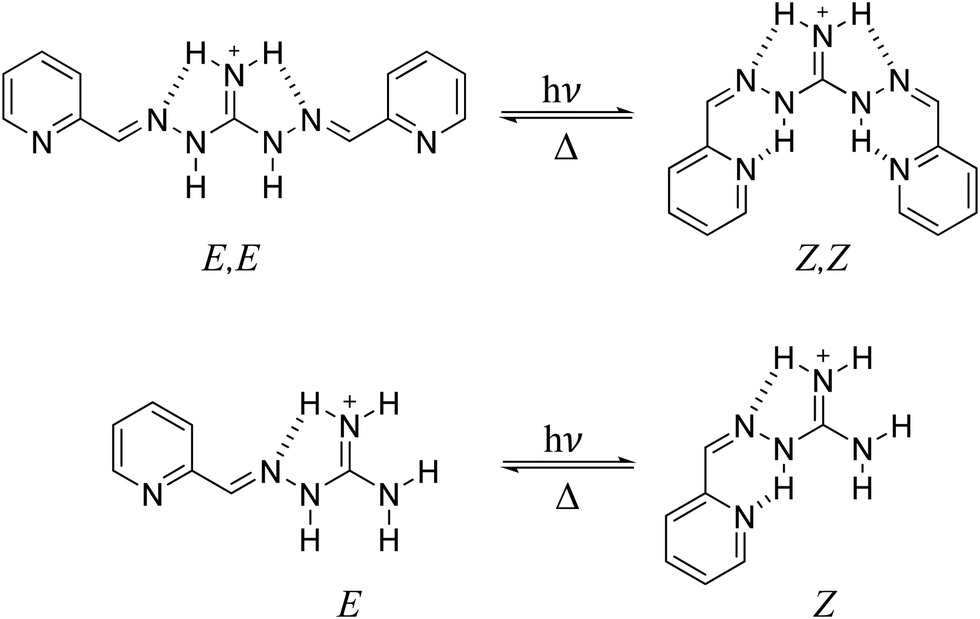 | ||
| Fig. 1 Structural changes of the 2PyDIG (top) and 2PyMIG (bottom) cations upon irradiation with UV light. Hydrogen bonds are noted as dashed lines. | ||
Experimental
Materials
Aminoguanidine hydrochloride (≥98%, CH6N4·HCl) was purchased from Aldrich Chemicals; aminoguanidine hydrogen carbonate (98+%, CH6N4·H2CO3) was purchased from Alfa Aesar; ethanol (95% ACS Grade, CH3CH2OH) was purchased from Decon Laboratories, Inc.; hydrochloric acid (ACS Grade, HCl) and hydrobromic acid (48% ACS Grade, HBr) were purchased from Fisher Chemical; 2-pyridinecarboxaldehyde (99% ACS Grade, C6H5NO) and dimethylsulfoxide-d6 (99.5+%, (CD3)2SO) were purchased from Acros Organics; sulfuric acid (Ultrapure Reagent Grade, H2SO4) was purchased from J. T. Baker; dichloromethane (ACS grade, CH2Cl2) was purchased from VWR BDH Chemicals; dimethylsulfoxide (99%, (CH3)2SO) was purchased from Sigma Aldrich; quinine sulfate dihydrate (≥95%, C40H48N4O4·H2SO4·2H2O) was purchased from AnaSpec Inc.; tetramethylammonium sulfate (>98.0%, [(CH3)4N]2(SO4)) was purchased from TCI Chemicals. Deionized (DI) H2O was obtained from a Milli-Q water system operated at 18.2 MΩ cm at 24 °C.Synthesis of (E)-amino(2-(pyridin-2-ylmethylene)hydrazineyl)methaniminium chloride (PyMIG·HCl)
The synthesis of PyMIG·HCl was performed according to literature methods.28 Briefly, aminoguanidine hydrochloride (135 mg, 1.22 mmol) was added to a 50 mL roundbottom flask and dissolved in 20 mL 95% ethanol and 10 drops of HCl (0.1 M). To the clear, colorless solution, 2-pyridinecarboxaldhyde (94.2 μL, 0.99 mmol) was added. The solution was stirred and heated under reflux for 24 h. The solvent was removed in vacuo to give a yellow solid that was dissolved in 20 mL DI H2O and extracted with dichloromethane (5 × 20 mL). The aqueous phase was evaporated, and the product was obtained as a yellow solid (79.3 mg, 40% yield). 1H NMR (400 MHz, DMSO-d6) δ 12.04 (s), 8.68 (s), 8.63–8.61 (d, 1H), 8.29–8.27 (d, 1H), 8.18 (s, 1H), 7.92–7.87 (t), 7.46–7.43 (t, 1H). Elemental analysis (calcd, found for PyMIG·HCl and 2 H2O): C (35.67, 34.63), H (5.99, 5.90), N (29.72, 30.19).Synthesis of (E)-amino(2-(pyridin-2-ylmethylene)hydrazineyl)methaniminium bromide
Aminoguanidine hydrogen carbonate (200 mg, 1.47 mmol) was dissolved in DI water (5 mL). To the clear, colorless solution, dilute hydrobromic acid (48%, 165 μL) was added, resulting in evolution of carbon dioxide. After the bubbling stopped, the solution was evaporated, resulting a faint yellow solid (180 mg, 79% yield). The aminoguanidine hydrobromide salt (100 mg, 0.65 mmol) was added to a 50 mL roundbottom flask and was dissolved in 20 mL 95% ethanol. To the clear, colorless solution, 2-pyridinecarboxladehyde (62.8 μL, 0.66 mmol) was added. The solution was stirred and heated under reflux for 24 h. The solvent was removed in vacuo to give a yellow precipitate that was dissolved in 20 mL DI H2O and extracted with dichloromethane (5 × 20 mL). The aqueous phase was evaporated, and the product was obtained as a yellow solid (58.6 mg, 37% yield). 1H NMR (400 MHz, DMSO-d6) δ 12.04 (s), 8.69 (s), 8.62–8.61 (d, 1H), 8.29–8.27 (d, 1H), 8.18 (s, 1H), 7.92–7.88 (t), 7.47–7.42 (t, 1H). 13C NMR (100 MHz, DMSO-d6) δ 155.5, 152.3, 149.4, 146.8, 136.8, 124.8, 120.8. Elemental analysis (calcd, found for PyMIG·HBr and 1 EtOH): C (37.25, 36.52), H (5.56, 5.60), N (24.14, 23.74).Preparation of 2PyMIG·HBr crystals
Aminoguanidine hydrogen carbonate (0.758 mmol, 102 mg) was dissolved in 5 mL DI water and 48% HBr (0.735 mmol, 82 μL) was added, producing carbon dioxide bubbles. To the clear, pale yellow solution, 2-pyridinecarboxaldehyde (0.758 mmol, 72 μL) was added. The clear, yellow solution was left uncovered and undisturbed for 1 week at room temperature, where yellow, blade-like crystals formed.X-ray crystallography
Diffraction data were collected at 100 K on a Bruker D8 Advance Quest Diffractometer with a graphite monochromator using Mo Kα radiation (λ = 0.71073 Å). The frames were integrated with the Bruker SAINT software package using a narrow-frame algorithm. An empirical absorption correction using the Multi-Scan method SADABS was applied to the data. The structure was solved by direct methods using the XT, version 2014/5 program. Hydrogen atoms’ positions of the PyMIG cation were calculated.Photoirradiation experiments
In a typical photoirradiation NMR experiment, 3 mL of a freshly made deuterated DMSO solution was placed in a quartz cuvette, stirred, and irradiated with UV-visible light using an unfiltered Oriel Instruments super high-pressure 200 W mercury lamp with emissions in the long-wave UV region and in the visible region at the yellow, green, blue, and violet wavelengths. From the irradiated solution, 500 μL aliquots were removed with a micropipette and transferred to NMR tubes. All measurements were obtained on the irradiated solutions within 1 h of aliquot removal. 1H spectra were recorded on a Bruker AvanceIII-400 MHz NMR spectrometer equipped with a 5 mm PABBO probe. The residual solvent signal ((CD3)2SO, δH = 2.50 ppm) was considered as an internal reference to calibrate spectra. The chemical shifts used to monitor photoisomerization were the set of doublets at 8.67 and 8.74 ppm and triplets at 7.42 and 7.60 ppm for the E and Z isomers, respectively. NMR data were processed using Bruker Topspin 4.0.8 program. Absorbance spectra of the PyMIG cation in DMSO were collected using a Cary 4E UV-vis-NIR absorption spectrometer in a standard quartz sample cell of 10 mm × 10 mm with a 4 mL volume.Fluorescence quantum yield determination
The quantum yield values were determined from eqn (1): | (1) |
Time-resolved spectroscopic methods
Freshly synthesized 2PyMIG·HBr was dissolved in dry DMSO purged for ∼2 hours using N2 gas before each experiment. A standard quartz sample cell of 10 mm × 10 mm with a 4 mL volume was used for the time-resolved fluorescence measurements, and a typical sample absorbance was adjusted to 0.15 optical density (OD) at the excitation wavelength to minimize the reabsorption of the fluorescent photons. A Cary 4E UV-vis-NIR absorption spectrometer was used to record the linear absorption spectra before and after time-resolved spectroscopic measurements.Picosecond time-resolved fluorescence measurements were performed using a time-correlated single-photon-counting (TCSPC) apparatus as described previously.30 Briefly, an actively quenched single photon avalanche photodiode (PDM 50CT module, Micro Photon Devices) in combination with a PicoQuant TCSPC system (PicoHarp 300, Picoquant) was employed as the detection. The excitation light source was generated using an optical parametric amplifier (OPA) pumped by a 250 kHz Ti:Sapphire femtosecond regenerative amplifier, and the OPA output was further frequency doubled using a 2 mm thick BBO crystal to obtain excitation pulses centered at 356 nm with a typical <2 nJ pulse energy. Fluorescence emission at different wavelengths was selected by using 10 nm (FWHM) bandpass filters. The shortest instrument response function (IRF) showed a FWHM of ∼40 ps as recorded at several emission wavelengths such as 400–440, 460 and 750 nm using a dilute water suspension of coffee creamer. A 4.0-ps channel time was chosen and data acquisition at each wavelength took 1 hours to accumulate as many counts as possible. The relative polarization between the fluorescence emission and the linearly polarized laser excitation was set to the magic angle (54.7°) using an emission polarizer. This would enable us to eliminate potential contribution from molecular rotation dynamics to the measured time-resolved data.
Computational methods
 | ||
| Fig. 2 Starting E-conformers for the MECI searches are shown. | ||
At each MECI, the branching plane54 was scanned and critical points with respect to the branching plane angle (θ) between the derivative coupling and difference grient vectors were found. MECI geometries were perturbed in the direction of the branching plane S0 minima and subsequently optimized on the ground state surface to find photoproducts. To generate the internal conversion potential energy surface (PES), the reactant E-conformers were connected to the MECI using DE-GSM on the S1 surface, while the photoproducts were connected to the MECI on the S0 surface. Prior to DE-GSM on the S1 surface, the Franck–Condon E-conformers were optimized on the S1 surface leading to local minimum E-conformers. The underlying electronic structure method to obtain energies and gradients for GSM are described next.
N nitrogelone pair of 2PyMIG·HBr were included in the active space. Natural transition orbital (NTO) analysis of TD-DFT excited states indicated that the Br− p orbitals play a small role in the low-lying valence excitations (see ESI‡), with a charge difference between the ground state and excited state of less than 0.01. These Br− p orbitals are therefore left out of the active space. The resultant (14,13) active space includes the pyridine and guanidine π-systems and the CN nitrogen lone pair. CASSCF of this active space near the MECI leads to an orbital rotation of the hydrazone N–N σ and σ* orbitals into the active space, displacing a pair of π–π* orbitals on the guanidinium moiety. This new, rotated active space resulted in stable SCF throughout the reaction path, and was used in this study. Thus, the S0 and S1 surfaces were analyzed at the SA2-CAS(14,13)SCF/6-31G* level of theory.57–64 The active space natural orbitals and occupations of the S0 state at the MECI1 geometry are depicted in Fig. 3.
 | ||
| Fig. 3 State-averaged natural orbitals (isovalue 0.05 a.u.) and occupations at MECI1 calculated at the SA2-CAS(14,13)SCF/6-31G* level of theory. | ||
Results and discussion
X-ray crystal structure analysis of 2PyMIG·HBr
E-2PyMIG·HBr forms a cross-linked crystal structure stabilized by hydrogen bonding and cation–π interactions to form tightly packed sheets (Fig. 4A). The 2PyMIG monoprotonated cation is planar, with a dihedral angle of 168.3° between carbon atoms on the ring and the C–N+ bond. A second PyMIG molecule is involved in a cation–π interaction with a neighboring cation; the pyridine moiety is positioned above the central guanidinium moiety of a neighboring PyMIG with a distance from the ring centroid to the guanidine carbon atom of 3.40 Å. This interaction is propagated down the bc plane to form sheets. These sheets are held together through N–H⋯N hydrogen bonding interactions between PyMIG cations in neighboring sheets with contact distances of 2.05 Å. The bromide anion resides between the PyMIG sheets and participates in 5 hydrogen bonds from 4 different PyMIG cations (Fig. 4B). | ||
| Fig. 4 The crystal structure of 2PyMIG·HBr highlighting (A) the π-stacking motif of 2PyMIG cations and (B) the hydrogen bonding to the bromide anion (black dashed lines) and intermolecular hydrogen bonding between 2PyMIG cations (red dashed lines). Blue spheres are nitrogen atoms, black spheres are carbon atoms, and white spheres are hydrogen atoms. | ||
Photoisomerization, thermodynamic, and kinetic behavior
A solution of 10 mM 2PyMIG·HBr in DMSO was photoirradiated with an unfiltered Hg vapor lamp for up to 6 h and 1H NMR spectroscopy confirmed the photoconversion from the E to Z form. The spectrum of 2PyMIG·HBr (Fig. S3, ESI‡) consists of 7 peaks; specifically, four resonances at δ = 8.62, 8.28 ppm as doublets and 7.90 and 7.45 ppm as triplets corresponding to pyridine protons, a broad singlet at 8.69 ppm corresponding to the guanidinium protons (NH2), a sharp singlet at 8.18 ppm from the imine proton (–NCH), and lastly, the most downfield resonance at 12.04 ppm is assigned to the guanidine –N–H protons.67 After UV irradiation, the photoconverted Z isomer gives rise to 6 unique resonances different from those of the E form. Resonances corresponding to pyridine proton doublet signals at 7.82 and 8.74 ppm and the triplet signals at 7.61 and 8.13 ppm shift slightly from the E form (Δ = ∼±0.025 ppm) due to changes in the local environment. The sharp singlet corresponding to the imine proton shifts upfield to 7.73 ppm after photoisomerization, while the guanidine N–H proton resonance shifts downfield from 12.04 ppm in the E form to 14.51 ppm after photoirradiation to the Z form. This significant downfield shift is attributed to the intramolecular hydrogen bonding between the guanidine N–H proton and the pyridine N atom, consistent with the presence of intramolecular hydrogen bonding in hydrazone photoswitches.67
Irradiation of freshly prepared samples in DMSO-d6 causes a progressive disappearance of the E isomer with a concomitant set of signals from the Z isomer growing in until a photostationary state (PSS) is reached after 2 h. The freshly prepared E isomer, containing an initial amount of 2.5 ± 2.3% Z isomer, reaches 72.1 ± 2.2% photoconversion to the Z isomer within 2 h of UV irradiation (Fig. 5). Both photoirradiated and freshly prepared (nonirradiated) solutions thermally approach a common equilibrium of 21.4 ± 1.1% Z isomer (Fig. 6), corresponding to a +0.39 kcal mol−1 difference in the free energy between the E and Z isomers. The thermal equilibrium between the isomers is reached within 10 d at 24 °C, following a second-order reaction, which will be discussed below. Similar hydrazone systems often display first-order kinetics;10 however, the thermal relaxation is better fit through a second-order process (Fig. S10, ESI‡). It should be noted that the photoisomerization and thermal relaxation behavior of the 2PyMIG chloride salt (Fig. S4, ESI‡) is identical to that of the bromide salt; however, the bromide salt was chosen due to less orbital mixing in initial TDDFT simulations and will be used for analyses moving forward.
 | ||
| Fig. 5 Conversion of 10.04 mM 2PyMIG·HBr from the open E form to the closed Z photoisomer over the course of 6 h under UV irradiation in DMSO-d6. Dotted lines are for visual aid. | ||
 | ||
| Fig. 6 Thermal relaxation of 10.04 mM 2PyMIG·HBr in DMSO-d6 after UV irradiation (red), and of the non-irradiated E isomer (blue), converging at a thermal equilibrium. Dotted lines are for visual aid. Inset is the second order relaxation after photoirradiation at 24 °C. | ||
Theoretical calculations were performed to obtain information on the relative stability of different conformers and photoisomers (Fig. 7). In the absence of a counterion, the Z form is 1.5 kcal mol−1 more stable than the E form, but the relative stability of these two photoisomers is reversed in the presence of chloride or bromide. The predicted free energy difference of 0.4 kcal mol−1 is in excellent agreement with the experimental value, as determined by 1H NMR (Fig. S3, ESI‡) and consistent with what is observed in the solid state from single crystal diffraction measurements (Fig. 4). These results emphasize much stronger anion hydrogen bonding ability of the E form containing a more acidic imine moiety. The relatively minimal change between the two ring conformations in the E form, 0 and 0.49 kcal mol−1, can explain the slight broadening of the doublet protons in the 1H NMR, because of the change in the local environment around the protons. Furthermore, the lowest relative energy in the E form has the nitrogen atom on the ring pointing down and the charge balancing halide residing near the guanidinium dual N–H binding motif, matching what is observed in the crystal structure. Interestingly, the other dual N–H binding site involving two unsubstituted guanidinium HN–H protons is significantly higher in energy than the guanidine site. After conversion to the Z form, the pyridine ring nitrogen atom now points towards the guanidine hydrogen atom, resulting in intramolecular hydrogen bonding. This is observed in 1H NMR as the chemical shift of the N–H proton at 12.04 ppm in the E form undergoes a large downfield shift to 14.51 ppm, consistent with intramolecular hydrogen bonding.67 Lastly, this Z isomer is only slightly higher in energy than the most stable E form, and now the charge-balancing halide can no longer reside in the closed off binding pocket without a significant energy penalty, and migrates to the open guanidinium binding site.
 | ||
| Fig. 7 Relative free energies of the local minima of 2PyMIGH+ and 2PyMIG·HCl(Br) at the DLPNO-CCSD(T)/aug-cc-pVTZ//M06-2X/def2TZVPP level, with solvent corrections included using the SMD solvation model for DMSO. Intramolecular hydrogen bonding and anion binding are noted as short and long dashed lines, respectively. | ||
The thermal Z-to-E reversion process of the H-bonded Z-isomer was further investigated using 1H NMR spectroscopy. Relaxation rates over the range of temperatures, 297–323 K in DMSO-d6 were obtained and presented in Fig. S7 (ESI‡). These data were applied in calculating the activation enthalpy (ΔH‡), activation entropy (ΔS‡), and activation energy (Ea) using the Arrhenius and Eyring equations (Table 1, Fig. S8 and S9, ESI‡). The enthalpy value (20.74 ± 0.78 kcal mol−1) and the activation energy (21.35 ± 0.75 kcal mol−1) of the reversion of Z-2PyMIG are comparable to a similar photoswitch, benzoylpyridine hydrazone in DMSO, with values of 24.54 ± 0.23 kcal mol−1 and 25.19 ± 0.33 kcal mol−1, respectively.25,26 Similarly, it follows the behavior reported by Aprahamian and coworkers of having higher Ea and ΔH‡ values than hydrazones in nonpolar media such as toluene. This is attributed to the DMSO solvent assistance through hydrogen bonding to 2PyMIG.10,68 In the Z form, the intramolecular H bond from the guanidine to the pyridine nitrogen atom must be broken first in order for the isomerization to proceed, resulting in the positive enthalpy value observed. The positive entropy value for the Z-2PyMIG isomerization process indicates that reorganization of solvent is involved during the Z-to-E isomerization process.68
| k (M−1 s−1) | t 1/2 (d) | E a (kcal mol−1) | ΔH‡![[thin space (1/6-em)]](https://www.rsc.org/images/entities/char_2009.gif) d (kcal mol−1) d (kcal mol−1) |
ΔS‡d (cal mol−1 K−1) |
ΔG‡d (kcal mol−1) |
|---|---|---|---|---|---|
| a Z-to-E relaxation rate constant determined by non-linear fitting of experimental data. b Thermal stability (as half-life) of the less stable Z isomer calculated from the experimentally determined k value. c Activation barrier calculated using the Arrhenius equation. d Thermodynamic activation parameters were calculated using the Eyring equation. | |||||
| 0.0802 | 8.64 ± 0.57 | 21.35 ± 0.72 | 20.74 ± 0.78 | 6.18 ± 0.25 | 18.89 ± 0.78 |
Steady-state and time-resolved optical spectroscopy
The UV-vis spectrum of the freshly prepared E isomer at ca. 40 μM in DMSO (Fig. 8) contains predominantly π–π* transitions. All visible absorption bands present in Fig. 8 correspond to the π–π* transition of molecular orbitals that are delocalized over the conjugated planar PyMIG system involving pyridine and iminoguanidinium.69 The n–π* transition is also present in this spectral region, but with a very small intensity (dark state). The change in the absorption maximum of the E form (297 nm) relative to that of the Z form (305 nm) is relatively small, only 8 nm. The magnitude of this change is not uncommon if the planarity of a ligand is preserved,13 but can be problematic when attempting to selectively excite a specific isomer using ultrafast optical spectroscopy. The emission maximum of the E form is 413 nm, revealing a 3.00 eV gap between the excited and ground state. The EOM-CC-PCM method overestimates this energy gap by ∼1.5 eV (Table S1, ESI‡), which is not unexpected70 because of the approximate treatment of the solvent effects using the implicit model for polar molecules and ionic solutes. Interestingly, using a more approximate level of theory, CAM-B3LYP-PCM/def2TZVP,71 reduces the discrepancy for the computed energy gap between the optimized geometry on the S1 surface and the corresponding S0 energy compared to the experimental emission energy to less than 0.5 eV. | ||
| Fig. 8 UV-visible absorbance spectra of E-2PyMIG·HBr (black), Z-2PyMIG·HBr (blue), and the emission of E-2PyMIG·HBr at (λex = 315 nm, red). To avoid reabsorption, the emission spectrum acquisition started from 350 nm. | ||
Fig. 9 summarizes the time-resolved fluorescence data measured at different wavelengths. We first notice that all the kinetics acquired at longer wavelengths, 480, 500, 520, 540 and 560 nm, exhibit an initial fast decay component with clear difference in its relative amplitude with respect to the corresponding long-lived portion of the kinetics. While the kinetics at the shorter wavelengths, 420, 440, and 460 nm, initiate with a noticeable initial decay component as well, they are followed by a dominant rise component along with a subsequent slower decay. The rise component becomes significantly pronounced with decreasing wavelength as can be clearly seen in Fig. 9.
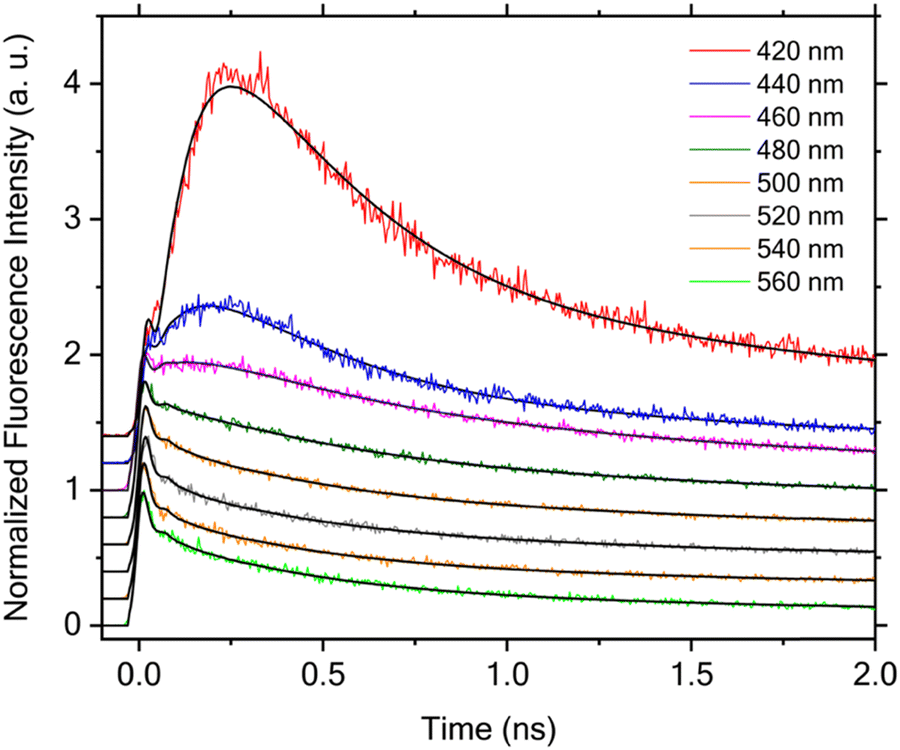 | ||
| Fig. 9 Time-resolved fluorescence kinetics measured at different emission wavelengths upon excitation with laser pulses centered at 356 nm. The peak intensities are scaled to 1.0 for all data except those measured at 420 and 440 nm, where the scaling was made for the initial shoulder close to time zero. The kinetics are vertically offset for clarity and the solid black lines are the corresponding fits obtained through global lifetime analysis. | ||
Quantitative analysis of the time-resolved fluorescence data was performed using global lifetime analysis, which treats the entire data set acquired at different wavelengths using a least squares deconvolution fitting algorithm with explicit consideration of the finite instrument response function. Specifically, a sum of exponential components with corresponding amplitudes was employed as the model function for this analysis. The lifetimes were treated as global parameters and a single set of their values that could best describe all the data was sought during the fitting, whereas all the amplitudes were taken as independent, local variables. Fluorescence emission spectra collected on the isolated 2PyMIG neutral form after irradiation with 365 nm light produces negligible fluorescence emission compared to that of the protonated form. This observation substantiates the claim that the time-resolved fluorescence data can be safely attributed to the protonated form. For the data shown in Fig. 9, we found that a model function consisting of four exponential components is needed for satisfactory fitting, and the resulting lifetimes are 70 ± 11 ps, 240 ± 18 ps, 1.38 ± 0.06 ns, and 5.50 ± 0.14 ns, respectively. Note that the error ranges for the lifetimes reported in this work represent the upper and lower bounds of fitting results returned by the deconvolution data analysis. The global lifetime analysis further enables us to obtain the decay-associated spectra (DAS), a plot of the resulting amplitudes weighted by the corresponding steady-state emission intensities as a function of the emission wavelength. As shown in Fig. 10, the amplitudes associated with the shortest lifetime component (70 ± 11 ps) are negative at wavelength <470 nm, whereas they become positive at longer wavelength. The negative- and positive-signed component corresponds to, respectively, the initial rise and decay components as shown in Fig. 9. Such a DAS is a typical characteristic for the presence of electronic excitation transport including energy and electron transfer processes between distinct molecular species,72,73 as well as for the occurrence of photoinduced structural changes.74 Here, we can confidently assign this initial rise and decay component to E → Z photoisomerization at the excited state potential energy surface based on the following consideration. As we excite the E isomer in our time-resolved fluorescence measurements, the resulting photoisomerization will lead to a time-resolved fluorescence decay in the spectral region with dominant emission from the E isomer, along with a corresponding rise in the dominant emission region of the Z isomer. This expected correspondence between the observed initial rise/decay component at different wavelengths and the spectrally distinct contributions from the E and Z isomers in the steady-state fluorescence spectra was indeed observed recently for 2PyDIG (See Fig. 1 for the corresponding structural change). Following the photoisomerization process, the subsequent electronic excited-state relaxation can be described by three DAS with positive amplitudes at all detection wavelengths. Based on the three different DAS shown in Fig. 10, we further found that the relaxation timescales exhibit weak but noticeable wavelength dependence owing to possibly either presence of additional isomer(s) or/and complex electronic structure of the Z isomer. This appears more pronounced for the 240 ± 18 ps component with a significantly greater amplitude at shorter wavelengths such as 420 and 440 nm.
 | ||
| Fig. 10 Decay associated spectra obtained for the time-resolved fluorescence kinetics measured at different emission wavelengths upon an excitation using laser pulses centered at 356 nm. The solid lines are guides to the eye. | ||
The global lifetime analysis described above treats the initial, very rapid decay component as an instantaneous response instead of resolving its actual lifetime. This simplified analysis approach was chosen because of the complicated temporal behavior of the data owing to the presence of apparent rise component at short emission wavelengths at 420, 440 and 460 nm, which prevents a satisfactory fitting over the entire time window of interest. However, this initial fast decay component is essential to understand the overall electronic excited-state dynamics and its associated photoisomerization process, and thus must be explicitly considered. The existence of such an initial fast decay component can be clearly seen by comparing the early time decay with the IRF as shown in Fig. 11. As the global lifetime analysis described above failed to resolve the lifetime of this very rapid decay component, we instead performed the deconvolution fitting individually for each time-resolved fluorescence decay that exhibits no clear rise behavior. Here we again employed a model function consisting of four exponential components for satisfactory fitting. Our analysis for the data acquired at 480, 500, 520, 540, and 560 nm shows that their satisfactory description is only possible with inclusion of a fast initial decay component with a lifetime of 14 ± 2, 17 ± 2, 16 ± 2, 13 ± 2 and 14 ± 2 ps, respectively. This component predominates the overall decay kinetics with its corresponding relative amplitude of 78%, 80%, 84%, 88% and 85% at these emission wavelengths, respectively. The presence of this fast decay component with such a predominant relative amplitude and its competition with those dynamical processes with slower timescales immediately explains why the fluorescence emission signal is so weak. This agrees with the experimentally obtained fluorescence quantum yield of 8.7 ± 1.1%. As no rise component with a comparable lifetime is observed in the time-resolved fluorescence kinetics measured at the shorter wavelengths, 420, 440, and 460 nm, we can exclude occurrence of the E* → Z* photoisomerization in this short timescale. Consequently, our results further suggest a limited quantum efficiency of this photoswitchable molecule for the primary photoisomerization reaction taking place in the electronic excited state. Taking the average of these lifetimes as 15 ps for this fast decay component and 70 ps for the primary (adiabatic) photoisomerization process, we can approximately estimate the upper bound of the quantum efficiency of this photoswitch being on the order of 15/70 ≈ 21% or less for the primary photochemical reaction.
 | ||
| Fig. 11 Early time portions of the time-resolved fluorescence decays acquired at 480 (a) and 540 nm (b), their corresponding deconvolution fits (solid lines) and the IRF (dash lines). The peak intensities of all these data are scaled to 1.0 for ease of comparison. | ||
It is interesting to compare the key findings of our time-resolved spectroscopic measurements on 2PyMIG with those of the analogous photoswitchable molecule involving two pyridine moieties (2PyDIG; Fig. 1). We first notice that the average lifetime for the fast decay component decreases from ∼15 ps to ∼7 ps with the addition of a second pyridine moiety. Furthermore, the timescale for the corresponding photoisomerization process increases from 70 ps to 94 ps for the photoinduced structural changes involving one and two rotations around the imine bond in iminoguanidinium groups, respectively. The increased timescale in the latter case further suggests that the photoisomerization takes place likely in a sequential instead of simultaneous manner.
Mechanism of photoisomerization from ab initio simulations
Ab initio simulations were employed in order to explain the experimentally observed fast nonradiative relaxation as well as the observed photoproducts. To do so, possible pathways from E1 and E2 (Fig. 2) to the observed photoproducts were specifically investigated. To ensure the excited-state reaction path targets the π–π* excited state, the natural orbitals (NOs) of the CASSCF simulation (see Computational Details) were examined. Fig. 12 shows the Frontier NOs (HONO − 1–LUNO + 1) of the S0 and S1 states for E1 and E2 isomers. These orbitals possess π symmetry and account for ∼1 excited electron in the S1 state. This is consistent with TD-DFT analysis (see Fig. S11 and S12, ESI‡), which produces a qualitatively matching bright states compared to CASSCF. The π* orbitals of these states for both E isomers feature a nodal plane between the hydrazone CN bond, leading to a weakening of the double bond, which ultimately facilitates bond rotation. This provides additional confidence that the appropriate excited state was targeted with CASSCF. Furthermore, the EOM-CCSD calculations for the PCM solvent model using the PTED scheme were employed to justify the inclusion of the π orbitals in the active space of CASSCF. The results shown in Table S1 (ESI‡) indicate that the π–π* excited states are consistently lower in energy than the n–π* excited states, for both the Franck–Condon and the S1 minimum geometries.
 | ||
| Fig. 12 Frontier natural orbitals (isosurface 0.02 a.u.) of the E1 (left) and E2 (right) isomers and their occupations calculated from SA-CASSCF(14,13)/6-31G* are shown for the S0 and S1 surfaces. | ||
From the Franck–Condon geometries, one minimum energy conical intersection (MECI) between the S0 and S1 states was found for each E isomer using the SE-GSM method. As shown in Fig. 13, the reaction paths proceed through S1 local minima before traversing small barers of 4.25 kcal mol−1 and 6.50 kcal mol−1 for E1 and E2, respectively. The MECIs are each energetically downhill from their respective Franck–Condon geometries on the S1 surface (−39.9 and −39.4 kcal mol−1 downhill from E1 and E2, respectively). The MECIs have geometries which are intermediate between their respective E and Z isomers, with CN imine dihedral angles close to 90°. (Fig. 14). MECI1 has a dihedral angle about the imine CN double bond of 89.3°, while MECI2 has a dihedral angle of 92.5°. MECI1 additionally has an intramolecular hydrogen bond between the pyridine nitrogen and a guanidinium hydrogen with a distance of 2.825 Å, which is not present in MECI2. The H-bond has a noticeable effect on the geometry of MECI1, causing the guanidinium to rotate toward the pyridine. In MECI2, the guanidinium is rotated in the opposite direction due to the steric repulsion of the pyridine C–H.
 | ||
| Fig. 13 The reaction paths of the E1 (left) and E2 (right) conformers of 2PyMIG·HBr are shown starting from the Franck–Condon geometry. The reaction proceeds downward in energy to the S1 minimum, then over a transition state and diverges to the possible photoproducts at the MECI. Dotted lines show the projection of the reaction to path onto the CCNN and CNNC dihedrals. Dihedral angles are identified in the insets. Transition state nodes are labeled as TS with the barrier from the S1 minimum reported in eV. All energy values in the plots are given relative to the S1 minima. | ||
 | ||
| Fig. 14 Geometries for MECI1 and MECI2 (top) are depicted along with the geometries corresponding to S0 minima along the branching plane (step size = 0.4 a.u.) visualized in transparent pink (to E) and transparent green (to Z). The angle (θ) between the derivative coupling and difference gradient vectors of the branching plane (bottom) at MECI1 and MECI2 are shown with a step size of 0.2 a.u. The branching plane directions corresponding to the S0 minima are shown and labeled with their respective photoproducts. | ||
At conical intersections, there are two degrees of freedom, the difference gradient and derivative coupling vectors, that can lift the degeneracy of the two electronic states. The span of these two vectors is called the branching plane, and these are depicted for MECI1 and MECI2 in Fig. 14, where the S0 and S1 energies are plotted against the angle (θ) between the two vectors. The reaction profiles for MECI1 and MECI2 are bifurcating, as evidenced by the presence of two minima on the S0 surfaces in the two branching planes. Since the S0 and S1 surfaces of the branching planes do not cross the MECI energy, the MECIs are peaked intersections.75 The branching plane at MECI1 is clearly coupled to rotation of the imine CN bond, however, the branching plane at MECI2 is more directly coupled to stretching of the CN bond. While less obvious, the stretching coordinate of the branching plane of MECI2 is related to the E–Z isomerization as rotation of a double bond necessitates some degree of bond elongation.
The branching planes at the MECIs can be used to predict the possible photoproducts by following the critical branching plane structures down to the S0 minima. The 3D visualizations of the MECIs in Fig. 14 also display the structures at the minima of their respective branching planes in transparent pink and green. From these structures, the most preferred (in terms of relative energy) motions within branching plane involve the E → Z isomerization of interest as well as E → E internal conversion back to the starting geometry. Z1 has a planar geometry and contains an intramolecular hydrogen bond between the guanidinium moiety and the pyridine nitrogen. The Z1 intramolecular hydrogen bond, however, involves a different N–H bond of the guanidinium than observed in MECI1. On the other hand, Z2 is not planar due to the steric interaction of the pyridine hydrogen and the guanidinium. This leads Z1 to be more stable than Z2 by 4.5 kcal mol−1 at the ω. B97X-D/def2-TZVPP (PCM = DMSO) level of theory.
To model internal conversion, the reaction path was optimized on the S1 surface from the Franck–Condon E isomer to the MECI and on the S0 surface from the MECI to the photoproduct, shown as solid red and blue/green lines in Fig. 13, respectively. Contrary to the naïve expectation that the reaction path would primarily involve rotation around the CC–NN bond, it also exhibits significant changes around the CN–NC dihedral angle, which is a dominant reaction coordinate in the transition from the S1 minimum to the TS and around the MECI. Small barriers of 4.25 kcal mol−1 and 6.50 kcal mol−1 for E1 and E2, respectively, are indicative of a viable pathway for the nonradiative transition through conical intersection, explaining low fluorescence quantum yield of 8.7% and a fast initial decay component in the time-resolved fluorescence emission spectra. Furthermore, it is possible that the excited E1 and E2 do not fully relax to their S1 minima before climbing their transition states, thus allowing for faster excited state decay times than a 4.25 or 6.50 kcal mol−1 barrier would permit.
The reaction paths of Fig. 13 involve E and Z isomers of 2PyMIG·HBr that are relevant to the experimental photoisomerization process. However, a MECI directly connecting the lowest energy E isomer, E2, to the lowest energy Z isomer, Z1 was not found. The ground state reaction barrier from Z2 to Z1 was found to be only 0.8 kcal mol−1, which is readily accessible at the experimental conditions considered. Despite the lack of a connecting MECI, an accessible pathway from E2 to Z1 exists in the ground state.
Conclusions
The current investigation of 2PyMIG provides mechanistic insight into its photoisomerization pathway. The E-to-Z photoisomerization process occurs on the picosecond timescale and is dominated by a fast initial decay component that dominates slower timescale processes leading to poor fluorescence emission and quantum yields. TD-DFT, EOM-CCSD-PTED, and CASSCF calculations indicate the π–π* state to be the relevant excited state. The multiconfigurational reaction path found with GSM features a small barrier for the decay of the E isomer in the π–π* state to the MECI connecting the E and Z isomers of 2PyMIG. While two possible pathways exist depending on orientation of the pyridine ring, both exhibit the same qualitative features along the path and at their MECIs, involving concurrent changes in the CCNN and CNNC dihedral angles. Furthermore, the ground state barrier for pyridine ring rotation is readily accessible, thus a low barrier pathway to the experimentally observed Z isomer exists for both MECIs. Despite the shortcomings of CASSCF, its use combined with the growing string method provided instrumental insights to the photoisomerization process of 2PyMIG, with key findings further validated by the experimentally observed small fluorescence yield and short excited state lifetime. Overall, the computational and experimental insights show good consistency, both pointing to rapid photoisomerization of 2PyMIG via internal conversion through conical intersections.Data availability
The data supporting this article have been included as part of the ESI.‡ CCDC 2160087 contains the supplementary crystallographic data for this paper.Conflicts of interest
The authors declare no competing financial interest.Acknowledgements
This work was supported by the U.S. Department of Energy, Office of Science, Basic Energy Sciences, Chemical Sciences, Geosciences, and Biosciences Division. The manuscript was produced by UT-Battelle, LLC under Contract No. DE-AC05-00OR22725 with the U.S. Department of Energy. D.-K. D. and P. M. Z. are additionally supported by NSF CHE-1551994 and NSF 2246764. D.-K. D. also acknowledges the National Science Foundation for providing a Graduate Research Fellowship under grant number DGE 1841052. This research used resources of the Compute and Data Environment for Science (CADES) at the Oak Ridge National Laboratory, which is supported by the Office of Science of the U.S. Department of Energy under Contract No. DE-AC05-00OR22725 and the National Energy Research Scientific Computing Center (NERSC), a Department of Energy Office of Science User Facility using NERSC award BES-ERCAP0020739. The publisher acknowledges the U.S. Government license to provide public access under the DOE Public Access Plan (https://energy.gov/downloads/doe-public-access-plan).References
- W. A. Velema, W. Szymanski and B. L. Feringa, J. Am. Chem. Soc., 2014, 136, 2178–2191 CrossRef CAS PubMed.
- S. Kassem, T. van Leeuwen, A. S. Lubbe, M. R. Wilson, B. L. Feringa and D. A. Leigh, Chem. Soc. Rev., 2017, 46, 2592–2621 RSC.
- T. Muraoka, K. Kinbara and T. Aida, Nature, 2006, 440, 512–515 CrossRef CAS PubMed.
- K. Bujak, K. Nocoń, A. Jankowski, A. Wolińska-Grabczyk, E. Schab-Balcerzak, H. Janeczek and J. Konieczkowska, Eur. Polym. J., 2019, 118, 186–194 CrossRef CAS.
- M. Baroncini, S. d'Agostino, G. Bergamini, P. Ceroni, A. Comotti, P. Sozzani, I. Bassanetti, F. Grepioni, T. M. Hernandez, S. Silvi, M. Venturi and A. Credi, Nat. Chem., 2015, 7, 634–640 CrossRef CAS.
- F. C. Parks, Y. Liu, S. Debnath, S. R. Stutsman, K. Raghavachari and A. H. Flood, J. Am. Chem. Soc., 2018, 140, 17711–17723 CrossRef CAS.
- P. Courtot, R. Pichon and J. Le Saint, Tetrahedron Lett., 1976, 17, 1181–1184 CrossRef.
- R. Pichon, J. Le Saint and P. Courtot, Tetrahedron, 1981, 37, 1517–1524 CrossRef CAS.
- M. N. Chaur, D. Collado and J.-M. Lehn, Chem. – Eur. J., 2011, 17, 248–258 CrossRef CAS.
- H. Qian, S. Pramanik and I. Aprahamian, J. Am. Chem. Soc., 2017, 139, 9140–9143 CrossRef PubMed.
- L. Greb, A. Eichhöfer and J.-M. Lehn, Eur. J. Org. Chem., 2016, 1243–1246 CrossRef.
- J.-M. Lehn, Supramolecular Chemistry, 1995, pp. 11–30 DOI:10.1002/3527607439.ch2.
- D. J. van Dijken, P. Kovaříček, S. P. Ihrig and S. Hecht, J. Am. Chem. Soc., 2015, 137, 14982–14991 CrossRef PubMed.
- J. Moreno, M. Gerecke, A. L. Dobryakov, I. N. Ioffe, A. A. Granovsky, D. Bléger, S. Hecht and S. A. Kovalenko, J. Phys. Chem. B, 2015, 119, 12281–12288 CrossRef PubMed.
- X. Guo, B. Shao, S. Zhou, I. Aprahamian and Z. Chen, Chem. Sci., 2020, 11, 3016–3021 RSC.
- L. A. Tatum, X. Su and I. Aprahamian, Acc. Chem. Res., 2014, 47, 2141–2149 CrossRef PubMed.
- A. A. Beharry, O. Sadovski and G. A. Woolley, J. Am. Chem. Soc., 2011, 133, 19684–19687 CrossRef PubMed.
- C. García-Iriepa, M. Marazzi, L. M. Frutos and D. Sampedro, RSC Adv., 2013, 3, 6241–6266 RSC.
- R. Siewertsen, H. Neumann, B. Buchheim-Stehn, R. Herges, C. Näther, F. Renth and F. Temps, J. Am. Chem. Soc., 2009, 131, 15594–15595 CrossRef CAS.
- J. Griffiths, Chem. Soc. Rev., 1972, 1, 481–493 RSC.
- D. Tang, L. Shen and W.-H. Fang, Phys. Chem. Chem. Phys., 2021, 23, 13951–13964 RSC.
- J. Bao and P. M. Weber, J. Am. Chem. Soc., 2011, 133, 4164–4167 CrossRef CAS.
- A. L. Costa, A. C. Gomes, M. Pillinger, I. S. Gonçalves, J. Pina and J. S. Seixas de Melo, Chem. Phys. Chem., 2017, 18, 564–575 CrossRef CAS.
- M. Moreno, R. Gelabert and J. M. Lluch, Phys. Chem. Chem. Phys., 2019, 21, 16075–16082 RSC.
- B. Mravec, Š. Budzák, M. Medved’, L. F. Pašteka, C. Slavov, T. Saßmannshausen, J. Wachtveitl, J. Kožíšek, L. Hegedüsová, J. Filo and M. Cigáň, J. Org. Chem., 2021, 86, 11633–11646 CrossRef CAS PubMed.
- B. Mravec, J. Filo, K. Csicsai, V. Garaj, M. Kemka, A. Marini, M. Mantero, A. Bianco and M. Cigáň, Phys. Chem. Chem. Phys., 2019, 21, 24749–24757 RSC.
- J. D. Einkauf, V. S. Bryantsev, B. A. Moyer and R. Custelcean, Chem. – Eur. J., 2022, 28(26), e202200719 CrossRef CAS PubMed.
- E. d C. Petronilho, M. d N. Rennó, N. G. Castro, F. M. R. da Silva, A. d C. Pinto and J. D. Figueroa-Villar, J. Enzyme Inhib. Med. Chem., 2016, 31, 1069–1078 CrossRef CAS PubMed.
- W. H. Melhuish, J. Phys. Chem., 1961, 65, 229–235 CrossRef CAS.
- Y.-Z. Ma, H. Lin, M.-H. Du, B. Doughty and B. Ma, J. Phys. Chem. Lett., 2018, 9, 2164–2169 CrossRef CAS PubMed.
- M. J. Frisch, G. W. Trucks, H. B. Schlegel, G. E. Scuseria, M. A. Robb, J. R. Cheeseman, G. Scalmani, V. Barone, G. A. Petersson, H. Nakatsuji, X. Li, M. Caricato, A. V. Marenich, J. Bloino, B. G. Janesko, R. Gomperts, B. Mennucci, H. P. Hratchian, J. V. Ortiz, A. F. Izmaylov, J. L. Sonnenberg, D. Williams-Young, F. Ding, F. Lipparini, F. Egidi, J. Goings, B. Peng, A. Petrone, T. Henderson, D. Ranasinghe, V. G. Zakrzewski, J. Gao, N. Rega, G. Zheng, W. Liang, M. Hada, M. Ehara, K. Toyota, R. Fukuda, J. Hasegawa, M. Ishida, T. Nakajima, Y. Honda, O. Kitao, H. Nakai, T. Vreven, K. Throssell, J. A. Montgomery Jr., J. E. Peralta, F. Ogliaro, M. J. Bearpark, J. J. Heyd, E. N. Brothers, K. N. Kudin, V. N. Staroverov, T. A. Keith, R. Kobayashi, J. Normand, K. Raghavachari, A. P. Rendell, J. C. Burant, S. S. Iyengar, J. Tomasi, M. Cossi, J. M. Millam, M. Klene, C. Adamo, R. Cammi, J. W. Ochterski, R. L. Martin, K. Morokuma, O. Farkas, J. B. Foresman and D. J. Fox, Gaussian 16 Rev. A.03, 2009.
- W. B. Schneider, G. Bistoni, M. Sparta, M. Saitow, C. Riplinger, A. A. Auer and F. Neese, J. Chem. Theory Comput., 2016, 12, 4778–4792 CrossRef CAS.
- F. Neese, WIREs Comput. Mol. Sci., 2012, 2, 73–78 CrossRef CAS.
- F. Neese, WIREs Comput. Mol. Sci., 2018, 8, e1327 CrossRef.
- A. S. Ivanov and V. S. Bryantsev, Eur. J. Inorg. Chem., 2016, 3474–3479 CrossRef CAS.
- A. V. Marenich, C. J. Cramer and D. G. Truhlar, J. Phys. Chem. B, 2009, 113, 6378–6396 CrossRef CAS.
- A. V. Marenich, C. J. Cramer and D. G. Truhlar, J. Phys. Chem. B, 2009, 113, 4538–4543 CrossRef CAS.
- M. E. Casida, Recent Advances in Density Functional Methods, World Scientific, 1995, vol. 1, pp. 155–192 Search PubMed.
- E. K. U. Gross, J. F. Dobson and M. Petersilka, Density Functional Theory of Time-Dependent Phenomena, Springer BerlinHeidelberg, Berlin, Heidelberg, 1996, pp. 81–172 Search PubMed.
- M. A. L. Marques and E. K. U. Gross, Annu. Rev. Phys. Chem., 2004, 55, 427–455 CrossRef CAS.
- M. Petersilka, U. J. Gossmann and E. K. U. Gross, Phys. Rev. Lett., 1996, 76, 1212–1215 CrossRef CAS.
- E. Runge and E. K. U. Gross, Phys. Rev. Lett., 1984, 52, 997–1000 CrossRef CAS.
- A. D. Becke, J. Chem. Phys., 1997, 107, 8554–8560 CrossRef CAS.
- S. Grimme, J. Comput. Chem., 2006, 27, 1787–1799 CrossRef CAS PubMed.
- J.-D. Chai and M. Head-Gordon, Phys. Chem. Chem. Phys., 2008, 10, 6615–6620 RSC.
- Q. Wu and W. Yang, J. Chem. Phys., 2001, 116, 515–524 CrossRef.
- S. Miertuš, E. Scrocco and J. Tomasi, Chem. Phys., 1981, 55, 117–129 CrossRef.
- S. Miertu
![[s with combining tilde]](https://www.rsc.org/images/entities/char_0073_0303.gif) and J. Tomasi, Chem. Phys., 1982, 65, 239–245 CrossRef.
and J. Tomasi, Chem. Phys., 1982, 65, 239–245 CrossRef. - J. L. Pascual-ahuir, E. Silla and I. Tuñon, J. Comput. Chem., 1994, 15, 1127–1138 CrossRef CAS.
- P. M. Zimmerman, J. Chem. Phys., 2013, 138, 184102 CrossRef.
- P. M. Zimmerman, J. Comput. Chem., 2015, 36, 601–611 CrossRef CAS PubMed.
- C. Aldaz, https://github.com/ZimmermanGroup/pyGSM.
- B. G. Levine, J. D. Coe and T. J. Martínez, J. Phys. Chem. B, 2008, 112, 405–413 CrossRef CAS.
- I. F. Galván, M. G. Delcey, T. B. Pedersen, F. Aquilante and R. Lindh, J. Chem. Theory Comput., 2016, 12, 3636–3653 CrossRef PubMed.
- H.-J. Werner, P. J. Knowles, G. Knizia, F. R. Manby and M. Schütz, WIREs Comput. Mol. Sci., 2012, 2, 242–253 CrossRef CAS.
- J. Casellas, M. J. Bearpark and M. Reguero, Chem. Phys. Chem., 2016, 17, 3068–3079 CrossRef CAS PubMed.
- B. O. Roos, P. R. Taylor and P. E. M. Sigbahn, Chem. Phys., 1980, 48, 157–173 CrossRef CAS.
- B. O. Roos, Int. J. Quantum Chem., 1980, 18, 175–189 CrossRef.
- M. W. Schmidt and M. S. Gordon, Annu. Rev. Phys. Chem., 1998, 49, 233–266 CrossRef CAS.
- H. J. Werner and P. J. Knowles, J. Chem. Phys., 1985, 82, 5053–5063 CrossRef CAS.
- R. Ditchfield, W. J. Hehre and J. A. Pople, J. Chem. Phys., 1971, 54, 724–728 CrossRef CAS.
- W. J. Hehre, R. Ditchfield and J. A. Pople, J. Chem. Phys., 1972, 56, 2257–2261 CrossRef CAS.
- P. C. Hariharan and J. A. Pople, Theor. Chim. Acta, 1973, 28, 213–222 CrossRef CAS.
- V. A. Rassolov, M. A. Ratner, J. A. Pople, P. C. Redfern and L. A. Curtiss, J. Comput. Chem., 2001, 22, 976–984 CrossRef CAS.
- R. Cammi, J. Chem. Phys., 2009, 131, 164104 CrossRef CAS PubMed.
- M. Caricato, J. Chem. Theory Comput., 2012, 8, 4494–4502 CrossRef CAS.
- A. Kurutos, F. S. Kamounah, G. M. Dobrikov, M. Pittelkow, S. P. A. Sauer and P. E. Hansen, Magn. Reson. Chem., 2021, 59, 1116–1125 CrossRef CAS.
- S. M. Landge, E. Tkatchouk, D. Benítez, D. A. Lanfranchi, M. Elhabiri, W. A. Goddard and I. Aprahamian, J. Am. Chem. Soc., 2011, 133, 9812–9823 CrossRef CAS PubMed.
- J.-L. Schmitt, A.-M. Stadler, N. Kyritsakas and J.-M. Lehn, Helv. Chim. Acta, 2003, 86, 1598–1624 CrossRef CAS.
- S. Ren, J. Harms and M. Caricato, J. Chem. Theory Comput., 2017, 13, 117–124 CrossRef CAS.
- T. Yanai, D. P. Tew and N. C. Handy, Chem. Phys. Lett., 2004, 393, 51–57 CrossRef CAS.
- J. Pšenčík, Y.-Z. Ma, J. B. Arellano, J. Hála and T. Gillbro, Biophys. J., 2003, 84, 1161–1179 CrossRef.
- A. R. Holzwarth, in Biophysical Techniques in Photosynthesis, eds. J. Amesz and A. J. Hoff, Kluwer Academic Publishers, The Netherlands, 1996, pp. 75–92 Search PubMed.
- Y.-Z. Ma, C. Zhou, B. Doughty, D. C. Easley, J. Deterding and B. Ma, Chem. – Eur. J., 2017, 23, 17734–17739 CrossRef CAS.
- I. F. Galván, M. G. Delcey, T. B. Pedersen, F. Aquilante and R. Lindh, J. Chem. Theory Comput., 2016, 12, 3636–3653 CrossRef.
Footnotes |
| † This manuscript has been authored by UT-Battelle, LLC under Contract No. DE-AC05-00OR22725 with the U.S. Department of Energy. The United States Government retains and the publisher, by accepting the article for publication, acknowledges that the United States Government retains a non-exclusive, paid-up, irrevocable, world-wide license to publish or reproduce the published form of this manuscript, or allow others to do so, for United States Government purposes. The Department of Energy will provide public access to these results of federally sponsored research in accordance with the DOE Public Access Plan (https://energy.gov/downloads/doe-public-access-plan). |
| ‡ Electronic supplementary information (ESI) available. CCDC 2160087. For ESI and crystallographic data in CIF or other electronic format see DOI: https://doi.org/10.1039/d4cp02747g |
| § D.-K. Dang and J. D. Einkauf contributed equally to this work. |
| This journal is © the Owner Societies 2024 |