
 Open Access Article
 This Open Access Article is licensed under a
 Creative Commons Attribution 3.0 Unported Licence
Electronic structure, absorption spectra and oxidation dynamics in polyynes and dicyanopolyynes†
Lazaros
Chalkopiadis
 ,
Konstantinos
Lambropoulos
and
Constantinos
Simserides
*
,
Konstantinos
Lambropoulos
and
Constantinos
Simserides
*
Department of Physics, National and Kapodistrian University of Athens, Panepistimiopolis, Zografos GR-15784, Athens, Greece. E-mail: csimseri@phys.uoa.gr
First published on 29th July 2024
Abstract
The advent of femtosecond to attosecond experimental tools has made now possible to study such ultrafast carrier dynamics, e.g., the spatial and temporal charge density evolution, after an initial oxidation or reduction in molecules, candidates for atomic wires like polyynes and dicyanopolyynes. Here, we study the electronic structure and hole transfer in symmetric molecules containing carbon, nitrogen and hydrogen, the first members in the series of polyynic carbynes and dicyanopolyynes, using methods based on density functional theory (DFT): constrained DFT (CDFT), time-dependent DFT (TDDFT) and real-time TDDFT (RT-TDDFT), with Löwdin population analysis, comparing many levels of theory and obtaining convergence of the results. For the same purposes, we develop a tight binding (TB) variant using all valence orbitals of all atoms. This TB variant is applied here in linear molecules, but it is also adequate for electronic structure, charge transfer and charge transport of non-linear molecules and clusters of molecules. We calculate the electronic structure, the time-dependent dipole moment and the probabilities of finding the hole at each site, their mean over time values, the mean transfer rates from the oxidation site to other sites and the frequency content (using charge as well as dipole moment oscillations). We take into account zero-point motion. The initial conditions for RT-TDDFT are obtained by CDFT. For TB, we explore different initial conditions: we place the hole at a particular orbital or distribute it among a number of orbitals; it is also possible to include phase differences between orbitals. Finally, we compare with available experimental data.
1 Introduction
The 2023 Nobel Prize in Physics1 was awarded to P. Agostini, F. Krausz and A. L'Huillier “for experimental methods that generate attosecond pulses of light for the study of electron dynamics in matter”: overtones were utilized2,3 and pulses of the order of 0.254 to 0.655 femtoseconds were created. This achievement enabled the investigation of extremely rapid processes that were previously impossible to follow. Such light pulses are short enough to enable the study of electrons moving in atoms, molecules, and condensed matter. Attosecond pulses can be produced, observed, measured and used as a new experimental tool: attosecond spectroscopy. It is now possible to produce pulses of the order of tenths of femtoseconds.The application of isolated attosecond pulses to prompt ionization of phenylalanine and the subsequent detection of ultrafast dynamics on a sub-4.5 femtosecond scale, shorter than the vibrational response of the molecule, showed that it is possible to follow carrier dynamics in polyatomic molecules: attosecond science is progressively moving towards investigation of more complex systems.6 A UV laser of λ = 300 nm corresponds to a period of 1 fs, while, a XUV photon of λ = 30 nm corresponds to a period of 0.1 fs. It is therefore possible, employing high harmonic generation (HHG), to break the 1 fs limit. In HHG, usually, a sample like gas, plasma, etc. is illuminated by a laser's pulses, and emits high harmonics of the generation beam (above 5th harmonic). Hence, in this coherent process, HHG can be used to obtain attosecond pulses. A recent discussion on open questions in attochemistry and a comparison with femtochemistry7 is given in ref. 8. Oxidation dynamics can be studied today in a variety of molecules and is experimentally relevant. For example, charge transfer has been recently studied in cyclo[18]carbon,9 DNA dimers10 and in para-functionalized bromobenzene molecules.11 This work is devoted to such extremely fast hole dynamics, i.e., to the spatial and temporal charge density evolution, after an initial oxidation, in molecules candidates for atomic wires: polyynes and dicyanopolyynes.
In 2010 a polyynic chain of 44 atoms was synthesized.12 Later, it became possible to establish a route for the mass production of long and stable chains composed of more than 6000 carbon atoms inside double-walled carbon nanotubes.13 Electrical transport measurements of carbon atom chains were performed in 2013.14 Thermal,15–18 vibrational,19–21 mechanical16,22 and electrical transport14,23–27 properties were studied, too. Structure-modulated charge transfer in carbon atomic wires was claimed in chains with different end groups.28 Based on the experience from DNA charge transfer experiments, it appears that a possible technique for achieving reliable charge transfer measurements is time-resolved spectroscopy;29–35 usually a pulsed laser is used to excite (pump) and measure the absorption (probe) of a sample as a function of time. Temporal resolution in the femtosecond to attosecond regime should be achieved for reliable measurements in atomic wires, as theory predicts phenomena of the order of femtoseconds.9,36
We notice the large persistence length of one-dimensional carbon chains. In 2013, the persistence length, ![[small script l]](https://www.rsc.org/images/entities/char_e146.gif) p, of carbynes at 300 K was roughly estimated at 14 nm or about 110 carbon atoms in a row;37 this is large compared to persistence lengths of important polymers. In 2016 long and stable polyynic chains composed of more than 6000 carbon atoms inside double-walled carbon nanotubes were produced.13 This would mean a persistence length of roughly 1000 nm = 1 μm. Even without this development,13 carbyne is relatively stiff for a polymer, comparable to graphene nanoribbons, 1/3 times as stiff as a double-stranded DNA (dsDNA) rod (it should be taken into account that dsDNA has a diameter of 2 nm, i.e., it is not atom-thick as carbon chains are). In 2024 it was announced38 that stable interlocked polyynes bearing several macrocycles were prepared, including a [5]rotaxane having 34 contiguous alkynes with properties similar to those of carbyne.
p, of carbynes at 300 K was roughly estimated at 14 nm or about 110 carbon atoms in a row;37 this is large compared to persistence lengths of important polymers. In 2016 long and stable polyynic chains composed of more than 6000 carbon atoms inside double-walled carbon nanotubes were produced.13 This would mean a persistence length of roughly 1000 nm = 1 μm. Even without this development,13 carbyne is relatively stiff for a polymer, comparable to graphene nanoribbons, 1/3 times as stiff as a double-stranded DNA (dsDNA) rod (it should be taken into account that dsDNA has a diameter of 2 nm, i.e., it is not atom-thick as carbon chains are). In 2024 it was announced38 that stable interlocked polyynes bearing several macrocycles were prepared, including a [5]rotaxane having 34 contiguous alkynes with properties similar to those of carbyne.
We are also interested in dicyanopolyynes, consisting of an unsaturated linear skeleton of carbon atoms ended by a cyano group at each edge, i.e., N![[triple bond, length as m-dash]](https://www.rsc.org/images/entities/char_e002.gif) C–(CC–)mCN (m = 0, 1, …). The formation of these rod-shaped molecules in carbon plasma, was reported in 1993;39 they form a homologous series of nitrogen-end-capped linear sp carbon chains.40 A theoretical study of the structure and properties of polyynes, monocyano- and dicyanopolyynes was published later,41 followed by semi-empirical calculation of their electronic absorption wavelengths, and predictions regarding long-chain compounds, including an estimation of the absorption wavelength (ca. 400 nm or ca. 3.0 eV) of the hypothetical (infinite) carbon allotrope carbyne.42 The various flavours of energy gap43 could reveal underlying physics, e.g., excitonic effects. Using DFT,36,44 a gap of 0.8 eV was obtained for long chains; this coincides with that obtained by a simple TB wire model with a parametrization extracted via DFT at the same level of theory as explained by the method introduced in ref. 45. The same TB wire model with the empirical Harrison expressions46,47 gives a gap of 0.32 eV. A large range of energy gaps can be found in the literature,24,48,49 depending on the calculation method. Generally, DFT with exchange–correlation functionals that do not include exact exchange tends to significantly underestimate the energy gap; higher level theories, and the employment of hybrid functionals in DFT with adequate percentage of exact exchange can deal with the problem,50 as larger percentages of exact exchange lead to broadening of the energy gap.
C–(CC–)mCN (m = 0, 1, …). The formation of these rod-shaped molecules in carbon plasma, was reported in 1993;39 they form a homologous series of nitrogen-end-capped linear sp carbon chains.40 A theoretical study of the structure and properties of polyynes, monocyano- and dicyanopolyynes was published later,41 followed by semi-empirical calculation of their electronic absorption wavelengths, and predictions regarding long-chain compounds, including an estimation of the absorption wavelength (ca. 400 nm or ca. 3.0 eV) of the hypothetical (infinite) carbon allotrope carbyne.42 The various flavours of energy gap43 could reveal underlying physics, e.g., excitonic effects. Using DFT,36,44 a gap of 0.8 eV was obtained for long chains; this coincides with that obtained by a simple TB wire model with a parametrization extracted via DFT at the same level of theory as explained by the method introduced in ref. 45. The same TB wire model with the empirical Harrison expressions46,47 gives a gap of 0.32 eV. A large range of energy gaps can be found in the literature,24,48,49 depending on the calculation method. Generally, DFT with exchange–correlation functionals that do not include exact exchange tends to significantly underestimate the energy gap; higher level theories, and the employment of hybrid functionals in DFT with adequate percentage of exact exchange can deal with the problem,50 as larger percentages of exact exchange lead to broadening of the energy gap.
In 2004 a mixture of dicyanopolyynes was formed and collected when graphite electrodes were arced in liquid nitrogen.51 Dicyanopolyynes have been recently detected in space. The detection of dicyanopolyynes is hampered by their nonpolar nature; they cannot be observed through their rotational spectra. The presence of NCCN in interstellar and circumstellar clouds can be inferred through observation of chemically related polar molecules, such as protonated cyanogen (NCCNH+)* or the metastable isomer isocyanogen CNCN.52 NCCN and NCCCCN formation in Titan's atmosphere has been suggested.52 Recently, in 2015, protonated cyanogen (NCCNH+)* was detected in the cold dark clouds L483 and TMC-1.53 From the observed abundances of NCCNH+, it was inferred that indeed cyanogen (NCCN) should be as abundant as the nitriles HCN and HC3N. In 2018, isocyanogen (CNCN) was discoverd in interstellar space, giving further evidence that dicyanopolyynes are abundant in space.54 Finally, in 2023, interstellar NC4NH+ was discovered, adding to the bulk of evidence regarding the presence and quantity of dicyanopolyynes in space.55
Carbynes or atomic carbon chains are conceptually divided into cumulenic (equidistant carbon atoms) and polyynic (alternating longer and shorter bonds between consecutive carbon atoms). We will only consider here polyynic chains with even carbon atoms, starting with a short bond between carbons; this results in purely rod-like molecules, cf.Fig. 1. Dicyanopolyynes are also rod-like. In this work, we study hole transfer‡, the temporal and spatial evolution of a hole after its creation, i.e., oxidation dynamics, in the first members in the series of linear polyynic carbynes and dicyanopolyynes, which can be useful as molecular wires. We compare alternative theoretical approaches, based on tight binding (TB) using all valence orbitals, and density functional theory (DFT), both for the time-independent and the time-dependent problem. Recently, we have studied hole oscillations within the C18 carbon ring, including zero-point vibrations with a Monte Carlo (MC) sampling technique, comparing with the static cumulenic and polyynic equilibrium configurations.9 Here, we extend this study to polyynes and dicyanopolyynes.
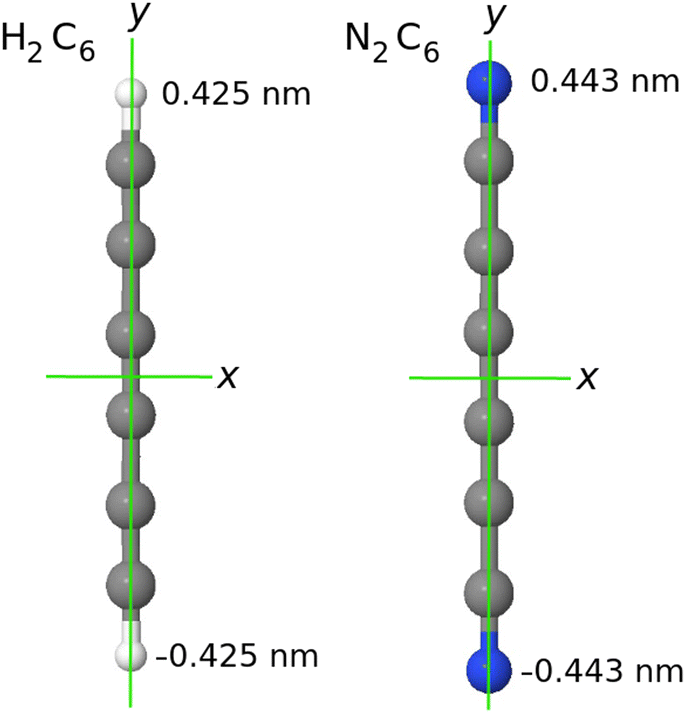 | ||
| Fig. 1 In our system of coordinates the y axis is identified with the D∞ axis. As example: a comparison of the H2C6versus the N2C6 geometry. | ||
Let us call NC, NN, and NH the total number of carbon, nitrogen, and hydrogen atoms in a molecule. In finite carbynes, the end groups can be methine (CH–) or methylene (CH2–) or methyl (CH3–) as explained below. Cumulenes with even (odd) NC have D2h (D2d) symmetry with their methylene (CH2–) groups being coplanar (perpendicular) to each other. Polyynes with odd NC have C3v symmetry; one end group being methine (CH–), the other methyl (CH3–). Polyynes with even NC and two CH3– end groups can be found in eclipsed (D3h) and staggered (D3d) symmetry. Finally, polyyynes with even NC and two CH– end groups have D∞h symmetry. Dicyanopolyynes have always NN = 2, the nitrogen atoms being at the ends of the molecule and possess D∞h symmetry.
This article is organized as follows. In Section 2 we display our theoretical arsenal, concerning TB-related techniques (Subsection 2.1) or DFT-related techniques (Subsection 2.2). In Section 3 we present and discuss our results for polyynes (Subsection 3.1) and dicyanopolyynes (Subsection 3.2). In Section 4 we arrive at conclusions. Finally, we include online ESI.†
2 Theory
2.1 Tight binding (TB)
We describe below a TB approach for the calculation of electronic band structure (time-independent problem) and for carrier evolution (time-dependent problem), where the molecular states are written as combination of atomic valence states of all atoms. | (1) |
| Ĥ|Ψ〉 = E|Ψ〉, | (2) |
| Smjni := 〈ϕmj|ϕni〉 = δnmδij, | (3) |
| Hmjni := 〈ϕmj|Ĥ|ϕni〉, | (4) |
 | (5) |
H![[v with combining right harpoon above (vector)]](https://www.rsc.org/images/entities/i_char_0076_20d1.gif) = E, = E, | (6) |
 | (7) |
| Vss = Vssσ, | (8) |
| Vsx = ξ1Vspσ, | (9) |
| Vxx = ξ12Vppσ + (1 − ξ12)Vppπ, | (10) |
| Vxy = ξ1ξ2(Vppσ − Vppπ), | (11) |
![[d with combining right harpoon above (vector)]](https://www.rsc.org/images/entities/i_char_0064_20d1.gif) = i
= i![[j with combining right harpoon above (vector)]](https://www.rsc.org/images/entities/i_char_006a_20d1.gif) , which point from atom i to atom j, s stands for s-type orbitals and x, y, z stand for the corresponding p-type orbitals. For other cases a circular permutation of indexes is implied. For the values of Vssσ, Vspσ, Vppσ, Vppπ, we use the Harrisson46,47 expressions
, which point from atom i to atom j, s stands for s-type orbitals and x, y, z stand for the corresponding p-type orbitals. For other cases a circular permutation of indexes is implied. For the values of Vssσ, Vspσ, Vppσ, Vppπ, we use the Harrisson46,47 expressions | (12) |
 | (13) |
 | (14) |
 | (15) |
 | (16) |
![[X with combining right harpoon above (vector)]](https://www.rsc.org/images/entities/i_char_0058_20d1.gif) (t) is
(t) is | (17) |
 | (18) |
| H = E, | (19) |
k, if the eigenvectors are linearly independent, the general solution is | (20) |
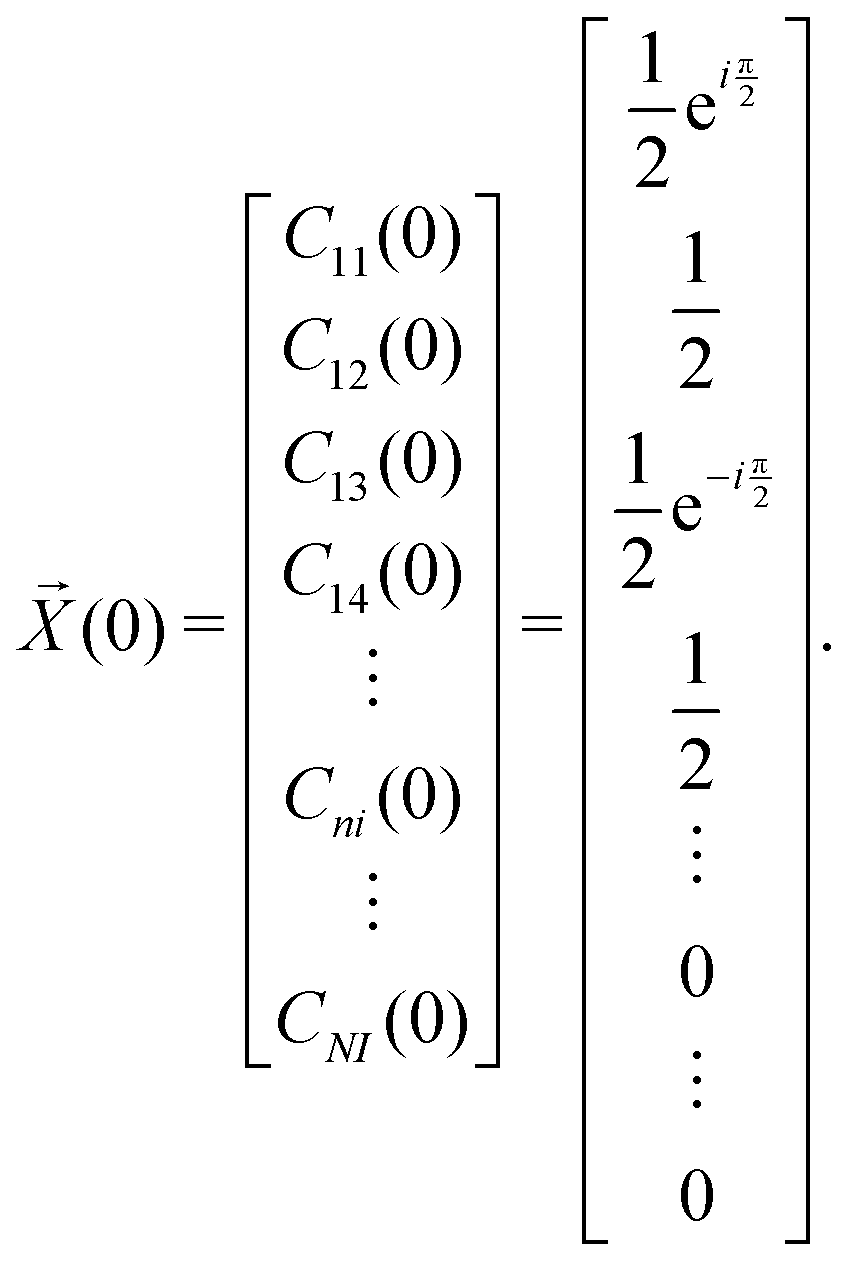
A trivial initial condition would be to make the oxidation (create the hole) at a specific atomic orbital ; then we have to set the corresponding coefficient σ = 1 and the remaining coefficients σk≠ = 0. If we need to create the carrier not at a specific atomic orbital but at a specific atom, many atomic orbitals are involved. Various choices can be made in such a case. We can even use different phases for the orbitals of the same atom. In the following example, for the first atom (e.g. a Carbon), we set a phase difference  between the 2s, 2px, 2py orbitals, simultaneously imposing identical occupation of all second shell orbitals (including 2pz). However, in the results shown in this article, we set the phase difference zero. This initial condition is denoted by (1,1,1,1).
 | (21) |
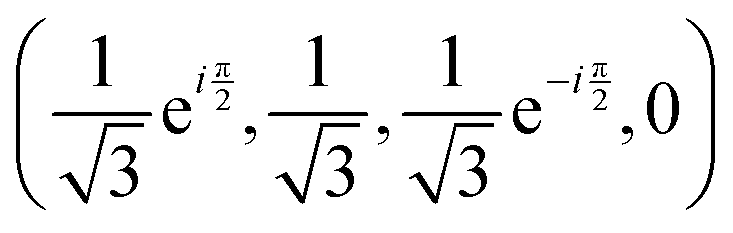 , if a phase difference
  is imposed. However, in the results shown in this article, we set the phase difference zero. Obviously, there is an infinite number of initial conditions that one could imagine. A comparison of the H2C6versus the N2C6 geometry is given in Fig. 1 in a system of coordinates, where the y axis is identified with the D∞ axis. Then, the (1,1,1,1) initial condition treats 2px and 2pz in exactly the same way.
The TB variant that we use requires one s-type orbital for hydrogen, as well as one s-type orbital and a triplet of p-type orbitals for carbon or nitrogen. This is similar to the idea behind the “minimal” STO-nG basis set, since it has the same number and type (although Gaussian) of valence orbitals. The “TB STO-3G” initial condition that will be used below means that we take the initial carrier percentages from CDFT with the STO-3G basis set and use the same numbers for the TB initial condition.
2.2 DFT, CDFT, TDDFT, RT-TDDFT, geometry optimization, vibrational modes
DFT57,58 is a well-established, widely-used method for the study of ground state properties of many-body systems like molecules and solids. The ground state is determined by self-consistently solving the Kohn–Sham equations that represent a system of N non-interacting electrons, assumed to produce the same charge density as the real system of N interacting electrons. Later DFT was extended59 to time dependent systems. Today, time-dependent DFT (TDDFT) is usually applied to study excited states. The time-dependent Kohn–Sham (TDKS) equations with an effective potential energy vKS(![[r with combining right harpoon above (vector)]](https://www.rsc.org/images/entities/i_char_0072_20d1.gif) ,t), in atomic units (a.u.), read
,t), in atomic units (a.u.), read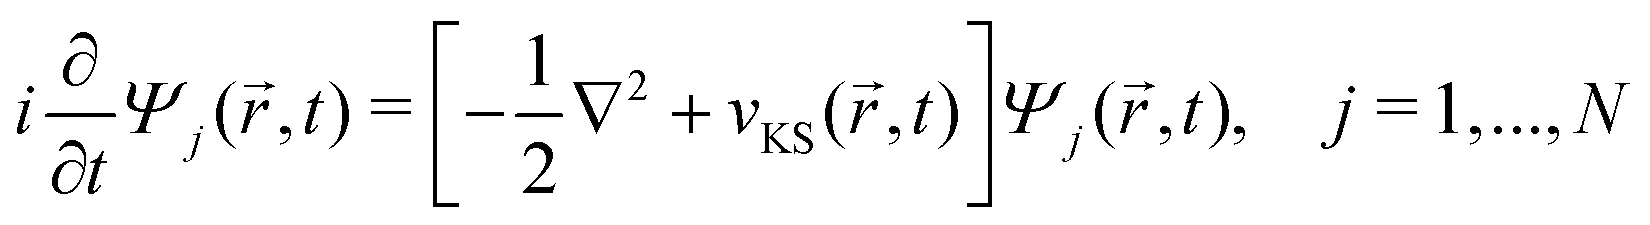 | (22) |
,t)} is a set of fictitious orbitals, and| vKS(,t) = vext(,t) + vH(,t) + vxc[ρ](,t) | (23) |
,t) includes external fields and nuclear potentials, vH(,t) is the Hartree potential, and vxc[ρ](,t) are the exchange and correlation terms. The total time-dependent charge density is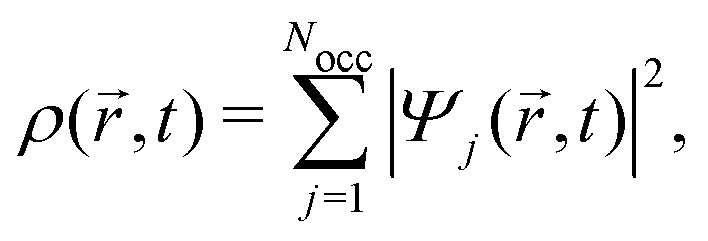 | (24) |
For RT-TDDFT simulations, we initially perform a ground-state DFT calculation on the neutral molecule and obtain the charge at each atom via Löwdin population analysis.62 For the calculation of absorption spectra, we obtain the time-dependent dipole moment in each of the x, y and z axes resulting from a small (here 10−4 a.u. = 514.2 × 10⁻⁴ V nm−1) δ-function-like electric field along each axis. Then, using the Fourier transform of the dipole moment, we can construct the complex polarizability tensor, and, eventually, dipole strength function. Details can be found in ref. 60. For the calculation of hole transfer properties, we generate the initial state for RT-TDDFT using CDFT, setting the charge values to those obtained through the Löwdin analysis, apart from the oxidized atom, the charge of which is increased by +1, i.e., a hole is created. Löwdin population analysis was integrated into the RT-TDDFT module of NWChem for the calculation of each fragments charge at each time step.45 It is much less basis-set dependent and does not display extremely fast charge oscillations that Mulliken analysis (the default scheme in NWChem's RT-TDDFT implementation) artificially introduces in charge transfer simulations, thus giving a clearer picture of charge transfer. The claim that Löwdin population analysis is more appropriate for the problem at hand than Mulliken population analysis is substantiated by the form of the total dipole moment oscillations, which are similar to charge oscillations obtained by Löwdin population analysis, in the sense that they do not show those extremely fast oscillations but have a frequency content similar to that obtained for charge osccillations by Löwdin population analysis.36,44,45 In a Gaussian basis set, it is natural to use the single particle reduced density matrix, whose time evolution is governed by the von Neumann equation. The Magnus propagator is used in NWChem's RT-TDDFT implementation: it is stable and conserves the density matrix idempotency.60 At the end of each time step, the charge is calculated at each atom, along with the dipole moment. After tests, we used a time step of 0.5 a.u. The atomic unit of time, ħ/EH ≈ 0.02418 fs, EH is the Hartree energy. We performed four-step calculations: (1) geometry optimization, (2) ground state DFT, (3) vibrational analysis, (4) RT-TDDFT. These four-step calculations were performed multiple times, each time at a specific level of theory. That is, each time DFT, CDFT, and RT-TDDFT calculations were carried out at the same level of theory. We employed the B3LYP functional.63–66 We have performed checks with many different functionals in our previous works.9,10 Screened hybrid density functionals,67 might be useful for some applications. Given the large amount of calculations performed in the present work with many different levels of theory of DFT-related methods, the large amount of calculations performed with TB-related methods, and our comparisons with experimental results where available, an exhaustive examination of a large number of functionals exceeds the scope of this work. For all DFT-related methods, we used the following basis sets: 3-21G*,68,69 6-31G*,70,71 6-31G**,70,71 6-31++G**,69,72–74 6-311G**,69,75 6-311++G**,69,75 cc-pVDZ,76,77 cc-pVTZ,76,77 and STO-3G.78 Typically, we performed geometry optimization, each time at the same level of theory, and studied the vibrational modes as included in NWChem.
2.3 Influence of vibrations
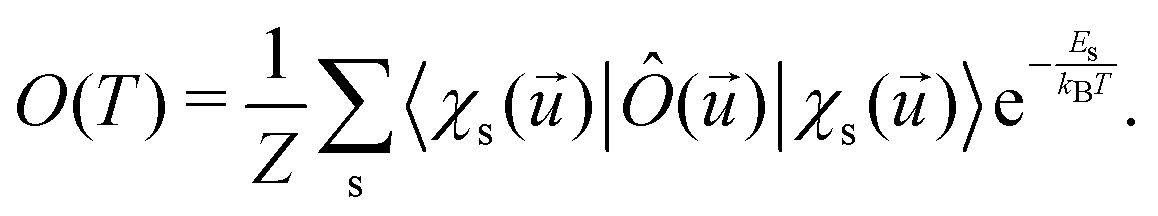
The electronic and optical properties of typical insulators and semiconductors are affected by atomic motion through electron–phonon interaction: not only band gaps change with temperature, but even at absolute zero temperature, zero-point motion causes band-gap renormalization.79 Molecular excited state calculations are systematically improved by including nuclear quantum motion.80For the first members in the series of polyynes and dicyanopolyynes, we have evaluated the effect of nuclear motion absorption spectra and oxidation dynamics. The influence of nuclear motion to a quantum mechanical observable at temperature T, Ô(T), can be expressed via the standard quantum mechanical expectation value
 | (25) |
![[u with combining right harpoon above (vector)]](https://www.rsc.org/images/entities/i_char_0075_20d1.gif) is the nuclear displacement vector, |χs()〉 is a vibrational eigenstate on the ground state potential energy surface with energy Es,
is the nuclear displacement vector, |χs()〉 is a vibrational eigenstate on the ground state potential energy surface with energy Es, 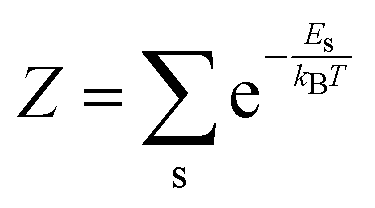 is the partition function, and Ô() is the observable of interest once the system is displaced by .
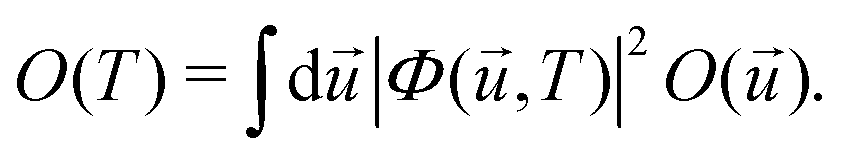
Within the harmonic approximation for the ground state potential, we can substitute |χs()〉 with the wavefunctions of the quantum harmonic oscillator, obtaining81
 | (26) |
,T)|2 is the harmonic density function at temperature T, given by | (27) |
 | (28) |
The above expressions rely on the Born–Oppenheimer approximation, which is generally acceptable for organic systems.79 The harmonic approximation can break down in extended molecular crystals and particularly at elevated temperatures.82,83 However, it is generally justified for molecules in vacuum and at low temperatures.80 The approximation to molecular vibrations made above can lead to errors, when studying molecular properties at room temperature, where highly anharmonic modes can be activated. Here we focus on the effects of nuclear quantum motion on electronic observables, where vibrational modes are active with their zero-point energy,  in a regime that anharmonicity is assumed to be negligible.
Eqn (26) can be approximated via the Monte Carlo method by generating a sample of configurations , according to the harmonic distribution at a specific temperature T, so that the expectation value of the observable O(T) can be computed as an average of the sample values. This method relies on no adjustable parameters, apart from the choice of DFT functional and basis set, which are fixed throughout the entire series of calculations. Other methods were proposed in the past, such as the nuclear ensemble approach used within the quantum chemistry community84,85 or methods generating initial nuclear configurations from a Boltzmann distribution to sample vibrational averages of observables,86,87 although the latter would not capture the effects of zero-point motion. In this work, to sample the integral of eqn (26), we generate 100 displaced configurations for each molecule at T = 0 K and obtain the renormalized absorption spectra, as well as quantities related to hole transfer (using RT-TDDFT), versus those of their ‘static’, frozen, conformations.
3 Results
For each molecule, with DFT-related methods, using NWChem,61 we optimize geometry, extract vibrational modes and obtain the electronic structure including population analysis. Then, we create a hole at a site by CDFT and we obtain the spatial and temporal evolution by RT-TDDFT. For each molecule, in TB, we use the optimized geometry, to obtain all TB-related quantities. After oxidation, in TB, we obtain the time-dependent probability of finding the hole at each orbital and at each atom. Then, averaging over time, we derive the corresponding mean over time probabilities. In RT-TDDFT, the excess charge as a function of time, qexcess(t), can be calculated from the charge as a function of time q(t) minus the charge at time zero (when oxidation takes place) q(0) [which is the outcome of CDFT, except for the oxidized site whose charge is increased by +1], i.e., as qexcess(t) = q(t) − q(0). Another possibility would be to calculate qexcess(t), from q(t) minus the charge of the neutral atom, i.e., as qexcess(t) = q(t) − qneutral atom. After averaging qexcess(t) over time, we obtain the mean excess charge, which is comparable to the TB mean probabilities. We are also interested in time-dependent total dipole moment components. From the time-dependent probabilities and dipole moment components, we analyse, via Fourier Transform, the frequency content of carrier movement. Finally, we calculate the mean hole transfer rates from orbital to orbital (not shown in this article, for brevity), and from atom to atom or from site to site. For example, provided that we initially place the carrier at site i, the mean transfer rate from site i to site j is defined as usual,9,36,88 as kij := 〈qexcess![[thin space (1/6-em)]](https://www.rsc.org/images/entities/char_2009.gif) j(t)〉/tmeanij in RT-TDDFT or kij := 〈|Cj(t)|2〉/tmeanij in TB, where tmeanij is the time it takes for qexcessj(t) in RT-TDDFT or |Cj(t)|2 in TB to reach its mean value for the first time.
j(t)〉/tmeanij in RT-TDDFT or kij := 〈|Cj(t)|2〉/tmeanij in TB, where tmeanij is the time it takes for qexcessj(t) in RT-TDDFT or |Cj(t)|2 in TB to reach its mean value for the first time.
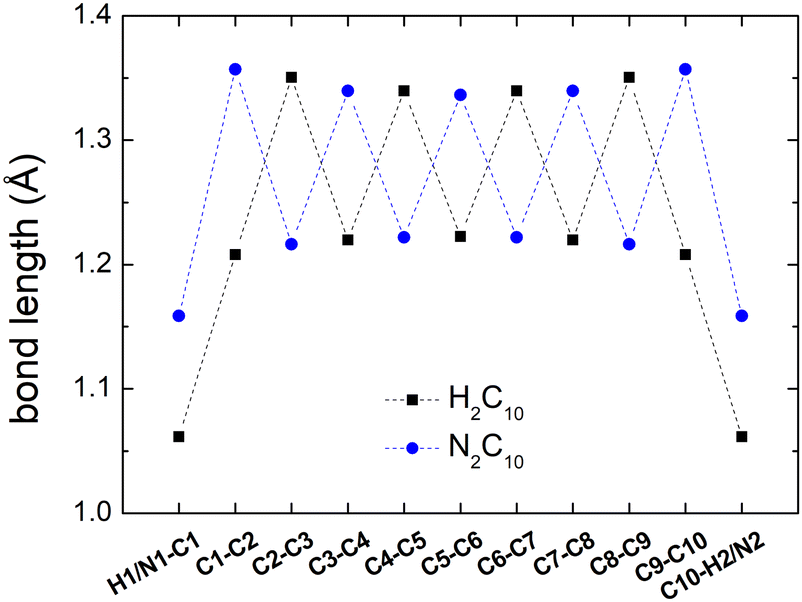
Fig. 2 shows a comparison between the optimized geometries of one example of polyynes (H2C10, cf. Section 3.1) and one of dicyanopolyynes (N2C10, cf. Section 3.2), at the B3LYP/cc-pVTZ level of theory. We have performed calculations at different levels of theory; results converge nicely as we move to larger basis sets (cc-pVTZ is the largest that we tried). For polyynes, we have alternating short and long bonds between carbon atoms with the first carbon–carbon bond being short, while carbon–hydrogen bonds are even shorter. For dicyanopolyynes we have alternating short and long bonds between carbon atoms with the first carbon–carbon bond being long, while nitrogen–carbon bonds are even shorter. In Fig. 3 we compare the optimized lengths of polyynes (H2C2m) and dicyanopolyynes (N2C2m), for m = 1, 2, …, 5, at the B3LYP/cc-pVTZ level of theory. It appears that lengths increase in a parallel linear fashion, with dicyanopolyynes being longer.
 | ||
| Fig. 2 Optimized geometries of one example of polyynes (C10H2) and one of dicyanopolyynes (C10N2), at the B3LYP/cc-pVTZ level of theory. | ||
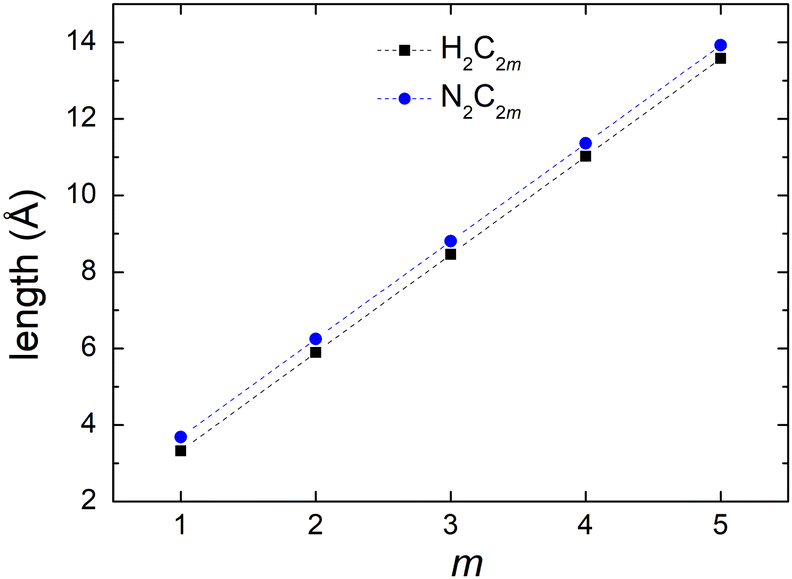 | ||
| Fig. 3 Optimized lengths of polyynes (H2C2m) and dicyanopolyynes (N2C2m), m = 1, 2, …, 5, at the B3LYP/cc-pVTZ level of theory. | ||
Additional data for the comparison between the ground state properties of polyynes (H2C2m) and dicyanopolyynes (N2C2m), m = 1, 2, …, 5, at the B3LYP/cc-pVTZ level of theory, can be found in the ESI:† total DFT energies, contributions of one-electron terms, Coulomb repulsion, exchange correlation, nuclear repulsion to the total DFT energies, and HOMO–LUMO gaps.
3.1 Polyynes
We denote polyynes with alternating short and long bonds and NC = n carbon atoms by pol-n-sl, e.g., pol-6-sl, of D∞h symmetry, with two CH– end groups, possesses 26 valence electrons. We report results for pol-2-sl (H2C2), pol-4-sl (H2C4), pol-6-sl (H2C6), pol-8-sl (H2C8), and pol-10-sl (H2C10) and we focus on the median of the series, pol-6-sl (H2C6), for illustrative purposes.The TB variant that we use recruits one s-type orbital for hydrogen, one s-type orbital and one (triplet) p-type orbital for carbon and nitrogen. The closest Gaussian basis set that we could imagine is the “minimal” STO-3G basis set that has the same number and (nominally) type of valence orbitals. In the ESI,† we present the Löwdin population analysis, at the B3LYP/STO-3G level of theory, for various pol-n-sl molecules with even NC = n. Due to higher electronegativity, C atoms have slightly higher electron charge than neutral C atoms; the opposite holds for H atoms. As the length of the chain is increased, excess charge is distributed among more carbon atoms; less charge remains at hydrogen atoms.
Fig. 4 shows the vibrational frequencies of pol-n-sl molecules, with even NC = n, at the B3LYP/6-31G* level of theory. Specific patterns appear: (a) two high-frequencies for all molecules, related to vibrations of hydrogen atoms. (b) Medium frequencies, whose number is increased, as the chain length is increased. These correspond to vibrations of carbon atoms along the chain. (c) Low frequencies, corresponding to vibrations that change the symmetry of the one-dimensional chain, i.e., bend the rod.
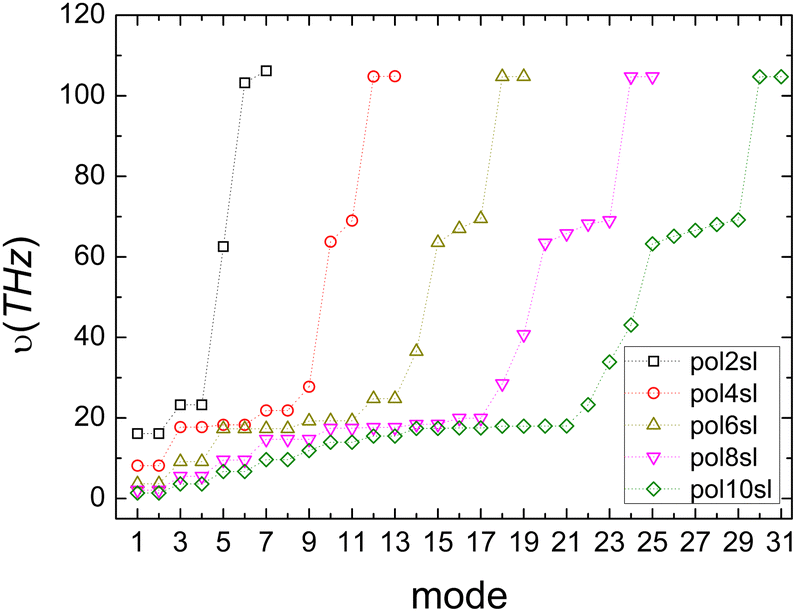 | ||
| Fig. 4 Vibrational frequencies of pol-n-sl molecules with even NC = n (n = 2, 4, 6, 8, 10) at the B3LYP/6-31G* level of theory. | ||
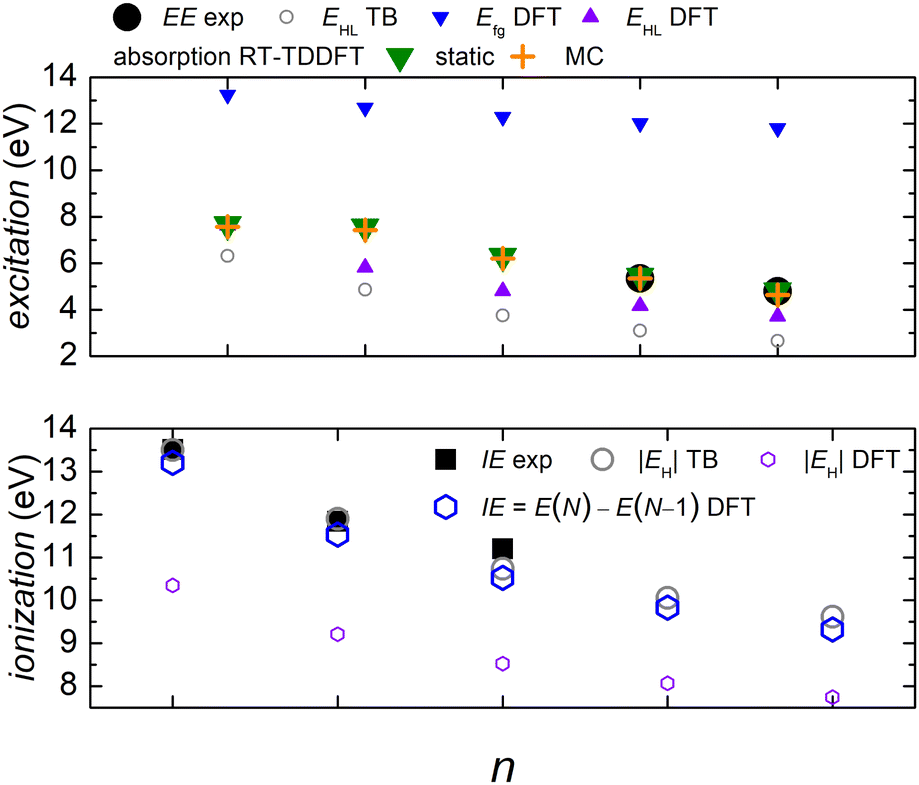
In Fig. 5 we compare experimental ionization and excitation energies of pol-n-sl polyynes with even NC = n with theoretical ones, obtained by TB with all valence orbitals, DFT and RT-TDDFT. The quantities in Fig. 5 are vertical values, i.e., calculated or measured at fixed geometry. The experimental ionization energy, IEexp, is taken from ref. 89. Similar values for n = 2, 4, 6, 8, respectively, are given in ref. 90–93. The experimental excitation energy, EEexp, is obtained combining information from ref. 42, 94 and 95 (gas-phase data). In the experiment,94 there exist two series (i.e., as n changes) of peaks: series A, at lower energies is approximately two orders of magnitude weaker than series B. Similar, with series B excitation energies are given in ref. 41 and 95, i.e., 8.6 eV, 6.8 eV, 6.0 eV, 4.9 eV, for n = 4, 6, 8, 10, respectively. Via TB with all valence orbitals, we obtain the molecular eigenenergies and eigenvectors and, in particular, their HOMO and LUMO energies and their HOMO–LUMO gap. If we assume that for TB the absolute value of the HOMO energy, |EH|, could be considered as the ionization energy, IE, then we have an overestimation of ≈1–2% compared to the experiment. If we assume that for TB the HOMO–LUMO gap, EHL, could be considered as the excitation energy, EE, then, for series A excitation energies we have a deviation of only 0–1% for n = 2, 4, 6, and underestimations of ≈5 and 11%, for n = 8 and n = 10, respectively, compared to the experiment. We notice that the experimental data for these weak transitions are only given in an graph in ref. 94 and we underline that taking the HOMO–LUMO gap equal to EE is a crude approximation since we ignore excitonic effects and re-arrangement of the molecule when excited. In TB, the HOMO and LUMO are typically of similar symmetry, cf.Fig. 6 (for all polyyne molecules, cf. ESI†); therefore, the HOMO–LUMO transition should be close to optically forbidden in the dipole approximation, i.e., it should have negligible oscillator strength. This is why we compare the TB HOMO–LUMO gaps with series A peaks.
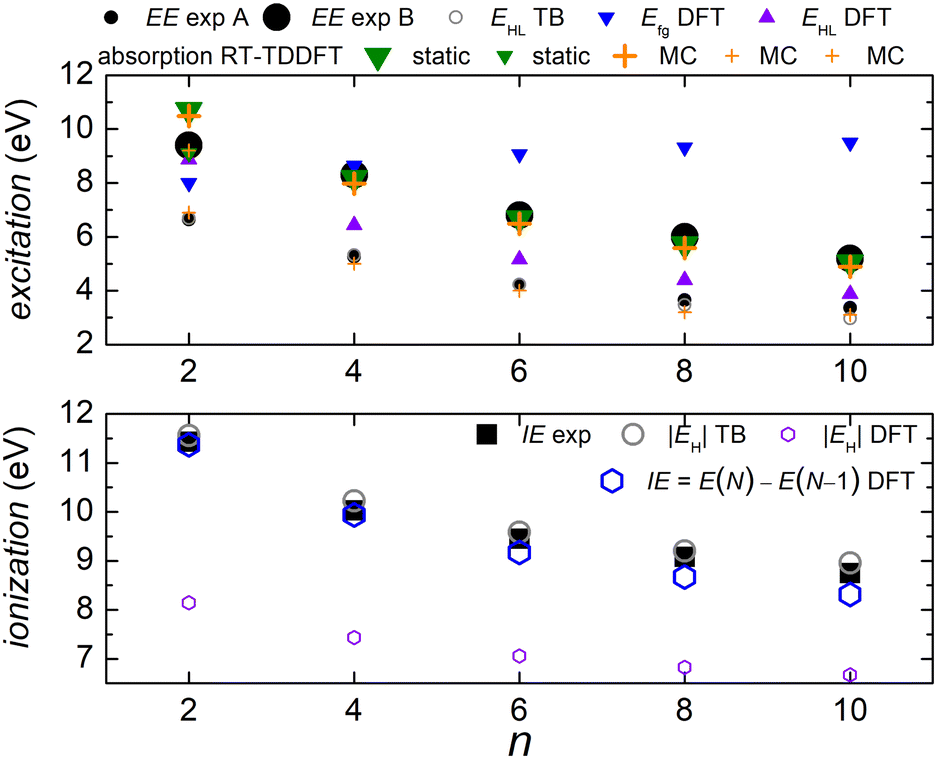 | ||
| Fig. 5 Excitation energy EE (top) and ionization energy IE (bottom) for polyynes. Comparison of experimental with theoretical data. The DFT and RT-TDDFT results shown were obtained at the B3LYP/cc-pVTZ level of theory. | ||
 | ||
| Fig. 6 Molecular eigenstates of pol-6-sl, as obtained via TB: eigenenergies and character (analysis of molecular states into atomic valence states). For a comparison of pol-n-sl molecules with n = 2, 4, 6, 8, 10, cf. ESI.† | ||
Let us call E(M) the total energy of a system with M electrons, and EH(M), EL(M) its HOMO and LUMO eigenenergy, respectively. From DFT, we can calculate the ionization energy as IE = E(N) − E(N − 1). IE should be equal to −EH(N), if the molecular eigenstates remained unaffected by removal of one electron (but they are not) and if DFT could precisely estimate EH (but it can not, cf. lower panel of Fig. 5). From DFT, we can also calculate the electron affinity, as EA = E(N + 1) − E(N). EA should be equal to −EL(N), if the molecular eigenstates remained unaffected by addition of one electron (but they are affected) and if DFT could precisely estimate EL (but it can not). Then, we can estimate the fundamental gap as Efg = IE − EA. Efg should be EL − EH := EHL, if the molecule remained unaffected by addition or removal of one electron, but it is not. We observe in the upper panel of Fig. 5 that there is a great difference between Efg and EHL. The values we show in Fig. 5 were obtained at the B3LYP/cc-pVTZ level of theory. This way, from DFT, for IE we have an underestimation of 3–8%. It seems that EA and hence Efg are far from successful: we observe that Efg is an increasing function of n, a behaviour inverse of the experimentally expected. The differences between various flavours of gaps, e.g. “band gap”, “HOMO–LUMO gap”, “fundamental gap”, “optical gap”, “transport gap” are explained, e.g., in ref. 43.
To evaluate the optical gap, absorption spectra can be obtained by RT-TDDFT,60 taking advantage of the procedure described at the NWCHEM website. We obtained absorption spectra in the static case, as well as using deformations and the MC sampling technique explained in Subsection 2.3. Primary peaks are denoted by large down-pointing triangles (static) and large crosses (MC) in Fig. 5, and secondary peaks are denoted by smaller versions of the respective shapes. For n = 2, the peaks for 9.1 eV (static) and 9.2 eV (MC) are weak, and there is another series of very weak peaks revealed only by MC, which fall onto experimental peak A series: the form of these very weak peaks revealed by the average MC configuration are for n = 2 a peak, for n = 4 a shoulder, then, for n = 6, 8, 10 we can only see inflection points.
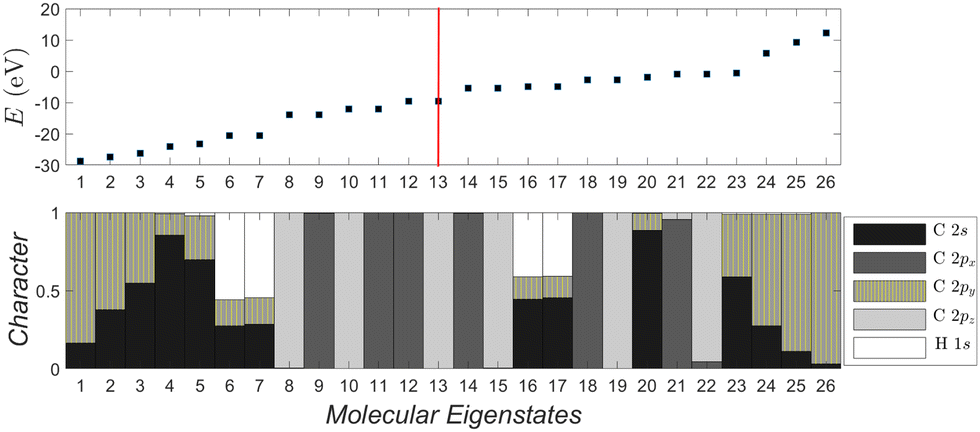
Fig. 6 depicts the molecular eigenenergies of pol-6-sl and the character of each eigenstate, as obtained via TB. We already mentioned that by character we mean the analysis of molecular states into valence atomic states. In pol-6-sl we have 26 valence electrons. Hence, in increasing eigenenergy, the HOMO (LUMO) corresponds to the 13th (14th) eigenstate. The molecule lies along the y-axis, so 2py orbitals lie along the chain; 2px and 2pz are perpendicular to the chain. The HOMO (12–13) and the LUMO (14–15) states are degenerate and of p p π character, i.e., mainly composed of 2px and 2pz components overlapping laterally. Not only the HOMO and LUMO, but all eigenstates 8–15, 18–19, 21–22 are of p p π character. Other molecular states have 2s-2py hybrid character overlapping frontally: these correspond to the strong sp sp σ type of bonds along the chain. Finally, some molecular states are of 1s-2s-2py hybrid character: these correspond to hydrogen-carbon s sp σ bonds at the chain ends. Such analysis for all pol-n-sl molecules is shown in the ESI.†
Regarding oxidation dynamics, for TB, the initial conditions used in this work are all possible hole placements at a valence atomic orbital of a C (or N) atom as well as various combinations of hole placements at several or all orbitals of a C (or N) atom. We also use the “TB STO-3G” initial condition: for example, at the B3LYP/STO-3G level of theory, for pol-6-sl, the Löwdin population analysis, i.e., the shell charges (1s, 2s, 2p), for the carbon atom C1, are approximately: (1.99, 1.06, 3.01) for the Ground State (GS), (1.99, 0.99, 2.08) for the Localized Hole State (LHS), and their difference (GS–LHS) is (0.00, 0.07, 0.93). For “TB STO-3G”, we use GS–LHS to define the distribution of the placed hole at the valence atomic orbitals: the hole is distributed 7% at the 2s orbital and 93% at the 2p orbitals. The percentage of the 2p orbitals is equidistributed between the 2px and 2pz orbitals, because the character of HOMO is π and the π-character comes from both 2px and 2pz orbitals. Similar percentages hold for the rest polnsl molecules.
The coordinate system for pol-n-sl molecules is such that they lie along the y-axis. If a hole is initially created at the 2s orbital of C1, it will have to travel along the y-axis. Hence, the 2s and 2py time-dependent probabilities of C1 will be interconnected. The picture is similar if we initially place the hole at the 2py orbital of C1 or at a combination of 2s and 2py orbitals of C1. Including hydrogen 1s orbitals, we could say that an s sp σ path is active, in the sense that in similar situations only 2s and 2py orbitals of carbon atoms and 1s orbitals of hydrogen atoms will carry the hole. A relevant initial snapshot for n = 6 is shown in the ESI,† for pol-6-sl. The 2px and 2pz time-dependent probabilities remain zero. Alternatively, if we initially place the hole at a 2px or 2pz orbital of C1 (or at a combination of those), one (or two) p p π paths will be active.
Fig. 7 shows the mean over time probabilities at each site, for various initial conditions, with oxidation (hole creation) always at C1 (TB) as well as the mean excess charge at various levels of theory (RT-TDDFT), for H2C6. These are static results. We underline that in TB, the hole is always created at C1, while, in RT-TDDFT, the hole is either created at C1 (upper panel) or at the first HC-site, C1 and H7 (lower panel). In the upper panel, each atom forms a site for RT-TDDFT at the B3LYP/STO-3G level of theory, and the hole is created at C1. In the lower panel, in TB, the mean over time probability of each H atom is shown together with the mean over time probability of its closest C atom with which they form a methine (HC–). In RT-TDDFT the hole is created at the first methine (HC–). The RT-TDDFT results at all levels of theory are palindromic, i.e., symmetrical relative to the molecular centre. This palindromicity holds also for TB, for all initial conditions. For RT-TDDFT, we depict results with qexcess(t) = q(t) − q(0). We tried qexcess(t) = q(t) − qneutral atom, too; then, the mean excess charges at the single carbon atoms in the middle of the chain come even closer.
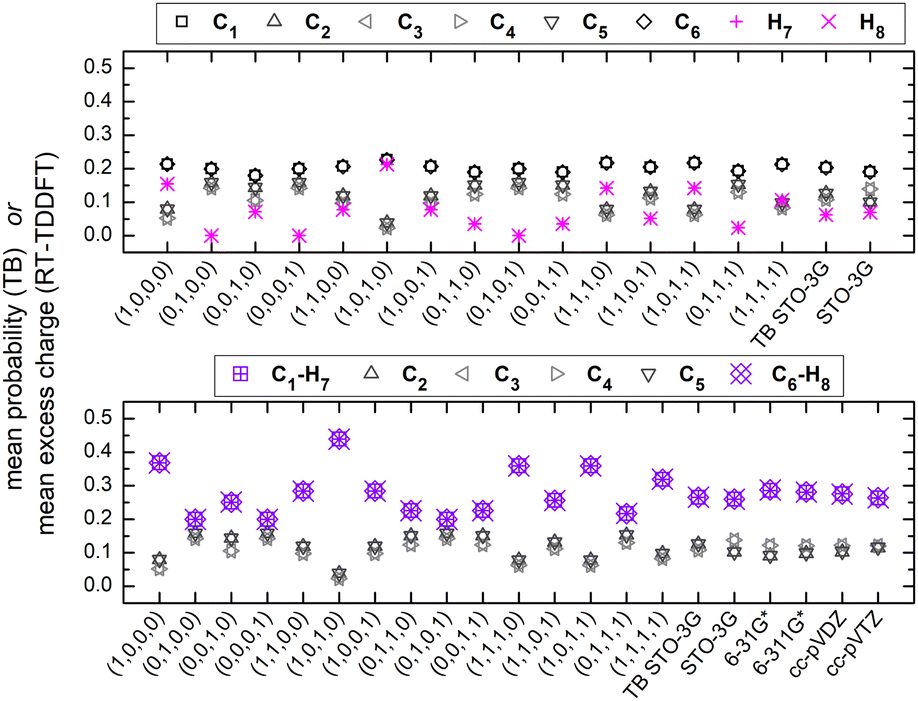 | ||
| Fig. 7 Mean probability at each site via TB with various initial conditions [averaging over time the TB time-dependent probability] and mean excess charge via RT-TDDFT [averaging over time qexcess(t) = q(t) − q(0)] at various levels of theory, for H2C6. (a) Each atom corresponds to one site. (b) Each hydrogen atom forms together with its neighbouring carbon atom one site (methine). Static case. H7 (H8) is the hydrogen atom connected to the carbon atom C1 (C6). | ||
Fig. 8 (top) shows the time-dependent total dipole moment in H2C6 with a hole, via RT-TDDFT and basis sets STO-3G, 6-31G*, 6-311G*, cc-pVDZ and cc-pVTZ as well as via TB and initial conditions (0,1,0,1) and TB STO-3G, using methine (HC–) sites at both ends. In RT-TDDFT, such fragments are defined by CDFT. In TB, we consider the fragment as located at the centre of charge of the two constituents. RT-TDDFT lines are relatively close with the exception of STO-3G; TB lines are also close. However, RT-TDDFT oscillations are faster than TB oscillations. In Fig. 8 (bottom) we observe that use of independent H and C sites at both ends instead of HC-sites hardly affects the results. Fig. 9 shows the frequency content of total dipole moment oscillations in H2C6. TB curves are narrower than RT-TDDFT curves; one reason is that these RT-TDDFT curves are obtained by NWChem with time step 0.5 a.u. and time span 1000 a.u., whereas, these TB curves are obtained by custom-made matlab code with duration 500 fs ≈ 20678.2 a.u. This time span is typically divided into 4 × 10⁵ steps, hence the time step is 1.25 × 10⁻³ fs ≈ 0.05 a.u. In other words, in TB we have denser mesh and longer duration. Plainly, the TB frequency content lies clearly at lower frequencies, a deduction consistent with Fig. 8. All FFT data are for combined methine (HC–) sites at both ends.
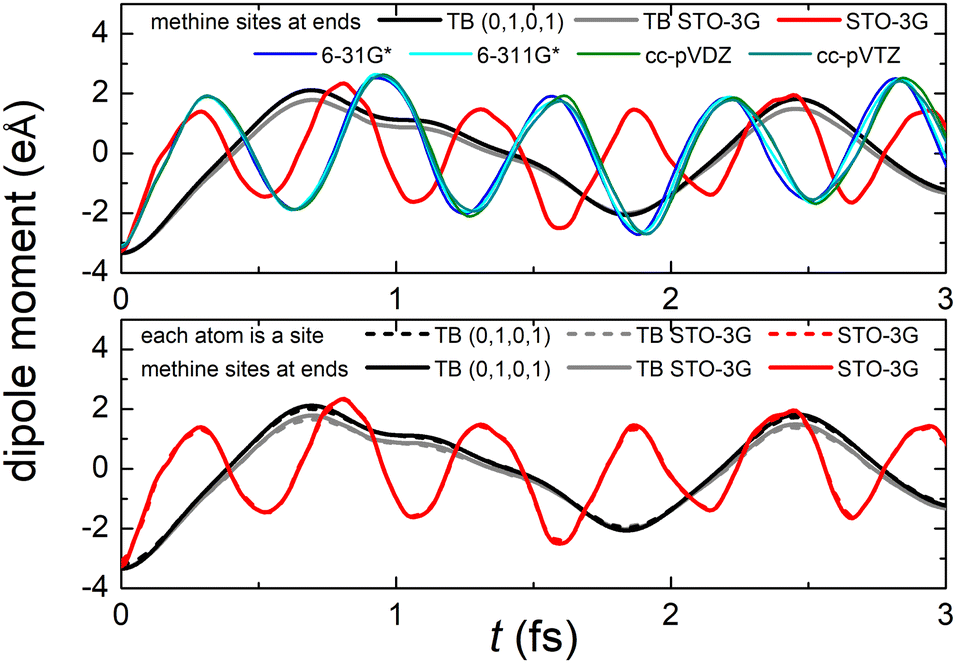 | ||
| Fig. 8 Time-dependent dipole moment of H2C6 obtained via TB with initial conditions (0,1,0,1) and TB STO-3G and via RT-TDDFT with basis sets STO-3G, 6-31G*, 6-311G*, cc-pVDZ, cc-pVTZ. Upper panel: using HC-sites at both ends. Lower panel: comparison with use of independent H and C sites at both ends instead of HC-sites. | ||
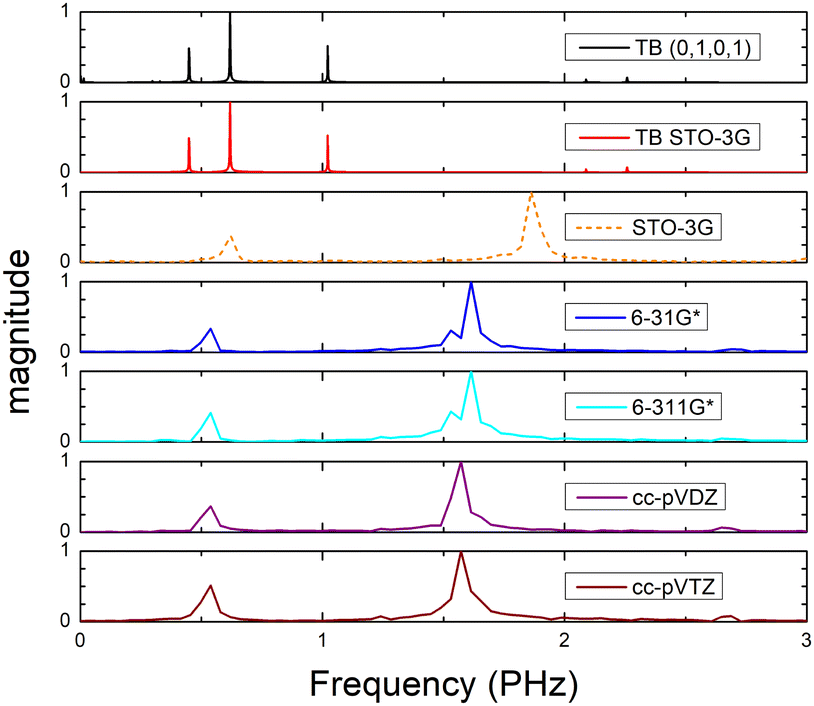 | ||
| Fig. 9 Frequency content of dipole moment oscillations in H2C6 obtained via FFT for TB with initial conditions (0,1,0,1), TB STO-3G and via RT-TDDFT with basis sets STO-3G, 6-31G*, 6-311G*, cc-pVDZ, cc-pVTZ. | ||
Fig. 10 shows mean hole transfer rates, in the static case, in H2C6. In TB, the hole is always created at C1. In RT-TDDFT, the hole is either created at C1 (upper panel) or at the first HC-site, C1 and H7 (lower panel). In TB, transfer rates depend on the initial condition. When the hole is initially placed at a carbon 2s or 2py orbital (or at a combination of those), we observe higher transfer rates to the neighbouring hydrogen (a s sp σ path is active). When the hole is initially placed at a carbon 2px or 2pz orbital (or at a combination of those), we observe negligible hole transfer rates to hydrogens (p p π paths are active).
 | ||
| Fig. 10 Mean hole transfer rates in H2C6via TB and RT-TDDFT. Static case. H7 (H8) is the hydrogen atom connected to the carbon atom C1 (C6). Tiny values are not shown to preserve details for significant values. | ||
3.2 Dicyanopolyynes (and comparison with polyynes)
We denote dicyanopolyynes with NC–, –CN end groups and n carbon atoms by N2Cn (or dicyano-n-polyyne). They possess D∞h symmetry. For example, N2C6 has 34 valence electrons. We report results for n = 2, 4, 6, 8, 10 and focus on the median, N2C6, again, for illustrative purposes.Fig. 11 discusses EE (top) and IE (bottom) for dicyanopolyynes. The experimental ionization energy, IEexp, is taken from ref. 96–99, for n = 2, 4, 6, respectively. The experimental excitation energy, EEexp, for n = 8, 10 (solution), is obtained from ref. 40–42. For n = 2 (gas phase) ref. 42, citing the book,100 gives ≈ 9.4 eV, while in ref. 101–103 for n = 2, the absorption spectrum has features ≈ in the range 238–186 nm (5.2–6.7 eV). Therefore, we are not sure about this experimental point. EHL (DFT) for n = 2 is covered by absorption symbols, static and MC. We did not find other values in the literature. We speculate that the HOMO–LUMO gap cannot be seen in the absorption spectra because HOMO and LUMO have typically similar symmetry, cf. also series A in polyynes.
 | ||
| Fig. 11 Excitation energy EE (top) and ionization energy IE (bottom) for dicyanopolyynes. Comparison of experimental with theoretical data. The DFT and RT-TDDFT results shown were obtained at the B3LYP/cc-pVTZ level of theory. | ||
Fig. 12 depicts the molecular eigenenergies of dicyano-6-polyyne (N2C6) and the character of each eigenstate. In N2C6 we have 34 valence electrons. Hence, in increasing eigenenergy, the HOMO (LUMO) corresponds to the 17th (18th) eigenstate. The molecule lies along the y-axis, so 2py orbitals lie along the chain; 2px and 2pz are perpendicular to the chain. The HOMO (16–17) and the LUMO (18–19) states are degenerate and of p p π character, i.e., mainly composed of 2px and 2pz components overlapping laterally. Not only the HOMO and LUMO, but all eigenstates 8–11, 14–23, 26–27 are of p p π character. The other molecular states have 2s-2py hybrid character overlapping frontally: these correspond to the strong sp sp σ type of bonds along the chain. Such analysis for other dicyano-n-polyynes is shown in the ESI.†
 | ||
| Fig. 12 Molecular eigenstates of dicyano-6-polyyne (N2C6): eigenenergies and character (analysis of molecular states into atomic valence states). For a comparison of dicyano-n-polyynes with n = 2, 4, 6, 8, 10, cf. ESI.† | ||
Fig. 13 shows the mean over time probabilities (TB) and the mean excess charge (RT-TDDFT), for C6N2. For RT-TDDFT, we depict results with qexcess(t) = q(t) − q(0). We also tried qexcess(t) = q(t) − qneutral atom; then, the mean excess charges at single carbon atoms in the middle of the chain come even closer. We underline that in TB, the hole is always created at N1, while, in RT-TDDFT, the hole is either created at N1 (upper panel) or at the first NC-site, N1 and C2 (lower panel). In the upper panel, each atom forms a site for RT-TDDFT, and the hole is created at N1. In the lower panel, in TB, the mean over time probability of each N atom is shown together with the mean over time probability of its closest C atom with which they form a cyan (NC–), while in RT-TDDFT the hole is created at the first cyan (NC–). The RT-TDDFT results at all levels of theory are palindromic, i.e., symmetrical relative to the molecular centre. This palindromicity holds also for TB, for all initial conditions.
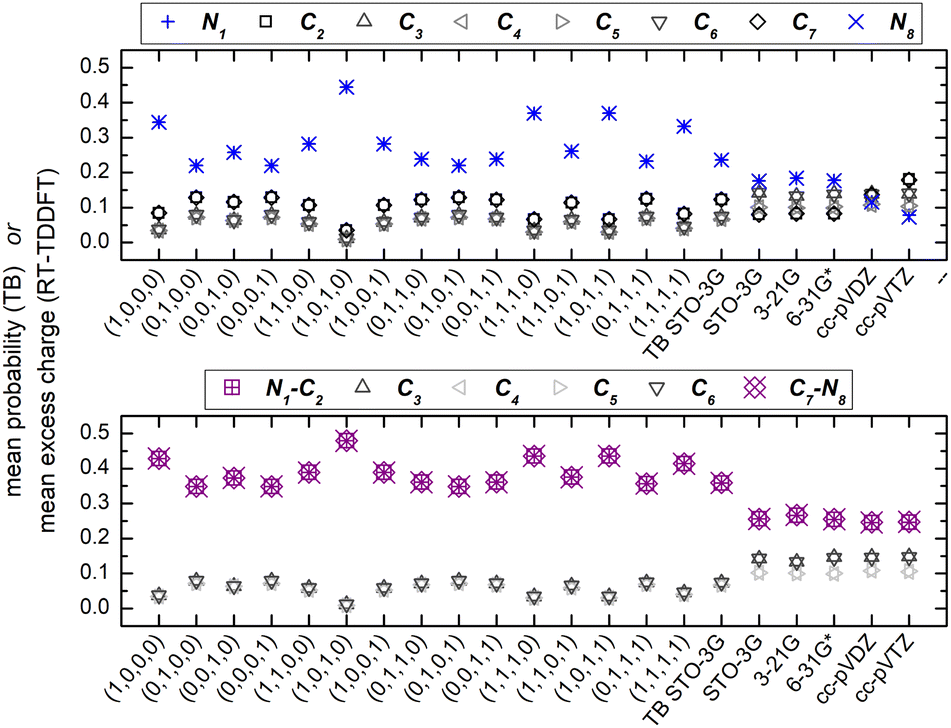 | ||
| Fig. 13 Mean over time probability at each site via TB with various initial conditions [averaging over time the TB time-dependent probability] and mean excess charge via RT-TDDFT [averaging over time qexcess(t) = q(t) − q(0)] at various levels of theory, for N2C6. (a) Each atom corresponds to one site. (b) Each nitrogen atom forms together with its neighbouring carbon atom one site (cyan). | ||
Regarding oxidation dynamics, Fig. 14 (top) shows the time-dependent total dipole moment in N2C6 with RT-TDDFT and basis sets STO-3G, 6-31G*, 6-311G*, cc-pVDZ and cc-pVTZ as well as with TB and initial conditions (0,1,0,1) and TB STO-3G, using cyan (NC–) sites at both ends. RT-TDDFT lines are close with a slight delay of 6-31G* and the exception of STO-3G; TB lines are not so close as in Fig. 8 (top). Again, RT-TDDFT oscillations are faster than TB oscillations. In Fig. 14 (bottom) we observe that use of independent N and C sites at both ends instead of NC-sites only slightly affects the results for TB, but has a significant effect at the minimal B3LYP/STO-3G level of theory.
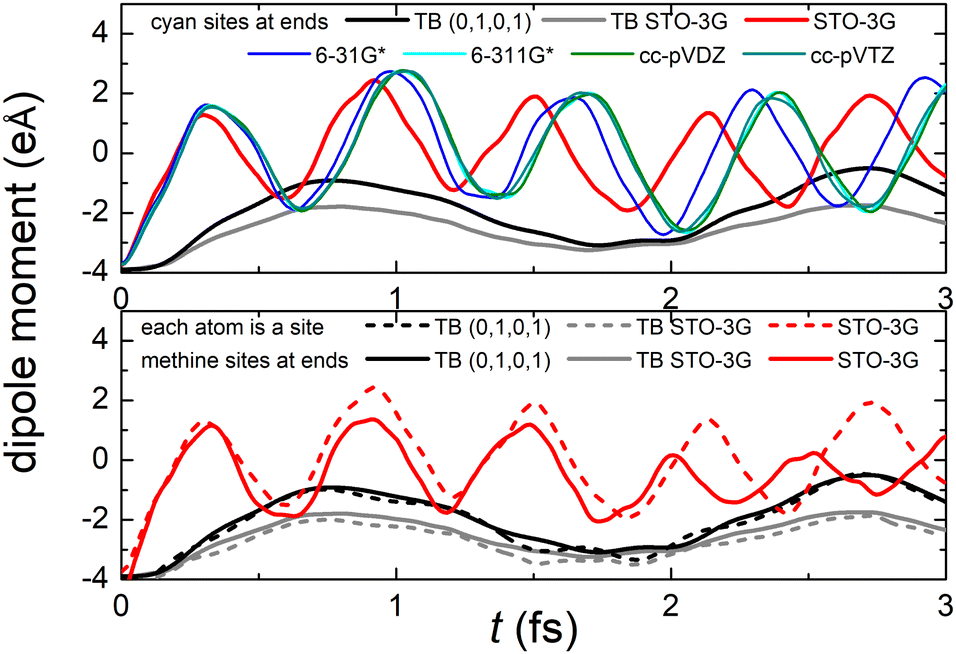 | ||
| Fig. 14 Time-dependent dipole moment of N2C6 obtained via TB with initial conditions (0,1,0,1) and TB STO-3G and via RT-TDDFT with basis sets STO-3G, 6-31G*, 6-311G*, cc-pVDZ, cc-pVTZ. Upper panel: using NC-sites at both ends. Lower panel: comparison with use of independent N and C sites at both ends instead of NC-sites. | ||
Fig. 15 shows the frequency content of total dipole moment oscillations in N2C6. TB curves are narrower than RT-TDDFT curves; one reason is that these RT-TDDFT curves are obtained by NWChem with time step 0.5 a.u. and time span 1000 a.u., whereas, these TB curves are obtained by custom-made matlab code with duration 500 fs ≈ 20678.2 a.u. This time span is typically divided into 8 × 10⁵ steps, hence the time step is 0.625 × 10⁻³ fs ≈ 0.025 a.u. In other words, in TB we have denser mesh and longer duration. Again, the TB frequency content is clearly at lower frequencies, a deduction consistent with Fig. 14. All FFT data are for combined cyan (NC–) sites at both ends.
 | ||
| Fig. 15 Frequency content of dipole moment oscillations in N2C6 obtained via FFT for TB with initial conditions (0,1,0,1), TB STO-3G and via RT-TDDFT with basis sets STO-3G, 6-31G*, 6-311G*, cc-pVDZ, cc-pVTZ. | ||
Fig. 16 shows the mean hole transfer rates in N2C6 with TB and RT-TDDFT, in the static case. Again, generally speaking, end to end hole transfer rates predicted by RT-TDDFT are higher than those predicted by TB.
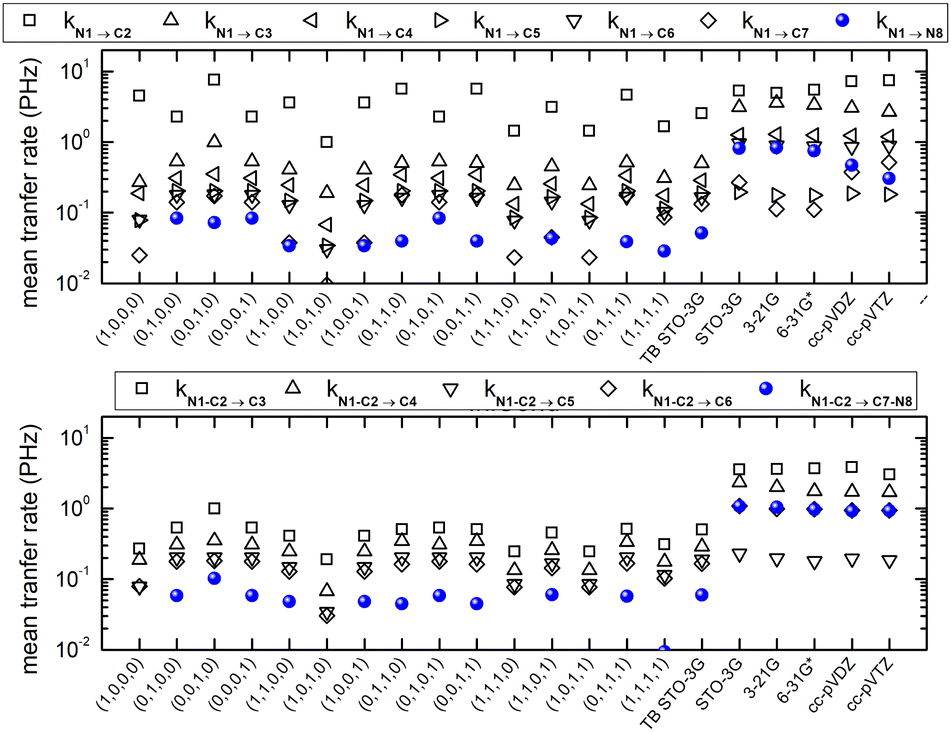 | ||
| Fig. 16 Mean hole transfer rates in N2C6 with TB and RT-TDDFT. Static case. | ||
Computing carrier transfer rates in the presence of vibrations is only really meaningful if the frequency of carrier transfer is much larger than the frequency of molecular vibrations. Looking e.g. at Fig. 9 and 4 for polyynes, the reader can be convinced that this does appear to be the case. For such linear molecules, our calculations show that: (a) zero-point motion has almost negligible influence on the mean over time probability (TB) or mean excess charge (RT-TDDFT) to find the hole at an atom. (b) Transfer rates to middle atoms depend somehow on the basis set, probably due to orbital-based population analyses inherent weaknesses. (c) However, the transfer rate from one end of the molecule to the other end does not depend much on the basis set and it is a decreasing function of the molecular length. (d) For our linear molecules, inclusion of zero-point motion only slightly affects hole transfer rates. These findings are illustrated in Fig. 17, which shows a comparison of carrier transfer rates between the static configuration and the average over Monte Carlo samples, accounting for molecular vibrations, for polyynes as well as for dicyanopolyynes. For polnsl molecules, the number of short bonds is n/2 and the number of long bonds is n/2 − 1. Looking at Fig. 3 and taking the short bond length ≈1.2 Å and the long bond length ≈1.35 Å, we obtain the transfer length (ignoring the length of the C–H bonds since the hole is created at a carbon atom) as = (n/2)1.2 Å + (n/2 − 1)1.35 Å. An exponential fit of the form k() = k0e−β gives k0 ≈ 6.95 ± 0.43 PHz and β ≈ 0.22 ± 0.02 Å−1, in accordance with experiments in polyene and polyyne bridges, where β ≈ 0.2–0.6 Å−1 were obtained.104–106 Let us now translate these transfer rates to currents, according to I = ke, e being the elementary charge. Then, k0 corresponds to a current I0 = ek0 ≈ 1 mA. Measuring the length in Å, = α Å, we obtain I ≈ e−0.22α mA. That is, for 1 nm = 10 Å, we obtain I ≈ 0.11 mA. An exponential fit (cf. also ref. 45) of the form k() = k0e−β for geometrically optimized cumulenes and polyynes at the B3LYP/cc-pVTZ level of theory with NC = 7, …, 20, gives β ≈ 0.11 ± 0.02 Å−1, whereas experimental measurements105 give β ≈ 0.12 ± 0.06 Å−1.
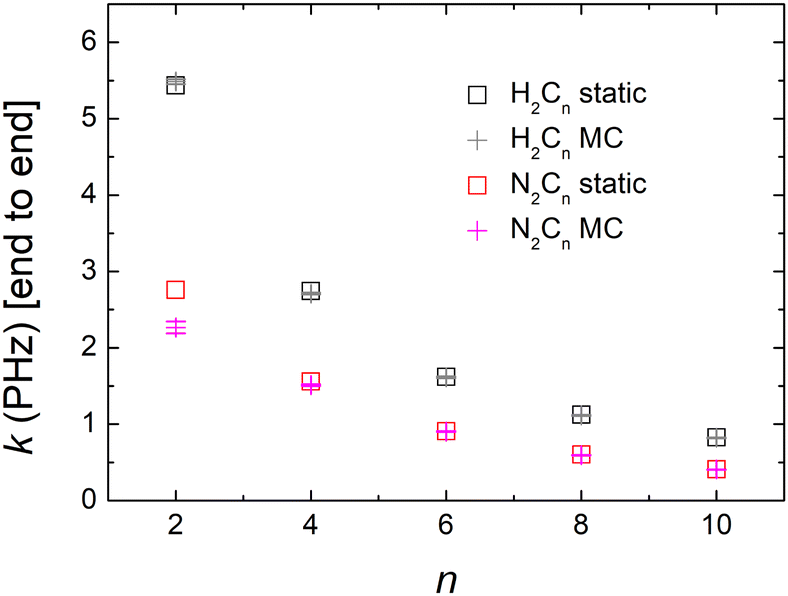 | ||
| Fig. 17 Hole transfer rates. Comparison between the static configuration (B3LYP/cc-pVDZ level of theory) and the average over Monte Carlo samples, accounting for molecular vibrations, for polyynes and dicyanopolyynes. Standard errors are shown, but are almost invisible at this scale. (a) Black and gray symbols: end (HC–) to end (–CH) hole mean transfer rate in polyynes, i.e., H2Cn molecules. (b) Red and magenta symbols: end (NC–) to end (–CN) hole mean transfer rate in dicyanopolyynes, i.e., N2Cn molecules. | ||
The influence of zero-point motion on mean over time probability (TB) or mean excess charge (RT-TDDFT) at each atom, for CnN2 molecules is rather small. Also, these do not depend much on the basis set. Apart from n = 2, the transfer rate from one end (NC–) to the other end (–CN) does not depend much on the basis set. Transfer rates to middle atoms depend somehow on the basis set, probably due to orbital-based population analyses inherent weaknesses. The transfer rate from one end (NC–) to the other end (–CN) is a decreasing function of length, cf.Fig. 17. For CnN2 molecules, we have two short N–C bonds, the number of long C–C bonds is n/2 and the number of short C–C bonds is n/2 − 1. Looking at Fig. 3, and taking the N–C bond 1.17 Å, the short C–C bond length 1.2 Å and the long C–C bond length 1.35 Å, we can calculate the transfer length (including the length of the N–C bonds since the hole is created at a nitrogen atom) as = 2 × 1.17 + (n/2) 1.35 + (n/2 − 1) 1.22 Å. An exponential fit of the form k() = k0e−β gives k0 ≈ 5.80 ± 0.29 PHz and β ≈ 0.20 ± 0.01 Å−1, for the static case, whereas for the average over Monte Carlo samples we get k0 ≈ 4.30 ± 0.13 PHz and β ≈ 0.17 ± 0.01 Å−1. In our linear molecules, inclusion of zero-point motion does not change transfer rates, except for a small effect in N2C2. We are not aware of experimental estimations of β for dicyanopolyynes.
4 Conclusion and perspectives
In this work, we employed TB- and DFT-based tools to study the electronic structure, absorption spectra, and hole transfer properties of the first members in the series of polyynes and dicyanopolyynes. Geometry optimization shows that the length of both series increases linearly, and the latter are slightly longer for the same number of carbon atoms.The DFT-based calculation of the ionization energy as total energy difference between neutral and ionized molecule generally follows closely the available experimental results, for both series, polyynes and dicyanopolyynes. With the parametrization introduced by us, the absolute value of the HOMO energy obtained by TB follows a similar trend, close to the experimental results. The absolute value of the HOMO energy obtained by DFT follows a similar trend but far below the experimental ionization energies.
Regarding excitation energies, RT-TDDFT calculations of the absorption spectra for polyynes without the inclusion of zero-point motion are in agreement with the strong peaks found experimentally (Series B), while the inclusion of zero-point motion via a Monte Carlo sampling technique reveals weaker peaks at smaller energy regions, again in agreement with the weak peaks found experimentally (Series A). The latter peaks are close to the HOMO–LUMO gap predicted by TB. Agreement between RT-TDDFT-based absoprtion spectra and experiment occurs for dicyanopolyynes, as well (where results are available). Generally, the inclusion of zero-point motion yields small corrections to results obtained for the static (frozen) configurations in these linear molecules, contrary to cyclic ones.9
Furthermore, our TB method which takes into account all valence orbitals of all atoms was recruited to study the character of molecular orbitals of polyynes and dicyanopolyynes. This technique can be applied to other molecules, as well.
Our study of oxidation dynamics, by creating a localized hole at one end of the chain, reveals efficient end-to-end charge transfer for both TB and RT-TDDFT.
In this work we have studied transfer rates in short chains, i.e., in oligomers. It is certainly interesting to expand to long chains. With 6 carbon atoms the polymer length is of the order of 1 nm, cf.Fig. 1 and 3. However, it is now possible to produce long and stable chains composed of more than 6000 carbon atoms inside double-walled carbon nanotubes.13 Those chains have a length of the order of 1 μm. Hence, either by producing even longer chains or by combining these long chains in a matrix and allowing hopping between chains, it is possible to reach mm scales, something that would have applications in industry.
We also found that if we translate transfer rates to currents, according to I = ke, measuring the length in Å, = α Å, we obtain e.g. in polyynes I ≈ e−0.22α mA, i.e., for 1 nm = 10 Å, we obtain I ≈ 0.11 mA. Similarly, for dicyanopolyynes. These are not negligible currents.
Furthermore, it is interesting to study charge transport, i.e., study current–voltage curves and conductivity, initially in such short chains and later in long chains. Charge transport in short cumulenes and polyynes has already been studied by us in a TB model using only one orbital per site.107 Here, we have developed a TB model that uses all valence orbitals of all atoms. Hence, is would be interesting to examine how inclusion of all valence orbitals improves our approach.
The transfer rates predicted by our TB model including all valence orbitals are lower than the ones predicted by RT-TDDFT, cf.Fig. 16 and 10, although much closer than the ones obtained by us in ref. 107 using the simple TB model which included only one 2px or 2pz orbital per site. This is because now we allow both 2px 2px π and 2pz 2pz π paths as well as the s2py s2py σ path for transfer. Maybe, we should try to include at each site orbitals higher than the valence orbitals. We will hopefully try this TB version in the future.
Author contributions
Author contributions: conceptualization, CS; methodology, CS, KL, LC; software, CS, KL, LC; validation, CS, KL, LC; formal analysis, CS, KL, LC; investigation, CS, KL, LC; resources, CS; data curation, CS, KL, LC; writing – original draft preparation, CS; writing – review and editing, CS; visualization, CS; supervision, CS; project administration, CS; funding acquisition, CS. All authors have read and agreed to the published version of the manuscript.Data availability
Data supporting this article have been included as part of the ESI.† We also include online ESI.† NWChem is a free online software.61 The matlab code for TB calculations will be available upon request.Conflicts of interest
There are no conflicts to declare.Acknowledgements
This work was partially supported by computational time granted from the Greek Research and Technology Network (GRNET) in the National HPC facility (ARIS) under Project IDs pr011031_thin and pr013026_thin, Charge Movement in atom-thick Nanowires based on Bioelements (MONanoBio). We thank Dr Antonios – Markos Alvertis (NASA Ames Research Center and Lawrence Berkeley National Lab) for careful readings of the manuscript and suggestions as well as for discussions about zero-point motion. We thank Dr Andreas Morphis (National and Kapodistrian University of Athens) for discussions concerning Löwdin population analysis. We thank Professor Paul Corkum (Advanced Research Complex, University of Ottawa) for suggesting literature relevant to attosecond experiments in molecules.Notes and references
- Nobel Prize in Physics, Press release. Nobel Prize Outreach, 9 October 2023, The Royal Swedish Academy of Sciences. Nobel Foundation, Stockholm, Sweden, 2023.
- M. Ferray, A. L'Huillier, X. F. Li, L. A. Lompre, G. Mainfray and C. Manus, J. Phys. B: At., Mol. Opt. Phys., 1988, 21, L31–L35 CrossRef CAS.
- A. L'Huillier, K. J. Schafer and K. C. Kulander, J. Phys. B: At., Mol. Opt. Phys., 1991, 24, 3315–3341 CrossRef.
- P. M. Paul, E. S. Toma, P. Breger, G. Mullot, F. Augé, P. Balcou, H. G. Muller and P. Agostini, Science, 2001, 292, 1689–1692 CrossRef CAS PubMed.
- M. Hentschel, R. Kienberger, C. Spielmann, G. A. Reider, N. Milosevic, T. B. P. Corkum, U. Heinzmann, M. Drescher and F. Krausz, Nature, 2001, 414, 509–513 CrossRef CAS PubMed.
- F. Calegari, D. Ayuso, A. Trabattoni, L. Belshaw, S. D. Camillis, S. Anumula, F. Frassetto, L. Poletto, A. Palacios, P. Decleva, J. B. Greenwood, F. Martín and M. Nisoli, Science, 2014, 346, 336–339 CrossRef CAS.
- A. H. Zewail, Angew. Chem., Int. Ed., 2000, 39, 2586–2631 CrossRef CAS PubMed.
- F. Calegari and F. Martin, Commun. Chem., 2023, 6, 184 CrossRef PubMed.
- K. Lambropoulos, A. M. Alvertis, A. Morphis and C. Simserides, Phys. Chem. Chem. Phys., 2022, 24, 7779–7787 RSC.
- M. Mantela, A. Morphis, K. Lambropoulos, C. Simserides and R. Di Felice, J. Phys. Chem. B, 2021, 125, 3986–4003 CrossRef CAS PubMed.
- A. S. Folorunso, F. Mauger, K. A. Hamer, D. D. Jayasinghe, I. S. Wahyutama, J. R. Ragains, R. R. Jones, L. F. DiMauro, M. B. Gaarde, K. J. Schafer and K. Lopata, J. Phys. Chem. A, 2023, 127, 1894–1900 CrossRef CAS.
- W. A. Chalifoux and R. R. Tykwinski, Nat. Chem., 2010, 2, 967–971 CrossRef CAS PubMed.
- L. Shi, P. Rohringer, K. Suenaga, Y. Niimi, J. Kotakoski, J. C. Meyer, H. Peterlik, M. Wanko, S. Cahangirov, A. Rubio, Z. J. Lapin, L. Novotny, P. Ayala and T. Pichler, Nat. Mater., 2016, 15, 634–639 CrossRef CAS PubMed.
- O. Cretu, A. R. Botello-Mendez, I. Janowska, C. Pham-Huu, J.-C. Charlier and F. Banhart, Nano Lett., 2013, 13, 3487–3493 CrossRef CAS PubMed.
- G. Wu and J. Dong, Phys. Rev. B: Condens. Matter Mater. Phys., 2005, 71, 115410 CrossRef.
- X. Liu, G. Zhang and Y.-W. Zhang, J. Phys. Chem. C, 2015, 119, 24156–24164 CrossRef CAS.
- M. Wang and S. Lin, Sci. Rep., 2016, 5, 18122 CrossRef PubMed.
- Y. Deng and S. W. Cranford, Comput. Mater. Sci., 2017, 129, 226–230 CrossRef CAS.
- M. Tommasini, A. Milani, D. Fazzi, M. Del Zoppo, C. Castiglioni and G. Zerbi, Phys. E, 2008, 40, 2570–2576 CrossRef CAS.
- A. Milani, M. Tommasini and G. Zerbi, J. Chem. Phys., 2008, 128, 064501 CrossRef.
- N. R. Agarwal, A. Lucotti, D. Fazzi, M. Tommasini, C. Castiglioni, W. A. Chalifoux and R. R. Tykwinski, J. Raman Spectrosc., 2013, 44, 1398–1410 CrossRef CAS.
- A. K. Nair, S. W. Cranford and M. J. Buehler, EPL, 2011, 95, 16002 CrossRef.
- A. La Torre, A. Botello-Mendez, W. Baaziz, J.-C. Charlier and F. Banhart, Nat. Commun., 2015, 6, 6636 CrossRef CAS.
- M. Tommasini, D. Fazzi, A. Milani, M. Del Zoppo, C. Castiglioni and G. Zerbi, Chem. Phys. Lett., 2007, 450, 86–90 CrossRef CAS.
- A. La Magna, I. Deretzis and V. Privitera, Eur. Phys. J. B, 2009, 70, 311–316 CrossRef CAS.
- P. N. D'yachkov, V. A. Zaluev, E. Y. Kocherga and N. R. Sadykov, J. Phys. Chem. C, 2013, 117, 16306–16315 CrossRef.
- F. Ben Romdhane, J.-J. Adjizian, J.-C. Charlier and F. Banhart, Carbon, 2017, 122, 92–97 CrossRef CAS.
- A. Milani, V. Barbieri, A. Facibeni, V. Russo, A. Li Bassi, A. Lucotti, M. Tommasini, M. D. Tzirakis, F. Diederich and C. S. Casari, Sci. Rep., 2019, 9, 1648 CrossRef CAS PubMed.
- F. D. Lewis, T. Wu, Y. Zhang, R. L. Letsinger, S. R. Greenfield and M. R. Wasielewski, Science, 1997, 277, 673–676 CrossRef CAS PubMed.
- C. Wan, T. Fiebig, O. Schiemann, J. K. Barton and A. H. Zewail, Proc. Natl. Acad. Sci. U. S. A., 2000, 97, 14052–14055 CrossRef CAS PubMed.
- J. Vura-Weis, M. R. Wasielewski, A. K. Thazhathveetil and F. D. Lewis, J. Am. Chem. Soc., 2009, 131, 9722–9727 CrossRef CAS.
- S. M. Mickley Conron, A. K. Thazhathveetil, M. R. Wasielewski, A. L. Burin and F. D. Lewis, J. Am. Chem. Soc., 2010, 132, 14388–14390 CrossRef.
- K. Kawai and T. Majima, Acc. Chem. Res., 2013, 46, 2616–2625 CrossRef CAS.
- M. Fujitsuka and T. Majima, Chem. Sci., 2017, 8, 1752–1762 RSC.
- T. Takada, K. Kawai, M. Fujitsuka and T. Majima, Proc. Natl. Acad. Sci. U. S. A., 2004, 101, 14002–14006 CrossRef CAS PubMed.
- C. Simserides, A. Morphis and K. Lambropoulos, J. Phys. Chem. C, 2020, 124, 12834–12849 CrossRef CAS.
- M. Liu, V. I. Artyukhov, H. Lee, F. Xu and B. I. Yakobson, ACS Nano, 2013, 7, 10075–10082 CrossRef CAS.
- A. Saura-Sanmartin, Nat. Chem., 2024, 16, 154–156 CrossRef CAS.
- T. Grösser and A. Hirsch, Angew. Chem., Int. Ed. Engl., 1993, 32, 1340–1342 CrossRef.
- G. Schermann, T. Grösser, F. Hampel and A. Hirsch, Chem. – Eur. J., 1997, 3, 1105–1112 CrossRef CAS.
- A. Scemama, P. Chaquin, M.-C. Gazeau and Y. Bénilan, J. Phys. Chem. A, 2002, 106, 3828–3837 CrossRef CAS.
- A. Scemama, P. Chaquin, M.-C. Gazeau and Y. Bénilan, Chem. Phys. Lett., 2002, 361, 520–524 CrossRef CAS.
- J.-L. Bredas, Mater. Horiz., 2014, 1, 17–19 RSC.
- C. Simserides, A. Morphis and K. Lambropoulos, Materials, 2020, 13, 3979 CrossRef CAS PubMed.
- A. Morphis, PhD Thesis, National and Kapodistrian University of Athens, Greece, 2023 Search PubMed.
- W. A. Harrison, Electronic Structure and the Properties of Solids: the Physics of the Chemical Bond, Dover, New York, 2nd edn, 1989 Search PubMed.
- W. A. Harrison, Elementary Electronic Structure, World Scientific, River Edge, NJ, 1999 Search PubMed.
- F. Banhart, Beilstein J. Nanotechnol., 2015, 6, 559–569 CrossRef CAS PubMed.
- S. Cahangirov, M. Topsakal and S. Ciraci, Phys. Rev. B: Condens. Matter Mater. Phys., 2010, 82, 195444 CrossRef.
- V. I. Artyukhov, M. Liu and B. I. Yakobson, Nano Lett., 2014, 8, 4224–4229 CrossRef.
- F. Cataldo, Polyhedron, 2004, 23, 1889–1896 CrossRef CAS.
- S. Petrie and Y. Osamura, J. Phys. Chem. A, 2004, 108, 3623–3631 CrossRef CAS.
- M. Agúndez, J. Cernicharo, P. de Vicente, N. Marcelino, E. Roueff, A. Fuente, M. Gerin, M. Guélin, C. Albo, A. Barcia, L. Barbas, R. Bolaño, F. Colomer, M. C. Diez, J. D. Gallego, J. Gómez-González, I. López-Fernández, J. A. López-Fernández, J. A. López-Pérez, I. Malo, J. M. Serna and F. Tercero, Astron. Astrophys., 2015, 579, L10 CrossRef.
- M. Agúndez, N. Marcelino and J. Cernicharo, Astrophys. J. Lett., 2018, 861, L22 CrossRef.
- M. Agúndez, C. Cabezas, N. Marcelino, R. Fuentetaja, B. Tercero, P. de Vicente and J. Cernicharo, Astron. Astrophys., 2023, 669, L1 CrossRef.
- J. C. Slater and G. F. Koster, Phys. Rev., 1954, 94, 1498–1524 CrossRef CAS.
- P. Hohenberg and W. Kohn, Phys. Rev., 1964, 136, B864 CrossRef.
- W. Kohn and L. J. Sham, Phys. Rev., 1965, 140, A1133 CrossRef.
- E. Runge and E. K. U. Gross, Phys. Rev. Lett., 1984, 52, 997 CrossRef CAS.
- K. Lopata and N. Govind, J. Chem. Theory Comput., 2011, 7, 1344 CrossRef CAS PubMed.
- E. Aprà, E. J. Bylaska, W. A. de Jong, N. Govind, K. Kowalski, T. P. Straatsma, M. Valiev, H. J. J. van Dam, Y. Alexeev, J. Anchell, V. Anisimov, F. W. Aquino, R. Atta-Fynn, J. Autschbach, N. P. Bauman, J. C. Becca, D. E. Bernholdt, K. Bhaskaran-Nair, S. Bogatko, P. Borowski, J. Boschen, J. Brabec, A. Bruner, E. Cauët, Y. Chen, G. N. Chuev, C. J. Cramer, J. Daily, M. J. O. Deegan, T. H. Dunning Jr., M. Dupuis, K. G. Dyall, G. I. Fann, S. A. Fischer, A. Fonari, H. Früchtl, L. Gagliardi, J. Garza, N. Gawande, S. Ghosh, K. Glaesemann, A. W. Götz, J. Hammond, V. Helms, E. D. Hermes, K. Hirao, S. Hirata, M. Jacquelin, L. Jensen, B. G. Johnson, H. Jónsson, R. A. Kendall, M. Klemm, R. Kobayashi, V. Konkov, S. Krishnamoorthy, M. Krishnan, Z. Lin, R. D. Lins, R. J. Littlefield, A. J. Logsdail, K. Lopata, W. Ma, A. V. Marenich, J. Martin del Campo, D. Mejia-Rodriguez, J. E. Moore, J. M. Mullin, T. Nakajima, D. R. Nascimento, J. A. Nichols, P. J. Nichols, J. Nieplocha, A. Otero-de-la Roza, B. Palmer, A. Panyala, T. Pirojsirikul, B. Peng, R. Peverati, J. Pittner, L. Pollack, R. M. Richard, P. Sadayappan, G. C. Schatz, W. A. Shelton, D. W. Silverstein, D. M. A. Smith, T. A. Soares, D. Song, M. Swart, H. L. Taylor, G. S. Thomas, V. Tipparaju, D. G. Truhlar, K. Tsemekhman, T. Van Voorhis, A. Vázquez-Mayagoitia, P. Verma, O. Villa, A. Vishnu, K. D. Vogiatzis, D. Wang, J. H. Weare, M. J. Williamson, T. L. Windus, K. Woliński, A. T. Wong, Q. Wu, C. Yang, Q. Yu, M. Zacharias, Z. Zhang, Y. Zhao and R. J. Harrison, J. Chem. Phys., 2020, 152, 184102 CrossRef.
- P. Löwdin, J. Chem. Phys., 1950, 18, 365–375 CrossRef.
- A. Becke, J. Chem. Phys., 1993, 98, 5648–5652 CrossRef CAS.
- C. Lee, W. Yang and R. G. Parr, Phys. Rev. B: Condens. Matter Mater. Phys., 1988, 37, 785–789 CrossRef CAS PubMed.
- S. H. Vosko, L. Wilk and M. Nusair, Can. J. Phys., 1980, 58, 1200–1211 CrossRef CAS.
- P. J. Stephens, F. J. Devlin, C. F. Chabalowski and M. J. Frisch, J. Phys. Chem., 1994, 98, 11623–11627 CrossRef CAS.
- M. Mohammadzaheri, S. Jamehbozorgi, M. D. Ganji, M. Rezvani and Z. Javanshir, Phys. Chem. Chem. Phys., 2023, 25, 21492–21508 RSC.
- J. S. Binkley, J. A. Pople and W. J. Hehre, J. Am. Chem. Soc., 1980, 102, 939–947 CrossRef CAS.
- T. Clark, J. Chandrasekhar, G. W. Spitznagel and P. Von Ragué Schleyer, J. Comput. Chem., 1983, 4, 294–301 CrossRef CAS.
- W. J. Hehre, R. Ditchfield and J. A. Pople, J. Chem. Phys., 1972, 56, 2257–2261 CrossRef CAS.
- P. C. Hariharan and J. A. Pople, Theor. Chim. Acta, 1973, 28, 213–222 CrossRef CAS.
- W. J. Hehre, R. Ditchfield and J. A. Pople, J. Chem. Phys., 1972, 56, 2257–2261 CrossRef CAS.
- P. C. Hariharan and J. A. Pople, Theor. Chim. Acta, 1973, 28, 213–222 CrossRef CAS.
- R. Ditchfield, W. J. Hehre and J. A. Pople, J. Chem. Phys., 1971, 54, 724–728 CrossRef CAS.
- R. Krishnan, J. S. Binkley, R. Seeger and J. A. Pople, J. Chem. Phys., 1980, 72, 650–654 CrossRef CAS.
- T. H. Dunning, J. Chem. Phys., 1989, 90, 1007–1023 CrossRef CAS.
- R. A. Kendall, T. H. Dunning and R. J. Harrison, J. Chem. Phys., 1992, 96, 6796–6806 CrossRef CAS.
- W. J. Hehre, R. F. Stewart and J. A. Pople, J. Chem. Phys., 1969, 51, 2657–2664 CrossRef CAS.
- A. Miglio, V. Brousseau-Couture, E. Godbout, G. Antonius, Y.-H. Chan, S. G. Louie, C. Michel, M. Giantomassi and X. Gonze, npj Comput. Mater., 2020, 6, 167 CrossRef.
- T. J. H. Hele, B. Monserrat and A. M. Alvertis, J. Chem. Phys., 2021, 154, 244109 CrossRef CAS PubMed.
- B. Monserrat, J. Phys.: Condens. Matter, 2018, 30, 083001 CrossRef.
- A. M. Alvertis and E. A. Engel, Phys. Rev. B, 2022, 105, L180301 CrossRef CAS.
- A. M. Alvertis, J. B. Haber, E. A. Engel, S. Sharifzadeh and J. B. Neaton, Phys. Rev. Lett., 2023, 130, 086401 CrossRef CAS PubMed.
- R. Crespo-Otero and M. Barbatti, Theor. Chem. Acc., 2012, 131, 1–14 Search PubMed.
- S. Bai, R. Mansour, L. Stojanović, J. M. Toldo and M. Barbatti, J. Mol. Model., 2020, 26, 107 CrossRef CAS PubMed.
- W. L. Hase, R. J. Duchovic, X. Hu, A. Komornicki, K. F. Lim, D.-H. Lu, G. H. Peslherbe, K. N. Swamy, S. V. Linde, A. Varandas and R. J. Wolf, QCPE, 1996, 16, 671 Search PubMed.
- G. H. Peslherbe, H. Wang and W. L. Hase, in Monte Carlo Methods in Chemical Physics, ed. I. Prigogine and S. A. Rice, John Wiley & Sons, Ltd, 1999, ch. Monte Carlo Sampling for Classical Trajectory Simulations, vol. 105, pp. 171–201 Search PubMed.
- C. Simserides, Chem. Phys., 2014, 440, 31–41 CrossRef CAS.
- R. I. Kaiser, B. J. Sun, H. M. Lin, A. H. H. Chang, A. M. Mebel, O. Kostko and M. Ahmed, Astrophys. J., 2010, 719, 1884 CrossRef CAS.
- P. Plessis and P. Marmet, Int. J. Mass Spectrom. Ion Processes, 1986, 70, 23–44 CrossRef CAS.
- G. Bieri, A. Schmelzer, L. Åsbrink and M. Jonsson, Chem. Phys., 1980, 49, 213–224 CrossRef CAS.
- G. Bieri, F. Burger, E. Heilbronner and J. P. Maier, Helv. Chim. Acta, 1977, 60, 2213–2233 CrossRef CAS.
- M. Allan, E. Heilbronner, E. Kloster-Jensen and J. Maier, Chem. Phys. Lett., 1976, 41, 228–230 CrossRef CAS.
- R. Gleiter and G. Haberhauer, Aromaticity and Other Conjugation Effects, Wiley-VCH, 1st edn, 2012 Search PubMed.
- E. Kloster-Jensen, H.-J. Haink and H. Christen, Helv. Chim. Acta, 1974, 57, 1731–1744 CrossRef CAS.
- L. Åsbrink, W. von Niessen and G. Bieri, J. Electron Spectrosc. Relat. Phenom., 1980, 21, 93–101 CrossRef.
- G. Bieri, E. Heilbronner, V. Hornung, E. Kloster-Jensen, J. P. Maier, F. Thommen and W. von Niessen, Chem. Phys., 1979, 36, 1–14 CrossRef CAS.
- S. Leach, M. Schwell, G. A. Garcia, Y. Benilan, N. Fray, M.-C. Gazeau, F. Gaie-Levrel, N. Champion and J.-C. Guillemin, J. Chem. Phys., 2013, 139, 184304 CrossRef.
- R. E. Connors, J. L. Roebber and K. Weiss, J. Chem. Phys., 1974, 60, 5011–5024 CrossRef CAS.
- G. Herzberg, Molecular spectra and molecular structure, D. van Nostrand, 1945 Search PubMed.
- R. B. Mooney and H. G. Reid, Nature, 1931, 128, 271–272 CrossRef CAS.
- R. B. Mooney and H. G. Reid, Proc. R. Soc. Edinburgh, 1933, 52, 152–158 CrossRef.
- S.-C. Woo and R. M. Badger, Phys. Rev., 1932, 39, 932–937 CrossRef CAS.
- J. M. Tour, Chem. Rev., 1996, 96, 537–554 CrossRef CAS PubMed.
- V. Grosshenny, A. Harriman and R. Ziessel, Angew. Chem., Int. Ed. Engl., 1996, 34, 2705–2708 CrossRef.
- S. B. Sachs, S. P. Dudek, R. P. Hsung, L. R. Sita, J. F. Smalley, M. D. Newton, S. W. Feldberg and C. E. D. Chidsey, J. Am. Chem. Soc., 1997, 119, 10563–10564 CrossRef CAS.
- K. Lambropoulos and C. Simserides, Phys. Chem. Chem. Phys., 2017, 19, 26890–26897 RSC.
Footnotes |
| † Electronic supplementary information (ESI) available. See DOI: https://doi.org/10.1039/d4cp02719a |
| ‡ Charge transfer refers to intramolecular or intermolecular motion of electrical carriers in the absence of an external driving force (e.g. voltage, temperature gradient). After oxidation or reduction, a hole or an extra electron, respectively, are initially created or injected at a site of a molecular system; subsequently, the carrier spontaneously moves to other energetically more favorable sites. Charge transport implies application of an external driving force. |
| This journal is © the Owner Societies 2024 |