
 Open Access Article
 This Open Access Article is licensed under a
 Creative Commons Attribution 3.0 Unported Licence
Water adsorption at the (010) and (101) surfaces of CuWO4†
Xuan
Chu
 a,
David
Santos-Carballal
*a and
Nora H.
de Leeuw
*ab
a,
David
Santos-Carballal
*a and
Nora H.
de Leeuw
*ab
aSchool of Chemistry, University of Leeds, Leeds LS2 9JT, UK. E-mail: cmxch@leeds.ac.uk; d.santos-carballal@leeds.ac.uk
bDepartment of Earth Sciences, Utrecht University, Princetonplein 8A, 3584 CD Utrecht, The Netherlands. E-mail: n.h.deleeuw@leeds.ac.uk
First published on 8th October 2024
Abstract
Copper tungstate (CuWO4) has attracted significant attention over the past two decades. However, the adsorption of water onto CuWO4, which plays a critical role in the photocatalytic water splitting process, has not been investigated in detail. In this study, we have employed density functional theory (DFT) calculations to investigate water adsorption onto the CuWO4 pristine (010) and reduced (101) surfaces. Surface phase diagrams as a function of temperature and partial pressure of H2O were also constructed to determine water coverage under particular environmental conditions. Our study provides a comprehensive understanding of the adsorption of water on the major CuWO4 surfaces, which is an important preliminary step in our investigation of photocatalytic water splitting over CuWO4.
1. Introduction
The depletion of fossil fuels and accumulation of atmospheric CO2 is a global challenge, simultaneously causing an international energy shortage and climate change.1 Solar energy, an inexhaustible, sustainable, and decentralized natural energy resource, is a suitable alternative for coal, oil, and natural gas.2 However, the approximately 105 terawatts per year (TW year−1) of sun radiation on the surface of the Earth, which far exceeds current global needs of about 30 TW year−1, has not been utilized comprehensively owing to the key challenges of solar energy harvesting and storage.3 Since publication of the well-known Honda–Fujishima effect of TiO2 in 1972,4 photocatalytic water splitting, which provides a promising route to convert and store solar energy into a carbon-neutral H2 fuel, has attracted increasing attention.5–9In order to achieve industrial-scale utilization of photocatalytic water splitting to generate H2, we first need to gain understanding of the interaction between the water molecules and the catalytic surfaces. Water has a complex structure when it interacts with a surface and is capable of forming 2-dimensional structures as well as 3-dimensional cage-like structures.10–13 Several reviews have mentioned that the anomalies and unique nature of water are primarily due to the tetrahedral organisation of hydrogen-bonding.14–16 It is widely accepted that one of the key challenges of modelling H2O–surface interactions are the high fluctuations of the extensive H-bond networks.17–19
Metal oxides, such as TiO2,20 ZnO,21 and WO3,22 have been employed in photocatalytic water splitting. However, TiO2 has a relatively large bandgap of 3.2 eV, which leads to a narrow range of visible light absorption,20 whereas ZnO suffers severely from a high rate of charge recombination.21 WO3 has poor chemical stability under either neutral or acidic conditions, although it exhibits a high electron diffusion length and mobility.22 Recently, copper tungstate (CuWO4), an n-type semiconductor, has attracted increasing interest as a potential photocatalyst for the water splitting process to generate and store H2, owing to its earth abundancy, non-toxicity, and suitable bandgap of 2.4 eV.23–26 Various studies have provided a comprehensive understanding of CuWO4 as to its crystal morphology,27 redox properties of the surface,28 physiochemical properties,29 and photocatalytic potential.30–37 The conventional CuWO4 unit cell is composed of two CuO6 octahedral and WO6 octahedral structures with shared zigzag oxygen chains. The bulk material has triclinic P![[1 with combining macron]](https://www.rsc.org/images/entities/char_0031_0304.gif) symmetry due to the Jahn–Teller effect, which breaks the Cu 3d eg orbital degeneracy. Our previous study has shown that the valence band is mainly composed of O 2p states mixed with Cu 3d states, which are located between −6.5 and −4 eV. The conduction band, which comprises Cu 3d states mixed with O 2p and W 5d levels, lies between 2.3 and 3.1 eV. The calculated bandgap of the bulk CuWO4 is 2.3 eV, which is consistent with the experimental result.28 The structural and electronic properties of all 7 low-Miller index surfaces of CuWO4 have been discussed in our previous work.28
symmetry due to the Jahn–Teller effect, which breaks the Cu 3d eg orbital degeneracy. Our previous study has shown that the valence band is mainly composed of O 2p states mixed with Cu 3d states, which are located between −6.5 and −4 eV. The conduction band, which comprises Cu 3d states mixed with O 2p and W 5d levels, lies between 2.3 and 3.1 eV. The calculated bandgap of the bulk CuWO4 is 2.3 eV, which is consistent with the experimental result.28 The structural and electronic properties of all 7 low-Miller index surfaces of CuWO4 have been discussed in our previous work.28
In this study, we have carried out calculations based on the density functional theory (DFT) to predict the interaction of water with the pristine (010) and reduced (101) CuWO4 surfaces. The structural and electronic properties of the hydrated systems, including bond lengths, adsorption energies, charge transfer, vibrational frequencies of H2O, and the work functions, were calculated to characterize and evaluate the different adsorption modes. The phase diagrams of the two surfaces have also been obtained as a function of temperature and partial pressure of H2O to determine the coverage of the surface under specific conditions. Our study aims to provide a comprehensive understanding of the interaction of water with CuWO4 surfaces and guide future studies in utilizing this material for the photocatalytic splitting of water, where adsorption is necessarily the first step in the process before water dissociation and catalytic conversion into hydrogen and oxygen can take place.
2. Computational details
2.1 DFT calculations
In this work, we performed DFT calculations using the Vienna ab initio simulation package (VASP).38,39 The core states of Cu: [Ar], W: [Xe], O: [He], and their interactions with the valence orbitals were treated using the projector augmented wave (PAW) formalism,40 whereas their remaining electrons and that of the H atom was treated as valence electrons. The Perdew–Burke–Ernzerhof (PBE) functional was employed to calculate the exchange–correlation energy.41 The long-range component of the van der Waals interactions was corrected using the D3 method with Becke–Johnson damping.42 We used periodic plane wave basis sets with a cut-off energy of 400 eV for the expansion of the Kohn–Sham valence states. The energy cutoff was tested from 400 to 800 eV, but as the effect on energy differences was negligible, we have selected 400 eV for all our calculations. We applied the DFT+U method to correct the electronic self-interaction in the transition metal d orbitals caused by the pure GGA functionals.43 We tested the onsite Coulomb interaction term (Ueff)44 for both cations between 3 and 10 eV, and found that only Cu needs this correction. We selected Ueff = 7.5 eV, as this value provides the best description of the lattice parameters and the bandgap with respect to the experimental data. Our tests suggested that the U correction is unnecessary for the W atoms since they lose all their d electrons upon formation of CuWO4. An alternative way to accurately describe the electronic properties of transition metal compounds is through the use of hybrid functionals. However, this method requires significantly more computational resources compared to DFT+U when applied to a surface model. Thus, we have opted in this work to follow the DFT+U approach, as it has shown to work well for our material.28 The bulk material was modelled using the triclinic primitive unit cell containing 12 atoms (Cu2W2O8), which was sampled in the reciprocal space using a Γ-centered 4 × 3 × 4 k-points mesh.45 The isolated H2O molecule was modelled in an 8 × 8 × 8 Å3 periodic box to avoid the influence of images in adjacent simulation cells, where only the Γ point was sampled. We have used the conjugate gradients algorithm to optimize the geometries of the surfaces until the Hellmann–Feynman forces on each atom were smaller than 10−2 eV Å−1 and the energy difference between consecutive steps of the self-consistent loop was below 10−6 eV.462.2 Surface models
In this study, we used the dipole method proposed by Tasker to construct the pristine low-Miller index (010), (101), and (110) surfaces.47 This method creates surfaces in such a way that no dipole moment exists perpendicular to the surface. The method considers the crystal as a stack of planes, which can be classified into three types. In type 1, each plane has no net charge, as it is composed of cations and anions in stoichiometric ratio, which makes the surface non-polar. In type 2, an integer number of formula units is contained within several charged layers, which are stacked in a symmetric fashion that cancels the dipole moment. In type 3, there is a dipole moment perpendicular to the surface due to the non-symmetric stacking of the charged planes. Type 3 surfaces require reconstruction by moving half of the ions with the same charge from the top-most slab layer to the bottom-most to form non-polar surfaces. We employed the METADISE package to construct the low-Miller index surfaces from the bulk phase of CuWO4.48 A 10 Å vacuum was introduced perpendicular to the surface to prevent the interaction between the periodically repeated images of the CuWO4 slab and to allow space to adsorb the H2O molecules. The 2 × 2 × 1 supercells were employed to build the pristine (010), reduced (101) and oxidized (110) surfaces, which were generated from the bulk CuWO4. We used the surface slabs composed of 16 Cu atoms, 16 W atoms and 64 O atoms for the pristine (010) surface; 32 Cu atoms, 32 W atoms, 124 O atoms for the reduced (101) surface; and 32 Cu atoms, 32 W atoms, 143 O atoms for the oxidized (110) surface. The topmost 2 layers of each slab are allowed to relax during the optimization, while the bottommost 2 layers were kept fixed at their bulk-optimised positions. For the appropriate sampling of the Brillouin zone, we tested different Monkhorst–Pack k-point meshes for the low-Miller index surfaces.45 We used a 2 × 2 × 1 k-point mesh for the three surfaces. For the geometry optimisations and to obtain accurate energies, we applied the tetrahedron method with Blöchl correction for the bulk and surfaces, and Gaussian smearing for the isolated H2O molecule to account of the electron partial occupancies.49To create the reduced (101) surface, we removed one O atom from the topmost layer of the pristine surface. The oxidized (110) surface was modelled by adding three O atoms sequentially to the exposed cations with dangling bonds in the topmost surface layer. The structures of both the partially reduced and partially oxidized surfaces were fully relaxed, and the atomic configuration with the lowest surface free energy was selected for the next addition of O adatoms or O vacancies.
The surface energies of the slabs before (γu) and after (γr) relaxation were defined as:28,50
 | (1) |
 | (2) |
The H2O adsorption process on the pristine and reduced surfaces of one formula unit of CuWO4 can be described by reactions (3) and (4) respectively.
| CuWO4(s) + nH2O(g) → CuWO4+nH2n(s) | (3) |
| CuWO3(s) + nH2O(g) → CuWO3+nH2n(s) | (4) |
Based on the reactions, the surface free energy (σads(T, p)) of the CuWO4 surfaces in thermodynamic equilibrium with ideal gas phase H2O is defined as:
 | (5) |
 represents the surface coverage of the H2O molecules, n is the number of H2O molecules adsorbed on the surface, and Esys and EH2O are the relaxed energies of the CuWO4 surface slab with the adsorbed H2O molecules and the energy of an isolated H2O molecule, respectively. SH2O(T, p0) represents the entropy of gas H2O in the standard state taken from the thermodynamic tables,50pH2O is the partial pressure of H2O, T is the temperature, and R represents the ideal gas constant. VASPKIT was also used for calculating the entropy of water from 100 to 2000 K for the sake of validation.
In this work, chemisorption refers to water adsorption which involves dissociation of the water molecule and electronic structure changes leading to the formation of bonds, whereas the water molecule remains intact in physisorption which does not result in changes in the chemical bonding. The adsorption energy (Eads) of the H2O molecule on the CuWO4 surface is defined as:51
| Eads = Esys − Er − nEH2O | (6) |
We have also calculated the variation of the Helmholtz free energy, considering whether the zero-point energy and the vibrational contribution of the entropy at 298 K have an impact on the energies. However, as shown in Table S1 (ESI†) such impact is negligible, and we have therefore only focussed on the energies of the adsorption system at 0 K.
We calculated the atomic Bader charges and atomic magnetic moments via an improved grid-based algorithm.52,53 The work function (Φ), which is defined as the minimum thermodynamic energy required to remove one electron from the Fermi level (EF) at the CuWO4 surface to the vacuum level (Evac), was obtained by the following equation:28
| Φ = Evac − EF | (7) |
The charge difference (Δρ) of the surface before (ρCuWO4) and after adsorption of H2O (ρCuWO4+H2O) was defined as:54
| Δρ = ρCuWO4+H2O − ρCuWO4 − ρH2O | (8) |
We used the Tersoff–Hamann approach to simulate scanning tunnelling microscopy (STM) images, where the tunnelling current is proportional to the local density of states (LDOS) of the surface at the position of the tip integrated between the Fermi level and the applied bias.55 The HIVE program was used to generate the STM images.56
3. Results and discussion
3.1 Isolated H2O molecule
We first modelled and calculated the electronic properties of an isolated H2O molecule. Table 1 lists the calculated bond distances (d), bond angles (∠), and the unscaled and scaled asymmetric stretching (υasym), symmetric stretching (υsym) and bending (δ) fundamental vibrational modes for the isolated H2O molecule. The results suggest that our simulation of the equilibrium bond distances as well as the bond angle are in good agreement with the experimental data.56 We have calculated the harmonic vibrational modes as the second derivative of the potential energy with respect to the atomic position in the vicinity of the minimum of the well via the finite differences approach, where a positive and negative displacement of 0.015 Å is allowed for each ion in each Cartesian direction to calculate the Hessian matrix. The unscaled asymmetric stretching and symmetric stretching harmonic vibrational mode are red-shifted by 176 and 162 cm−1, respectively, whereas the bending harmonic vibrational mode is blue-shifted by 31 cm−1 compared to experiments.57,58 However, experimental vibrational modes represent transitions between the ground state and the first vibrational energy level of an anharmonic potential energy surface. Thus, we obtained the empirical factor c = 0.96 to scale our vibrational modes and make them directly comparable to the anharmonic system.50 The scaling factor was calculated as: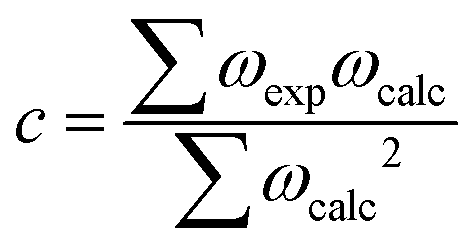 | (9) |
3.2 Crystal morphology of CuWO4
To determine the most suitable surfaces for water adsorption, we derived the Wulff crystal morphology of CuWO4 from the Miller index surfaces with the lowest surface free energies. In our previous work, we have studied the redox properties of the low-Miller index surfaces under the working conditions of the gas phase water splitting process.28 The Wulff construction of the equilibrium morphology is obtained from equation where σ and d represent the surface free energy of the surface and the distance of the surface from the centre of the crystal, respectively, and c is a constant. In our previous study,28 we have shown that under the working conditions of gas phase water splitting, i.e. 298 K, the (010) surface stayed pristine, whereas the (101) surface was reduced with a surface coverage of −2.5 nm−2 and the (110) surface was oxidized at 700 K. The equilibrium morphologies of CuWO4 at 298 K and 700 K are shown in Fig. 1a and Fig. S1 (ESI†), respectively. Note that we have ignored possible structural changes caused by thermal expansion of the material, as they are beyond the scope of this work and are likely to be negligible at the temperatures considered in this work. The pristine (010) surface dominates the morphology owing to its lowest surface free energy of 36 meV Å−2 under working conditions, as shown in the orange region in Fig. 1a. The reduced (101) surface is the second predominant facet expressed under working conditions with a surface free energy of 56 meV Å−2, shown in blue in Fig. 1a. The reduced (101) surface is characterised by one O atom vacancy, corresponding to a coverage of O vacancies of 2.5 nm−2. The dominance of these two surfaces prevents the expression of the (100) and (111) surfaces, resulting in an equilibrium morphology with a dodecahedron shape consisting of 4 hexagons, 4 pentagons and 4 quadrilaterals. The oxidized (110) surface with a surface free energy of 19 meV Å−2 is also expressed when the temperature reaches 700 K, as shown in Fig. S1 (ESI†). However, the result suggests that the water molecule is not capable to chemisorb at the oxidized (110) surface due to the occupation of the adsorption sites by O atoms. Tests of water physisorption show negligible interactions. Thus, we do not consider further the oxidized (110) surface in the following discussions.
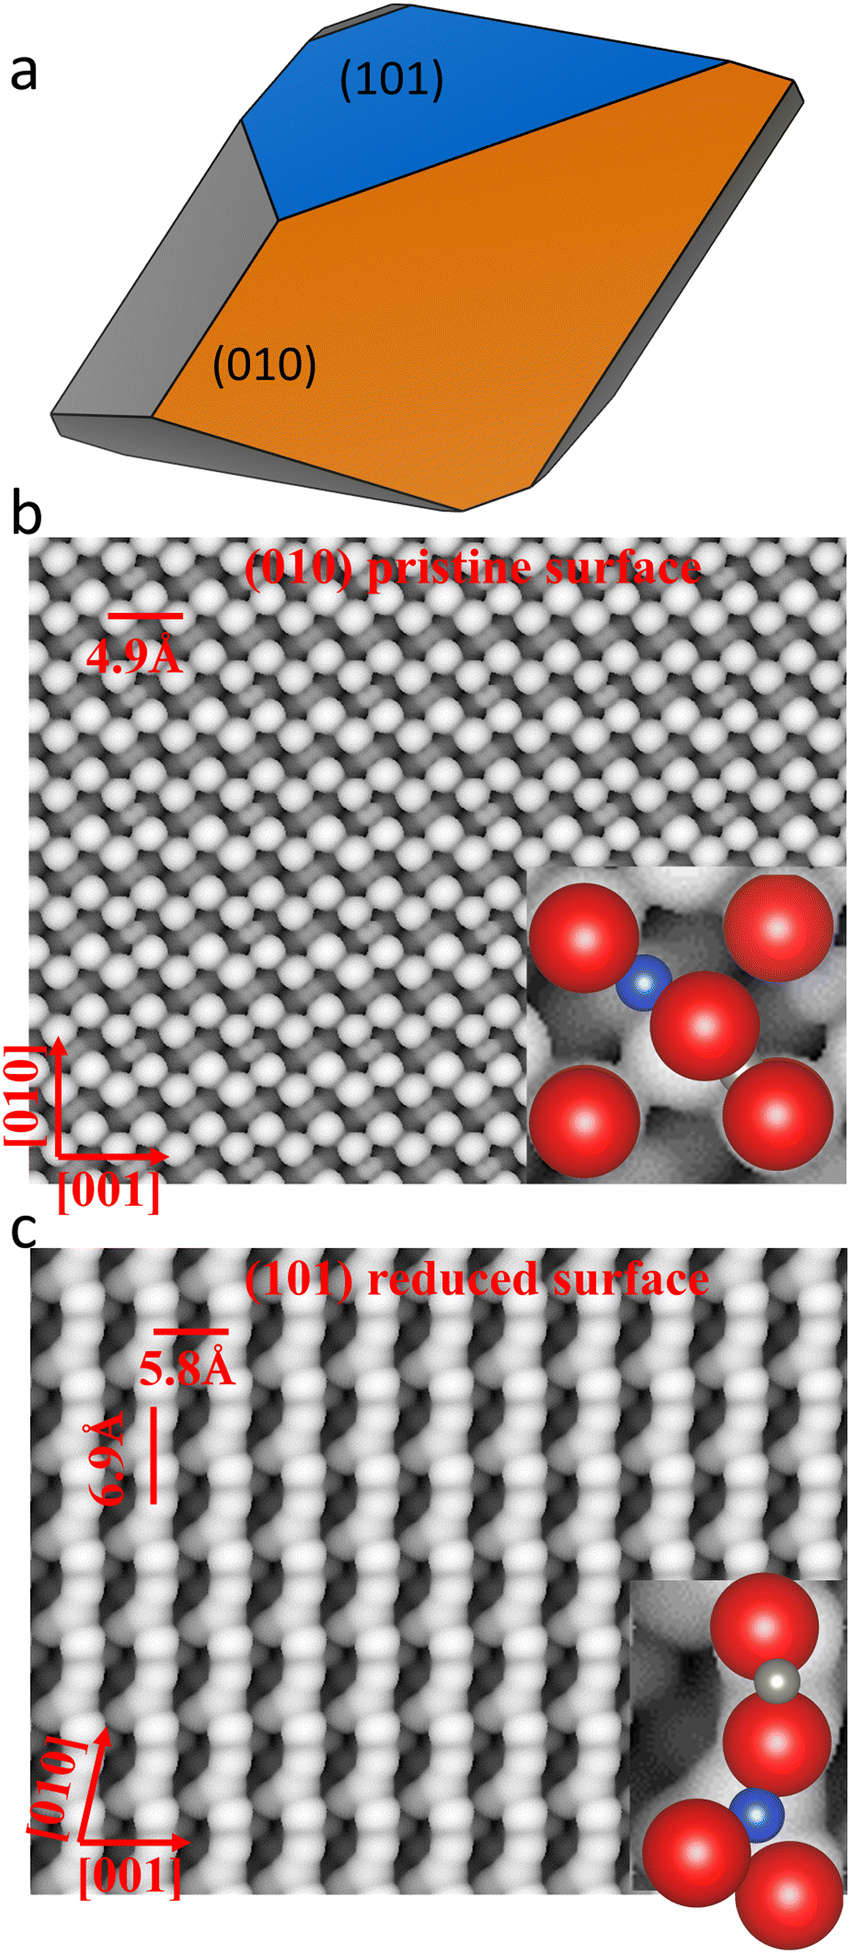 | ||
| Fig. 1 (a) Equilibrium Wulff morphology of CuWO4 at 298 K and scanning tunnelling microscopy (STM) images of (b) the pristine (010) and (c) the reduced (101) surfaces of CuWO4. Cu, W, and O atoms are shown as blue, grey, and red, respectively. | ||
We simulated the STM images of the optimized pristine (010) and reduced (101) surfaces of CuWO4, as illustrated in Fig. 1b and c. The STM image of the pristine (010) surface was acquired at a distance (d) of 1.5 Å from the tip and at a density (ϱ) of 0.008e Å−3. The 4-fold Cu cations of the topmost layer were resolved as dark spots, whereas five O anions of the CuO6 and WO6 octahedral units appear as bright spots. The W cations, which are linking two O anions, are not shown in the STM image due to their low partial charges at the sample bias of −1.5 eV. The STM image of the pristine (010) surface suggests that the 4-coordinated Cu cations in the top layer of the surface can potentially act as adsorption sites for the H2O molecule owing to their two dangling bonds. The STM image of the reduced (101) surface was simulated at a distance of 1.8 Å from the tip and at a density of 0.003 e Å−3 using a sample bias of −3.0 eV. The STM image of the reduced (101) surface suggests that the 3-coordinated Cu cations and 4-coordinated W cations in the topmost layer of the slab, which are shown as bright spots, can potentially act as adsorption sites for H2O owing to their dangling bonds.
3.3 Single water molecule adsorption
In the initial adsorption structures, we sited the H2O molecule above each potential adsorption site at 2 Å away from the surface, with the O atom coordinating the undercoordinated metal cation and with the H atoms interacting with the O anion exposed in the topmost layer of the surface. For a better description of the adsorption configurations of the H2O molecule, we have employed a notation widely used in organometallic chemistry, which is based on the hapticity of the ligands (μn) and the number of surface atoms it can bridge (ηm).59–61 | ||
| Fig. 2 (left panels) Top view of the most stable adsorption modes of a single H2O molecule on the pristine (010) surface of CuWO4: molecular adsorptions (a) μ1–η1 on Cu site, (b) μ2–η2 on Cu site, (c) μ3–η3 on Cu site, (d) μ2–η2 on O site, and (e) dissociative adsorption μ2–η2 on Cu site. The length of the ionic bonds (green arrow) and hydrogen bonds (blue arrow) are noted. The Cu, W, and O atoms are shown as blue, grey, and red, respectively. Dark blue Cu atoms indicate the H2O adsorption sites. (right panels) Side view of the charge density differences caused by the water adsorption. Yellow regions represent electron gain, whereas blue regions represent electron loss. Crystallographic directions are indicated by numbers within brackets. | ||
We found that H2O coordinated molecularly the topmost surface Cu atom, forming a μ1–η1 configuration as illustrated in Fig. 2a. The O atom of the H2O molecule (Ow) was oriented towards the surface to restore the octahedral coordination of CuO6. The Cu–Ow bond distance was 2.05 Å, which is consistent with the length of the Cu–O bond (1.95–2.40 Å) in the bulk phase. The hydrogen atoms, on the other hand, pointed outwards from the surface, which indicates that no hydrogen bond is formed between the H2O and the O of the surface (Os). The surface exhibited negligible structural distortion after relaxation, except that the Cu of the adsorption site was displaced outwards by 0.22 Å, due to the Coulomb attraction of Ow. As listed in Table 2, Eads of the single H2O adsorption system was calculated as −0.69 eV, which was attributed to the formation of the Cu–Ow bond. As listed in Table 2, the charge density difference (Δq) of this adsorption mode suggests that a minor electron density of 0.10e migrated from the adsorbed H2O molecule to the surface. We highlighted the atoms with the largest atomic charge transfer in the right panels of Fig. 2. The results suggest that a strong polarisation of the H2O molecule occurred during adsorption onto the CuWO4(010) surface which caused a charge redistribution. As a result, 0.81 e of Ow migrated to the two H, which gained 0.34 and 0.37 e, whereas the Os gained 0.1 e. The work function of the hydrated system was calculated at 6.15 eV, which is 0.80 eV lower than the dry surface, revealing that the former can provide electron charge more easily than the latter. We calculated the vibrational modes of the adsorbed water molecule, listed in Table 2. For the hydrated (010) surface, the asymmetric and symmetric stretching modes of the H2O molecule are red-shifted by 131 and 153 cm−1 with respect to the isolated molecule, which indicates that the OwH bond became weaker during adsorption. On the other hand, the bending mode was red-shifted by only 45 cm−1 compared to the isolated water molecule.
| Site | Molecular | Dissociative | |||
|---|---|---|---|---|---|
| Cu | Cu | Cu | O | Cu | |
| Configuration | μ1–η1 | μ2–η2 | μ3–η3 | μ2–η2 | μ2–η2 |
| E ads (eV) | −0.69 | −0.69 | −0.89 | −0.26 | −0.12 |
| d O–metal (Å) | 2.05 | 2.09 | 2.03 | 1.97 | |
| d H bond1 (Å) | 1.95 | 2.15 | 2.13 | 1.76 | |
| d H bond2 (Å) | 2.21 | 2.37 | |||
| Δq (e) | 0.10 | 0.09 | 0.10 | −0.02 | 0.47 |
| Φ (eV) | 6.15 | 6.28 | 6.45 | 6.54 | 6.48 |
| υ asym (cm−1) | 3650 | 3600 | 3475 | 3614 | 3727 |
| υ sym (cm−1) | 3519 | 3281 | 3396 | 3517 | 3352 |
| δ (cm−1) | 1459 | 1541 | 1510 | 1544 | |
The H2O molecule is also capable of forming a μ2–η2 configuration when adsorbing onto Cu, as illustrated in Fig. 2b. The Cu–Ow bond with a length of 2.09 Å is oriented towards the surface to maintain the octahedral coordination of CuO6 in the bulk phase, whereas the OwH group formed a 1.95 Å long hydrogen-bond with Os. The Cu migrated outward slightly due to the Coulomb attraction of Ow, but the rest of the slab atoms stayed at their relaxed dry surface positions. The adsorption energy is −0.69 eV, which is identical to the value calculated for the configuration in the absence of hydrogen-bonds, discussed previously. The result suggests that hydrogen-bonds do not play a major role in the thermodynamics of these adsorption configurations. As illustrated in the right panel of Fig. 2b, a small charge density of 0.09e transferred from the H2O molecule to the surface. The Ow donated 0.02 e to the Cu adsorption site. The two H atoms provided 0.02 and 0.05 e to the surface, as illustrated in Fig. 2b. The work function increased to 6.28 eV compared to the adsorption configuration without hydrogen-bond, which is still 0.67 eV smaller than the dry surface, suggesting that the hydrated catalyst surface is better capable of providing electron charge when facilitating chemical reactions. Table 2 lists our estimated asymmetric (3600 cm−1) and symmetric (3281 cm−1) stretching modes, which are red-shifted by 181 and 391 cm−1, respectively, compared to the isolated water molecule. Our results suggest that the intramolecular OH bonds become weaker during adsorption. The estimated bending mode was over 1541 cm−1, which was only 37 cm−1 larger than for the isolated water molecule.
We also tested the physisorption of water molecule onto Os. However, the H2O molecule chemisorbed onto the nearest Cu cation after optimization, forming a μ3–η3 configuration as indicated in Fig. 2c. The calculated bond distance for Cu–Ow was 2.03 Å, which is in good agreement with the length of the Cu–O bond in the bulk phase. The Cu–Ow bond oriented towards the surface to maintain the octahedral geometry of CuO6. Additionally, H2O formed two hydrogen-bonds with Os at 2.15 and 2.21 Å, which forced the molecular plane of the adsorbate to lie approximately parallel to the surface, as illustrated in Fig. 2c. The surface did not suffer major structural distortions as only the Cu adsorption site migrated outwards slightly due to the Coulomb attraction of Ow. The Eads of this adsorption configuration was −0.89 eV, which is the most favourable adsorption mode for the pristine CuWO4(010) surface. The result also suggests that chemisorption of the water molecule at the Cu is the primary interaction on the pristine (010) surface, whereas physisorption on Os can only be considered as a secondary interaction. As listed in Table 2, the Δq of this adsorption structure shows that an electron charge of 0.1 e migrated to the surface after optimization, whereas the polarization of the H2O molecule was also observed. The two H atoms contributed 0.06 and 0.16 e to the Ow (gained 0.13 e) and two Os (gained 0.04 e) to form a Cu–Ow coordination bond and hydrogen-bonds, and 0.02 migrated to the other anions of the surface, as illustrated in the right panel of Fig. 2c. The calculated work function for this hydrated surface was 6.45 eV, which is 0.5 eV smaller than the dry surface, suggesting that the hydrated system is better at providing electron charge and facilitating chemical reactions. As listed in Table 2, the symmetric and asymmetric stretching modes were estimated at 3396 and 3475 cm−1, respectively, which are significantly red-shifted compared to the isolated water molecule, suggesting that the intramolecular OH bonds become weaker after adsorption. The estimated bending mode lies at 1510 cm−1, which is only 5 cm−1 different from the isolated water molecule.
We did not find any configuration where Ow interacted with W, since this atom has no dangling bond available in the topmost surface layer. Whereas the Cu atoms in the topmost layer of the pristine (010) surface have lost their two O ligands, which has created two dangling bonds available for the adsorption of the H2O molecule, the W atoms in the topmost layer of the pristine (010) surface maintained their WO6 octahedral coordination. The STM images plotted in Fig. 1b also show that the W atoms are shielded by two O atoms and as such, they are not able to bind the O atom of the H2O molecule.
As illustrated in Fig. 2d, the H2O molecule interacts with Osvia two hydrogen-bonds at 2.13 and 2.37 Å, forming a μ2–η2 configuration. The molecular plane of H2O was perpendicular to the surface but the Ow moved outwards due to the Coulomb repulsion of the Os. The structure of the surface did not change noticeably after relaxation because of the relatively weak hydrogen-bond interactions. The Eads of this adsorption pattern was −0.26 eV, which was mainly attributed to the two hydrogen-bonds. The surface lost a negligible electron density of 0.02 e to the H2O molecule, whereas the main electronic effect was the polarization of the water molecule. As illustrated in Fig. 2d, the Ow anion gained 0.03 e from the surface and H, and two Os gained 0.01 and 0.02 e to form H-bonds. The calculated work function of the simulated system was 6.54 eV, which is 0.41 eV smaller than that of the dry surface. The result indicates that the hydrated surface will more easily donate electron charge which improves the chemical reactivity. The calculated symmetric and asymmetric stretching modes of the adsorbed water were 3518 and 3614 cm−1, i.e. red-shifted by 155 and 167 cm−1, respectively, compared to the isolated water molecule, indicating that the intramolecular OH bonds become weaker after adsorption, as listed in Table 2. The bending mode was estimated at 1544 cm−1, which increased slightly by 40 cm−1 compared to the isolated water molecule.
We also obtained a single dissociatively adsorbed H2O molecule with a μ2–η2 coordination geometry, as presented in Fig. 2e. It is worth noting that the dissociation of water discussed in this study occurred spontaneously upon adsorption of water at the surface and the dissociative process is therefore treated as barrierless. The OwH group coordinating the exposed Cu on the surface, has a bond length of 1.97 Å and a bond angle ∠HOwCu of 113.43°. The dissociated H atom formed a hydroxyl group with a surface Os atom. We also found that the OsH group formed a hydrogen-bond at 1.76 Å to OwH. The surface exhibited negligible structural distortion except at the Cu adsorption site, where the Cu atom was pulled outward due to the Coulomb attraction of Ow. The Eads for the dissociative single H2O adsorption is −0.12 eV, which is smaller than for the molecular adsorption configuration. Releasing less energy indicates that water prefers to adsorb molecularly on the pristine (010) CuWO4 surface. As listed in Table 2, the surface gained electron density of 0.47 e after hydration. We have shown the atoms with noticeable charge density differences in the panels on the right of Fig. 2e. The Ow gained 0.21 e from the surface and bonded H. The dissociated H atom contributed significantly by 0.67 e to form the OsH bond, and the Os obtained 0.52 e correspondingly. The work function for this hydrated system was 6.48 eV, i.e. 0.47 eV smaller than the dry surface, indicating that the former provides electron charge more easily, thereby improving the chemical reactivity. We calculated the vibrational stretching mode for the dissociative H2O as listed in Table 2. For the OwH group, it was estimated at 3727 cm−1, which is blue-shifted by 55 cm−1 compared to the symmetric stretching mode, and red-shifted by 54 cm−1 compared to the asymmetric stretching mode. The result indicates that the strength of the OwH bond did not change noticeably due to the slight difference in stretching modes compared to the isolated water molecule. The calculated stretching mode for the OsH group was 3352 cm−1, which is 320 and 429 cm−1 smaller than the symmetric and asymmetric stretching modes of the isolated water molecule, respectively.
 | ||
| Fig. 3 (left panels) Top view of the most stable adsorption modes of a single H2O molecule on the reduced (101) surface of CuWO4: molecular adsorptions (a) μ2–η2 on Cua site, (b) μ3–η3 on Cub site, (c) μ2–η2 on W site, (d), and dissociative adsorption μ3–η3 on W site. The lengths of the ionic bonds (green arrow) and hydrogen bonds (blue arrow) are noted. The Cu, W, and O atoms are blue, grey, and red, respectively. Dark blue Cu atoms represent the H2O adsorption sites; (right panels) side view of the charge density differences as a result of the adsorption compared with the dry (101) surface. The region coloured in light yellow represents charge gain (noted as positive value), whereas the region coloured in light blue represents charge loss (noted as negative value) after adsorption. Crystallographic directions are indicated by numbers within brackets. | ||
| Site | Molecular | Dissociative | ||
|---|---|---|---|---|
| Cua | Cub | W | W | |
| Configuration | μ2–η2 | μ3–η3 | μ2–η2 | μ3–η3 |
| E ads (eV) | −0.63 | −0.53 | −0.81 | −0.53 |
| d O–Metal (Å) | 2.11 | 2.05 | 2.37 | 2.01 |
| d H bond1 (Å) | 1.70 | 1.69 | 2.04 | |
| d H bond2 (Å) | 2.37 | |||
| Δρ (e) | 0.06 | 0.07 | −0.07 | 0.16 |
| Φ (eV) | 4.78 | 4.74 | 4.99 | 5.33 |
| υ asym (cm−1) | 3616 | 3551 | 3597 | 3719 |
| υ sym (cm−1) | 3173 | 2984 | 3281 | 3618 |
| δ (cm−1) | 1521 | 1537 | 1530 | |
As illustrated in Fig. 3a, the H2O was able to adsorb molecularly on the W site in the topmost surface layer, forming a coordinate W–O bond with bond length of 2.37 Å. The Ow oriented towards the surface to keep the octahedral coordination geometry of the WO6 in the bulk phase, complementing the μ2–η2 configuration with a hydrogen-bond to Os. The length of the hydrogen-bond is 2.04 Å as noted in Fig. 3a. The surface suffered negligible structural change after adsorption except for slight outward displacement of the W due to the Coulomb attraction of Ow. The Eads for this adsorption configuration is −0.81 eV, which is the thermodynamically most favourable adsorption mode for a single water molecule that we obtained at the reduced (101) CuWO4 surface. The hydrated surface only gained electron charge of 0.06 e as listed in Table 3, whereas the polarization of the water molecule is also small. We have shown in the right panel of Fig. 3 the atoms with noticeable charge density difference after hydration. The Ow gained 0.02 e, partially provided by the W adsorption site with 0.06 e and two H atoms with 0.04 and 0.05 e. The Os that interacted with the H atom gained 0.05 e when forming a hydrogen-bond. The four O atoms coordinating the W adsorption site gained 0.01 e in total after adsorption. The work function of the hydrated surface is 4.99 eV, which is 0.96 eV lower than the reduced (101) surface, indicating that the hydrated surface is significantly more reactive than the dry surface. The result is in good agreement with the increase in the charge density of the surface, discussed before. As listed in Table 3, the symmetric and asymmetric stretching modes of the adsorbed water were estimated at 3281 and 3598 cm−1, which are red-shifted by 391 and 184 cm−1, respectively, with respect to the isolated water molecule. Our results indicate that the intra-molecular OH bonds are weaker after adsorption. The bending mode changed slightly by 26 cm−1 compared to the isolated water molecule.
The H2O was able to chemisorb at the Cua adsorption site, forming a μ2–η2 configuration, as shown in Fig. 3b. The length of the Cua–Ow bond is 2.11 Å, whereas the hydrogen-bond formed is 1.70 Å long. The Cua–Ow bond is oriented outwards to maintain the octahedral coordination of CuO6 in the bulk phase, and the Cu at the adsorption site was pulled outwards due to the Coulomb attraction of the Ow. The Eads for the adsorption system is −0.63 eV, which is smaller than the hydrated system discussed before, suggesting that the water molecule prefers to adsorb onto W. Electron density of 0.06 e migrated to the surface, as listed in Table 3. The Ow gained 0.01 e when it coordinated Cu, whereas the two H atoms contributed 0.01 and 0.06 e to Ow and the surface, respectively and the Os gained 0.05 e after hydration. The work function of this system was calculated as 4.78 eV, which is 1.17 eV smaller than the dry reduced surface, revealing that the surface becomes significantly more reactive after hydration. The result is consistent with the electron density increase of the hydrated surface. The symmetric and asymmetric stretching modes are estimated at 3173 and 3616 cm−1 as listed in Table 3, which are red-shifted by 499 and 165 cm−1, respectively. The result suggests that the intramolecular OH bonds become weaker after hydration. The bending mode is found at 1521 cm−1, which is only a negligible change compared to the isolated water molecule.
Since the reduced (101) surface contains O vacancies, we investigated the adsorption of a single H2O molecule at the exposed Cub of the sub-layer. As shown in Fig. 3c, the Ow was pushed towards the top layer of the surface to maintain the octahedral coordination of the CuO6, bonding with Cub at 2.05 Å. Two hydrogen-bonds were established at 1.69 and 2.37 Å distance, interacting with Os to complement the μ3–η3 adsorption configuration. The surface slab suffered negligible structural change after relaxation. The Eads calculated for this adsorption mode is −0.53 eV, resulting in a weaker adsorption pattern than the two adsorption systems discussed previously. After hydration, 0.07 e electron density had migrated from the H2O molecule to the surface, listed in Table 3. The Ow gained 0.1 e electron density, which was partially compensated by the Cu at the adsorption site that lost 0.26 e upon interaction with H2O. Two H contributed 0.05 and 0.11 e, whereas two Os gained 0.01 and 0.06 e owing to the formation of hydrogen-bonds. The work function was calculated at 4.74 eV, which is 1.21 eV smaller than for the dry surface, indicating that the surface becomes significantly more reactive upon hydration. The symmetric and asymmetric stretching modes became 2984 and 3551, listed in Table 3, which are red-shifted by 688 and 230 cm−1, respectively, upon hydration. The result shows that the intramolecular OH bond becomes weaker compared to the isolated water molecule. However, the bending mode is slightly blue-shifted to 1538 cm−1 after hydration.
Dissociative adsorption of a single H2O molecule also occurred at the reduced (101) surface, shown in Fig. 3d. The OwH group, which was initially located at W in the top-layer of the surface, migrated and after optimisation bound the sub-surface Cub. The Cub–Ow and W–Ow bond lengths are 2.24 and 2.01 Å, respectively, and the dissociated H atom bound one Os, completing a μ3–η3 configuration. The Cub was pulled out of the surface through the Coulomb attraction of Ow which pushed the top-layer Cu outwards. The Eads for the dissociative adsorption was −0.53 eV, which indicates that based on thermodynamic grounds the H2O prefers to adsorb molecularly on the top-layer W. A total electron density of 0.16 e migrated from the H2O molecule to the surface after the dissociative adsorption, as listed in Table 3. The Ow gained 0.49e, which were donated by the Cub in the sub-surface layer, the W adsorption site, and H of the OwH group. The dissociated H lost 0.62 e when bonding to the surface, whereas the Os gained 0.26 e via the corresponding OsH bond. The work function of the system was calculated at 5.33 eV, which is 0.62 eV lower than that of the dry surface, making the hydrated surface more reactive. The vibrational stretching mode of the OwH group was calculated at 3719 cm−1 after hydration, i.e. similar to the asymmetric vibrational mode of the isolated water molecule. However, the vibrational stretching mode of the OsH group was 3619 cm−1, which is red-shifted by 38 cm−1 with respect to the symmetric vibrational mode after dissociation, suggesting that the OsH bond is weaker compared to the isolated water molecule.
3.4 H2O surface coverage
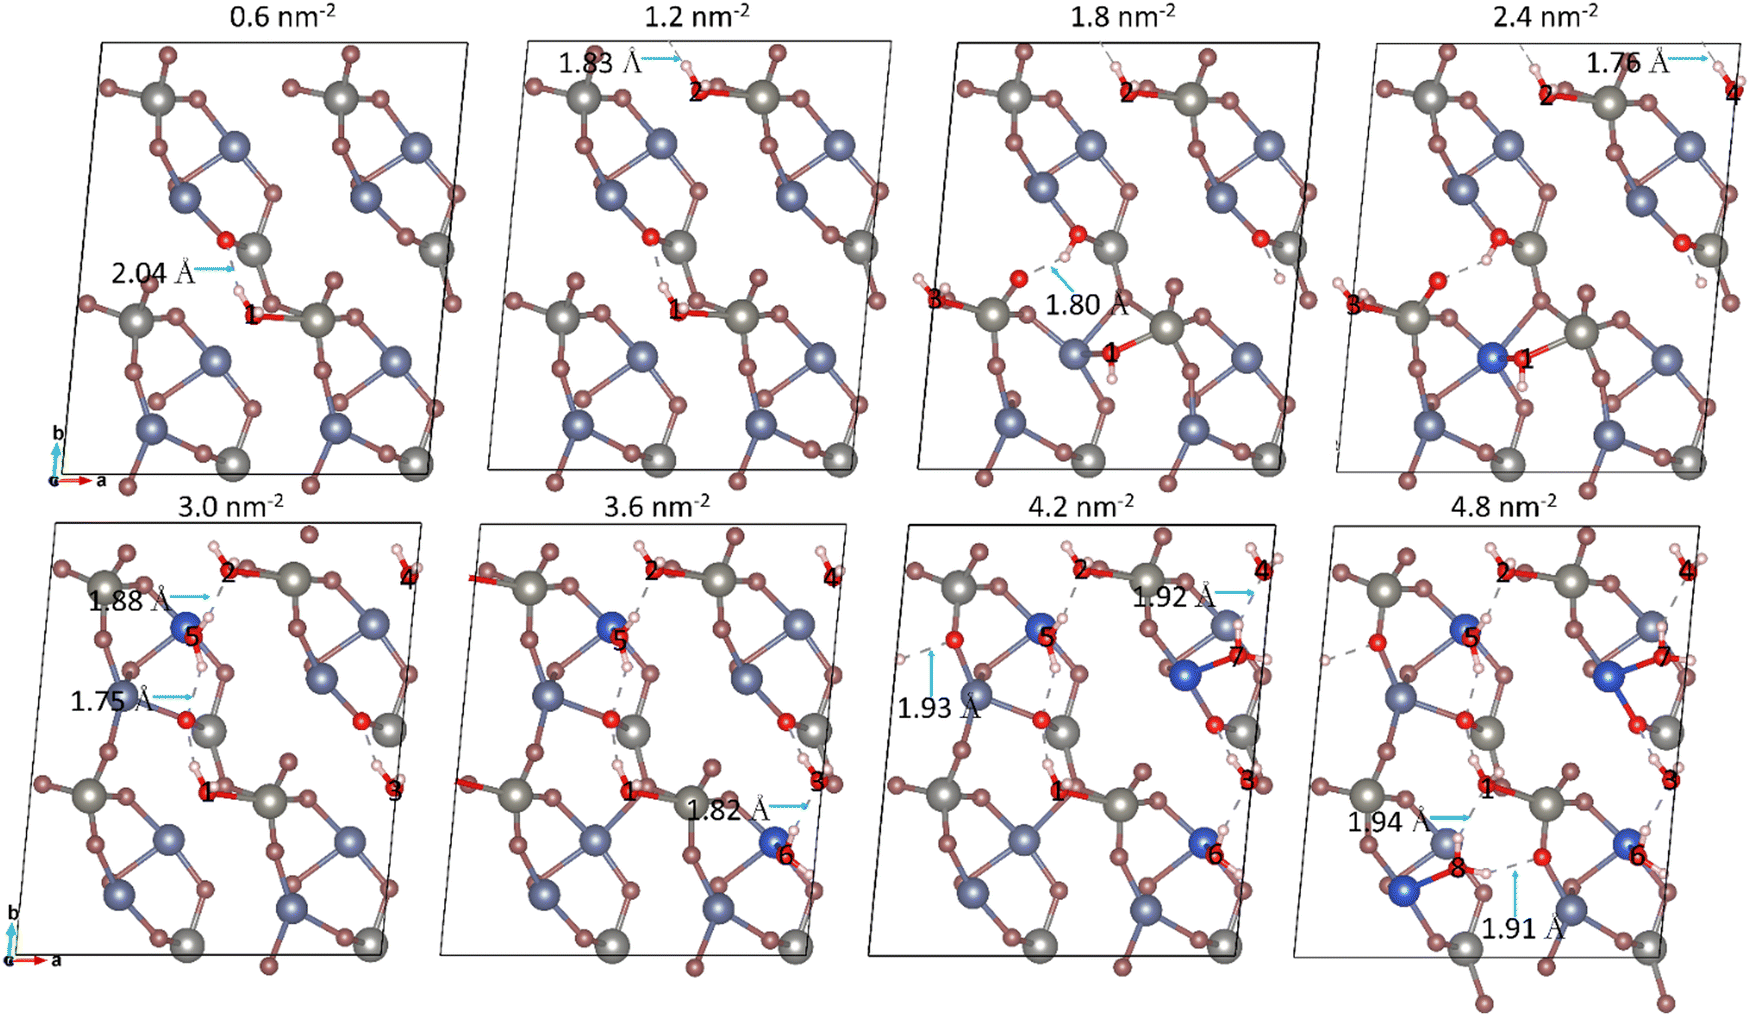
We selected the most thermodynamically favourable configurations of the single H2O molecule adsorption system (i.e. with the largest negative Eads) as the initial geometries to study the effect of incremental surface coverage on both the pristine (010) and reduced (101) surfaces. Both molecular and dissociative H2O adsorption were studied for each coverage, and the configuration with the largest Eads was selected to simulate the next adsorption step. The number of adsorbed H2O molecules (n) was increased until all the potential adsorption sites were occupied, or at the onset of a second layer of H2O. | ||
| Fig. 4 Top view of H2O coverages at the pristine (010) surface. The H2O molecules are labelled (1 to 8) and the adsorption sites are shown highlighted in dark blue. The Cu, W, O, and H atoms are (pale and dark) blue, grey, red and white, respectively. The length of the hydrogen-bonds of the additional water molecule in each configuration is noted and shown by a blue arrow. | ||
We calculated the average Bader atomic charges of Cu, W, and O in the top layer of the (010) surface at each surface coverage of H2O, as shown in Fig. 5. The negligible change in the Bader charges indicates that only minor amounts of electron density have migrated from the adsorbates to the surface, which is in good agreement with the small charge transfer discussed for the single H2O molecule adsorption. The increment in the adsorption energy per H2O molecule (Eads-per![[thin space (1/6-em)]](https://www.rsc.org/images/entities/char_2009.gif) H2O) was calculated as a function of the coverage of H2O. The result shows that Eads-perH2O decreased from −0.89 to −0.71 eV, which indicates that single molecule adsorption is stronger than at higher coverages, although the value of Eads-perH2O remained negative. We found a clear increase in the negative Eads-perH2O when the surface coverage became 3.3 and 8.8 nm−2, which was attributed to the formation of additional hydrogen-bonds upon adsorption of the additional water molecule, which released more energy as a result. We further calculated the surface free energies at 0 K (σ0K) as a function of the coverage of H2O at the pristine (010) surface. The steady decrease in σ0K suggests that the surface–water system becomes thermodynamically more stable as the surface coverage increases. Both Eads-perH2O and σ0K indicate that adsorption of H2O molecules to full monolayer coverage at the pristine (010) surface is thermodynamically feasible. However, weaker interactions between the Ow and surface were observed in the higher surface coverages. The work function at each coverage of H2O was smaller than that of the pristine surface at 6.95 eV, suggesting that the hydrated surfaces are all more reactive than the dry one. The smallest work function of 5.94 eV was obtained at the surface coverage of 4.4 nm−2, as shown in Fig. 5. This phenomenon is attributed to the chemisorption of water at the Cu adsorption site when the surface coverage is less than 4.4 nm−2. The electron charge migrates from the adsorbates to the surface, resulting in the lowering of the work function. When the (010) surface is hydrated to higher surface coverages above 5.5 nm−2, physisorption of the additional adsorbates provides negligible electron charge to the surface, resulting in a small increase in the work function. We calculated the band gap of the hydrated system at each surface coverage, see Fig. 5. The value of the band gap fluctuates within a narrow range from 1.4 to 1.5 eV as the surface coverage is increased. The result suggests that the hydrated pristine (010) surface has the potential for photocatalytic water splitting, considering it meets the requirement of a minimum band gap of 1.23 eV for the reaction.62
H2O) was calculated as a function of the coverage of H2O. The result shows that Eads-perH2O decreased from −0.89 to −0.71 eV, which indicates that single molecule adsorption is stronger than at higher coverages, although the value of Eads-perH2O remained negative. We found a clear increase in the negative Eads-perH2O when the surface coverage became 3.3 and 8.8 nm−2, which was attributed to the formation of additional hydrogen-bonds upon adsorption of the additional water molecule, which released more energy as a result. We further calculated the surface free energies at 0 K (σ0K) as a function of the coverage of H2O at the pristine (010) surface. The steady decrease in σ0K suggests that the surface–water system becomes thermodynamically more stable as the surface coverage increases. Both Eads-perH2O and σ0K indicate that adsorption of H2O molecules to full monolayer coverage at the pristine (010) surface is thermodynamically feasible. However, weaker interactions between the Ow and surface were observed in the higher surface coverages. The work function at each coverage of H2O was smaller than that of the pristine surface at 6.95 eV, suggesting that the hydrated surfaces are all more reactive than the dry one. The smallest work function of 5.94 eV was obtained at the surface coverage of 4.4 nm−2, as shown in Fig. 5. This phenomenon is attributed to the chemisorption of water at the Cu adsorption site when the surface coverage is less than 4.4 nm−2. The electron charge migrates from the adsorbates to the surface, resulting in the lowering of the work function. When the (010) surface is hydrated to higher surface coverages above 5.5 nm−2, physisorption of the additional adsorbates provides negligible electron charge to the surface, resulting in a small increase in the work function. We calculated the band gap of the hydrated system at each surface coverage, see Fig. 5. The value of the band gap fluctuates within a narrow range from 1.4 to 1.5 eV as the surface coverage is increased. The result suggests that the hydrated pristine (010) surface has the potential for photocatalytic water splitting, considering it meets the requirement of a minimum band gap of 1.23 eV for the reaction.62
 | ||
| Fig. 5 Bader atomic charges (q), incremental Eads, surface free energies at 0 K (σ), work functions (Φ), and band gaps at each coverage of H2O on (left) the pristine (010) surface and (right) the reduced (101) surface. | ||
We constructed 3D surface phase diagrams of the water adsorption for both the pristine (010) and reduced (101) surfaces. The molecular and dissociative adsorption was tested for each coverage, and the surface configuration with the lowest surface free energy, calculated based on eqn (5), was used for the construction of the phase diagrams. The 2D projections of the 3D surface phase diagrams are plotted as a function of the temperature (T) and the logarithm of the partial pressure of H2O  see Fig. 6. The curves between the intersecting energy surfaces represent the conditions required to modify the extent of H2O adsorption.
 | ||
| Fig. 6 Surface phase diagrams of (left) the pristine (010) surface and (right) the reduced (101) surface as a function of the temperature (T) and the logarithm of partial pressure of H2O (logp(H2O)/p0(H2O)). The coverage (C) of adsorbed H2O (unit: nm−2) are noted in the figure. | ||
As shown in Fig. 6, the (010) surface stays dry as the temperature increases from 300 K when the logarithm of the partial pressure of H2O was below 8. The other five possible coverages of H2O, i.e. 1.1, 3.3, 4.4, 5.5, and 6.6 nm−2, are available when the partial pressure of the absorbate is increased or the temperature is lowered. The simulation slab of our surface was capable to adsorb eight H2O molecules and reached full coverage (C) of 8.8 nm−2 when T was lower than 185 K and the logarithm of partial pressure of H2O was larger than 8.6. The surface phase diagram suggests that the pristine (010) surface prefers to adsorb H2O and reaches full coverage at a relatively low temperature or high partial pressure of this gas. Such a result is consistent with the continuously decrease in the Eads per H2O molecule as discussed in Section 3.3.1. Water adsorption on the pristine (010) surface is sensitive to the temperature and its partial pressure, as the surface coverages of 3.3 to 6.6 nm−2 can only be achieved in a narrow range of environmental conditions. The surface coverages of 2.2 and 7.7 nm−2, corresponding to two and seven adsorbates, respectively, per simulation cell did not show in the phase diagram, as they are inaccessible.
 | ||
| Fig. 7 Top view of H2O coverages at the reduced (101) surface. The H2O molecules are labelled (1 to 8) and the adsorption sites are shown highlighted in dark blue. The Cu, W, O, and H atom are (dark and pale) blue, grey, red and white, respectively. The length of the hydrogen-bonds of the additional water molecule in each configuration is noted and shown by a blue arrows. | ||
The average Bader atomic charges of Cu, W, and O in the top-layer of the reduced (101) surface for each surface coverage were calculated, as shown in Fig. 5. Negligible changes of the average Bader charge were obtained after hydration, suggesting that only small amounts of electron density were transferred from the adsorbates to the surface, which agrees with the result for the single water adsorption at the reduced (101) surface. The Eads-perH2O of the reduced (101) surface decreased from −0.93 to −0.43 eV with increasing surface coverage of water, which indicates that the interaction between the adsorbates and surface was weaker at higher surface coverages. A substantial reduction of Eads-perH2O was observed at the surface coverages of 2.4 nm−2, owing to the formation of a Cub–Ow bond between Cub in the sub-surface and the OwH group, resulting in the release of more energy. The σ0K decreased with water coverage, suggesting that the reduced (101) surface prefers to reach full coverage which is more thermodynamically favourable. As shown in Fig. 5, a substantial lowering of the work function was observed after hydration compared to 7.59 eV of the dry (101) surface, due to more electron charge made available by the adsorbates, indicating that the hydrated systems are more reactive than the dry surface, especially for its lowest value of 3.50 eV at the surface coverage of 2.4 nm−2. The band gaps of the hydrated systems at each surface coverage were calculated and are shown in Fig. 5. The results suggests that the reduced (101) surface is not suitable for photocatalytic water splitting, given that its band gap is significantly smaller than 1.23 eV at any water coverage.62
We constructed the surface phase diagram as a function of the temperature and partial pressure of H2O on the reduced (101) surface, as shown in Fig. 6. The surface stayed dry when the temperature was above 200 K and the logarithm of the partial pressure of H2O was below 7. The surface reached full hydration at a high partial pressure of H2O and high temperature, corresponding to a surface coverage equal to 4.8 nm−2. The other three regions of coverage, where C is equal to 0.6, 2.4 and 3.0 nm−2 were also shown in the phase diagram. The results suggest that the reduced (101) surface is sensitive to the environment as it prefers to stay dry, or fully hydrated under most environmental conditions. The other possible surface coverages of water could only be reached in a narrow range of temperatures and partial pressures of H2O. The H2O coverages of 1.2, 1.8 3.6, and 4.2 nm−2 do not show in the phase diagram since they are inaccessible.
4. Conclusions
In this paper, we have reported a computational study based on the density functional theory of the adsorption of water on the pristine (010) and reduced (101) surfaces of CuWO4. On the pristine (010) surface, the adsorption mode with H2O coordinating Cu in the μ3–η3 configuration has the largest adsorption energy of −0.89 eV. At the reduced (101) surface, the H2O molecule preferentially adsorbs over W with an adsorption energy of −0.81 eV, forming a μ2–η2 configuration. Following single-molecule adsorption, we next investigated adsorption of multiple H2O molecules on the pristine (010) and reduced (101) surfaces, starting from the most favourable adsorption modes obtained for the single H2O molecule. We found that the pristine (010) surface can adsorb up to eight H2O molecules per surface cell. Four H2O molecules coordinated Cu in the surface, whereas the other four interacted with neighbouring H2O molecules via hydrogen-bonds, forming an ice-like monolayer over the surface. The reduced (101) surface adsorbed eight H2O molecules before it achieved full coverage. Four H2O molecules coordinated W as isolated adsorbates, two H2O molecules coordinated Cu in the sub-surface, whereas two H2O molecules interacted with Cu in the top-layer.The electronic properties were calculated for both surfaces. We found only negligible change in the Bader atomic charges of Cu, W, and O upon water adsorption, which is consistent with the minor charge transfer observed for the single molecule adsorption systems. The work functions of both hydrated surfaces are smaller than the dry surfaces at all coverages. The band gap of the hydrated (010) surface at each surface coverage fluctuates within 0.1 eV, and all are above 1.23 eV, which shows potential for its utilization in photocatalytic water splitting. However, the band gap of the reduced (101) surface at each surface coverage is well below 1.23 eV, which makes it an unlikely candidate for photocatalytic water splitting. The surface phase diagram of the pristine (010) and reduced (101) surfaces were obtained as a function of the temperature and partial pressure of H2O. The results suggest that the two surfaces prefer to remain dry at low partial pressures of H2O but can become fully hydrated at high partial pressures of H2O and at low temperatures. Other coverages, although shown in the phase diagram, were hard to achieve due to the narrow range of temperature and H2O partial pressure required. In summary, our results show that the pristine (010) surface of CuWO4 has the potential to be utilized in photocatalytic water splitting, which will be the focus of future work.
Data availability
All the data supporting the findings of this study are provided within the paper and in the ESI† file.Conflicts of interest
The authors have no conflict of interest to declare.Acknowledgements
XC is grateful to the University of Leeds for the provision of a Research Scholarship. Via our membership of the UK's HEC Materials Chemistry Consortium, which is funded by EPSRC (EP/X035859), this work made use of the ARCHER2 UK National Supercomputing Service (https://www.archer2.ac.uk). This research has also used ARC4, part of the High-Performance Computing facilities at the University of Leeds, UK. For the purpose of Open Access, the authors have applied a CC BY public copyright licence to any Author Accepted Manuscript version arising from this submission.References
- D. Feldman, V. Ramasamy, R. Fu, A. Ramdas, J. Desai and R. Margolis, U.S. Solar Photovoltaic System and Energy Storage Cost Benchmark: Q1 2020, 2020.
- N. Kannan and D. Vakeesan, Renewable Sustainable Energy Rev., 2016, 62, 1092–1105 CrossRef.
- D. Feldman, V. Ramasamy, R. Fu, A. Ramdas, J. Desai and R. Margolis, U.S. Solar Photovoltaic System and Energy Storage Cost Benchmark: Q1 2020, 2020.
- K. Honda, One and Two-dimensional Structure of Alpha-Helix and Beta-Sheet Forms of Poly(L-Alanine) shown by Specific Heat Measurements at Low Temperatures (1.5–20 K), Nature, 1910, 238, 38–40 Search PubMed.
- Y. Li and S. C. E. Tsang, Recent progress and strategies for enhancing photocatalytic water splitting, Mater. Today Sustainability, 2020, 9, 100032 CrossRef.
- K. Maeda, Photocatalytic water splitting using semiconductor particles, J. Photochem. Photobiol., C, 1996, 96, 1825–2236 Search PubMed.
- K. Takanabe, Photocatalytic Water Splitting: Quantitative Approaches toward Photocatalyst by Design, ACS Catal., 2017, 7, 8006–8022 CrossRef.
- N. Serpone, Kirk-Othmer Encyclopedia of Chemical Technology, Wiley, 2000 Search PubMed.
- K. Maeda and K. Domen, Photocatalytic Water Splitting: Recent Progress and Future Challenges, J. Phys. Chem. Lett., 2010, 1, 2655–2661 CrossRef CAS.
- E. Zaki, F. Mirabella, F. Ivars-Barceló and J. Seifert, et al., Water adsorption on the Fe3O4(111) surface: dissociation and network formation, Phys. Chem. Chem. Phys., 2018, 20, 15764–15774 RSC.
- E. Zaki, F. Mirabella, F. Ivars-Barceló, J. Seifert and S. Carey, et al., Water adsorption on the Fe3O4(111) surface: dissociation and network formation, Phys. Chem. Chem. Phys., 2018, 20, 15764–15774 RSC.
- A. Calzolari and A. Catellani, Water adsorption on nonpolar ZnO(1010) surface: a microscopic understanding, J. Phys. Chem. C, 2009, 113, 2896–2902 CrossRef CAS.
- J. J. Calvin, P. F. Rosen and N. L. Ross, et al., Review of surface water interactions with metal oxide nanoparticles, J. Mater. Res., 2019, 34, 416–427 CrossRef CAS.
- R. Mu, Z. J. Zhao, Z. Dohnálek and J. Gong, Structural motifs of water on metal oxide surfaces, Chem. Soc. Rev., 2017, 46, 1785–1806 RSC.
- L. Wang, C. Shi, L. Pan, X. Zhang and J. J. Zou, Rational design, synthesis, adsorption principles and applications of metal oxide adsorbents: a review, Nanoscale, 2020, 12, 4790–4815 RSC.
- U. Qumar, J. Z. Hassan and R. A. Bhatti, et,al, Photocatalysis vs adsorption by metal oxide nanoparticles, J. Mater. Sci. Technol., 2022, 131, 122–166 CrossRef CAS.
- A. Hodgson and S. Haq, Water adsorption and the wetting of metal surfaces, Surf. Sci. Rep., 2009, 64, 381–451 CrossRef CAS.
- M. Sacchi and A. Tamtögl, Water adsorption and dynamics on graphene and other 2D materials: computational and experimental advances, Adv. Phys. X, 2023, 8, 2134051 Search PubMed.
- M. J. Ungerer, D. Santos-Carballal, A. Cadi-Essadek, C. G. C. E. Van Sittert and N. H. De Leeuw, Interaction of H2O with the Platinum Pt (001), (011), and (111) Surfaces: A Density Functional Theory Study with Long-Range Dispersion Corrections, J. Phys. Chem. C, 2019, 45, 27465–27476 CrossRef PubMed.
- H. Eidsvåg, S. Bentouba, P. Vajeeston and S. Yohi, et al., TiO2 as a Photocatalyst for Water Splitting—An Experimental and Theoretical Review, Molecules, 2021, 26, 1687 CrossRef PubMed.
- J. Kegel, I. M. Povey and M. E. Pemble, Zinc oxide for solar water splitting: a brief review of the material's challenges and associated opportunities, Nano Energy, 2018, 54, 409–428 CrossRef CAS.
- M. B. Costa, M. A. de Araújo and M. V. de L. Tinoco, et al., Current trending and beyond for solar-driven water splitting reaction on WO3 photoanodes, J. Energy Chem., 2022, 73, 88–113 CrossRef CAS.
- P. Raizada, S. Sharma, A. Kumar and P. Singh, et al., Performance improvement strategies of CuWO4 photocatalyst for hydrogen generation and pollutant degradation, J. Environ. Chem. Eng., 2020, 8, 104230 CrossRef CAS.
- Y. Tang, N. Rong, F. Liu and M. Chu, et al., Enhancement of the photoelectrochemical performance of CuWO4 films for water splitting by hydrogen treatment, Appl. Surf. Sci., 2016, 361, 133–140 CrossRef.
- K. J. Pyper, J. E. Yourey and B. M. Bartlett, Reactivity of CuWO4 in photoelectrochemical water oxidation is dictated by a midgap electronic state, J. Phys. Chem. C, 2013, 117, 24726–24732 CrossRef.
- Y. Liu, L. Chen and X. Zhu, et al., Effects of operating temperature on photoelectrochemical performance of CuWO4 film photoanode, J. Electroanal. Chem., 2022, 924, 116859 CrossRef.
- L. Kihlborg and E. Gebert, CuWO4, a distorted Wolframite-type structure, Acta Crystallogr., Sect. B: Struct. Crystallogr. Cryst. Chem., 1970, 26, 1020–1026 CrossRef.
- X. Chu, D. Santos-Carballal and N. H. de Leeuw, Exploring the Redox Properties of the Low-Miller Index Surfaces of Copper Tungstate (CuWO4): Evaluating the Impact of the Environmental Conditions on the Water Splitting and Carbon Dioxide Reduction Processes, J. Phys. Chem. C, 2023, 127, 18944–18961 CrossRef PubMed.
- J. E. Yourey and B. M. Bartlett, Electrochemical deposition and photoelectrochemistry of CuWO4, a promising photoanode for water oxidation, J. Mater. Chem., 2011, 21, 7651–7660 RSC.
- K. Li, C. Zhang and X. Li, et al., A nanostructured CuWO4/Mn3O4 with p/n heterojunction as photoanode toward enhanced water oxidation, Catal. Today, 2019, 335, 173–179 CrossRef.
- Z. Lu and Z. Wang, S-scheme CuWO4@g-C3N4 core-shell microsphere for CO2 photoreduction, Mater. Sci. Semicond. Process., 2023, 153, 107177 CrossRef.
- J. E. Yourey and B. M. Bartlett, Electrochemical deposition and photoelectrochemistry of CuWO4, a promising photoanode for water oxidation, J. Mater. Chem., 2011, 21, 7651–7660 RSC.
- T. Wang, X. Fan, B. Gao and C. Jiang, et al., Self-Assembled Urchin-Like CuWO4/WO3 Heterojunction Nanoarrays as Photoanodes for Photoelectrochemical Water Splitting, ChemElectroChem, 2021, 8, 125–134 CrossRef.
- A. C. Catto, T. Fiorido and É. L. S. Souza, et al., Improving the ozone gas-sensing properties of CuWO4 nanoparticles, J. Alloys Compd., 2018, 748, 411–417 CrossRef.
- Y. Liu, L. Chen and X. Zhu, et al., Effects of operating temperature on photoelectrochemical performance of CuWO4 film photoanode, J. Electroanal. Chem., 2022, 924, 116859 CrossRef.
- P. Raizada, S. Sharma and A. Kumar, et al., Performance improvement strategies of CuWO4 photocatalyst for hydrogen generation and pollutant degradation, J. Environ. Chem. Eng., 2020, 8, 104230 CrossRef.
- C. M. Tian, M. Jiang and D. Tang, et al., Elucidating the electronic structure of CuWO4 thin films for enhanced photoelectrochemical water splitting, J. Mater. Chem. A, 2019, 7, 11895–11907 RSC.
- G. Kresse and J. Hafner, Ab. initio molecular dynamics for liquid metals, Phys. Rev. B: Condens. Matter Mater. Phys., 1993, 47, 558 CrossRef PubMed.
- G. Kresse, Ab initio molecular-dynamics simulation of the liquid-metal-amorphous-semiconductor transition in germanium, Phys. Rev. B: Condens. Matter Mater. Phys., 1994, 8, 14251 CrossRef.
- G. Kresse and J. Furthmü, Efficient iterative schemes for ab initio total-energy calculations using a plane-wave basis set, Phys. Rev. B: Condens. Matter Mater. Phys., 1996, 54, 11169 CrossRef.
- J. P. Perdew, K. Burke and M. Ernzerhof, Generalized Gradient Approximation Made Simple, Phys. Rev. Lett., 1996, 77, 3865 CrossRef PubMed.
- S. Grimme, Semiempirical GGA-type density functional constructed with a long-range dispersion correction, J. Comput. Chem., 2006, 27, 1787–1799 CrossRef.
- T. Suter, E. G. Webb, H. Böhni and R. C. Alkire, Pit Initiation on Stainless Steels in 1 M NaCl With and Without Mechanical Stress, J. Electrochem. Soc., 2001, 148, B174 CrossRef.
- S. L. Dudarev, G. A. Botton and S. Y. Savrasov, et al., Electron-energy-loss spectra and the structural stability of nickel oxide: an LSDAU study, Phys. Rev. B: Condens. Matter Mater. Phys., 1998, 57, 1505 CrossRef.
- D. J. Chadi, Special points for Brillouin-zone integrations, Phys. Rev. B: Condens. Matter Mater. Phys., 1977, 16, 1746 CrossRef.
- D. Sheppard, R. Terrell and G. Henkelman, Optimization methods for finding minimum energy paths, J. Chem. Phys., 2008, 128, 134106 CrossRef PubMed.
- P. W. Tasker, The stability of ionic crystal surfaces, Solid State Phys., 1979, 12, 4977–4984 CrossRef.
- G. W. Watson, T. Kelsey and N. H. De Leeuw, et al., Atomistic simulation of dislocations, surfaces and interfaces in MgO, J. Chem. Soc., 1996, 92, 433–438 Search PubMed.
- P. E. Blochl, O. Jepsen and O. K. Andersen, Improved tetrahedron method far Brilleuin-zane integratians, Phys. Rev. B: Condens. Matter Mater. Phys., 1994, 94, 16223 CrossRef PubMed.
- M. W. Chase, Jr., NIST-JANAF Thermochemical Tables, Fourth Edition, J. Phys. Chem. Ref. Data, 1998, 1–1951 Search PubMed.
- D. Santos-Carballal and N. H. de Leeuw, Catalytic formation of oxalic acid on the partially oxidised greigite Fe3S4(001) surface, Phys. Chem. Chem. Phys., 2022, 24, 20104–20124 RSC.
- G. Henkelman, A. Arnaldsson and H. Jónsson, A fast and robust algorithm for Bader decomposition of charge density, Comput. Mater. Sci., 2006, 36, 354–360 CrossRef.
- W. Tang, E. Sanville and G. Henkelman, A grid-based Bader analysis algorithm without lattice bias, J. Phys.: Condens. Matter, 2009, 21, 8 Search PubMed.
- B. Ramogayana, D. Santos-Carballal and K. P. Maenetja, A DFT+U-D3 Study of the Adsorption of Hydrogen Fluoride and Ethylene Carbonate on the Niobium-Doped (001), (011), and (111) Surfaces of Lithium Manganese Oxide, J. Electrochem. Soc., 2022, 169, 090507 CrossRef.
- J. Tersoff and D. R. Hamann, Theory of the scanning tunneling microscope, Phys. Rev. B: Condens. Matter Mater. Phys., 1985, 31, 805 CrossRef PubMed.
- D. E. P. Vanpoucke and G. Brocks, Formation of Pt-induced Ge atomic nanowires on Pt/Ge(001): a density functional theory study, Phys. Rev. B: Condens. Matter Mater. Phys., 2008, 77, 241308 CrossRef.
- A. R. Hoy and P. R. Bunker, A Precise Solution of the Rotation Bending Schrbdinger Equation for a Triatomic Molecule wiih Application to the Water Molecule, J. Mol. Spectrosc., 1979, 74, 1–8 CrossRef.
- G. Herzberg and K. P. Huber, Molecular spectra and molecular structure, Springer US, Boston, MA, 1979, pp. 8–689 Search PubMed.
- T. Shimanouchi, H. Matsuura, Y. Ogawa and I. Harada, Tables of molecular vibrational frequencies, J. Phys. Chem. Ref. Data, 1978, 7, 1323–1444 CrossRef.
- D. H. Gibson, The Organometallic Chemistry of Carbon Dioxide, Chem. Rev., 1996, 96, 2063–2096 CrossRef PubMed.
- D. H. Gibson, Carbon dioxide coordination chemistry: metal complexes and surface-bound species, Coord. Chem. Rev., 1999, 185, 335–355 CrossRef.
- B. Huang and J. N. Hart, DFT study of various tungstates for photocatalytic water splitting, Phys. Chem. Chem. Phys., 2020, 22, 1727–1737 RSC.
Footnote |
| † Electronic supplementary information (ESI) available. See DOI: https://doi.org/10.1039/d4cp02699c |
| This journal is © the Owner Societies 2024 |