
 Open Access Article
 This Open Access Article is licensed under a
 Creative Commons Attribution 3.0 Unported Licence
Machine-learning to predict anharmonic frequencies: a study of models and transferability†
Jamoliddin
Khanifaev
 ,
Tim
Schrader
and
Eva
Perlt
*
,
Tim
Schrader
and
Eva
Perlt
*
Friedrich Schiller University Jena, Löbdergraben 32, 07743 Jena, Germany. E-mail: eva.von.domaros@uni-jena.de; Tel: +49 3641 9-47705
First published on 26th August 2024
Abstract
With more and more accurate electronic structure methods at hand, the inclusion of anharmonic effects in the post-processing of such data towards thermochemical properties is the next step. In this context, the description of anharmonicity has been an important topic of physical chemistry and chemical physics for a long time. In this study, anharmonic frequencies of various hydrogen–halides and halogenated hydrocarbon molecular clusters are calculated using harmonic as well as explicitly anharmonic methods, i.e., normal mode analysis and vibrational self-consistent field. Simple harmonic model based descriptors were used to predict anharmonic frequencies via multilinear regression and gradient boosting regression. Gradient boosting regression is capable of predicting reliable anharmonic data and even the simple multilinear regression model yields reasonable predictions that can account for mode-to-mode couplings. Moreover, the transferability to unseen chemical systems is assessed and it is confirmed that the machine-learned models can be applied to larger, unseen molecules.
1 Introduction
Infrared (IR) vibrational spectroscopy is one of the most widely used techniques in determining the chemical composition and structure of molecular clusters, liquids, and solids as well as interfaces.1–4 However, experimental data is often difficult to interpret due to a lack of atomic level insights, especially for extended systems, so that the analysis is often limited to comparison to reference spectra.In this regard, theoretical/computational IR spectroscopy has been playing a crucial role in complementing, interpreting and predicting experimental results.5 Furthermore, experimental and computational IR spectroscopy data provide necessary input for the evaluation of thermochemical properties such as free energies and equilibrium constants.6–9 However, still today, most of the computational spectroscopic analyses rely on the harmonic approximation of the inter-atomic potential. This is due to the fact that it has a relatively simple mathematical form resulting in computationally affordable simulations and it can yield satisfactory results for high energy vibrational modes especially of the simplest systems, e.g., stiff diatomic molecules in the gas phase.10 Furthermore, the calculated frequencies can be corrected by applying shifts and/or basis set dependent scaling factors to better reproduce experimental data.11
However, this model of an inter-atomic potential is physically incorrect because it does not include repulsive regimes, bond dissociation terms and the couplings between vibrational modes. This deficiency is especially evident for the case of soft vibrations such as bendings, torsions, librations and concerted breathing modes in extended systems, because of the flat curvature of the potential energy surface (PES) around the minimum. Recently, we could show that anharmonic effects play an important role in determining thermochemical properties, such as compositional structural motifs and constant pressure heat capacities, of gaseous and liquid hydrogen fluoride.12
There exist multiple computational protocols to account for anharmonicity in molecular vibrations. Classical molecular dynamics (MD) and its extensions, ab initio MD (AIMD) and path integral MD (PIMD), are among the most widely used ones.13–15 Classical MD simulations employ empirical force fields to represent inter-atomic potentials, which are used to integrate Newton's equations of motion for the atoms numerically. In AIMD, the inter-atomic PES is derived from electronic structure calculations, e.g., density functional theory (DFT), while the nuclear motion is treated classically. Recently, it was shown that the system size and basis set choice can significantly affect the quality of the resulting vibrational spectrum.16 PIMD introduces quantum mechanical effects for nuclei by using Feynman's path integral approach.17 It has been successfully applied to account for nuclear quantum effects and anharmonicity in biochemistry and condensed matter.18 Despite their effectiveness, AIMD and PIMD are computationally very demanding, thus they are usually limited to systems of small sizes.
Another widely used computational technique to account for anharmonicity in molecular vibrations is based on the vibrational self-consistent field (VSCF) method.19–21 In this method, the vibrational nuclear Schrödinger equation is solved in a mean field fashion. By a proper representation of the potential different coupling schemes between the modes can be introduced. Rigorous treatment of the couplings between all the modes for small molecules is also possible.22–24 The correlation effects can then be included using second order perturbation theory (VSCF-PT2). This approach relies on the numerical solution of multidimensional integrals, which is a computationally demanding task, therefore this method is only applicable to rather small systems. Recently, it was shown that VSCF can be used to couple localized modes and introduce anharmonic effects for large organic molecules and polypeptides.25–30
Data analysis and machine learning (ML) tools are becoming increasingly important in various fields of science and technology, including theoretical/computational IR spectroscopy.31–34 The key challenge for the accurate ML predictions of IR spectra lies in the engineering of structural descriptors, i.e., machine readable representations of the molecular structure that can be mapped to the vibrational data. Recently, it was shown that ab initio derived and compositional descriptors can be used to predict thermodynamic properties of polymers and mechanical properties of glasses.35,36 The design of sophisticated descriptors such as Coulomb matrices,37 atom-centered symmetry functions,38 and smooth overlap of atomic positions,39 which represent the local atomic and molecular environment, is an active area of research on its own.32 However, it is not straightforward to predict multiple vibrational modes of poly-atomic molecules or molecular clusters using those descriptors. For this purpose ML is routinely applied to train on and predict the PESs from which force fields and vibrational frequencies are generated.40,41
In this work we propose a ML protocol to predict anharmonic frequencies based on the combination of harmonic and anharmonic data. Namely, we calculate anharmonic frequencies using VSCF type calculations for a number of molecules and clusters to generate the training set. While anharmonic frequencies are the target of the ML algorithm, the descriptors are generated using harmonic normal mode analyses. By exploiting only a minimal number of harmonic model based descriptors, we observe a good improvement over harmonic frequencies. One focus of this study is on the transferability, which is often an issue in ML-based predictions of vibrational spectra.32 We find that while the transferability is limited regarding new types of systems, results can be adapted to larger molecules rather reliably.
The article has the following structure. A brief description of the theoretical background and methods employed is provided in Section 2; Section 3 contains quantum chemical and machine learning computational details; results are presented and discussed in Section 4; and a conclusion is provided in Section 5.
2 Theory and methods
2.1 Normal mode analysis
Standard normal mode analysis42 was used to calculate harmonic frequencies. In this approach the potential energy V is approximated by a parabola, i.e., depending on the square of the displacement of atoms from their equilibrium positions in mass-weighted Cartesian coordinates, denoted as qi. The 3N × 3N Hessian matrix Hcart is constructed from the second derivatives of the potential energy V of the molecular cluster in its minimum energy geometry with respect to qi, where N is the number of atoms in the system and i runs from 1 to 3N. With the appropriate transformations of Hcart to internal coordinates and subsequent diagonalization as well as separation of translational and rotational degrees of freedom, resulting in 3N − 6 or 3N − 5 vibrational modes for nonlinear and for linear molecules, respectively, the fundamental frequencies![[small nu, Greek, tilde]](https://www.rsc.org/images/entities/i_char_e0e1.gif) i (eigenvalues), reduced masses μi (from eigenvectors) and force constants ki for each normal mode i are obtained. These quantities have the simple relation
i (eigenvalues), reduced masses μi (from eigenvectors) and force constants ki for each normal mode i are obtained. These quantities have the simple relation | (1) |
2.2 VSCF method
Very common methods to gain access to the fundamental and overtone anharmonic frequencies are based on the vibrational self-consistent field approach.19,21,43 In the VSCF method the vibrational Schrödinger equation is solved self-consistently for all the vibrational modes present in the system.The important assumption is that the total vibrational wavefunction can be approximated as the product of the single mode vibrational wavefunctions. This leads to a set of simplified single mode SCF equations in which each mode is oscillating in the effective (mean field) potential arising from all the remaining modes. An exact solution of the vibrational Schrödinger equation is infeasible because of the need to evaluate multidimensional integrals. However, with appropriate expansion and decomposition of the potential function,19 so-called diagonal frequencies (Diag) can be obtained. Diagonal frequencies represent Morse-like intrinsic anharmonic oscillators44 with no couplings taken into account, so they are generally less accurate. VSCF frequencies (VSCF) are derived from Diag by including couplings between the modes and in the present study only pairwise couplings are considered. The VSCF method can be extended by incorporating correlation effects using second-order Møller–Plesset perturbation theory which results in VSCF-PT2 frequencies (VSCF-PT2).
2.3 ML methods
In this work supervised multilinear regression (MLR) and gradient boosting regression (GBR) were applied to predict anharmonic frequencies of molecular clusters of various sizes and kinds.MLR can be considered as the simplest regression model. The advantage of this method is clearly the simplicity and the fact that results are easily interpreted. MLR relies on minimization of the residual sum of squares between the targets in the dataset and predictions made by the linear model. Other, more sophisticated ML models are based on the same principles as MLR, i.e., the minimization of some loss function for the model predictions.45,46
GBR uses an ensemble of ML methods, e.g., decision trees, as weak learners (simpler models). The data is fitted by minimizing an arbitrary loss function such as mean squared error (MSE) or mean absolute error (MAE). GBR does not require transformations of the input data such as standardization and normalization.45,46
To measure the performance of the ML model on the unseen data, the dataset is split into training, validation and test sets. The ML model is built on the training and validation sets and the performance of the optimized model is evaluated using the test set. This process can be automatically done using various schemes of cross validation (CV) with hyperparameter tuning within scikit-learn.47
3 Computational details
3.1 Quantum chemical calculations
The NWChem 7.0.2 package48 was utilized to calculate minimum energy geometries, harmonic and anharmonic frequencies of the clusters. The BLYP49 exchange correlation functional and Grimme's dispersion correction with Becke–Johnson damping D3(BJ)50,51 were employed in all calculations.The def2-TZVP52 basis set was used for most of the clusters. For some clusters, VSCF-PT2 calculations became infeasible in that basis set, so that we had to resort to def2-SVPD53,54 or def2-SVP52 basis sets. Table S1 in the ESI† contains the full list of clusters and the corresponding information on the basis sets used in calculations.
Default SCF energy and energy gradient convergence criteria were applied with the values of 10−6 a.u. and 10−4 a.u., respectively.
Harmonic frequencies were calculated using standard normal mode analysis.42 Anharmonic diagonal, VSCF and VSCF-PT2 frequencies were computed using Gaussian vibrational basis functions with the Gauss–Hermite quadrature for 16 grid points along each mode as implemented in NWChem 7.0.2.19 In this study only pairwise couplings were considered.
3.2 Dataset
The full dataset employed for ML training, validation and testing consists of vibrational data of 29 molecular clusters. The clusters are HX (up to tetramers; HF up to pentamer), CH3X (up to dimers) and C2H5X (only monomers) with X = F, Cl, Br. The lowest modes of (HF)3-c (def2-SVPD), (CH3Cl)2, (CH3Br)2, the two lowest modes of (HF)3-cl and of (CH3F)2 were identified as outliers due to unrealistic (negative) anharmonic frequencies. To obtain realistic frequencies of these modes higher order couplings (>2) between the modes and/or a denser grid are needed, which will be incorporated in our future studies. The outliers were eliminated which resulted in the final dataset consisting of 390 vibrational modes. This dataset size is insufficient for deep learning and artificial neural networks algorithms. However, the MLR and especially GBR, employed in this study, are applicable for relatively small and imbalanced data.55,563.3 Validation
To assess the quality of the quantum chemically obtained training data, the results of the system CH3F are compared to an experimental reference57,58 as well as spectra generated via an ab initio molecular dynamics (AIMD) simulation.Fig. S6–S8 in the ESI† show the vibrational spectra obtained from diagonal frequencies (Fig. S6, ESI†), VSCF (Fig. S7, ESI†), and VSCF-PT2 (Fig. S8, ESI†), each represented by the red curve, respectively, in comparison to AIMD data shown by the black curve and experimental peak positions indicated by blue dashed lines. Overall, all quantum chemical methods agree well with the AIMD reference. The vibrations at lower frequencies show a very good agreement between simulation and static calculation, whereas larger deviations are observed for stretching vibrations at higher frequencies. For the latter ones, diagonal frequencies show the best agreement with the simulation data and VSCF-PT2 result deviate most from the AIMD results. The high-intensity C–F stretching vibration below 1000 cm−1 agrees very well with AIMD data but deviates from the experimental reference for all methods applied in this study. The agreement with experimental data for the high-frequency vibrations is reasonable, again VSCF and VSCF-PT2 deviate slightly more than diagonal frequencies.
3.4 Descriptors, regression and parametrization of the models
Based on the earlier studies we used harmonic frequencies, reduced masses, force constants, intensities of fundamental modes, symmetry group number, group order, which are readily available or can be derived from the NWChem output, and manually detected symmetry of vibrations as potential descriptors.59 The targets of ML predictions were the differences between harmonic and anharmonic frequencies, i.e.,harm − anh. Pearson correlation coefficients and manual testing of the sets of descriptors showed that only harmonic frequencies, reduced masses, and intensities affect the prediction scores significantly.
The MLR and GBR45 as implemented in the scikit-learn 1.02 library47 were employed for the prediction of anharmonic frequencies. The models were trained on the dataset described in Section 3.2.
In case of GBR 90% of the dataset (351 data points) was used for training and validation. Leave-one-out cross validation (LOOCV) within the GridSearchCV method was used for the hyperparameter optimization during training and validation employing the squared error loss function. The optimized hyperparameters are: learning_rate = 0.5, max_depth = 5, n_estimators = 150 for diagonal frequencies; learning_rate = 0.1, max_depth = 4, n_estimators = 250 for VSCF frequencies; learning_rate = 0.2, max_depth = 5, n_estimators = 100 for VSCF-PT2 frequencies. The descriptors set was standardized using the StandardScaler preprocessing utility within scikit-learn. The model with optimal parameters was applied to predict the anharmonic shifts of the test set containing 10% of the dataset (39 data points), to examine generalization.
Furthermore, LOOCV was applied to the whole dataset to predict anharmonic frequencies of each mode using MLR and GBR. The results of ML predictions were compared to harmonic frequencies using the MAE score. The models are sufficiently converged as shown in the corresponding plots of the learning curves in Fig. S1 and S2 of the ESI.†
To study the transferability of the GBR for our dataset leave-one-system-out cross validation was employed. In other words, for each system considered in this study, i.e., HF, HCl, etc., all clusters of the respective system were excluded from the training set for the GBR model. The trained model is applied then to predict anharmonic frequencies of the excluded data, i.e., the unseen system. For this step default parameters of scikit-learn's GradientBoostingRegressor were employed.
4 Results and discussion
4.1 Descriptors
Fig. 1 represents scatter plots of the relation of reduced masses with harmonic frequencies (left panel) and force constants with harmonic frequencies (right panel). These quantities are the direct result of the harmonic normal mode analysis. In general higher frequencies (>2000 cm−1) represent stretching, whereas lower frequencies represent bending, torsion, libration and consorted breathing vibrations. 290 modes (74%) have a reduced mass of ∼1 g mol−1, as shown in the left panel of Fig. 1, representing hydrogen/proton vibrations. Out of these, 155 modes (53%) belong to hydrocarbon based and 135 modes (47%) belong to hydrogen halide based clusters. The right panel of Fig. 1 visualizes the dependence of the harmonic frequency on the square root of the force constant, see eqn (1). While vibrations with higher reduced masses correspond to smaller wavenumbers, those with a reduced mass of ∼1 g mol−1 cover the entire range of vibrational frequencies so that a clustering analysis prior to the regression is not sensible. 281 modes (72%) have force constants of less than 2.5 mDyn Å−1. Fig. 2 shows the correlation coefficient for each pair of descriptors. As can be seen from eqn (1) and confirmed by a correlation coefficient of 0.95 in Fig. 2, the force constant and harmonic wavenumber are linearly dependent and redundant. The feature importance chart of the selected descriptor set is provided in the Fig. S18 of the ESI† file.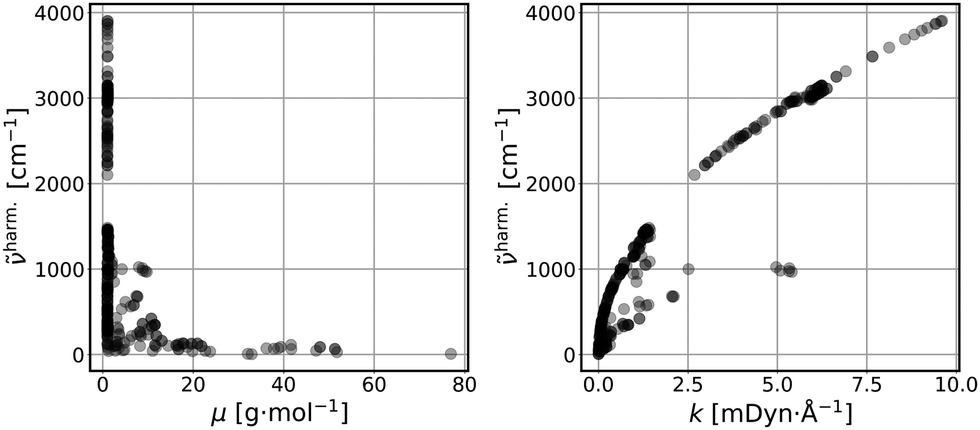 | ||
| Fig. 1 Reduced masses (μ) vs. harmonic frequencies (harm) (left panel); force constants (k) vs. harmonic frequencies (harm) (right panel) of the vibrational modes (390 data points). | ||
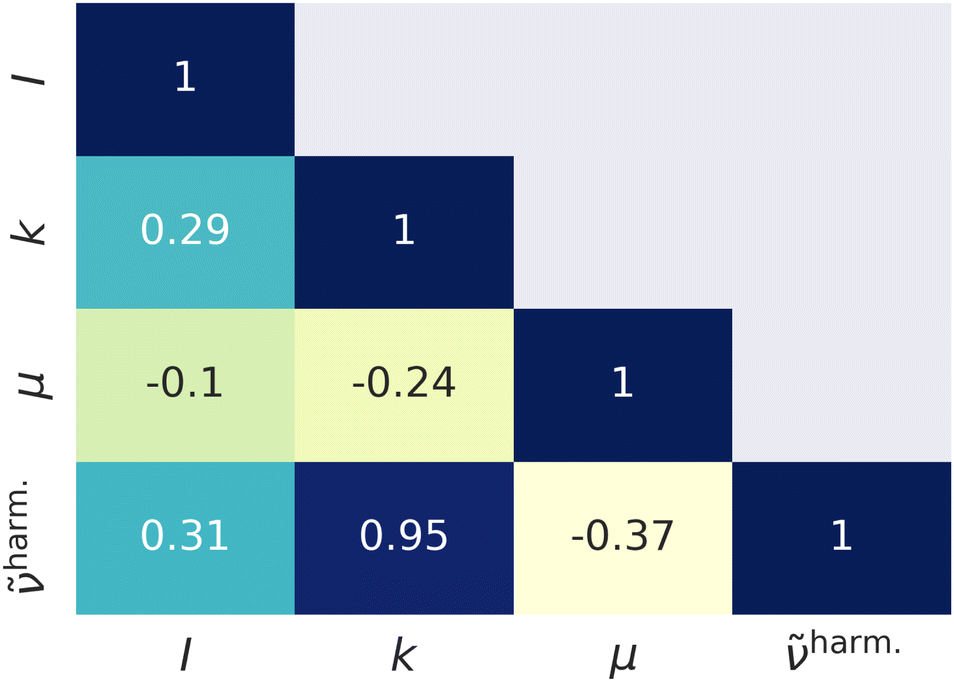 | ||
| Fig. 2 Linear correlation coefficients of the descriptors. I – intensity of the harmonic vibration. | ||
Moreover, new descriptors based on the harmonic ones were engineered using sure independence screening and sparsifying operator (SISSO).60 However, the effect of the engineered descriptors was only negligible at the expense of losing their mathematical simplicity and interpretability. Therefore, we omit SISSO results in this study.
4.2 ML predictions for anharmonic frequencies
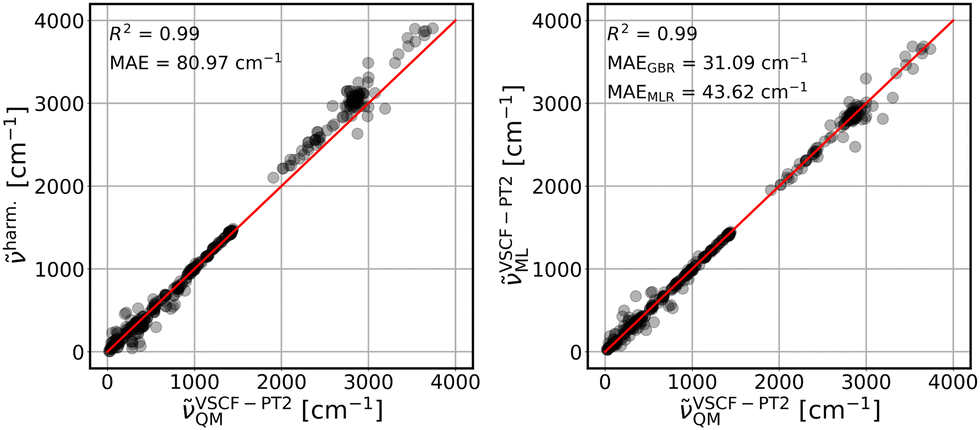
The parameterized GBR model, with parameters mentioned in Section 3.4, is applied to predict the anharmonic frequencies of the test set containing 10% of the dataset (39 data points). The MAEs of the predictions with respect to the explicitly anharmonic reference data are 16.01 cm−1 for diagonal, 20.32 cm−1 for VSCF and 31.56 cm−1 for VSCF-PT2 frequencies.To compare the ML predictions to simple harmonic calculations, the respective correlation plots are given in Fig. 3–5. The left panels show the correlation between harmonic frequencies and calculated anharmonic data together with the corresponding MAE. The right panels show the correlation between predicted and calculated anharmonic values. In the respective right panels, the MAE of the GBR, using LOOCV applied to the whole dataset (390 data points), is provided. The MAE of the MLR model is also given as a reference and the corresponding predictions are plotted in Fig. S3–S5 in the ESI† file.
 | ||
| Fig. 3 Left panel: QM calculated diagonal frequencies (DiagQM) vs. harmonic frequencies (harm); right panel: QM calculated diagonal frequencies (DiagQM) vs. ML predicted diagonal frequencies (DiagML). DiagML are LOOCV GBR predictions. Red lines are ideal diagonals. | ||
 | ||
| Fig. 4 Same as Fig. 3 for VSCF frequencies. VSCFML are LOOCV GBR predictions. Red lines are ideal diagonals. | ||
 | ||
| Fig. 5 Same as Fig. 3 for VSCF-PT2 frequencies. VSCF-PT2ML are LOOCV GBR predictions. Red lines are ideal diagonals. | ||
The harmonic approximation yields results which agree reasonably with diagonal frequencies, see Fig. 3, left panel. This is not surprising, since these do not include mode-to-mode couplings. The linear model performs similarly well and the GBR model improves predictions significantly, see Fig. 3, right panel. The more appropriate GBR model can compensate for the small dataset55,56 which yields much better results with a MAE of 19.71 cm−1. We observe significant improvement of the ML predictions over harmonic frequencies in all cases if the GBR is applied.
The VSCF frequencies, which include mode-to-mode couplings, show much larger deviations from harmonic data with a MAE of 81.02 cm−1, see left panel of Fig. 4. Both ML models are able to cover this effect and result in improved MAEs. The GBR yields a similar quality as for the diagonal frequencies with a MAE of 22.10 cm−1 while the results from the linear models improve significantly resulting in a MAE of 37.06 cm−1. The rather good performance of the linear model for these frequencies is surprising given the simplicity of the model and training data based on the purely harmonic descriptors.
Finally, the treatment of intermode couplings and correlation effects as included by second order perturbation theory, see Fig. 5, is similarly covered by harmonic frequencies with a MAE of 80.97 cm−1 in comparison to the VSCF case, see Fig. 4, left panel. However, it challenges both ML models, which is reflected in slightly worse results, as compared to predictions of VSCF frequencies, with MAEs of 31.09 cm−1 for GBR and 43.62 cm−1 for MLR. Nevertheless, both models yield a significant improvement over harmonic data.
A comparison of ML predicted results to both experimental peak locations57,58 and AIMD results is given in Fig. S9–S11 in the ESI† for the example of a single molecule of CH3F. For vibrational modes at high frequencies, the agreement with both references is comparable to the observations made for the QM calculated anharmonic data (Fig. S6–S8 of the ESI†) and overall satisfying. Interestingly, all ML models fail in predicting the C–F stretching vibration, resulting in a far too large wavenumber. As discussed below in Section 4.3, this particular vibrational mode is challenging both ML methods due to the absence of dipole moment information in the descriptor set.
To get more insights into what physical effects cause the deviations of the ML models and hence, are most challenging for the models, further analyses have been performed. GBR predictions have been made targeting the shift between diagonal and VSCF frequencies, whereas the diagonal frequencies have been included in the descriptor set allowing to separate the intrinsic anharmonicity covered in the diagonal frequencies from the intermode couplings. The results are shown in Fig. S12 in the ESI† and a MAE of 20.38 cm−1 is observed. This result is only slightly better than the MAE reported in Fig. 4 indicating that the intrinsic anharmonicity only accounts for a minor part of the absolute deviation.
Similar analyses have been conducted for the shift between diagonal and VSCF-PT2 frequencies based on diagonal frequencies as descriptors (see Fig. S13 in the ESI,† MAE = 31.70 cm−1) and VSCF-PT2 frequencies based on VSCF frequencies as descriptors (see Fig. S14 in the ESI,† MAE = 18.19 cm−1). Again, if diagonal frequencies are included in the original descriptor set, the absolute deviation is comparable to the one given in Fig. 5 indicating that the deviations of the ML model are almost completely due to intermode couplings. This is supported by the observation that the deviation can be reduced significantly, if VSCF is chosen as a reference and thus, mode-to-mode couplings are to some extent already covered in the descriptor set. Therefore, an improvement of the predicted data can be expected if the descriptor set is expanded, for example using the full Hessian.
It should be noted that the relative error of the ML predictions increases with decreasing frequencies for all anharmonic models. Since the low-frequency modes are rather impactful in the calculation of thermodynamic properties, Fig. S15–S17 of the ESI† provide more detailed statistics on these modes for diagonal, VSCF, and VSCF-PT2 data, respectively. While the respective left panels display the absolute deviations for the entire spectral region, the right panels show the ML predicted data correlated to QM calculated numbers of the low-frequency modes. It is observed that the spread of the data is comparable for both low and high frequency regions. Also, the visualized ML data as well as the R2 scores and the MAEs are comparable to the numbers obtained for the entire spectrum, respectively.
4.3 Transferability
To investigate to what extent the models are transferable to different, unseen systems, we performed leave-one-system-out cross validation using GBR with default parameters. That means, for each chemical system considered in this study, i.e., HF, HCl, etc., all corresponding clusters’ vibrations were excluded from the training set and the resulting model was then applied to all vibrational data of the respective system for validation. The corresponding MAEs for the ML model (black circles) in comparison to harmonic frequencies (red circles) are displayed for diagonal frequencies (Fig. 6), VSCF frequencies (Fig. 7) as well as VSCF-PT2 frequencies (Fig. 8).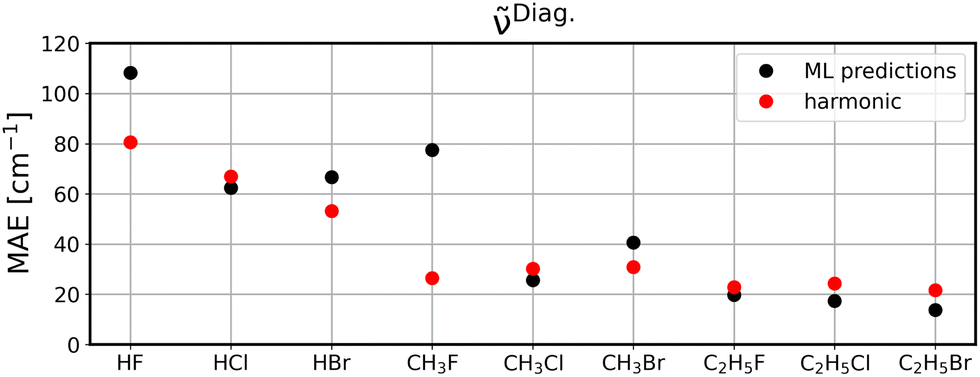 | ||
| Fig. 6 Leave-one-system-out cross validation MAEs when predicting diagonal frequencies. Black circles are GBR predictions and red circles are harmonic calculations. | ||
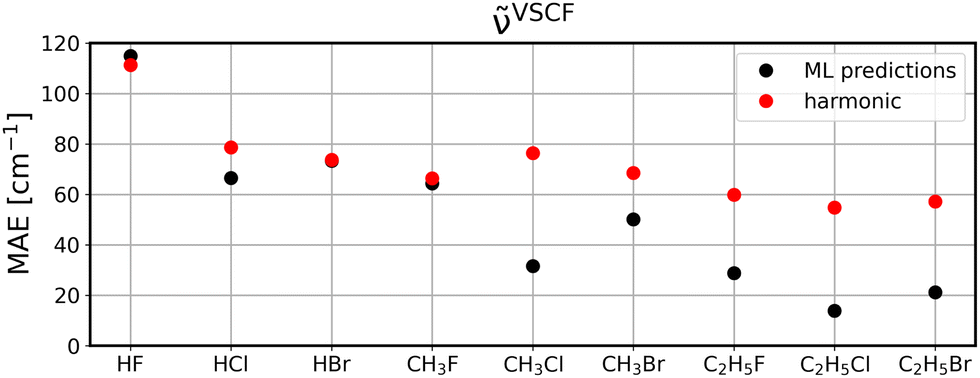 | ||
| Fig. 7 Same as Fig. 6 for VSCF frequencies. | ||
 | ||
| Fig. 8 Same as Fig. 6 for VSCF-PT2 frequencies. | ||
Quantitatively, the results are satisfying with MAEs ranging from less than 20 cm−1 to as much as almost 120 cm−1. While this is certainly not sufficiently accurate, this accuracy indicates that the models are mostly transferable, since they are—except for some outliers discussed below—comparable to the LOOCV data presented in the previous section.
It is observed that in the case of diagonal frequencies, the ML model performs very poorly and especially for the systems HF and CH3F the harmonic approximation yields much better agreement. Even for the other systems, the harmonic results and ML predictions are comparable. A more detailed discussion on the outlier CH3F is given later in this section.
Interestingly, if mode-to-mode couplings are included in the case of VSCF and VSCF-PT2 frequencies the results are much better as displayed in Fig. 7 and 8. GBR predictions are in the majority of cases more accurate than the harmonic approximation and importantly, for systems larger than CH3F the ML predictions are more reliable than harmonic results. This observation indicates that a modular approach is feasible to predict anharmonic spectra of larger molecules based on training data for the fragments of the molecule, as can be concluded from the low MAEs for the ethyl compounds in Fig. 7 and 8.
The observed trend is in agreement with the overall performance of the model for the three different vibrational methods discussed in Section 4.2.
The disappointing results for the diagonal frequencies can be explained by the fact that diagonal frequencies do not account for mode-to-mode couplings and hence, the harmonic approximation is more reliable here than for the other anharmonic methods. As the accuracy of the reference method increases the harmonic approximation becomes significantly less accurate and is outperformed by the ML models.
Examplarily, the vibrational spectrum of CH3F is analyzed in more detail and compared to AIMD results as well as to experimental data,57,58 see Fig. S9–S11 in the ESI.† With the exception of one vibrational mode, all spectra are well predicted by the ML model, even if applied to unseen data, and a good agreement with both the AIMD and the experimental reference is observed. The C–F stretching mode at ∼1000 cm−1, which is the one with the highest intensity, is apparently shifted to higher frequencies, resulting in the peak slightly above 1500 cm−1 for the diagonal frequencies and even at ∼1700 cm−1 for VSCF and VSCF-PT2, respectively. Due to its large change in the molecular dipole moment, this mode exhibits a high intensity. It is concluded that this vibration is problematic in terms of transferability, causing the poor MAEs observed in Fig. 6–8. Notably, the problem of a large dipole moment change also persists for other problematic cases such as HF. Including dipole moments in the descriptor set in future studies will likely improve these outliers.
Still, considering the fact that only harmonic and uncoupled features are considered for the ML predictions, the observed transferability for frequencies with mode-to-mode couplings is encouraging. Moreover, while the figures demonstrate that the present dataset is insufficient to predict anharmonic spectra of HF and CH3F, these system are less relevant in potential applications, since these systems can be treated by explicitly anharmonic calculations directly with a reasonable amount of computational resources. The transfer of knowledge from small building blocks to larger molecules is more desirable, since these are infeasible for explicitly anharmonic calculations. In that regard, the emphasis is on the reasonable performance of ML models to predict CH3Cl, CH3Br, C2H5F, C2H5Cl, and C2H5Br.
It is noted that the systems considered in this study are rather small and especially the aspect of transferability should be investigated for larger systems. While not relevant in these small molecules and clusters, the localization of vibrational modes will play a major role for the transferability and needs to be taken into account if larger clusters are considered. Furthermore, the limited transferability for very polar systems such as HF and CH3F can probably be improved, if auxiliary molecular descriptors are taken into account.
Finally it is expected that increasing the variety of the dataset, improving the consistency with regard to the basis set and using more accurate functionals should improve the accuracy and transferability of ML models.
5 Conclusions
Anharmonic and harmonic vibrational data for different sized clusters of HX, CH3X and C2H5X with X = F, Cl, Br were generated using VSCF and normal mode analysis, respectively, as implemented in NWChem. The resulting data set consists of 390 data points. scikit-learn's gradient boosting regression (GBR) algorithm with leave-one-out cross validation was employed to train on and predict diagonal, VSCF and VSCF-PT2 anharmonic frequencies of the vibrational data set. The simple multilinear regression (MLR) was also applied for the sake of comparison. The descriptor set consists of only three quantities generated by harmonic calculations, namely harmonic frequencies, reduced masses and intensities.It is shown that the GBR predicts anharmonic frequencies well, which is represented in a significantly lower mean absolute error (MAE) of the predictions compared to harmonic frequencies. As the level of theory of anharmonic frequencies increases, the performance of GBR predictions deteriorates due to the simplicity (absence of mode-to-mode couplings), low number of harmonic model based descriptors employed and scarcity of the data. Interestingly MLR predictions, despite having overall larger deviations as compared to the GBR model, outperform the harmonic approximation especially for VSCF and VSCF-PT2 cases. Thus, important mode-to-mode couplings can be covered by such a simple model using only harmonic individual mode descriptors.
Importantly, the transferability was evaluated for GBR by excluding each molecular system type at a time from the vibrational training data and predicting anharmonic frequencies of the respective unseen system. The MAEs of predictions were compared to those of harmonic frequencies. While the transferability is rather disappointing for diagonal frequencies, an improvement of predictions over harmonic data is observed if mode-to-mode couplings are present. Thus, the predictions are well transferable, especially for larger molecules with increasing carbon chain length for highly anharmonic frequencies, i.e., VSCF and VSCF-PT2. To enhance the transferability of ML predictions for hydrogen–halide based systems, the quantity and the quality of training data, i.e., consistency in the basis sets, as well as the accuracy of the functionals, should be improved. Moreover, to improve the calculated anharmonic frequencies and to avoid the issue with unphysical outliers, we intend to include higher order couplings between the modes and a denser grid in future studies. Engineering new descriptors containing information of mode-to-mode couplings is the crucial step for the successful application of the protocol proposed in this study. In future studies, the consideration of further features in addition to harmonic data, such as molecular structure, normal mode vectors, or the Hessian may improve the ML models. Additionally, such structural descriptors are related to the dipole moment and its changes and will therefore allow the prediction of intensities of vibrational modes. Another aspect to be included in upcoming projects on larger clusters structures will cover the question of whether or not the localization of vibrational modes should be done prior to model training or whether this effect can be covered by the ML model directly.
Author contributions
Jamoliddin Khanifaev: formal analysis; investigation; writing – original draft. Tim Schrader: validation; writing – review and editing. Eva Perlt: conceptualization; supervision; writing – original draft.Data availability
The data supporting this article have been included as part of the ESI.†Conflicts of interest
There are no conflicts to declare.Acknowledgements
The authors gratefully acknowledge the funding from the Carl Zeiss Foundation within the Breakthroughs Program. The authors also gratefully acknowledge the financial support from the Turbomole GmbH. We thank Professor Marek Sierka for fruitful discussions.Notes and references
- T. Häber, U. Schmitt and M. A. Suhm, Phys. Chem. Chem. Phys., 1999, 1, 5573–5582 RSC.
- V. H. Paschoal, L. F. O. Faria and M. C. C. Ribeiro, Chem. Rev., 2017, 117, 7053–7112 CrossRef CAS PubMed.
- P. M. A. Sherwood, Vibrational Spectroscopy of Solids, CUP Archive, 1972 Search PubMed.
- A. R. Hind, S. K. Bhargava and A. McKinnon, Adv. Colloid Interface Sci., 2001, 93, 91–114 CrossRef CAS PubMed.
- V. Barone, S. Alessandrini, M. Biczysko, J. R. Cheeseman, D. C. Clary, A. B. McCoy, R. J. DiRisio, F. Neese, M. Melosso and C. Puzzarini, Nat. Rev. Methods Primers, 2021, 1, 38 CrossRef CAS.
- E. Garrone and C. O. Areán, Chem. Soc. Rev., 2005, 34, 846–857 RSC.
- C. O. Areán, O. V. Manoilova, G. T. Palomino, M. R. Delgado, A. A. Tsyganenko, B. Bonelli and E. Garrone, Phys. Chem. Chem. Phys., 2002, 4, 5713–5715 RSC.
- J. Ingenmey, M. von Domaros, E. Perlt, S. P. Verevkin and B. Kirchner, J. Chem. Phys., 2018, 148, 193822 CrossRef PubMed.
- E. Perlt, M. von Domaros, B. Kirchner, R. Ludwig and F. Weinhold, Sci. Rep., 2017, 7, 10244 CrossRef PubMed.
- D. A. McQuarrie and J. D. Simon, Physical Chemistry: A Molecular Approach, University Science Books, 1997 Search PubMed.
- M. K. Kesharwani, B. Brauer and J. M. L. Martin, J. Phys. Chem. A, 2015, 119, 1701–1714 CrossRef CAS PubMed.
- J. Khanifaev, T. Schrader and E. Perlt, J. Chem. Phys., 2024, 160, 124302 CrossRef CAS PubMed.
- R. Car and M. Parrinello, Phys. Rev. Lett., 1985, 55, 2471–2474 CrossRef CAS.
- M. Thomas, M. Brehm, R. Fligg, P. Vöhringer and B. Kirchner, Phys. Chem. Chem. Phys., 2013, 15, 6608–6622 RSC.
- D. Marx and M. Parrinello, J. Chem. Phys., 1996, 104, 4077–4082 CrossRef CAS.
- S. Taherivardanjani, R. Elfgen, W. Reckien, E. Suarez, E. Perlt and B. Kirchner, Adv. Theory Simul., 2022, 5, 2100293 CrossRef CAS.
- J. Cao and G. A. Voth, J. Chem. Phys., 1994, 100, 5093–5105 CrossRef CAS.
- T. E. Markland and M. Ceriotti, Nat. Rev. Chem., 2018, 2, 1–14 CrossRef.
- J. O. Jung and R. B. Gerber, J. Chem. Phys., 1996, 105, 10332–10348 CrossRef CAS.
- G. M. Chaban, J. O. Jung and R. B. Gerber, J. Chem. Phys., 1999, 111, 1823–1829 CrossRef CAS.
- S. Carter, S. J. Culik and J. M. Bowman, J. Chem. Phys., 1997, 107, 10458–10469 CrossRef CAS.
- P. M. Felker and Z. Bačić, J. Chem. Phys., 2023, 158, 234109 CrossRef CAS PubMed.
- P. M. Felker and Z. Bačić, J. Chem. Phys., 2019, 151, 024305 CrossRef PubMed.
- D. H. Zhang, Q. Wu, J. Z. H. Zhang, M. von Dirke and Z. Bačić, J. Chem. Phys., 1995, 102, 2315–2325 CrossRef CAS.
- P. T. Panek and C. R. Jacob, J. Phys. Chem. Lett., 2016, 7, 3084–3090 CrossRef CAS PubMed.
- P. T. Panek and C. R. Jacob, ChemPhysChem, 2014, 15, 3365–3377 CrossRef CAS PubMed.
- T. Weymuth, M. P. Haag, K. Kiewisch, S. Luber, S. Schenk, C. R. Jacob, C. Herrmann, J. Neugebauer and M. Reiher, J. Comput. Chem., 2012, 33, 2186–2198 CrossRef CAS PubMed.
- X. Cheng and R. P. Steele, J. Chem. Phys., 2014, 141, 104105 CrossRef PubMed.
- M. W. D. Hanson-Heine, J. Chem. Phys., 2015, 143, 164104 CrossRef PubMed.
- P. M. Zimmerman and P. Smereka, J. Chem. Theory Comput., 2016, 12, 1883–1891 CrossRef CAS.
- M. Meuwly, J. Phys. Chem. B, 2022, 126, 2155–2167 CrossRef CAS PubMed.
- R. Han, R. Ketkaew and S. Luber, J. Phys. Chem. A, 2022, 126, 801–812 CrossRef CAS PubMed.
- S. Käser, E. D. Boittier, M. Upadhyay and M. Meuwly, J. Chem. Theory Comput., 2021, 17, 3687–3699 CrossRef PubMed.
- J. Lam, S. Abdul-Al and A.-R. Allouche, J. Chem. Theory Comput., 2020, 16, 1681–1689 CrossRef CAS PubMed.
- M. Chi, R. Gargouri, T. Schrader, K. Damak, R. Maâlej and M. Sierka, Polymers, 2022, 14, 26 CrossRef CAS PubMed.
- F. Arendt, R. Limbach, L. Wondraczek and M. Sierka, J. Am. Ceram. Soc., 2024, 107, 5841–5853 CrossRef CAS.
- M. Rupp, A. Tkatchenko, K.-R. Müller and O. A. von Lilienfeld, Phys. Rev. Lett., 2012, 108, 058301 CrossRef PubMed.
- J. Behler, J. Chem. Phys., 2011, 134, 074106 CrossRef PubMed.
- A. P. Bartók, R. Kondor and G. Csányi, Phys. Rev. B: Condens. Matter Mater. Phys., 2013, 87, 184115 CrossRef.
- J. M. Bowman, C. Qu, R. Conte, A. Nandi, P. L. Houston and Q. Yu, J. Chem. Theory Comput., 2023, 19, 1–17 CrossRef CAS PubMed.
- J. Behler and M. Parrinello, Phys. Rev. Lett., 2007, 98, 146401 CrossRef PubMed.
- E. B. Wilson, J. C. Decius and P. C. Cross, Molecular vibrations: the theory of infrared and Raman vibrational spectra, Courier Corporation, 1980 Search PubMed.
- V. Barone, J. Chem. Phys., 2004, 122, 014108 CrossRef PubMed.
- P. M. Morse, Phys. Rev., 1929, 34, 57–64 CrossRef CAS.
- T. Hastie, R. Tibshirani and J. Friedman, The Elements of Statistical Learning, Springer, 2009 Search PubMed.
- A. C. Müller and S. Guido, Introduction to Machine Learning with Python: A Guide for Data Scientists, O’Reilly Media, Inc., 2016 Search PubMed.
- F. Pedregosa, G. Varoquaux, A. Gramfort, V. Michel, B. Thirion, O. Grisel, M. Blondel, P. Prettenhofer, R. Weiss and V. Dubourg, et al. , J. Mach. Learn. Res., 2011, 12, 2825–2830 Search PubMed.
- E. Apra, E. J. Bylaska, W. A. De Jong, N. Govind, K. Kowalski, T. P. Straatsma, M. Valiev, H. J. van Dam, Y. Alexeev and J. Anchell, et al. , J. Chem. Phys., 2020, 152, 184102 CrossRef CAS PubMed.
- A. D. Becke, Phys. Rev. A: At., Mol., Opt. Phys., 1988, 38, 3098 CrossRef CAS PubMed.
- S. Grimme, J. Antony, S. Ehrlich and H. Krieg, J. Chem. Phys., 2010, 132, 154104 CrossRef PubMed.
- S. Grimme, S. Ehrlich and L. Goerigk, J. Comput. Chem., 2011, 32, 1456–1465 CrossRef CAS PubMed.
- F. Weigend and R. Ahlrichs, Phys. Chem. Chem. Phys., 2005, 7, 3297–3305 RSC.
- D. Rappoport and F. Furche, J. Chem. Phys., 2010, 133, 134105 CrossRef PubMed.
- A. Hellweg and D. Rappoport, Phys. Chem. Chem. Phys., 2015, 17, 1010–1017 RSC.
- P. Xu, X. Ji, M. Li and W. Lu, npj Comput. Mater., 2023, 9, 1–15 CrossRef.
- Y. Zhang and C. Ling, npj Comput. Mater., 2018, 4, 1–8 CrossRef.
- S. Kondo and S. Saëki, J. Chem. Phys., 1982, 76, 809–816 CrossRef CAS.
- T. H. Chao and D. F. Eggers, Jr., J. Chem. Phys., 1977, 66, 970–975 CrossRef CAS.
- E. Perlt, S. A. Berger, A.-M. Kelterer and B. Kirchner, J. Chem. Theory Comput., 2019, 15, 2535–2547 CrossRef CAS PubMed.
- R. Ouyang, S. Curtarolo, E. Ahmetcik, M. Scheffler and L. M. Ghiringhelli, Phys. Rev. Mater., 2018, 2, 083802 CrossRef CAS.
Footnote |
| † Electronic supplementary information (ESI) available: Basis set information; learning curves; multilinear regression predictions of anharmonic frequencies; AIMD computational details; comparison of QM anharmonic and AIMD spectra; comparison of ML anharmonic and AIMD spectra; low-frequency modes statistics; feature importance. See DOI: https://doi.org/10.1039/d4cp01789g |
| This journal is © the Owner Societies 2024 |