Experimental investigation and thermodynamic modelling assessment of the AECl2–NdCl3 (AE = Sr, Ba) systems†
Received
30th April 2024
, Accepted 4th August 2024
First published on 9th September 2024
Abstract
The thermodynamic and thermo-physical properties of the binary salt systems AECl2–NdCl3 (AE = Sr, Ba) have been investigated using an experimental and modelling approach. The binary salt systems both include a single intermediate salt, i.e. Sr9Nd5Cl33 and Ba3Nd2Cl12, respectively. The structure of these intermediates has been investigated with X-ray diffraction (XRD). Furthermore, these systems exhibit mutual solubility of NdCl3 in BaCl2 and SrCl2. The investigation of these solid solutions has been performed using quenching experiments and subsequent post-characterisation by XRD. Phase diagram equilibria have also been investigated using differential scanning calorimetry (DSC). Using the aforementioned information on phase transitions, intermediate compound formation, and solid solubility, thermodynamic assessment of the systems has been performed using the CALPHAD method. The model for the Gibbs energy of the liquid solution is the quasi-chemical formalism in the quadruplet approximation, while the model for the Gibbs energy of the solid solutions is the two-sublattice polynomial model.
1. Introduction
The molten salt reactor (MSR) is a nuclear reactor design that was selected by the Generation IV International Forum1 as a promising concept for the next generation of reactors. For the safety assessment of such a reactor, a comprehensive understanding and modelling of the physical and chemical properties of the nuclear fuel is necessary. Many studies have already been conducted on the topic of fluoride-based reactors because of their appealing characteristics in terms of low vapour pressure and high thermochemical stability,2,3 but more recently chloride-based fuels have garnered attention as well.4 Compared to fluoride salts, chloride salts generally have a lower melting point, allowing for lower operating temperatures, and they show a higher solubility for actinides. During reactor operation, heat is generated by the fission reaction of a fissile isotope (235U, 233U, or 239Pu), which produces fission products. The dissolution of these fission products in the molten chloride fuel makes it a multi-component system, thereby affecting its thermochemical and thermophysical properties. In order to predict the properties of such a multi-element system, extrapolation from the constituting binary or ternary sub-systems can be used, but for this, the thermochemistry of the constituting binaries must first be comprehensively understood.
For fluoride salts, a large knowledge base of thermodynamic and thermophysical properties has been developed already in the framework of MSR development.5 For molten chlorides, however, the effect of fission products on properties such as melting behaviour, heat capacity, density or viscosity is less known and needs to be investigated. In particular, the effect on the thermodynamic properties of the melt of high-yield salt-soluble fission products such as barium, strontium and neodymium must be investigated. Neodymium is of additional interest, because it can also be used as a simulant for the hazardous plutonium due to its similar thermochemical behaviour in a salt mixture, as confirmed in this article. This work more specifically contributes to a better understanding of the effect of fission products in molten chlorides by modelling the thermochemical properties of the binary systems AECl2–NdCl3 (AE = Sr, Ba) using the CALPHAD (calculation of phase diagrams) method, based on literature and newly obtained obtained experimental data.
Experimental investigations using X-ray diffraction, quenching experiments, and differential scanning calorimetry (DSC) were first performed to solve discrepancies noticed in the literature. Using those data as input, a CALPHAD model was then developed based on the quasi-chemical formalism in the quadruplet approximation for the liquid solutions, and a two-sublattice polynomial model for the solid solutions. In this process, mixing enthalpies of the liquid solution were also estimated, as these data have not been measured experimentally to this date, but constitute a key piece of information to develop physically accurate liquid models. To conclude this work, application calculations were performed to investigate the effect of the fission products Ba and Sr on the NaCl–NdCl3 system, which serves as an analog to the fuel system NaCl–PuCl3.
2. Experimental techniques
2.1. Sample preparation synthesis
For the experiments carried out in this work, BaCl2 (Alfa Aesar, ultra-dry, 99.999% trace metals basis), SrCl2 (Alfa Aesar, ultra-dry, 99.995% trace metals basis) and NdCl3 (Alfa Aesar, ultra-dry, 99.9% trace metals basis) were used as delivered by the supplier. Due to the sensitivity of the salts towards oxygen and water, all sample preparation was carried out inside a glove box under dry argon atmosphere (H2O, O2 < 5 ppm).
Weighing was carried out using a Mettler-Toledo XPE105DR balance with a 0.01 mg uncertainty. Synthesis of intermediate compounds was conducted by mixing end-members compounds in the appropriate stoichiometric ratios in an agate mortar, followed by thermal treatment in a tubular furnace under argon flow for eight to twelve hours at a temperature of 850 K (Sr9Nd5Cl33) or 950 K (Ba3Nd2Cl12). The samples were heated inside a tightly closed stainless steel container, with an inner nickel liner to prevent the corrosive chlorides from interacting with the stainless steel.
Phase purity was analysed using X-ray diffraction (XRD) and melting point determination by differential scanning calorimetry (DSC). Using XRD, no additional phases were detected for any of the pure end-members. Using DSC, the melting points of the end-members were determined to be (1237 ± 5) K (BaCl2), (1147 ± 5) K (SrCl2) and (1031 ± 5) K (NdCl3). These values are in good agreement with the values in the literature, which are reported as (1235 ± 1) K,6 (1147 ± 1) K,6 and (1032 ± 2) K,7 respectively.
The intermediate products were also analysed using XRD and in case there were still unreacted end-member reactants visible, the product was subjected to further heat treatment until the intermediate phase was obtained with high purity (>99%).
2.2. X-ray diffraction (XRD)
XRD measurements were carried out using a panalytical X’pert pro diffractometer with a Cu-anode (0.4 mm × 12 mm line focus, 45 kV, 40 mA). Scattered X-ray intensities were measured with a real-time multi-step detector (X’Celerator). The angle 2θ was set to cover a range from 10° to 120°. Measurements were typically performed for 7–8 hours, with a step size of 0.0036° s−1. Refinement of the measured XRD data was performed by applying the method Le Bail,8 using the FullProf software, Version 5.10.9
2.3. Differential scanning calorimetry (DSC)
The invariant temperatures in the investigated systems were measured using a Setaram multi-detector high-temperature calorimeter (MHTC-96 type) equipped with a 3D heat flux DSC module, capable of measuring up to 1673 K. Sample preparation was done by mixing end-members BaCl2 or SrCl2 with NdCl3 in the desired stoichiometric ratio. The samples were contained in a nickel liner, which in turn was contained in a tightly closed stainless steel crucible.10 Equilibration of the sample was done in the calorimeter itself during the first heating cycle by heating the mixtures to a temperature above the melting points of both end members. Invariant equilibria were collected on the subsequent cycles.
The temperature was monitored throughout the experiments by a series of interconnected S-type thermocouples. The temperature on the heating ramp (10 K min−1) was calibrated and corrected for the effect of the heating rate by measuring the melting points of standard high purity metals (In, Sn, Pb, Al, Ag, Au) at 2–4–6–8–10–12 K min−1. The calibration procedure was performed as recommended by Höne et al.11 and Gatta et al.12 The transition temperatures in the AECl2–NdCl3 phase diagrams (AE = Sr, Ba) were derived on the heating ramp as the onset temperature using tangential analysis of the recorded heat flow. The liquidus temperature of mixtures was derived from the peak extremum of the last thermal event. The uncertainty on the measured temperatures is estimated to be ±5 K for pure compounds and ±10 K for mixtures.
2.4. Investigation of solid solutions
The existence and stability range of solid solutions in the investigated systems were investigated in this work using quenching experiments. The quenching samples consisted of stoichoimetric mixtures of the end-members, thoroughly mixed using a pestle and mortar before insertion inside a nickel liner in a tightly closed stainless steel crucible. During the experiments, the samples were heated to a temperature of 973 K and equilibrated at this temperature for at least two hours, after which they were dropped into a water bath to freeze the phases stable at high temperature.
The furnace used for quenching is an MTI split vertical quenching tube furnace (OTF-1500X-80-VTQ), which contains an electromagnet that holds the sample in the heated part of the furnace. When the sample is at the desired temperature and has reached equilibrium, the electromagnet is shut off and the sample drops into a water bath. Due to the double containment of the sample of nickel inside stainless steel, the sample stays water-free during this experiment.
3. Thermodynamic modelling
The thermodynamic modelling assessment of the molten salt systems was performed with the CALPHAD method13 using the FactSage software, Version 8.2.14 Both literature and experimental data obtained in this work were used to adjust the excess parameters of the Gibbs energy functions of the phases present in the systems.
3.1. Stoichiometric compounds
The Gibbs energy function (G(T), kJ mol−1) for stoichiometric compounds is dependent on the standard enthalpy of formation  , the standard entropy
  at the reference temperature of 298.15 K and the heat capacity
  as shown in eqn (1).
| |  | (1) |
The isobaric heat capacity Cp,m is expressed as a polynomial that takes the form of eqn (2).
| | | Cp,m(T) = a + bT + cT2 + dT−2 | (2) |
The compounds in the investigated systems are two end-members and two intermediates. The thermodynamic data for these are listed in Table 1. The thermodynamic functions for NdCl3 were taken from the critical review by Konings and Kovács.7 The thermodynamic functions for BaCl2 were taken from the IVTAN thermochemical database,15 to be consistent with our earlier work.16 The thermodynamic functions for SrCl2 were taken from the JANAF thermochemical tables.6 A polymorphic transition is reported in the aforementioned tables for SrCl2 with a transition enthalpy of 6 kJ mol−1 that was not included in the current thermodynamic modelling assessment. This transition is a second-order transition, from a cubic structure to a slightly distorted cubic structure, that does not appear in phase equilibria measurements, as further elaborated on in 6. The thermodynamic functions of NaCl, used in the assessment of the ternary systems, were taken from van Oudenaren et al.,17 who reviewed the available thermodynamic data in their work. The heat capacity of the intermediate compounds in this work was obtained through the Neumann–Kopp rule.
Table 1 Thermodynamic functions used in the CALPHAD model in this work. Optimized values are marked in bold
3.2. Liquid solution
The excess Gibbs energy terms of the liquid solution are modelled using the quasi-chemical formalism in the quadruplet approximation as proposed by Pelton et al.19 which has proven to be well-adapted to molten chloride and fluoride systems. This description assumes the existence of quadruplets in the liquid, allowing for the modelling of short-range ordering. This formalism allows for the selection of the composition of maximum short-range ordering through its cation–cation coordination numbers, corresponding to the minimum of the Gibbs energy that is often found near the composition of the lowest eutectic. By fixing these numbers, the anion–anion coordination number is also obtained through eqn (3), where qi are the charges of the respective ions. The cation–cation coordination numbers used in this work are presented in Table 2.| |  | (3) |
Table 2 Coordination numbers used in the CALPHAD model presented in this work
| A |
B |
Z
AAB/ClCl
|
Z
BAB/ClCl
|
Z
ClAB/ClCl
|
| Ba |
Ba |
6 |
6 |
3 |
| Sr |
Sr |
6 |
6 |
3 |
| Nd |
Nd |
6 |
6 |
2 |
| Ba |
Nd |
6 |
3 |
1.5 |
| Ba |
Sr |
6 |
6 |
3 |
| Sr |
Nd |
6 |
6 |
1.9 |
The excess parameters that are optimized are those related to the second-nearest neighbour exchange reaction as given in eqn (4), where the associated change in Gibbs energy (ΔgBaNd/ClCl, J mol−1) is expressed as eqn (5).
| | | (Ba–Cl–Ba) + (Nd–Cl–Nd) → 2(Ba–Cl–Nd)ΔgBaNd/ClCl | (4) |
| |  | (5) |
In eqn (5) the terms Δg0BaNd/ClCl, gi0BaNd/ClCl and g0jBaNd/ClCl are composition-independent coefficients that may depend on temperature. The composition dependence of the Gibbs energy is apparent through χBaNd/ClCl as these are defined as per eqn (6). In this equation XAA is the cation–cation pair fraction, or the molar fraction of the quadruplet containing two cations A. For this binary system, {XAA + XAB + XBB} is equal to one.
| |  | (6) |
The Gibbs energy functions used in this work to describe the liquid solutions are given in eqn (7) and (8) for the SrCl2–NdCl3 and BaCl2–NdCl3 systems, respectively.
| | | ΔgSrNd/ClCl = −1800 − 2.5T + (1.5T)χSrNd/ClCl + (−3300 + 4T)χNdSr/ClCl | (7) |
| | | ΔgBaNd/ClCl = −6500 − 0.7T + (−7000 + 8T)χNdBa/ClCl | (8) |
3.3. Solid solution modelling
The thermodynamic description of solid-solutions is done using the two-sublattice polynomial model to be consistent with the description of the JRC Molten Salt Database (JRCMSD).20 The Gibbs Energy function G(T) (J mol−1) of the solid-solution is given in eqn (9).| | G(T) = XA·G0A + XB·G0B + XART![[thin space (1/6-em)]](https://www.rsc.org/images/entities/char_2009.gif) ln ln![[thin space (1/6-em)]](https://www.rsc.org/images/entities/char_2009.gif) XA + XBRT XA + XBRT![[thin space (1/6-em)]](https://www.rsc.org/images/entities/i_char_2009.gif) ln ln![[thin space (1/6-em)]](https://www.rsc.org/images/entities/char_2009.gif) XB + ΔGexcessm XB + ΔGexcessm | (9) |
In the above equation, G0i are the end-member molar Gibbs energies, and Xi are the site molar fractions of the end-members SrCl2 or BaCl2 (A) and NdCl3 (B), respectively. The third and fourth terms in eqn (9) represent the configurational entropy. The excess Gibbs energy, present in eqn (9) as ΔGexcessm (in J mol−1), is defined as per eqn (10).
| |  | (10) |
The term LijAB in eqn (10) is an interaction coefficient that can be a function of temperature if necessary. The equivalent site fractions yA and yB are charge equivalent site fractions. In this work, these fractions are yBa (resp. ySr) and yNd, as defined by eqn (11) and (12):
| |  | (11) |
| |  | (12) |
The Gibbs energy function used in this work to describe the solid solutions in the BaCl2–NdCl3 system is given in eqn (13), where NdCl3 is soluble in the high-temperature cubic phase β-BaCl2. For the modelling of the SrCl2–NdCl3 system, separate solid solution descriptions were used to model the solubility of NdCl3 in the cubic SrCl2 (eqn (15)) and the solubility of SrCl2 in the hexagonal NdCl3 (eqn (14)).
| | ΔGexcessm,cubic(Ba,Nd) = yBa2yNd(−12![[thin space (1/6-em)]](https://www.rsc.org/images/entities/char_2009.gif) 110 + 5T) + yBayNd2(7000) 110 + 5T) + yBayNd2(7000) | (13) |
| | ΔGexcessm,cubic(Sr,Nd) = ySryNd(9000) +ySr2yNd(20![[thin space (1/6-em)]](https://www.rsc.org/images/entities/char_2009.gif) 000) 000) | (14) |
| | ΔGexcessm,hexagonal(Nd,Sr) = ySryNd(−4000) + ySryNd2(20![[thin space (1/6-em)]](https://www.rsc.org/images/entities/char_2009.gif) 000) 000) | (15) |
4. Results and discussion
The phase diagrams of the salt systems AECl2–NdCl3 (AE = Sr, Ba) have been investigated experimentally in this work through the use of XRD, quenching experiments and DSC. The mixing enthalpy of the systems has been estimated using the estimation method of Davis and Rice,21 as explained in a previous work.16 We refer the reader to the latter paper for a detailed explanation of the estimation method applied to derive the mixing enthalpies. Additionally, an assessment of Nd as a simulant for Pu is presented in Section 4.1, through the comparison with other commonly used simulant elements in Ce and U.
In the SrCl2–NdCl3 system, the intermediates Sr4NdCl11 (space group P21/m) and Sr9Nd5Cl33 (space group R![[3 with combining macron]](https://www.rsc.org/images/entities/char_0033_0304.gif) ), as well as a solid solution Sr1−xNdxCl2+x, have been identified by Hodorowicz et al.22 Experimental measurement of invariant equilibria has been reported by Morozov et al.23 and Vogel et al.24 No intermediates have been reported in the literature on the BaCl2–NdCl3 system. However, Meyer et al.25 have reported a compound with the chemical formula Ba9Nd6Cl34O. This compound could correspond to the intermediate Ba3Nd2Cl12 instead, as is the case in the analogous BaCl2–CeCl3 system.16 Measurements of invariant equilibria have been reported by Morozov et al.23 and Vogel et al.24
), as well as a solid solution Sr1−xNdxCl2+x, have been identified by Hodorowicz et al.22 Experimental measurement of invariant equilibria has been reported by Morozov et al.23 and Vogel et al.24 No intermediates have been reported in the literature on the BaCl2–NdCl3 system. However, Meyer et al.25 have reported a compound with the chemical formula Ba9Nd6Cl34O. This compound could correspond to the intermediate Ba3Nd2Cl12 instead, as is the case in the analogous BaCl2–CeCl3 system.16 Measurements of invariant equilibria have been reported by Morozov et al.23 and Vogel et al.24
4.1. Simulant systems NaCl–MCl3 (M = Ce, Nd, U)
To assess the potential of neodymium as a simulant for plutonium in the context of molten chlorides, a comparison between systems consisting of NaCl with NdCl3, CeCl3 and UCl3 is presented in this section. Thermodynamic models for these systems have been used to calculate phase diagrams, which were then compared to the experimental phase diagram data on the NaCl–PuCl3 system presented by Bjorklund et al.26 as shown in Fig. 1.
 |
| | Fig. 1 Calculated phase diagrams of the systems NaCl–NdCl3 (solid black line), NaCl–CeCl3 (dashed blue line) and NaCl–UCl3 (dashed red line), compared to the experimental data on the NaCl–PuCl3 system (open black circles) presented by Bjorklund et al.7 | |
The thermodynamic model of the NaCl–NdCl3 system was optimized based on data from the literature in this work, as detailed in 8. For the thermodynamic model of the NaCl–CeCl3 system, we refer the reader to a previous work.16 The thermodynamic model of the system NaCl–UCl3 was taken from Beneš and Konings,27 with the addition of the intermediate NaU2Cl7 as suggested by Yingling et al.28Fig. 1 shows that both the eutectic compositions and eutectic temperatures of the CeCl3-system and UCl3-system deviate significantly from the experimental data in the PuCl3-system. Moreover, the temperature of the liquidus on the right side of the eutectic, is consistently higher than that of the NaCl–PuCl3 system, mainly due to the difference in melting points between the compounds.
Fig. 1 also shows that the model of the NaCl–NdCl3 system reproduces the experimental data for the NaCl–PuCl3 system very well. The main difference between these two systems, is that the intermediate Na3Nd5Cl18 (x(NdCl3) = 0.625) does not have a known Pu-analog. This does not significantly influence the temperature of the liquidus, however, and therefore makes Nd an excellent simulant to describe the melting behaviour of Pu-systems. The SrCl2–NdCl3 and BaCl2–NdCl3 systems are subsequently investigated in this work, which can give insights into the melting behaviours of the SrCl2–PuCl3 and BaCl2–PuCl3 systems, respectively.
4.2. Intermediates Sr9Nd5Cl33 and Ba3Nd2Cl12
Both systems SrCl2–NdCl3 and BaCl2–NdCl3 contain one intermediate compound with composition Sr9Nd5Cl33 and Ba3Nd2Cl12, respectively. The intermediate phase Sr4NdCl11 as suggested by Hodorowicz et al.22 was not observed in any of our synthesis attempts. The intermediate Sr9Nd5Cl33 (hexagonal in space group R![[3 with combining macron]](https://www.rsc.org/images/entities/char_0033_0304.gif) ) was succesfully synthesised, and the profile refinement is shown in Fig. 2. The obtained refined cell parameters are compared to those presented by Hodorowicz et al. in Table 3, and these are in good agreement with each other (Fig. 3).
) was succesfully synthesised, and the profile refinement is shown in Fig. 2. The obtained refined cell parameters are compared to those presented by Hodorowicz et al. in Table 3, and these are in good agreement with each other (Fig. 3).
 |
| | Fig. 2 Profile refinement of the intermediate salt Sr9Nd5Cl33 using the structural model by Hodorowicz et al.22 The observed intensity (Yobs, red) is plotted along with the calculated intensity from the refinement (Ycalc, black), and the difference between the two is shown (Yobs − Ycalc, blue). The angles at which reflections occurr are shown as well (Bragg positions, vertical lines). Measurement at λ = Cu-Kα. | |
Table 3 Comparison between cell parameters obtained for intermediate Sr9Nd5Cl33 (space group R![[3 with combining macron]](https://www.rsc.org/images/entities/char_0033_0304.gif) ) in this work and in the literature
) in this work and in the literature
| Source |
a, b (Å) |
c (Å) |
V (Å3) |
| This work |
12.899(1) |
24.858(2) |
4136(2) |
| Hodorowicz et al.22 |
12.908(6) |
24.82(1) |
4135(5) |
 |
| | Fig. 3 Profile refinement of the intermediate salt Ba3Nd2Cl12, using the structure of Ba9Nd6Cl34O as reported by Meyer et al. as crystal structure. The observed intensity (Yobs, red) is plotted along with the calculated intensity from the refinement (Ycalc, black), and the difference between the two is shown (Yobs − Ycalc, blue). The angles at which reflections occurr are shown as well (Bragg positions, vertical lines). Measurement at λ = Cu-Kα. | |
The intermediate Ba3Nd2Cl12 has not been reported in the literature before, but Meyer et al.25 do suggest the existence of a compound with the same stoichiometric ratio of barium to neodymium, i.e. Ba9Nd6Cl34O. In our previous work on the analogous BaCl2–CeCl3 system,16 we encountered a similar situation where the crystallographic information published by Meyer et al. for Ba9Ce6Cl34O agreed very well with our synthesised compound Ba3Ce2Cl12. We therefore conclude that the same occurs here, and the intermediate Meyer et al. identified as Ba9Nd6Cl34O is actually the intermediate Ba3Nd2Cl12 (tetragonal in space group I4/m) as presented in this work. The refined lattice parameters obtained in this work are shown in Table 4, and are compared to the one presented by Meyer et al.,25 as well as the values reported for Ba3Ce2Cl12 in the literature. The lattice parameters of Ba3Nd2Cl12 are smaller than those of Ba3Ce2Cl12, as expected since the crystal radius of Nd3+ is smaller than that of Ce3+.29 There is a slight discrepancy between the values reported by Meyer et al. and those obtained in this work, particularly regarding the lattice parameter c. However, as shown in Table 4, this is also the case for the intermediate Ba3Ce2Cl12, leading us to believe that the intermediate observed in this work is indeed an analog to Ba3Ce2Cl12. Meyer et al. suggested the presence of an oxygen ion in this structure to satisfy charge conditions, but we believe that two chlorine ions are more likely. The reader is referred to the previously mentioned work by Alders et al.16 for further details on the crystallography of this compound.
Table 4 Comparison between cell parameters obtained for intermediates Ba3RE2Cl12 (RE = Ce, Nd) (space group I4/m) in this work and the literature
| Source |
Compound |
a, b (Å) |
c (Å) |
V (Å3) |
| This work |
Ba3Nd2Cl12 |
11.304(7) |
21.635(3) |
2765(2) |
| Meyer et al.25 |
Ba9Nd6Cl34O |
11.329(5) |
21.676(7) |
2782(4) |
| Alders et al.16 |
Ba3Ce2Cl12 |
11.363(1) |
21.547(6) |
2782(2) |
| Meyer et al.25 |
Ba9Ce6Cl34O |
11.348(3) |
21.729(5) |
2798(2) |
4.3. Solid-solutions – Sr1−xNdxCl2+x
In their investigation of the SrCl2–NdCl3 system, Hodorowicz et al.22 found that NdCl3 is soluble in the cubic crystal structure of SrCl2 (space group Fm![[3 with combining macron]](https://www.rsc.org/images/entities/char_0033_0304.gif) m) with a maximum of approximately 18% NdCl3. The existence of this solid solution is confirmed in this work with quenching and post-XRD measurements. Stoichiometric mixtures of SrCl2 and NdCl3 of compositions x(NdCl3) = 0, 0.05, 0.1 and 0.15 were quenched from 923 K. All mixtures showed a single phase solid solution. The profile refinements of the collected XRD data are reported in the supplementary information to this work, and the evolution of the lattice parameters in Fig. 5.
m) with a maximum of approximately 18% NdCl3. The existence of this solid solution is confirmed in this work with quenching and post-XRD measurements. Stoichiometric mixtures of SrCl2 and NdCl3 of compositions x(NdCl3) = 0, 0.05, 0.1 and 0.15 were quenched from 923 K. All mixtures showed a single phase solid solution. The profile refinements of the collected XRD data are reported in the supplementary information to this work, and the evolution of the lattice parameters in Fig. 5.
In Fig. 4, a refinement of the post-XRD at x(NdCl3) = 0.1, quenched from 850 K, is shown, indicating a single-phase solid solution at this composition. In contrast to the findings of Hodorowicz et al., the cell volumes calculated with the refined lattice parameters from the profile refinements do not obey a decreasing linear trend, but instead seem to fluctuate around an average value, as seen in Fig. 5. Based on the DSC data obtained in this work, shown in Section 4.7.1, we are inclined to conclude that the solid solution is stable up to approximately 20% NdCl3, as the peritectic transition observed at approximately 890 K disappears at lower concentrations. This is in line with the 18% solubility limit as reported by Hodorowicz et al.22
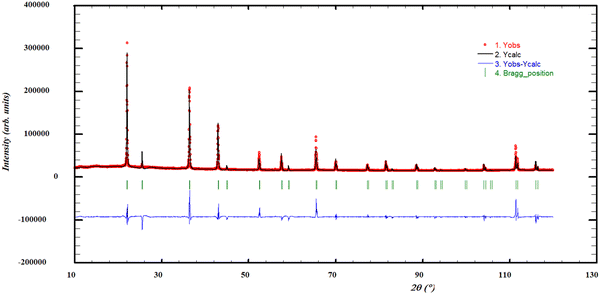 |
| | Fig. 4 Profile refinement of a quenched sample with x(NdCl3) = 0.1, showing solid solution Sr1−xNdxCl2+x, quenched from 850 K. The observed intensity (Yobs, red) is plotted along with the calculated intensity from the refinement (Ycalc, black), and the difference between the two is shown (Yobs − Ycalc, blue). The angles at which reflections occur are shown as well (Bragg positions, vertical lines). Measured at λ = Cu-Kα. | |
 |
| | Fig. 5 Cell volumes of the cubic Sr1−xNdxCl2+x (space group Fm![[3 with combining macron]](https://www.rsc.org/images/entities/char_0033_0304.gif) m) phase, calculated from the profile refinements of the solid solutions quenched in the SrCl2–NdCl3 system for T = 923 K. m) phase, calculated from the profile refinements of the solid solutions quenched in the SrCl2–NdCl3 system for T = 923 K. | |
 |
| | Fig. 6 Cell volumes of the cubic Ba1−xNdxCl2+x phase, calculated from the profile refinements of the quenching experiments performed in the BaCl2–NdCl3 system at T = 973 K. | |
4.4. Solid-solutions – Ba1−xNdxCl2+x
Solid solutions of CeCl3 in the high-temperature cubic phase of BaCl2 (space group Fm![[3 with combining macron]](https://www.rsc.org/images/entities/char_0033_0304.gif) m) have been observed previously by Alders et al.16 in the BaCl2–CeCl3 system. Due to the similarities between CeCl3 and NdCl3 (rCe(3+),VI = 1.01 Å, rNd(3+),VI = 0.98 Å29), we expect a similar solid solution to also form in this system. Additionally, the invariant points measured by DSC between x(NdCl3) = 0.05 and 0.25 (see Section 4.7.2) correspond to the formation event of a high-temperature solid solution.
m) have been observed previously by Alders et al.16 in the BaCl2–CeCl3 system. Due to the similarities between CeCl3 and NdCl3 (rCe(3+),VI = 1.01 Å, rNd(3+),VI = 0.98 Å29), we expect a similar solid solution to also form in this system. Additionally, the invariant points measured by DSC between x(NdCl3) = 0.05 and 0.25 (see Section 4.7.2) correspond to the formation event of a high-temperature solid solution.
Quenching experiments were performed at a temperature of 973 K, for compositions 0.1 ≤ x(NdCl3) ≤ 0.3. These experiments confirmed the existence of a solid solution, as the cell parameters of (Ba,Nd)Cl2+x decrease upon the addition of NdCl3. It is, however, not possible to quantify the extent of the solid solution at this temperature based on the present quenching experiments, due to the fact that the predicted stability range at 973 K is very narrow. Moreover, the experiments performed at x(NdCl3) = 0.1 and 0.25 show additional phases, namely α-BaCl2 and Ba3Nd2Cl12 respectively, which is in agreement with the expected phases based on the phase diagram in Fig. 11. The profile refinement of the experiment performed at x(NdCl3) = 0.10 is shown in Fig. 7 and shows the phases that were expected based on the phase diagram. The other profile refinements obtained from the post-XRD analyses are reported in the supplementary information to this work.
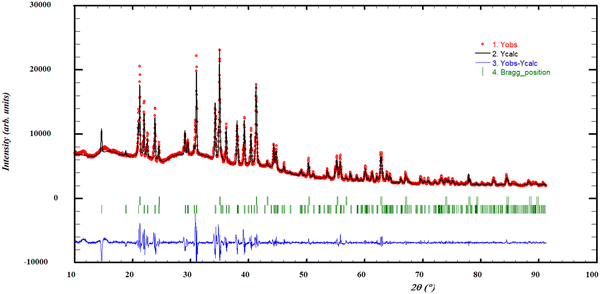 |
| | Fig. 7 Profile refinement of a quenched sample with x(NdCl3) = 0.10, showing both the solid solution Ba1−xNdxCl2+x and α-BaCl2, quenched from 973 K. The observed intensity (Yobs, red) is plotted along with the calculated intensity from the refinement (Ycalc, black), and the difference between the two is shown (Yobs − Ycalc, blue). The angles at which reflections occur are shown as well (Bragg positions, vertical lines). Measured at λ = Cu-Kα. | |
4.5. Solid-solutions – NdyAE1−yCl3−y (AE = Sr, Ba)
Quenching experiments and post-XRD were also carried out to investigate the solid solution on the NdCl3-rich side of the SrCl2–NdCl3 system. The calculated cell volume is slightly larger than that of NdCl3, as expected from the respective crystal radii (rNd(3+),VI = 1.123 Å, rSr(2+),VI = 1.32 Å29), but the difference is within the margin of experimental error.
No quenching experiments were carried out to investigate the existence of a solid solution on the NdCl3-rich side of the BaCl2–NdCl3 phase diagram. However, a small decrease of the eutectic temperature at x(NdCl3) = 0.948 and 0.969 is observed, consistent with the formation of a solid solution in this composition range. This is also consistent with the observations of Alders et al.16 in their work on the BaCl2–CeCl3 system. The existence of solid solutions at the NdCl3-rich side of the AECl2–NdCl3 (AE = Sr, Ba) systems is also supported by the Tamman-diagrams in Fig. 10 and 13, respectively (see Sections 4.7.1 and 4.7.2).
4.6. Phase equilibria measurements
A list of mixtures measured in this work by DSC, along with the temperatures of invariant transitions and associated invariant reactions, is presented in Tables 5 and 6 for the SrCl2–NdCl3 and BaCl2–NdCl3 systems, respectively. The phase equilibria are also shown on the optimized phase diagrams in Fig. 8 and 11, respectively.
Table 5 Equilibrium data in the SrCl2–NdCl3 system as measured by DSC
|
x
NdCl3
|
T
(K) |
Equilibrium |
Equilibrium reaction |
|
The uncertainties on compositions xNdCl3 are ±0.005.
The uncertainties on temperatures are ±5 K for pure end-members and ±10 K for mixtures.
|
| 0 |
1147 |
Congruent melting |
SrCl2 = L |
| 0.100 |
1123 |
Liquidus |
Sr1−xNdxCl2+x + L′ = L |
| 0.150 |
1104 |
Liquidus |
Sr1−xNdxCl2+x + L′ = L |
| 0.203 |
1075 |
Liquidus |
Sr1−xNdxCl2+x + L′ = L |
| 0.229 |
1064 |
Liquidus |
Sr1−xNdxCl2+x + L′ = L |
| 897 |
Peritectic |
Sr9Nd5Cl33 = Sr1−xNdxCl2+x + L′ |
| 0.251 |
1045 |
Liquidus |
Sr1−xNdxCl2+x + L′ = L |
| 883 |
Peritectic |
Sr9Nd5Cl33 = Sr1−xNdxCl2+x + L′ |
| 0.269 |
1037 |
Liquidus |
Sr1−xNdxCl2+x + L′ = L |
| 894 |
Peritectic |
Sr9Nd5Cl33 = Sr1−xNdxCl2+x + L′ |
| 0.359 |
981 |
Liquidus |
Sr1−xNdxCl2+x + L′ = L |
| 894 |
Peritectic |
Sr9Nd5Cl33 = Sr1−xNdxCl2+x + L′ |
| 872 |
Eutectic |
Sr9Nd5Cl33 + Nd1−ySryCl3−y = L |
| 0.449 |
910 |
Liquidus |
Sr1−xNdxCl2+x + L′ = L |
| 883 |
Peritectic |
Sr9Nd5Cl33 = Sr1−xNdxCl2+x + L′ |
| 874 |
Eutectic |
Sr9Nd5Cl33 + Nd1−ySryCl3−y = L |
| 0.530 |
885 |
Eutectic |
Sr9Nd5Cl33 + Nd1−ySryCl3−y = L |
| 0.570 |
873 |
Eutectic |
Sr9Nd5Cl33 + Nd1−ySryCl3−y = L |
| 0.599 |
919 |
Liquidus |
Nd1−ySryCl3−y + L′ = L |
| 874 |
Eutectic |
Sr9Nd5Cl33 + Nd1−ySryCl3−y = L |
| 0.699 |
955 |
Liquidus |
Nd1−ySryCl3−y + L′ = L |
| 875 |
Eutectic |
Sr9Nd5Cl33 + Nd1−ySryCl3−y = L |
| 0.899 |
1009 |
Liquidus |
Nd1−ySryCl3−y + L′ = L |
| 874 |
Eutectic |
Sr9Nd5Cl33 + Nd1−ySryCl3−y = L |
| 0.948 |
1019 |
Liquidus |
Nd1−ySryCl3−y + L′ = L |
| 868 |
Eutectic |
Sr9Nd5Cl33 + Nd1−ySryCl3−y = L |
| 1 |
1031 |
Congruent melting |
NdCl3 = L |
Table 6 Equilibrium data in the BaCl2–NdCl3 system as measured by DSC
|
x
NdCl3
|
T
(K) |
Equilibrium |
Equilibrium reaction |
|
The uncertainties on compositions xNdCl3 are ±0.005.
The uncertainties on temperatures are ±5 K for pure end-members and ±10 K for mixtures.
|
| 0 |
1235 |
Congruent melting |
β-BaCl2 = L |
| 1198 |
α–β transition |
α-BaCl2 = β-BaCl2 |
| 0.06 |
1234 |
Liquidus |
Ba1−xNdxCl2+x + L′ = L |
| 1134 |
Solidus |
α-BaCl2 + Ba1−xNdxCl2+x = Ba1−xNdxCl2+x |
| 941 |
Eutectoid |
α-BaCl2 + Ba3Nd2Cl12 = Ba1−xNdxCl2+x |
| 0.148 |
1202 |
Liquidus |
Ba1−xNdxCl2+x + L′ = L |
| 939 |
Eutectoid |
α-BaCl2 + Ba3Nd2Cl12 = Ba1−xNdxCl2+x |
| 0.207 |
1172 |
Liquidus |
Ba1−xNdxCl2+x + L′ = L |
| 1020 |
Peritectic |
Ba3Nd2Cl12 = Ba1−xNdxCl2+x + L′ |
| 939 |
Eutectoid |
α-BaCl2 + Ba3Nd2Cl12 = Ba1−xNdxCl2+x |
| 0.249 |
1153 |
Liquidus |
Ba1−xNdxCl2+x + L′ = L |
| 1023 |
Peritectic |
Ba3Nd2Cl12 = Ba1−xNdxCl2+x + L′ |
| 939 |
Eutectoid |
α-BaCl2 + Ba3Nd2Cl12 = Ba1−xNdxCl2+x |
| 0.265 |
1132 |
Liquidus |
Ba1−xNdxCl2+x + L′ = L |
| 1024 |
Peritectic |
Ba3Nd2Cl12 = Ba1−xNdxCl2+x + L′ |
| 938 |
Eutectoid |
α-BaCl2 + Ba3Nd2Cl12 = Ba1−xNdxCl2+x |
| 0.305 |
1113 |
Liquidus |
Ba1−xNdxCl2+x + L′ = L |
| 1031 |
Peritectic |
Ba3Nd2Cl12 = Ba1−xNdxCl2+x + L′ |
| 0.370 |
1045 |
Liquidus |
Ba1−xNdxCl2+x + L′ = L |
| 1018 |
Peritectic |
Ba3Nd2Cl12 = Ba1−xNdxCl2+x + L′ |
| 0.380 |
1043 |
Liquidus |
Ba1−xNdxCl2+x + L′ = L |
| 1017 |
Peritectic |
Ba3Nd2Cl12 = Ba1−xNdxCl2+x + L′ |
| 0.391 |
1039 |
Liquidus |
Ba1−xNdxCl2+x + L′ = L |
| 1019 |
Peritectic |
Ba3Nd2Cl12 = Ba1−xNdxCl2+x + L′ |
| 893 |
Eutectic |
Ba3Nd2Cl12 + Nd1−yBayCl3−y = L |
| 0.405 |
1035 |
Liquidus |
Ba1−xNdxCl2+x + L′ = L |
| 1015 |
Peritectic |
Ba3Nd2Cl12 = Ba1−xNdxCl2+x + L′ |
| 894 |
Eutectic |
Ba3Nd2Cl12 + Nd1−yBayCl3−y = L |
| 0.41 |
1018 |
Peritectic |
Ba3Nd2Cl12 = Ba1−xNdxCl2+x + L′ |
| 908 |
Eutectic |
Ba3Nd2Cl12 + Nd1−yBayCl3−y = L |
| 0.431 |
896 |
Eutectic |
Ba3Nd2Cl12 + Nd1−yBayCl3−y = L |
| 0.498 |
1010 |
Liquidus |
Ba3Nd2Cl12 + L′ = L |
| 910 |
Eutectic |
Ba3Nd2Cl12 + Nd1−yBayCl3−y = L |
| 0.55 |
989 |
Liquidus |
Ba3Nd2Cl12 + L′ = L |
| 912 |
Eutectic |
Ba3Nd2Cl12 + Nd1−yBayCl3−y = L |
| 0.600 |
924 |
Liquidus |
Nd1−yBayCl3−y + L′ = L |
| 899 |
Eutectic |
Ba3Nd2Cl12 + Nd1−yBayCl3−y = L |
| 0.674 |
912 |
Eutectic |
Ba3Nd2Cl12 + Nd1−yBayCl3−y = L |
| 0.753 |
962 |
Liquidus |
Nd1−yBayCl3−y + L′ = L |
| 902 |
Eutectic |
Ba3Nd2Cl12 + Nd1−yBayCl3−y = L |
| 0.850 |
1000 |
Liquidus |
Nd1−yBayCl3−y + L′ = L |
| 915 |
Eutectic |
Ba3Nd2Cl12 + Nd1−yBayCl3−y = L |
| 899 |
Unknown |
— |
| 0.948 |
1026 |
Liquidus |
Nd1−yBayCl3−y + L′ = L |
| 904 |
Eutectic |
Nd1−yBayCl3−y = L |
| 897 |
Solidus |
Ba3Nd2Cl12 + Nd1−yBayCl3−y = Nd1−yBayCl3−y |
| 0.969 |
1030 |
Liquidus |
Nd1−yBayCl3−y + L′ = L |
| 970 |
Solidus |
Nd1−yBayCl3−y = Nd1−yBayCl3−y + L′ |
| 894 |
Solidus |
Ba3Nd2Cl12 + Nd1−yBayCl3−y = Nd1−yBayCl3−y |
4.7. Thermodynamic models
4.7.1. SrCl2–NdCl3.
With the thermodynamic descriptions of the parameters in the system as described in eqn (1), (7) and (15), the phase diagram and mixing enthalpy of the system were calculated. The optimized phase diagram is shown in Fig. 8, and the enthalpy of mixing is reported in Fig. 9. The invariant equilibria calculated with this CALPHAD model are presented, and compared with the available experimental data in Table 7.
 |
| | Fig. 8 Phase diagram of the SrCl2–NdCl3 binary system, as calculated with the optimized thermodynamic model. Data from Morozov et al.23 (empty blue triangles), Vogel et al.24 (empty red squares) and this work (filled black circles). The compositions and temperatures at which quenching experiments have been performed are marked with black crosses. | |
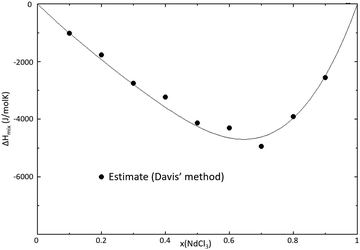 |
| | Fig. 9 Mixing enthalpy of the SrCl2–NdCl3 binary system at T = 1273 K, as calculated with the thermodynamic model. The mixing enthalpy data were obtained with the mixing enthalpy estimation method presented by Davis and Rice,21 highlighted in a previous work.16 | |
Table 7 Calculated invariant equilibria in the SrCl2–NdCl3 system, as well as experimentally measured values of these invariants from Morozov et al.,23 Vogel et al.24 and this work (DSC). The numbers in parentheses are the respective compositions of the eutectic
|
x
NdCl3
|
T (K) |
Equilibrium |
Invariant reaction |
| CALPHAD |
Morozov et al.23 |
Vogel et al.24 |
This work (DSC) |
| 0 |
1146 |
1142 |
1151 |
1147 ± 5 |
Congruent melting |
SrCl2 = L |
| 0.357 |
890 |
893 |
873 |
894 ± 10 |
Peritectic |
Sr9Nd5Cl33 = Sr1−xNdxCl2+x + L′ |
| 0.535 |
878 (0.530) |
872 (0.560) |
853 (0.420) |
885 ± 10 (0.535) |
Eutectic |
Sr9Nd5Cl33 + Nd1−ySryCl3−y = L |
| 1 |
1030 |
1016 |
— |
1031 ± 5 |
Congruent melting |
NdCl3 = L |
The CALPHAD model presented in Fig. 8 was optimized to fit the experimental data obtained in this work by DSC. There is, however, a significant discrepancy between the calculated liquidus between x(NdCl3) = 0.2 and x(NdCl3) = 0.6 when comparing to the data from Morozov et al.23 and Vogel et al.24 Given the fact that the data from these sources are not in agreement with each other, and that the actual liquidus we measure is in between the reported sets of data, we are confident in the accuracy of our experimental measurements and model in this composition range. The calculated mixing enthalpy has been optimized to fit the estimation obtained using Davis' method, as presented in Fig. 9. The temperature and composition of the eutectic is in good agreement with the values measured in this work by DSC, as well as the values of Morozov et al. The eutectic data from Vogel et al. deviate greatly from the other two sources, and give us reason to not retain their data. The eutectic composition calculated by the model is in good agreement with the predicted composition from the Tammann-diagram in Fig. 10, where the heat flow area of the eutectic transition is plotted against composition.
 |
| | Fig. 10 Tammann-diagram showing the heat flow area of the eutectic transition versus composition, obtained in this work on the SrCl2–NdCl3 system. The intersection of the linear fits (dashed lines) is the predicted composition of the eutectic in this system, and the diagram matches with the composition of the intermediate. | |
The composition of the intermediate that we identified is also different from that reported by Morozov et al. and Vogel et al. report, but its existence is supported by the XRD data obtained in this work, as well as the work of Hodorowicz et al.22 It is also consistent with the limiting composition obtained at x = 0.357 in the Tammann diagram. The existence of mutual solid solubility of NdCl3 and SrCl2 was suggested previously by Vogel et al. and Hodorowicz et al., which our data corroborate. Moreover, there is solubility of SrCl2 in NdCl3 up to 5% SrCl2 at 900 K. This is again in line with the Tammann diagram in Fig. 10 where the area of the eutectic peak goes to zero at approximately x(NdCl3) = 0.95, indicating that there is a solid solution at higher compositions.
4.7.2. BaCl2–NdCl3.
With the optimized parameters as described in Table 1 and eqn (8) and (13), the phase diagram and mixing enthalpy of the system were calculated. The phase diagram is shown in Fig. 11, and the enthalpy of mixing is reported in Fig. 12. The invariant equilibria calculated with this CALPHAD model are presented and compared with the available experimental data in Table 8.
 |
| | Fig. 11 Phase diagram of the BaCl2–NdCl3 binary system, as calculated with the optimized thermodynamic model. Data from Morozov et al.23 (empty blue triangles), Vogel et al.24 (empty red squares) and this work (filled black circles). The compositions and temperatures at which quenching experiments have been performed are marked with black crosses. | |
 |
| | Fig. 12 Mixing enthalpy of the BaCl2–NdCl3 binary system at T = 1273 K, as calculated with the thermodynamic model presented in this section. The mixing enthalpy data were obtained with the mixing enthalpy estimation method presented by Davis and Rice,21 highlighted in a previous work.16 | |
Table 8 Calculated invariant equilibria in the BaCl2–NdCl3 system, as well as experimentally measured values of these invariants from Morozov et al.,23 Vogel et al.24 and this work (DSC). The numbers in parentheses are the respective compositions of the eutectic
|
x
NdCl3
|
T (K) |
Equilibrium |
Invariant reaction |
| CALPHAD |
Morozov et al.23 |
Vogel et al.24 |
This work (DSC) |
| 0 |
1198 |
1200 |
1199 |
1197 ± 5 |
α–β transition |
α-BaCl2 = β-BaCl2 |
| 1234 |
1243 |
1239 |
1235 ± 5 |
Congruent melting |
β-BaCl2 = L |
| 0.2 |
935 |
|
|
939 ± 10 |
Eutectoid |
α-BaCl2 + Ba3Nd2Cl12 = Ba1−xNdxCl2+x |
| 0.4 |
1017 |
1011 |
1020 |
1015 ± 10 |
Peritectic |
Ba3Nd2Cl12 = Ba1−xNdxCl2+x + L′ |
| 0.676 |
906 (0.676) |
902 (0.710) |
901 (0.620) |
912 ± 10 (0.674) |
Eutectic |
Ba3Nd2Cl12 + Nd1−yBayCl3−y = L |
| 1 |
1030 |
1016 |
— |
1031 ± 5 |
Congruent melting |
NdCl3 = L |
The CALPHAD model displayed in Fig. 11 was optimized to fit the measured invariant points, as well as the estimated mixing enthalpy as shown in Fig. 12. The DSC data between 0.05 ≤ x(NdCl3) ≤ 0.3 at T = 935 K that were not observed by Morozov et al.23 or Vogel et al.24 are explained rather well by the addition of a solid solution phase Ba1−xNdxCl2+x, stable only at elevated temperatures. The temperature of the peritectic, as well as the temperature and composition of the eutectic, are reproduced accurately by the model. While both Morozov et al. and Vogel et al. reported an intermediate of composition Ba3NdCl9 to be stable in this system, the absence of a eutectic event at compositions x(NdCl3) ≤ 0.39 indicates that the intermediate Ba3Nd2Cl12 is more likely, as is corroborated by the XRD analysis presented in this work, and the limiting composition of x = 0.4 in the Tammann diagram, as seen in Fig. 13.
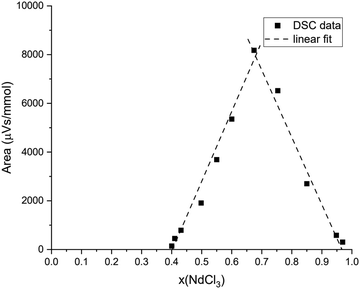 |
| | Fig. 13 Tammann-diagram calculated from the DSC data obtained in this work on the BaCl2–NdCl3 system. The intersection of the linear fits (dashed lines) is the predicted composition of the eutectic in this system. the limiting compositions are x = 0.4 (intermediate Ba3Nd2Cl12) and x = 0.96 (solid solution Nd1−yBayCl3−y). | |
There is good agreement between the literature and our experimental data on the temperatures of the eutectic and peritectic equilibria, as seen in Table 8, as well as with the Tammann-diagram presented in Fig. 13, which shows the recorded heat flow area of the eutectic transition versus temperature. Solid solubility of NdCl3 in BaCl2 was already suggested by Vogel et al., and the data in the Tammann diagram in Fig. 13 indicate that there is a narrow solid solution on the NdCl3-rich side as well, with a limiting composition of 96% NdCl3.
To further cement the potential of neodymium as a simulant for plutonium in the context of molten chlorides, a comparison is drawn between the systems AECl2–NdCl3 (AE = Sr, Ba) and the corresponding AECl2–PuCl3 system. In the case of the BaCl2–PuCl3 system, the model from our previous work on the BaCl2–CeCl3 system is included in the comparison.
As seen in Fig. 14, the liquidus line and eutectic of the SrCl2–PuCl3 system is approximated very well by the thermodynamic model of the SrCl2–NdCl3 system. The comparison of the BaCl2–MCl3 systems shown in Fig. 15 shows that the liquidus line of the PuCl3-system is very similar to the one calculated with the model of the BaCl2–NdCl3 system, and that it deviates slightly from the CeCl3-system, owing to the higher melting point of CeCl3. Fig. 14 and 15 both show that, like in the systems NaCl–MCl3 shown in Section 4.1, neodymium is a very accurate simulant for the melting behaviour of plutonium in molten chlorides.
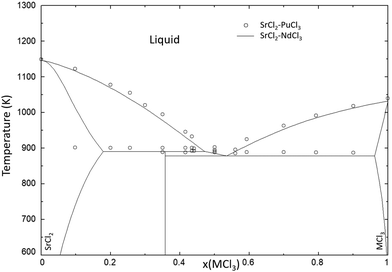 |
| | Fig. 14 Calculated phase diagram of the SrCl2–NdCl3 system (solid black line) compared to the experimental data on the SrCl2–PuCl3 (open black circles) system presented by Johnson et al.30 | |
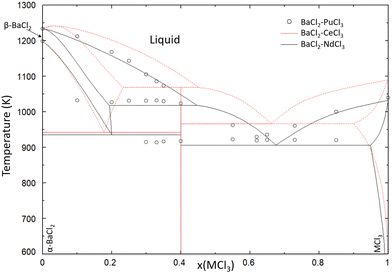 |
| | Fig. 15 Calculated phase diagram of the BaCl2–NdCl3 system (solid black line) compared to the model of BaCl2–CeCl3 from a previous work (dotted red line) and experimental data on the BaCl2–PuCl3 (open black circles) system presented by Johnson et al.30 | |
4.8. Ternary systems NaCl–SrCl2–NdCl3 and NaCl–BaCl2–NdCl3
Neodymium is a good candidate to act as a simulant for plutonium in chloride systems due to its similar melting behaviour and structural properties, the former being exemplified by the very similar liquidus equilibria in the NaCl–NdCl3 and NaCl–PuCl3 systems shown in Section 4.1. We believe that the investigations of the SrCl2–NdCl3 and BaCl2–NdCl3 systems as presented in this work can give valuable insights into the liquidus equilibria of the SrCl2–PuCl3 and BaCl2–PuCl3 systems too, which are more challenging to investigate experimentally. Moreover, they can be used to predict the melting behaviour of the molten salt fuel NaCl–PuCl3 (some MSR designs rely on using the eutectic composition of this system) upon addition of the fission products Sr and Ba. To this end, thermodynamic calculations were performed in the ternary systems NaCl–SrCl2–NdCl3 and NaCl–BaCl2–NdCl3 as simulant systems to the equivalent PuCl3-based systems. For this, the binary subsystems NaCl–SrCl2, NaCl–BaCl2 and NaCl–NdCl3 were also modelled, which is presented in 7. The extrapolation to the ternary system is solely based on the constituting binary systems, and no ternary excess terms were added. The liquidus projections of these ternary systems are shown in Appendix C.
Fig. 16 shows the pseudo-binary phase diagram {0.95 (NaCl + NdCl3) + 0.05SrCl2}, and Fig. 17 shows the pseudo-binary phase diagram {0.95 (NaCl + NdCl3) + 0.05BaCl2} to investigate the addition of 5% SrCl2 or BaCl2 to a NaCl–PuCl3 mixture respectively. In this calculation, the addition of 5% fission product (Ba or Sr) is based on the order of magnitude of the fission yield of Ba (9.5%) and Sr (5.48%).31 In an actual reactor operation scenario these percentages will be lower, as it is contingent upon the initial Pu-concentration. The observed the effect of the addition of these fission products is therefore an amplification.
 |
| | Fig. 16 Phase diagram of the {0.95NaCl + 0.05SrCl2} and {0.95NdCl3 + 0.05SrCl2} pseudo-binary section of the NaCl–SrCl2–NdCl3 ternary system. The labelled phases are NaCl + L′ (A), NaCl + Sr1−xNdxCl3−x + L′ (B), NaCl + Sr1−xNdxCl3−x (C), NaCl + Sr1−xNdxCl3−x + Sr9Nd5Cl33 (D), NaCl + Sr9Nd5Cl33 + L′ (E), NaCl + Sr9Nd5Cl33 + Na3Nd5Cl18 (F), Na3Nd5Cl18 + L′ (G), Sr9Nd5Cl33 + Na3Nd5Cl18 + L′ (H), Na3Nd5Cl18 + Nd1−ySryCl2+y + L′ (I), Nd1−ySryCl2+y + L′ (J), Na3Nd5Cl18 + Nd1−ySryCl2+y + Sr9Nd5Cl33 (K), Nd1−ySryCl2+y + Sr9Nd5Cl33 + L′ (L). The lines in red correspond to the phase diagram of the system NaCl–NdCl3. | |
 |
| | Fig. 17 Phase diagram of the {0.95NaCl + 0.05BaCl2} and {0.95NdCl3 + 0.05BaCl2} pseudo-binary section of the NaCl–BaCl2–NdCl3 ternary system. The labelled phases are NaCl + L′ (A), NaCl + BaCl2 + L′ (B), NaCl + BaCl2 + Na3Nd5Cl18 (C), BaCl2 + L′ (D), BaCl2 + Ba3Nd2Cl12 + L′ (E), Ba3Nd2Cl12 + L′ (F), Ba3Nd2Cl12 + Na3Nd5Cl18 + L′ (G), BaCl2 + Na3Nd5Cl18 + L′ (H), Na3Nd5Cl18 + L′ (I), NdCl3 + L′ (J), Ba3Nd2Cl12 + Na3Nd5Cl18 + Nd1−yBayCl3−y (K), Ba3Nd2Cl12 + Nd1−yBayCl3−y + L′ (L), Na3Nd5Cl18 + Nd1−yBayCl3−y + L′ (M), Ba3Nd2Cl12 + Na3Nd5Cl18 + BaCl2 (N). The lines in red correspond to the phase diagram of the system NaCl–NdCl3. | |
The calculated phase diagram in Fig. 16 shows that the addition of 5% SrCl2 leads to a small decrease in the eutectic temperature (10 K). This indicates that the addition of the fission product Sr has no negative effect on the melting temperature of the fuel.
By contrast, the calculated phase diagram in Fig. 17 shows that the addition of 5% of BaCl2 could cause the melting temperature of the eutectic to rise significantly. The primary crystallization phase above the eutectic composition of the NaCl–NdCl3 system is BaCl2, indicating that BaCl2 could precipitate out of the melt at high concentrations. This result would have significant consequences for the operation of the reactor, as the presence of precipitates could lead to clogging. This hypothesis should be assessed with experimental investigations and thorough modelling in the ternary system, including necessary ternary excess parameters.
5. Summary
Thermodynamic modelling assessments of the molten salt systems AECl2–NdCl3 (AE = Sr, Ba) are presented in this work using the CALPHAD method with the quasi-chemical formalism in quadruplet approximation for the liquid solution. The system SrCl2–NdCl3 is characterised by: (i) a single eutectic, (ii) a peritectic decomposition of the intermediate Sr9Nd5Cl33, (iii) a Sr1−xNdxCl2+x (cubic) solid solution in the composition range x(NdCl3) = [0–0.2], (iv) a Nd1−ySryCl3−y (hexagonal) solid solution in the composition range x(NdCl3) ≥ 0.95. The structure of the intermediate Sr9Nd5Cl33 has been characterised with XRD, and the solid solution Sr1−xNdxCl2+x has been investigated with quenching experiments and post-XRD characterisation. Extrapolation to the ternary NaCl–SrCl2–NdCl3, used here as simulant for the NaCl–SrCl2–PuCl3 system, shows no adverse effects on the melting point of the eutectic upon addition of 5% SrCl2.
The system BaCl2–NdCl3 is similarly characterised by: (i) a single eutectic, (ii) a peritectic decomposition of the intermediate Ba3Nd2Cl12, (iii) a Ba1−xNdxCl2+x (cubic) solid solution in the composition range x(NdCl3) = [0–0.2], stable only at temperatures above 940 K, (iv) a Nd1−ySryCl3−y (hexagonal) solid solution in the composition range x(NdCl3) ≥ 0.95. The structure of the intermediate Ba3Nd2Cl12 has been determined using XRD, and the solid solution Ba1−xNdxCl2+x has been investigated with quenching experiments and post-XRD characterisation. Extrapolation to the ternary NaCl–BaCl2–NdCl3, used here as simulant for the NaCl–BaCl2–PuCl3 system, shows that the addition of 5% BaCl2 could potentially increase the melting point of the eutectic and lead to BaCl2 precipitation in the melt. This would have implications for the safety assessment of the reactor, and should be confirmed in complementary investigations of the ternary system.
Data availability
Most of the experimental data obtained in this work has been reported in the main text in Tables 1–6 and Fig. 1–7, 9, 10, 12 and 13. Further supporting data have been included as part of the ESI.†
Conflicts of interest
The authors declare to have no competing financial interests or personal relationships that influence the work reported in this paper.
Appendices
Appendix A: thermodynamic functions SrCl2
The end-member SrCl2 undergoes a second order transition from a cubic structure, to a slightly distorted cubic structure in the temperature range 900–1100 K, as evidenced by the gradual bump in the enthalpy increment data of Dworkin and Bredig32 presented in Fig. 18. In previous works, such as that of Chartrand et al.,33 this transition was incorporated in the model as a step-wise transition with an associated transition enthalpy of 6 kJ mol−1. However, because this transition is not measured as an invariant equilibrium, in this work the α–β transition of SrCl2 was not incorporated in the thermodynamic model. The thermodynamic functions from Chartrand et al.33 were retained for the low-temperature α-phase, however.
 |
| | Fig. 18 Enthalpy increment data of SrCl2 as measured experimentally by Dworkin and Bredig,32 compared to the calculated values using the thermodynamic functions from this work. | |
Appendix B: modelling of binary systems with NaCl
In order to perform calculations in the ternary systems NaCl–SrCl2–NdCl3 and NaCl–BaCl2–NdCl3, the binary systems NaCl–SrCl2, NaCl–BaCl2 and NaCl–NdCl3 were modelled based on the data presented in the literature. The cation–cation coordination numbers used in these models are the same as in Table 2, with the additional coordination numbers involving Na given in Table 9.
Table 9 Additional coordination numbers used in the CALPHAD models presented in this section
| A |
B |
Z
AAB/ClCl
|
Z
BAB/ClCl
|
Z
ClAB/ClCl
|
| Na |
Na |
6 |
6 |
6 |
| Na |
Nd |
4 |
6 |
2.666 |
| Na |
Sr |
3 |
6 |
3 |
| Na |
Ba |
6 |
6 |
4 |
The thermodynamic model for the system NaCl–NdCl3 was optimized using the phase diagram data presented by Sharma et al.34 and Igarashi et al.35 in the quadruplet approximation in the modified quasichemical formalism, as used throughout this work. The excess Gibbs energy function obtained through optimization of this binary is given in eqn (16), and the calculated phase diagram is shown in Fig. 19. The calculated mixing enthalpy is compared to experimental data in Fig. 20.
| | | ΔgNaNd/ClCl = −9000 − 5.5T | (16) |
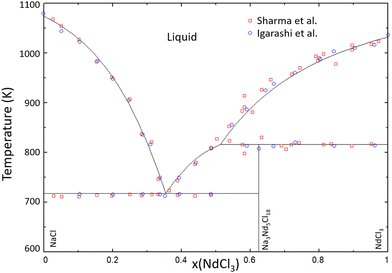 |
| | Fig. 19 Calculated phase diagram of the NaCl–NdCl3 system modelled in this work. Experimental data were presented by Sharma et al.34 (open red squares) and Igarashi et al.35 (open blue circles). | |
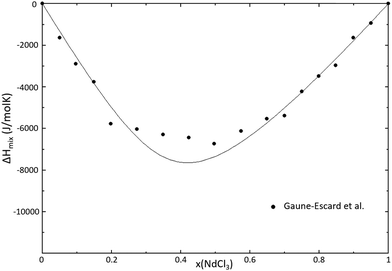 |
| | Fig. 20 Calculated mixing enthalpy of the NaCl–NdCl3 system at T = 1273 K, modelled in this work. Experimental data were reported by Gaune-Escard et al.36 | |
The thermodynamic models for the NaCl–SrCl2 and NaCl–BaCl2 have already been presented by Chartrand et al.33 However, since Chartrand et al. used different thermodynamic descriptions for the end-members, these systems were reassessed based on the experimental data available in the literature.
The system NaCl–SrCl2 was optimized based on the experimentally determined phase diagram data by Vortisch et al.,37 Scholich et al.38 and Bukhalova et al.39 The mixing enthalpy of the system was measured by Østvold et al.40 The optimized phase diagram is shown in Fig. 21, and the calculated mixing enthalpy is given in Fig. 22. The excess Gibbs energy function is given in eqn (17).
| | | ΔgNaSr/ClCl = −1119.3 + 0.4175T + χNaSr/ClCl(−1067.8) + ySrNa/ClCl(−996.4 + 1.3T) | (17) |
 |
| | Fig. 21 Calculated phase diagram using the model presented in this work of the NaCl–SrCl2 system. Experimental data from Vortisch et al.37 (empty black circles), Scholich et al.38 (empty red squares) and Bukhalova et al.39 (empty blue triangles). | |
 |
| | Fig. 22 Mixing enthalpy of the NaCl–SrCl2 system calculated with the model presented in this work. Experimental data from Østvold et al.36 | |
The thermodynamic model of the NaCl–BaCl2 system was optimized based on the experimental phase diagram data presented by Gemsky et al.41 and Zakharchenko et al.42 No experimentally determined mixing enthalpy data are available in the literature, and therefore the mixing enthalpy estimation method presented by Davis and Rice,21 also used for the systems SrCl2–NdCl3 and BaCl2–NdCl3 in this work, was used. The optimized phase diagram is shown in Fig. 23, and the calculated mixing enthalpy is shown in Fig. 24. The excess Gibbs energy function used in the model is given in eqn (18).
| | | ΔgNaBa/ClCl = 2800 − 3T + yBaNa/ClCl(−3T) | (18) |
 |
| | Fig. 23 Calculated phase diagram using the model presented in this work of the NaCl–BaCl2 system. Experimental data from Gemsky et al.41 (empty black circles) and Zakharchenko et al.42 (empty red squares). | |
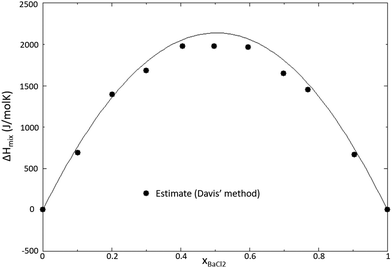 |
| | Fig. 24 Mixing enthalpy of the NaCl–BaCl2 system caulculated with the model presented in this work. Mixing enthalpy data estimated using the estimation method by Davis and Rice.21 | |
Appendix C: Ternary field investigations
In Section 4.8, the pseudo-binary systems {0.95NaCl + 0.05AECl2}–{0.95NdCl3 + 0.05AECl2} (AE = Sr, Ba) have been presented, equivalent to the binary NaCl–NdCl3 upon addition of 5% SrCl2 or BaCl2. The pseudo-binary phase diagram of NaCl–NdCl3 upon addition of 1% and 9.5% BaCl2 are presented here in Fig. 25 and 26 respectively. Fig. 27 and 28 show the projected liquidus surfaces of the ternary systems NaCl–SrCl2–NdCl3 and NaCl–BaCl2–NdCl3.
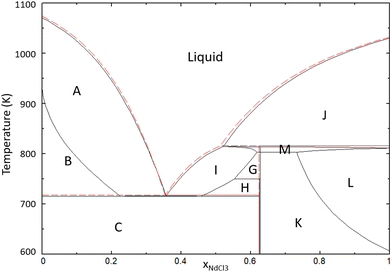 |
| | Fig. 25 Phase diagram of the {0.99NaCl + 0.01BaCl2}–{0.99NdCl3 + 0.01 BaCl2} pseudo-binary system of the NaCl–BaCl2–NdCl3 ternary. The labelled phases are NaCl + L′ (A), NaCl + BaCl2 + L′ (B), NaCl + BaCl2 + Na3Nd5Cl18 (C), Ba3Nd2Cl12 + Na3Nd5Cl18 + L′ (G), BaCl2 + Na3Nd5Cl18 + L′ (H), Na3Nd5Cl18 + L′ (I), NdCl3 + L′ (J), Ba3Nd2Cl12 + Na3Nd5Cl18 + Nd1−yBayCl3−y (K), Ba3Nd2Cl12 + Nd1−yBayCl3−y + L′ (L), Na3Nd5Cl18 + Nd1−yBayCl3−y + L′ (M). | |
 |
| | Fig. 26 Phase diagram of the {0.905NaCl + 0.095BaCl2} and {0.905NdCl3 + 0.095BaCl2} pseudo-binary section of the NaCl–BaCl2–NdCl3 ternary system. The labelled phases are NaCl + L′ (A), NaCl + BaCl2 + L′ (B), NaCl + BaCl2 + Na3Nd5Cl18 (C), BaCl2 + L′ (D), BaCl2 + Ba3Nd2Cl12 + L′ (E), Ba3Nd2Cl12 + L′ (F), Ba3Nd2Cl12 + Na3Nd5Cl18 + L′ (G), BaCl2 + Na3Nd5Cl18 + L′ (H), Na3Nd5Cl18 + L′ (I), NdCl3 + L′ (J), Ba3Nd2Cl12 + Na3Nd5Cl18 + Nd1−yBayCl3−y (K), Ba3Nd2Cl12 + Nd1−yBayCl3−y + L′ (L), Ba3Nd2Cl12 + Na3Nd5Cl18 + BaCl2 (N). The lines in red correspond to the phase diagram of the system NaCl–NdCl3. | |
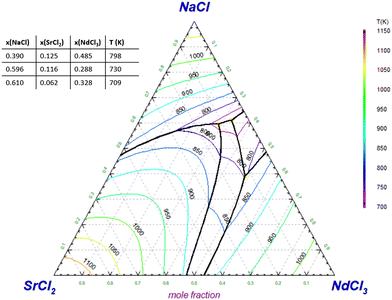 |
| | Fig. 27 Liquidus projection of the NaCl–SrCl2–NdCl3 system as calculated with the models presented in this work. No ternary excess terms were added. | |
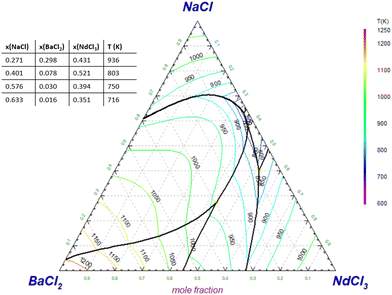 |
| | Fig. 28 Liquidus projection of the NaCl–BaCl2–NdCl3 system as calculated with the models presented in this work. No ternary excess terms were added. | |
The liquidus projection of the NaCl–SrCl2–NdCl3 system shown in Fig. 27 indicates that the melting point of the eutectic of the NaCl–NdCl3 binary is lowered slightly upon addition of small amounts of SrCl2, as it approaches a ternary eutectic composition.
Fig. 25 shows that the addition of 1% of BaCl2 has no significant effect on the melting behaviour of the binary NaCl–NdCl3, with the eutectic being approximately the same as in the pure system. Upon further addition of BaCl2, as shown in Fig. 17 and 26, the eutectic temperature increases, and precipitation becomes more likely. The primary crystallization phase at the eutectic composition is BaCl2. The liquidus projection in Fig. 28 shows that the addition of very small amounts of BaCl2 (≤1%) does not influence the melting point of the eutectic in a significant way. Further addition of BaCl2, however, does quickly lead to an increase of the eutectic temperature.
Acknowledgements
The authors of this paper gratefully acknowledge financial support from the ORANO group, as well as fruitful discussions with Dr Elisa Capelli.
References
- T. Abram and S. Ion, Generation-IV nuclear power: A review of the state of the science, Energy Policy, 2008, 36, 4323–4330 CrossRef.
- D. C. Alders and J. Vlieland, and Thijs, M and Konings, Rudolf Johannes Maria and Smith, Anna Louise. Experimental investigation and thermodynamic assessment of the system, J. Mol. Liq., 2024, 123997 CrossRef CAS.
- O. Beneš, and Konings, Rudolf Johannes Maria. Thermodynamic evaluation of the NaCl-MgCl2-UCl3-PuCl3 system, J. Nucl. Mater., 2008, 375(2), 202–208 CrossRef.
- O. Beneš, R. J. M. Konings, S. Wurzer, M. Sierig and A. Dockendorf, A DSC study of the NaNO3-KNO3 system using an innovative encapsulation technique, Thermochim. Acta, 2010, 509(1–2), 62–66 CrossRef.
-
O. Beneš, Thermodynamic database on molten salt reactor systems. Technical report, European Commission, Joint Research Centre, 2021 Search PubMed.
- E. S. Bettis, R. W. Schroeder, G. A. Cristy, H. W. Savage, R. G. Affel and L. F. Hemphill, The aircraft reactor experiment—design and construction, Nucl. Sci. Eng., 1957, 2(6), 804–825 CrossRef CAS.
- C. W. Bjorklund, J. G. Reavis, J. A. Leary and K. A. Walsh, Phase equilibria in the binary systems PuCl3-NaCl and PuCl3-LiCl, J. Phys. Chem., 1959, 63(10), 1774–1777 CrossRef CAS.
- G. A. Bukhalova, Izv. Sekt. Fiz.-Khim. Anal., 1955, 26, 138 CAS.
- Centre for Research in Computational Thermochemistry. FactSage 7.2.
- P. Chartrand and A. D. Pelton, Thermodynamic evaluation and optimization of the LiCl-NaCl-KCl-RbCl-CsCl-MgCl2-CaCl2-SrCl2-BaCl2 system using the modified quasichemical model, Can. Metall. Q., 2001, 40(1), 13–32 CrossRef CAS.
- M. W. Chase Jr, NIST-JANAF thermochemical tables, J. Phys. Chem. Ref. Data, Monogr., 1998, 9, 737–957 Search PubMed.
- H. T. Davis and S. A. Rice, Perturbation theory of the heats of mixing of fused salts, J. Chem. Phys., 1964, 41(1), 14–24 CrossRef CAS.
- G. Della Gatta, M. J. Richardson, S. M. Sarge and S. Stølen, Standards, calibration, and guidelines in microcalorimetry. Part 2. Calibration standards for differential scanning calorimetry*(IUPAC Technical Report), Pure Appl. Chem., 2006, 78(7), 1455–1476 CrossRef CAS.
- T. Dumaire, J. A. Ocádiz-Flores, R. J. M. Konings and A. L. Smith, A promising fuel for fast neutron spectrum Molten Salt Reactor: NaCl-ThCl4-PuCl3, Calphad, 2022, 79, 102496 CrossRef CAS.
- A. S. Dworkin and M. A. Bredig, The heats of fusion and transition of alkaline earth and rare earth metal halides, J. Phys. Chem., 1963, 67(3), 697–698 CrossRef CAS.
- M. Gaune-Escard, A. Bogacz, L. Rycerz and W. Szczepaniak, Calorimetric investigation of NdCl3-MCl liquid mixtures (where M is Na, K, Rb, Cs), Thermochim. Acta, 1994, 236, 67–80 CrossRef CAS.
- H. Gemsky, Neues Jahrb. Mineral. Geol. Paleontol. Beil., 1913, 36, 513 Search PubMed.
-
V. P. Glushko and L. V. Gurvich and V. A. Weitz, et al., Thermodynamic properties of individual substances, Nauka Publishing House, Moscow, vol. 3, 1978 Search PubMed.
- S. A. Hodorowicz, M. Olejak-Chodan and H. A. Eick, A preparatory and X-ray diffraction study of the SrCl2-NdCl3 system, J. Solid State Chem., 1987, 71(1), 205–213 CrossRef CAS.
- G. W. H. Höhne and H. K. Cammenga, and Eysel, W and Gmelin, E and Hemminger, W. The temperature calibration of scanning calorimeters, Thermochim. Acta, 1990, 160(1), 1–12 CrossRef.
-
D. E. Holcomb and G. F. Flanagan and B. W. Patton and J. C. Gehin and R. L. Howard and T. J. Harrison Fast spectrum molten salt reactor options. ORNL/TM-2011/105, 2011.
- K. Igarashi, M. Kosaka, Y. Iwadate, T. Hattori and J. Mochinaga, Phase Diagrams of LiCl-NdCl3, NaCl-NdC3, and CaCl2-NdCl3 Systems, Denki Kagaku oyobi Kogyo Butsuri Kagaku, 1990, 58(5), 469–470 CrossRef CAS.
- K. W. R. Johnson, M. Kahn and J. A. Leary, Phase equilibria in fused salt systems: binary systems of plutonium (III) chloride with the chlorides of magnesium, calcium, strontium and barium1, J. Phys. Chem., 1961, 65(12), 2226–2229 CrossRef CAS.
- R. J. M. Konings and A. Kovács, Thermodynamic properties of the lanthanide (III) halides, Handb. Phys. Chem. Rare Earths, 2003, 33, 147–247 CAS.
- A. Le Bail, New developments in microstructure analysis via Rietveld refinement, Adv. X-Ray Anal., 2000, 42, 191–203 CAS.
- C. Le Brun, Molten salts and nuclear energy production, J. Nucl. Mater., 2007, 360(1), 1–5 CrossRef CAS.
-
H. L. Lukas and S. G. Fries and B. Sundman, et al., Computational Thermodynamics: the Calphad method, Cambridge University Press, vol. 131, 2007 Search PubMed.
-
J. W. Mcmurray and K. Johnson and C. Agca and B. R. Betzler and D. J. Kropaczek and T. M. Besmann and D. Andersson and N. Ezell, Roadmap for thermal property measurements of Molten Salt Reactor systems. Technical report, No. ORNL/SPR-2020/1865, Oak Ridge National Lab.(ORNL), Oak Ridge, TN (United States), 2021 Search PubMed.
- G. Meyer and S. Masselmann, The alkali-poor part of the pseudoternary triangle AX/BX2/MX3: crystal structures, properties, and potentials of (alkali)/alkaline-earth/rare-earth chloride materials, Chem. Mater., 1998, 10(10), 2994–3004 CrossRef CAS.
- I. S. Morozov and F. N. T'en, Types ofEquilibrium Diagram of Binary Systems of R.E.E. and Alkaline-earth Metal Chlorides, Russ. J. Inorg. Chem., 1971, 16(8), 1215–1217 Search PubMed.
-
T. Østvold, A thermodynamic study of some fused salt mixtures containing alkali and alkaline earth chlorides, bromides and iodides, volume 91, Institute of Physical Chemistry, University of Trondheim, NTH, 1971 Search PubMed.
- G. I. L. van Oudenaren, J. A. Ocadiz-Flores and A. L. Smith, Coupled structural-thermodynamic modelling of the molten salt system NaCl-UCl3, J. Mol. Liq., 2021, 342, 117470 CrossRef CAS.
- A. D. Pelton, P. Chartrand and G. Eriksson, The modified quasi-chemical model: Part IV. Two-sublattice quadruplet approximation, Metall. Mater. Trans., A, 2001, 32(6), 1409–1416 CrossRef.
- J. Rodrguez-Carvajal, Recent advances in magnetic structure determination by neutron powder diffraction, Phys. B: Condens. Matter, 1993, 192(1–2), 55–69 CrossRef.
- K. Scholich, Neues Jahrb. Mineral. Geol., 1920, 43, 269 Search PubMed.
- R. D. Shannon, Revised effective ionic radii and systematic studies of interatomic distances in halides and chalcogenides, Acta Crystallogr., Sect. A: Cryst. Phys., Diffrac., Theor. Gen. Crystallogr., 1976, 32(5), 751–767 CrossRef.
- R. A. Sharma and R. A. Rogers, Phase Equilibria and Structural Species in NdCl3-NaCl, NdCl3-CaCl2, PrCl3-NaCl, and PrCl3-CaCl2 Systems, J. Am. Ceram. Soc., 1992, 75(9), 2484–2490 CrossRef CAS.
-
M. Taube, Fast reactors using molten chloride salts as fuel. Technical report, INFCE (Switzerland), 1978 Search PubMed.
- G. Vogel and A. Schneider, Chemie der seltenen erden in geschmolzenen alkalihalogeniden XII [1], Inorg. Nucl. Chem. Lett., 1972, 8(6), 513–521 CrossRef CAS.
- E. Vortisch, Neues Jahrb. Mineral. Geol., 1914, 38, 202–220 Search PubMed.
- J. A. Yingling, J. Schorne-Pinto, M. Aziziha, J. C. Ard, A. M. Mofrad, M. S. Christian, C. M. Dixon and T. M. Besmann, Thermodynamic measurements and assessments for LiCl-NaCl-KCl-UCl3 systems, J. Chem. Thermodyn., 2023, 179, 106974 CrossRef CAS.
- M. A. Zakharchenko and S. M. Aslanov, The ternary system containing the chlorides of lithium, sodium and barium, Zh. Neorgan. Khim., 1963, 8, 1532–1534 CAS.
Footnote |
| † Electronic supplementary information (ESI) available: Experimental investigations and modelling of the thermochemistry of the AECl2–NdCl3 (AE = Sr, Ba) molten salt systems. See DOI: https://doi.org/10.1039/d4cp01784f |
|
| This journal is © the Owner Societies 2024 |
Click here to see how this site uses Cookies. View our privacy policy here.  Open Access Article
 ,
D. J.
Cette
,
R. J. M.
Konings
and
A. L.
Smith
,
D. J.
Cette
,
R. J. M.
Konings
and
A. L.
Smith
 *
*
 , the standard entropy
  at the reference temperature of 298.15 K and the heat capacity
  as shown in eqn (1).
![[thin space (1/6-em)]](https://www.rsc.org/images/entities/char_2009.gif) 200
200![[thin space (1/6-em)]](https://www.rsc.org/images/entities/char_2009.gif) 800
800![[thin space (1/6-em)]](https://www.rsc.org/images/entities/char_2009.gif) 950
950![[thin space (1/6-em)]](https://www.rsc.org/images/entities/char_2009.gif) 850.4
850.4![[thin space (1/6-em)]](https://www.rsc.org/images/entities/char_2009.gif) 859.7
859.7![[thin space (1/6-em)]](https://www.rsc.org/images/entities/char_2009.gif) 159
159![[thin space (1/6-em)]](https://www.rsc.org/images/entities/char_2009.gif) 846
846![[thin space (1/6-em)]](https://www.rsc.org/images/entities/char_2009.gif) 629
629![[thin space (1/6-em)]](https://www.rsc.org/images/entities/char_2009.gif) 040
040![[thin space (1/6-em)]](https://www.rsc.org/images/entities/char_2009.gif) 900
900![[thin space (1/6-em)]](https://www.rsc.org/images/entities/char_2009.gif) 309
309![[thin space (1/6-em)]](https://www.rsc.org/images/entities/char_2009.gif) 950
950![[thin space (1/6-em)]](https://www.rsc.org/images/entities/char_2009.gif) 260
260![[thin space (1/6-em)]](https://www.rsc.org/images/entities/char_2009.gif) 853
853![[thin space (1/6-em)]](https://www.rsc.org/images/entities/b_char_2009.gif) 782
782![[thin space (1/6-em)]](https://www.rsc.org/images/entities/b_char_2009.gif) 000
000
![[thin space (1/6-em)]](https://www.rsc.org/images/entities/char_2009.gif) 478
478![[thin space (1/6-em)]](https://www.rsc.org/images/entities/char_2009.gif) 000
000![[thin space (1/6-em)]](https://www.rsc.org/images/entities/b_char_2009.gif) 641
641![[thin space (1/6-em)]](https://www.rsc.org/images/entities/b_char_2009.gif) 500
500
![[thin space (1/6-em)]](https://www.rsc.org/images/entities/b_char_2009.gif) 478
478![[thin space (1/6-em)]](https://www.rsc.org/images/entities/b_char_2009.gif) 000
000
![[thin space (1/6-em)]](https://www.rsc.org/images/entities/char_2009.gif) 577
577![[thin space (1/6-em)]](https://www.rsc.org/images/entities/char_2009.gif) 460
460


![[thin space (1/6-em)]](https://www.rsc.org/images/entities/char_2009.gif) ln
ln![[thin space (1/6-em)]](https://www.rsc.org/images/entities/char_2009.gif) XA + XBRT
XA + XBRT![[thin space (1/6-em)]](https://www.rsc.org/images/entities/i_char_2009.gif) ln
ln![[thin space (1/6-em)]](https://www.rsc.org/images/entities/char_2009.gif) XB + ΔGexcessm
XB + ΔGexcessm


![[thin space (1/6-em)]](https://www.rsc.org/images/entities/char_2009.gif) 110 + 5T) + yBayNd2(7000)
110 + 5T) + yBayNd2(7000)![[thin space (1/6-em)]](https://www.rsc.org/images/entities/char_2009.gif) 000)
000)![[thin space (1/6-em)]](https://www.rsc.org/images/entities/char_2009.gif) 000)
000)![[3 with combining macron]](https://www.rsc.org/images/entities/char_0033_0304.gif) ), as well as a solid solution Sr1−xNdxCl2+x, have been identified by Hodorowicz et al.22 Experimental measurement of invariant equilibria has been reported by Morozov et al.23 and Vogel et al.24 No intermediates have been reported in the literature on the BaCl2–NdCl3 system. However, Meyer et al.25 have reported a compound with the chemical formula Ba9Nd6Cl34O. This compound could correspond to the intermediate Ba3Nd2Cl12 instead, as is the case in the analogous BaCl2–CeCl3 system.16 Measurements of invariant equilibria have been reported by Morozov et al.23 and Vogel et al.24
), as well as a solid solution Sr1−xNdxCl2+x, have been identified by Hodorowicz et al.22 Experimental measurement of invariant equilibria has been reported by Morozov et al.23 and Vogel et al.24 No intermediates have been reported in the literature on the BaCl2–NdCl3 system. However, Meyer et al.25 have reported a compound with the chemical formula Ba9Nd6Cl34O. This compound could correspond to the intermediate Ba3Nd2Cl12 instead, as is the case in the analogous BaCl2–CeCl3 system.16 Measurements of invariant equilibria have been reported by Morozov et al.23 and Vogel et al.24
![[3 with combining macron]](https://www.rsc.org/images/entities/char_0033_0304.gif) ) was succesfully synthesised, and the profile refinement is shown in Fig. 2. The obtained refined cell parameters are compared to those presented by Hodorowicz et al. in Table 3, and these are in good agreement with each other (Fig. 3).
) was succesfully synthesised, and the profile refinement is shown in Fig. 2. The obtained refined cell parameters are compared to those presented by Hodorowicz et al. in Table 3, and these are in good agreement with each other (Fig. 3).

![[3 with combining macron]](https://www.rsc.org/images/entities/char_0033_0304.gif) ) in this work and in the literature
) in this work and in the literature
![[3 with combining macron]](https://www.rsc.org/images/entities/char_0033_0304.gif) m) with a maximum of approximately 18% NdCl3. The existence of this solid solution is confirmed in this work with quenching and post-XRD measurements. Stoichiometric mixtures of SrCl2 and NdCl3 of compositions x(NdCl3) = 0, 0.05, 0.1 and 0.15 were quenched from 923 K. All mixtures showed a single phase solid solution. The profile refinements of the collected XRD data are reported in the supplementary information to this work, and the evolution of the lattice parameters in Fig. 5.
m) with a maximum of approximately 18% NdCl3. The existence of this solid solution is confirmed in this work with quenching and post-XRD measurements. Stoichiometric mixtures of SrCl2 and NdCl3 of compositions x(NdCl3) = 0, 0.05, 0.1 and 0.15 were quenched from 923 K. All mixtures showed a single phase solid solution. The profile refinements of the collected XRD data are reported in the supplementary information to this work, and the evolution of the lattice parameters in Fig. 5.

![[3 with combining macron]](https://www.rsc.org/images/entities/char_0033_0304.gif) m) phase, calculated from the profile refinements of the solid solutions quenched in the SrCl2–NdCl3 system for T = 923 K.
m) phase, calculated from the profile refinements of the solid solutions quenched in the SrCl2–NdCl3 system for T = 923 K.
![[3 with combining macron]](https://www.rsc.org/images/entities/char_0033_0304.gif) m) have been observed previously by Alders et al.16 in the BaCl2–CeCl3 system. Due to the similarities between CeCl3 and NdCl3 (rCe(3+),VI = 1.01 Å, rNd(3+),VI = 0.98 Å29), we expect a similar solid solution to also form in this system. Additionally, the invariant points measured by DSC between x(NdCl3) = 0.05 and 0.25 (see Section 4.7.2) correspond to the formation event of a high-temperature solid solution.
m) have been observed previously by Alders et al.16 in the BaCl2–CeCl3 system. Due to the similarities between CeCl3 and NdCl3 (rCe(3+),VI = 1.01 Å, rNd(3+),VI = 0.98 Å29), we expect a similar solid solution to also form in this system. Additionally, the invariant points measured by DSC between x(NdCl3) = 0.05 and 0.25 (see Section 4.7.2) correspond to the formation event of a high-temperature solid solution.


