
 Open Access Article
 This Open Access Article is licensed under a
 Creative Commons Attribution 3.0 Unported Licence
Manganese matere bonds in biological systems: PDB inspection and DFT calculations†
Sergi
Burguera
a,
Akshay Kumar
Sahu
bc,
Michael Jordan
Chávez Romero
a,
Himansu S.
Biswal
 *bc and
Antonio
Bauzá
*a
*bc and
Antonio
Bauzá
*a
aDepartment of Chemistry, Universitat de les Illes Balears, Ctra. de Valldemossa km 7.5, 07122 Palma de Mallorca, Baleares, Spain. E-mail: antonio.bauza@uib.es
bSchool of Chemical Sciences, National Institute of Science Education and Research (NISER), PO-Bhimpur-Padanpur, Via-Jatni, Khurda, 752050, Bhubaneswar, India. E-mail: himansu@niser.ac.in
cHomi Bhabha National Institute, Training School Complex, Anushakti Nagar, Mumbai 400094, India
First published on 20th June 2024
Abstract
A Protein Data Bank (PDB) survey has revealed noncovalent contacts involving Mn centres and protein residues. Their geometrical features are in line with the interaction between low electron density sites located along the Mn–O/N coordination bonds (σ-holes) and the lone pairs belonging to TYR, SER or HIS residues, known as a matere bond (MaB). Calculations at the PBE0-D3/def2-TZVP level of theory were used to investigate the strength and shed light on the physical nature of the interaction. We expect the results presented herein will be useful for those scientists working in the fields of bioinorganic chemistry, particulary in protein–metal docking, by providing new insights into transition metal⋯Lewis base interactions as well as a retrospective point of view to further understand the structural and functional implications of this key transition metal ion.
Introduction
Manganese, an abundant transition metal in nature, plays a key role in several organism realms,1 mainly due to its involvement as a cofactor for enzymatic catalysis,2 facilitator of redox reactions,3 and structural constituent of biomolecules.4In this context, Mn superoxide dismutase (MnSOD) represents a paradigmatic example, being involved in the catalysis of superoxide radicals dismutation to oxygen and hydrogen peroxide, a molecular process related to cellular antioxidant activity.5 Through this enzymatic activity, MnSOD safeguards cellular constituents from oxidative damage, thereby protecting them from a broad range of pathologies related to oxidative stress, including cancer and neurodegenerative disorders.6
Furthermore, Mn acts as a cofactor for enzymes crucial to nutrient metabolism and energy production, thus exerting a dramatic influence over metabolic pathways.7 For instance, in carbohydrate metabolism Mn-dependent enzymes such as pyruvate carboxylase play a pivotal role in gluconeogenesis, being an indispensable mechanism for maintaining blood glucose levels during fasting or prolonged energy deprivation.8 Additionally, Mn participation extends to amino acid metabolism and neurotransmitter synthesis, thus remarking its role in neurological function and neurochemical homeostasis.9
In addition to its enzymatic roles, Mn is also involved in the structural integrity of several biological complexes, such as the oxygen-evolving complex (OEC) of photosystem II (PSII) in photosynthetic organisms.10 More in detail, its coordination to a Ca2+ ion and several protein residues facilitates the water-splitting reaction, a crucial step in oxygenic photosynthesis. Hence, understanding the intricate mechanisms governing Mn chemical and structural functionalities is key to complete the molecular picture regarding the biological functions of this crucial metal ion.
In this work, we have explored the capacity of Mn centres to be involved in noncovalent interactions. Previously, several studies have demonstrated that group 7 elements (mainly Tc and Re) can undergo noncovalent binding,11 proposing the term Matere Bond (MaB) to name the noncovalent force between low electron density sites located along the Ma–C/O coordination bonds (known as σ-holes), and electron rich species (e.g. a lone pair or an anion).12 However, as far as our knowledge extends, no biological context for this novel type of interaction has been proposed yet.
To achieve this, we have performed a search in the Protein Data Bank (PDB)13 and found a large amount of hits where noncovalent contacts between Mn centres and electron rich molecules were taking place. The results from the PDB search were complemented by a theoretical study at the PBE0-D3/def2-TZVP level of theory on three selected structures. This included the calculation of the molecular electrostatic potential (MEP) surfaces, the quantum theory of atoms in molecules (QTAIM), the natural bonding orbital (NBO) and the non covalent interaction plot (NCIplot) visual index. We expect the results presented herein will be useful for those scientists working in the fields of bioinorganic chemistry, particularly in metal–protein interactions, as well as a retrospective point of view to further understand the structural and functional implications of this key transition metal ion.
Methods
PDB inspection
We performed a search on the RCSB website to retrieve Mn-containing PDB files with a resolution of up to 4 Å, resulting in a total of 3898 PDB files. Subsequently, we utilized a custom Python code to analyse these downloaded PDB files. The following criteria were employed in this study:(a) Initial analysis. We conducted an analysis without coordination restrictions to examine the overall distance and angle distribution between Mn and neighbouring atoms in the PDB files, providing insights into the coordination environments surrounding Mn. This analysis also involved exploring the distribution of A1–Mn–A2 angles, where the distance between A1 and Mn was kept below 2.8 Å, and the distance between Mn and A2 was kept below 5 Å (Fig. 1A). A1 and A2 represent the nitrogen (N), oxygen (O) and sulphur (S) atoms. By imposing these distance constraints, we aimed to gain a comprehensive understanding of the angular arrangements around Mn, contributing to a more detailed characterization of its coordination environment.
 | ||
| Fig. 1 (A) Schematic representation for criteria used for initial search. (B) Schematic representation for criteria used to search for Mn–X non-covalent bond. (C) Distance distribution of Mn–A2 without coordination restriction. (D) Angle distribution of A1–Mn–A2 without coordination restriction. (E) Contour plot depicting the relationship between Mn–A2 distance and A1–Mn–A2 angle without coordination restriction. The plot displays a colour scale ranging from blue to red, representing the 0–1 normalized density. | ||
(b) Specific coordination restrictions. Subsequently, we applied the restriction of 4 and 6 neighbouring A1 atoms from different residues within a 2.8 Å vicinity of the Mn atom. This allowed us to classify Mn as a 4-coordinated or 6-coordinated compound.
(c) Distance and angle analysis. For the identified 4 or 6 coordinated systems, we examined the distance distribution between Mn and A2 atoms up to a 5 Å distance, as well as the distribution of A1–Mn–A2 angles.
(d) Searching for A–Mn–X Interactions. For A–Mn–X interactions we considered Mn atoms coordinated by four A atoms where A represent N, O, and S atoms while X also represents O, N, and S atoms (excluding water O) and X is from a different residues than A. We imposed a Mn–A distance criterion of less than 2.8 Å, while the Mn–X distance fell within the range of 2.8 Å to 5 Å (Fig. 1B). See ESI† for a complete list of the PDB structures where Mn–X interactions were found.
Computational methods
Theoretical calculations on selected PDB structures have been performed at the PBE014,15-D316/def2-TZVP17 level of theory. Calculations have been performed using TURBOMOLE 7.7 software18 and the interaction energies obtained applying the supermolecule approximation (ΔEMaB = EMn![[thin space (1/6-em)]](https://www.rsc.org/images/entities/char_2009.gif) centre − Eelectronrichmoiety) through single point calculations on H-optimized models (see ESI† for the cartesian coordinates). As Mn centre, we considered the Mn atom in addition to its four coordinated ligands. The interaction energies given were corrected using the Boys and Bernardi counterpoise technique.19 The Mn centre charge and multiplicity used for each selected structure was: 0 and 5 (2P7P), +1 and 6 (3BG5 and 3DKY).
centre − Eelectronrichmoiety) through single point calculations on H-optimized models (see ESI† for the cartesian coordinates). As Mn centre, we considered the Mn atom in addition to its four coordinated ligands. The interaction energies given were corrected using the Boys and Bernardi counterpoise technique.19 The Mn centre charge and multiplicity used for each selected structure was: 0 and 5 (2P7P), +1 and 6 (3BG5 and 3DKY).
The MEP surfaces were computed at the PBE0/def2-TZVP level of theory by means of the Gaussian 16 software20 and analysed using the Gaussview 5.0 program.21 The calculations for the wavefunction analysis were also carried out at the PBE0/def2-TZVP level of theory (also using the Gaussian 16 software) and analysed by means of the AIMall program.22 The NBO23 analyses were performed at the HF/def2-TZVP level of theory. Lastly, the NCIplot24 isosurfaces correspond to both favourable and unfavourable interactions, as differentiated by the sign of the second-density Hessian eigenvalue and defined by the isosurface colour. The colour scheme is a red–yellow–green–blue scale, with red for repulsive (ρcut+) and blue for attractive (ρcut−) NCI interaction density. Yellow and green surfaces correspond to weak repulsive and weak attractive interactions, respectively. The surfaces were visualized using the visual molecular dynamics (VMD) software.25
Results and discussion
PDB search results
We conducted an initial search to investigate the coordination environments surrounding the Mn atom in the analysed PDB files. In this analysis, we examined the distance and angle distributions between Mn and neighbouring A2 atoms without imposing specific coordination restrictions. The search yielded a total of 144825 hits from 13627 different atoms, where A2 atoms were found within a 5 Å vicinity of the Mn atom.
The analysis of the distance distribution revealed two prominent peaks at 2.3 Å and 4.3 Å (Fig. 1C), indicating regions where Mn atoms are likely to be close to the surrounding A2 atoms. Similarly, the analysis of the angle distribution demonstrated two significant peaks at 95° and 165° (Fig. 1D), representing preferred angular arrangements between the A1–Mn–A2 atoms. These findings suggest the presence of specific geometric configurations in the coordination environments surrounding Mn.
To further understand the relationship between distance and angle, we plotted a contour plot (Fig. 1E). At a Mn–A2 distance of 2.3 Å, the contour plot revealed two confined regions of high density for the angle distribution. The first region, spanning 80° to 110°, was a result of equatorial atoms in octahedral and tetrahedral geometries. The second region, spanning 160° to 180°, primarily arose from axial atoms in octahedral geometry. Additionally, a wider spread region was observed from 3 Å to 5 Å, with angles ranging from 70° to 170°. This spread indicates the presence of tetrahedral or other less coordinated geometries, where non-covalent interactions have room for formation.
Furthermore, we performed a restricted coordination search focusing on 4 and 6-coordinated systems. In this regard, for 4-coordinated Mn 1613 (11.8%) systems were found, with a total number of 15692 hits, while for 6-coordinated Mn 5523 (40.5%) systems yielded 74858 hits. The rest of the hits found fulfilled the distance criteria but not the coordination index criteria, and thus were not considered for further analyses. The distance distribution for 4-coordinated systems exhibited higher counts between Mn and A2 atoms in the range of 3 Å to 4 Å compared to the same distance range in 6-coordinated systems (Fig. 2A and D). In terms of the angle distribution, 4-coordinated systems did not show a preferred region except for a sharp peak at 95° (Fig. 2B). On the other hand, 6-coordinated systems displayed two preferred regions at 95° and 170°, indicating distinct angular arrangements in these systems (Fig. 2D).
 | ||
| Fig. 2 (A) Distance distribution of Mn–A2 for 4-coordinated system. (B) Angle distribution of A1–Mn–A2 for 4-coordinated system. (C) Contour plot depicting the relationship between Mn–A2 distance and A1–Mn–A2 angle for 4-coordinated system. The plot displays a colour scale ranging from blue to red, representing the 0–1 normalized density. (D) Distance distribution of Mn–A2 for 4-coordinated system. (E) Angle distribution of A1–Mn–A2 for 4-coordinated system. (F) Contour plot depicting the relationship between Mn–A2 distance and A1–Mn–A2 angle for 4-coordinated system. The plot displays a colour scale ranging from blue to red, representing the 0–1 normalized density. | ||
The contour plots for 4 and 6-coordinated systems depicted the Mn–A2 distance and angle distributions. In the 4-coordinated systems, the Mn–A2 distances were more spread out, suggesting the possibility of non-covalent interactions within the defined criteria (Fig. 2C). Conversely, in the 6-coordinated systems, Mn atoms were surrounded by A2 atoms, making non-covalent interactions less likely due to the higher coordination number (Fig. 2F).
Based on our analysis, it can be concluded that the 4-coordinated systems offer more favourable conditions for non-covalent interactions compared to the 6-coordinated systems. Building upon this finding, we further focused our investigation on the Mn-centred non-covalent interactions within the 4-coordinated systems. To initiate the A–Mn–X search we began by setting a criterion for the A–Mn distance, requiring it to be less than 2.8 Å. This distance criterion ensures that the neighbouring atoms (A) are close to the Mn atom. Additionally, we established a criterion for the Mn–X distance, requiring it to be greater than 2.8 Å and less than 5 Å. This range was chosen based on the observation from Fig. 1(C), which highlighted that most coordinated bond lengths centred around 2.3 Å. By setting a minimum distance criterion of 2.8 Å for the Mn–X interactions, to avoid overlap between the coordinate and non-covalent bonds. Applying these distance criteria, we conducted the search and identified 3936 hits that satisfied the established criteria for A–Mn–X interactions within the 4-coordinated systems. The results are shown in Fig. 3. Where Fig. 3(A) show the distance distribution of the Mn–X distance and Fig. 3(B) shows the A–Mn–X angle distribution. The distance vs angle plot in Fig. 3(C) shows the wide spread of the Mn–X distance and A–Mn–X angle intensify the possibility of the non-covalent interactions.
 | ||
| Fig. 3 (A) Distance distribution of Mn–X. (B) Angle distribution of A–Mn–X. (C) Contour plot depicting the relationship between Mn–A distance and A–Mn–X angle. The plot displays a colour scale ranging from blue to red, representing the 0–1 normalized density. | ||
Selected structures from PDB search
Bearing in mind the results derived from the PDB search involving 4 coordinated Mn centres, three structures were selected for calculations based on the distance and angle criteria discussed above to provide theoretical insights into the physical nature of the MaBs found.The first selected structure corresponds to the fosfomycin resistance protein, FosX, which catalyzes the hydration of the antibiotic fosfomycin, (1R,2S)-epoxypropylphosphonic acid.26 Fosfomycin inhibits the enzyme UDP-N-acetylglucosamine-3-enolpyruvyl transferase (MurA), which is involved in bacterial cell wall biosynthesis. Upon clinical use, resistance to fosfomycin rapidly emerged and was attributed to mutations affecting (i) antibiotic transport and (ii) MurA protein itself.
Inside the active site, FosX enzyme presents a catalytically active Mn ion coordinated to three protein residues and a sulphate ion that mimics the phosphonate group from the natural substrate (see Fig. 4). More in detail, the Mn3+ ion is coordinated to GLU118, HIS7 and HIS69 residues as well as to the SO42− group in a seesaw geometry. In addition, a TYR residue in the vicinity of this coordination complex interacts with the Mn centre at 3.563 Å, exhibiting a NHIS7–Mn⋯O angle of 141.3° and a MaB (Mn⋯O) interaction energy of −8.2 kcal mol−1. Fillgrove and collaborators pointed out to this residue as a stabilizing source of the reaction product, based on the hydrogen bond (HB) donor/acceptor properties of the phenol group. However, it is also involved in the stabilization of the Mn3+ centre through a MaB, a fact that passed unnoticed in the original study.
 | ||
| Fig. 4 Partial view of the X-ray structure 2P7P with indication of the MaB interaction between a Mn(III) centre and TYR108. Distance in Å. The organism and protein names are also indicated. | ||
The second selected structure involves the work from Xiang and collaborators, corresponding to the pyruvate carboxylase (PC) enzyme from Staphylococcus aureus.27 This protein is involved in the catalysis of the biotin-dependent production of oxaloacetate and plays an important role in gluconeogenesis, lipogenesis, insulin secretion among other cellular processes. PC contains biotin carboxylase (BC), carboxyltransferase (CT) and biotin-carboxyl carrier protein (BCCP) domains.
The overall catalysis by PC involves a first step, where the BC domain catalyzes the carboxylation of biotin. In the next step, a bicarbonate molecule donates the carboxyl group and ATP is hydrolyzed to ADP. Then, an activated carboxyl group is transferred to pyruvate to produce oxaloacetate by the CT domain. The BC domain requires divalent cations (e.g. Mg2+) for binding of the ATP substrate and for catalysis, while the CT domain contains a bound Mn2+ ion in mammalian PC.
This Mn2+ ion is coordinated to four protein amino acids (HIS771, HIS773, LYS741 and ASP572 residues, see Fig. 5) also in a seesaw disposition. Interestingly, a pyruvate molecule lies in the vicinity of the metal centre, establishing a noncovalent contact with the Mn2+ coordination complex. More in detail, the oxygen belonging to the carbonyl group from pyruvate interacts with the Mn at 3.391 Å, with an interaction angle (NHIS771–Mn⋯O) of 161.1°. In this case, the MaB strength obtained was −7.8 kcal mol−1, thus and playing a remarkable role in the catalytic mechanism of PC by assisting in the stabilization of the substrate molecule prior to the carboxylate transfer reaction.
 | ||
| Fig. 5 Partial view of the X-ray structure 3BG5 with indication of the MaB interaction between a Mn(II) centre and a pyruvate (PYR) molecule. Distance in Å. The organism and protein names are also indicated. | ||
The last selected example involves the crystal structure of the plasmid replication initiator RepB protein.28 This enzyme is involved in the plasmid rolling-circle replication (RCR), a molecular mechanism carried out by several microorganisms (e.g. transposons, bacterial plasmids, bacteriophages and viruses) to start de novo DNA synthesis. Concretely, RCR is initiated by a crucial triggering reaction consisting in the site-specific cleavage of one of the NA duplex strands within the origin of replication. This cleavage reaction is catalyzed by RCR initiator proteins, resulting in a primer (a newly generated 3′-OH end) for DNA polymerases to start synthesis.
In their study, Boer and collaborators revealed an hexameric ring structure in RepB, where each protomer has two domains. The origin-binding and catalytic domains showed a three-layer α–β–α sandwich fold, being the active site positioned at one of the faces of the β-sheet and coordinated to a Mn2+ ion by three HIS residues (55, 39 and 57) and ASP42 (see Fig. 6) in a seesaw fashion. In addition, another HIS residue (HIS102) is positioned in the vicinity of the Mn coordination complex, establishing a noncovalent contact with the Mn centre (Mn⋯N distance of 3.912 Å and NHIS55–Mn⋯NHIS102 angle of 162.0°) yielding an interaction energy of −9.6 kcal mol−1. Since this residue is neighboring the catalytically active TYR99 (not shown in Fig. 6), the formation of this MaB might be of biological relevance to further direct the interaction between the Mn2+ ion and TYR99 residue, by blocking one of the two available σ-holes present in the Mn atom (see MEP analysis below).
 | ||
| Fig. 6 Partial view of the X-ray structure 3DKY with indication of the MaB interaction between a Mn(II) centre and HIS102. Distance in Å. The organism and protein names are also indicated. | ||
Theoretical analyses
With the purpose to analyse the physical nature of the MaBs studied herein, we used several state-of-the-art QM tools, including MEP surface calculations, QTAIM, NBO and NCIplot methodologies.In Fig. 7A, the MEP surface of the neutral Mn centre corresponding to 2P7P structure is shown, where the Mn atom exhibits an anisotropic electron density distribution with two markedly electropositive regions being located on the extension of the two Mn–NHIS coordination bonds (+23.1 and +46.3 kcal mol−1, respectively), thus directing the formation of the MaB.
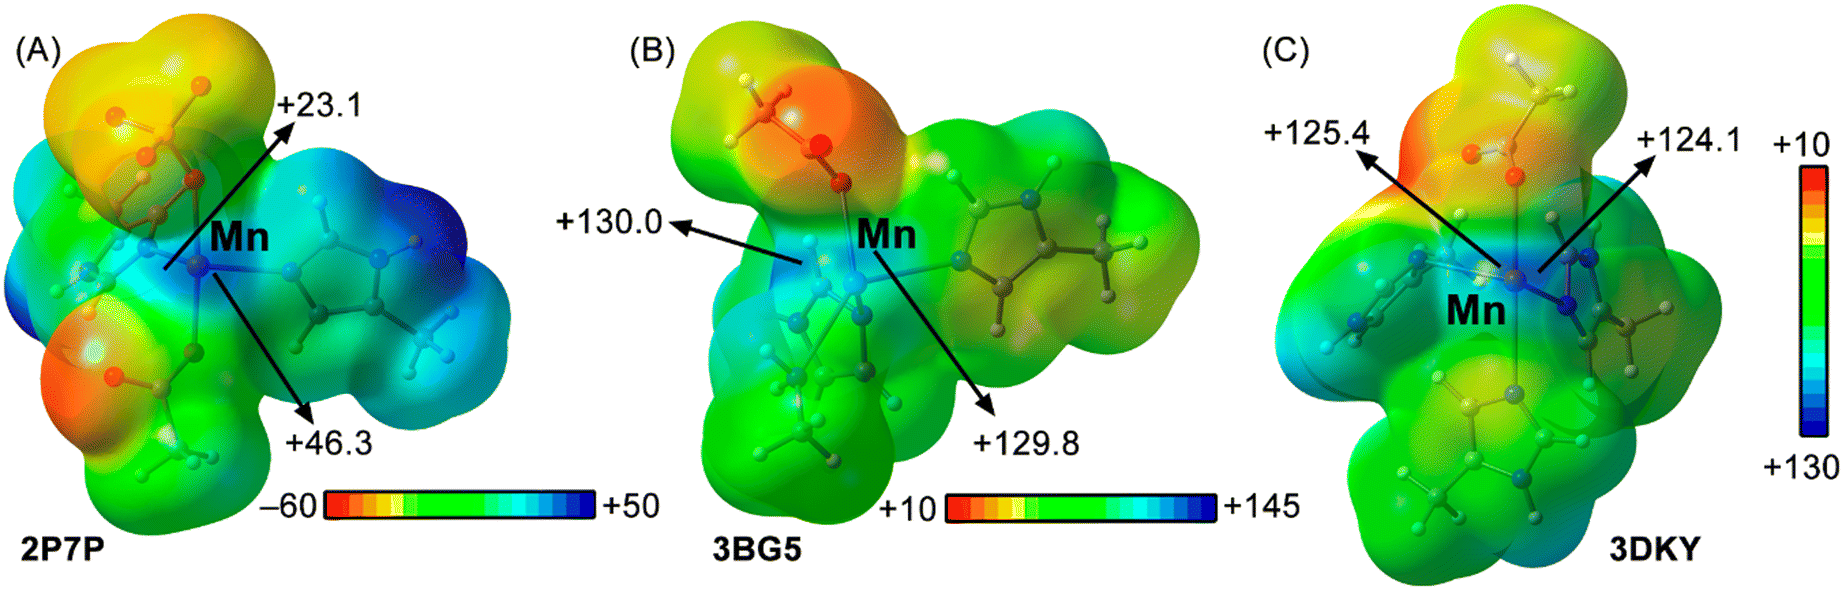 | ||
| Fig. 7 MEP surfaces of the Mn centres present in (A) 2P7P, (B) 3BG5 and (C) 3DKY structures. Energy values at discrete points of the surface are given in kcal mol−1 (0.001 a.u.). | ||
Secondly, in 3BG5 structure the MEP calculation (Fig. 7B) showed two available and very electropositive σ-holes over the tip of the Mn atom (with magnitudes of +130.0 and +129.8 kcal mol−1), owing to the cationic nature of this coordination complex, one of them coinciding with the interacting direction of the pyruvate moiety.
Lastly, in the case of 3DKY structure, the MEP surface (Fig. 7C) also revealed two available Mn σ-holes of a similar value than those observed in the 3BG5 structure (with magnitudes of +125.4 and +124.1 kcal mol−1), thus making the interaction very favourable from an electrostatics perspective.
On the other hand, the NBO analysis of these MaB complexes revealed an orbital donation from the lone pairs (LP) of the O and N atoms to empty s (s*) and p (p*) orbitals from the Mn atom with a magnitude of 0.64 (2P7P), 1.60 (3BG5) and 0.67 kcal mol−1 (3DKY), in line with that observed for other σ-hole based interactions involving transition metal atoms.29
In Fig. 8 the combined QTAIM and NCIplot graphs for each biological assembly are shown. Interestingly, in 2P7P structure (Fig. 8A) the MaB is characterized by the presence of a greenish isosurface located between the O atom from the phenol group of TYR108 and the Mn centre. In addition, several ancillary interactions (such as HB and CH–π) are also present in the assembly, as denoted by the bcps and bond paths connecting the phenol moiety to (i) the O atom from a carboxylate moiety and (ii) to the N atom from a HIS residue coordinated to Mn. Furthermore, the CH–π interaction is denoted by the presence of a bcp and a bond path connecting a CH group from the carboxylate moiety to a C atom from the TYR108 ring.
 | ||
| Fig. 8 Distribution of intermolecular bcps (red dots) and bond paths in the models of (A) 2P7P, (B) 3BG5 and (C) 3DKY structures. Ancillary HB and CH–π interactions are also indicated. The values of the density (ρ × 102) related to the MaB interaction and ancillary NCIs are also included in a.u. NCIplot color range −0.03 a.u. ≤ (signλ2) ρ ≤ +0.03 a.u. | ||
On the other hand, in 3BG5 structure (Fig. 8B) the combined QTAIM and NCIplot graphs characterized the MaB by the presence of a bond critical point (bcp) and a bond path that connected the O atom from the carbonyl group of the PYR molecule to the Mn centre. In addition, an ancillary HB is also present in the assembly, as denoted by the bcp and bond path connecting the O from the same carbonyl group to an NH bond of a vicinal LYS ligand.
Lastly, in the MaB corresponding to structure 3DKY (see Fig. 8C), the MaB was characterized by a greenish isosurface located between the N atom from the imidazole ring of HIS102 and the Mn atom. In addition, HB and CH–π interactions are also present in the complex, as indicated by the bcps and bond paths connecting (i) a CH group from HIS102 ring to an O atom from the carboxylate moiety coordinated to the Mn centre and (ii) a CH group from one of the coordinated HIS residues to the π-system of HIS102.
From a qualitative point of view, the NCIplot visual index showed greenish isosurfaces between the Mn coordination complex and the interacting aminoacids in all three structures, indicating a weak but favourable nature of the NCIs present in these biological assemblies as well as a shared director role between the MaB and the ancillary HB and CH-π interactions. To complement these results, we have included the values of the laplacian of ρ (∇2ρ × 102, in a.u.), the potential (V × 102, in a.u.) and kinetic (G × 102, in a.u.) energy densities as well as the total energy density (H × 102, in a.u.) regarding the MaB and the HB/CH–π interactions present in these biological assemblies (see Table 1). As noted, the values of ∇2ρ × 102 resulted positive in all the cases. Moreover, the values of V × 102 and G × 102 energy densities lie within the same range in all the cases, confirming the noncovalent nature of the MaB interaction (|Vr|/Gr) ≈ 1.
Conclusions
In this manuscript, using a combined PDB and computational approach we have demonstrated the presence and attractive nature of noncovalent interactions involving Mn coordination complexes and electron rich species (e.g. TYR, HIS or substrate molecules). An initial PDB survey revealed the presence of two main Mn–A2 distance peaks near 2.3 Å and 4.3 Å, suggesting the presence of two regions (or type) of interactions (one involving coordination bonds and second one encompassing non-covalent bonds, respectively). Additionally, in the A1–Mn–A2 angle analysis two peaks were revealed, centred at 95° and 170° respectively, which suggested the presence of Mn octahedral and tetrahedral coordination complexes. Further analysis inferred that 4 coordinated Mn favours the formation of noncovalent bonds in comparison with 6 coordinated Mn centres, due the steric overcrowding in the later. On the other hand, computations at the PBE0-D3/def2-TZVP level of theory on three selected structures derived from the PDB search involving 4 coordinated Mn coordination complexes revealed that the MaB interaction is mainly supported by electrostatics, owing to the cationic nature of the Mn centres and the presence of electropositive σ-holes on the Mn–NHIS coordination bonds, while the orbital term played a minor role in the stability of the complexes. Furthermore, the physical nature of the MaBs studied herein was further characterized using QTAIM and NCIplot analyses, which pointed out to a shared director role between MaB and HB/CH–π interactions. The results presented herein might be of great importance for those scientists working in the fields of bioinorganic chemistry and protein–metal interactions, also serving as a retrospective point of view to further understand the structural and functional implications of this key transition metal ion.Author contributions
Most of the computational studies were conducted by M. J. C. R., A. K. S. and S.B. H. S. B. carried out the PDB search while H. S. B. and A. B. wrote the article and directed the study. S. B. and A. K. S. contributed equally.Data availability
The data supporting this article have been included as part of the ESI.†Conflicts of interest
There are no conflicts to declare.Acknowledgements
This research was funded by the MICIU/AEI of Spain (project PID2020-115637GB-I00 FEDER funds). We thank the CTI (UIB) for computational facilities. H. S. B. thanks the Department of Atomic Energy (DAE) India for financial support.Notes and references
- J. J. Morgan, Metal Ions in Biological Systems, Taylor & Francis, Boca Raton, 2000 Search PubMed.
- (a) D. W. Christianson and J. D. Cox, Annu. Rev. Biochem., 1999, 68, 33 CrossRef CAS PubMed; (b) G. C. Dismukes, Chem. Rev., 1996, 96, 2909 CrossRef CAS PubMed; (c) D. W. Christianson, Prog. Biophys. Mol. Biol., 1997, 67, 217 CrossRef CAS PubMed; (d) S. B. Schmidt and S. Husted, Plants, 2019, 8, 381 CrossRef CAS PubMed; (e) G. D. Lawrence and D. T. Sawyer, Coord. Chem. Rev., 1978, 27, 173 CrossRef CAS.
- (a) R. H. Kenten and P. J. G. Mann, Biochem. J., 1952, 52, 125 CrossRef CAS PubMed; (b) M. Gorbacheva, O. Morozova, G. Shumakovich, A. Streltsov, S. Shleev and A. Yaropolov, Bioorg. Chem., 2009, 37, 1 CrossRef CAS PubMed; (c) W. Zhu and N. G. J. Richards, Essays Biochem., 2017, 61, 259 CrossRef PubMed.
- (a) R. Zeinert, E. Martinez, J. Schmitz, K. Senn, B. Usman, V. Anantharaman, L. Aravind and L. S. Waters, J. Biol. Chem., 2018, 293, 5715 CrossRef CAS PubMed; (b) T. Shutova, J. Nikitina, G. Deikus, B. Andersoon, V. Klimov and G. Samuelsson, Biochemistry, 2005, 44, 15182 CrossRef CAS PubMed; (c) M. W. Brazier, P. Davies, E. Player, F. Marken, J. H. Viles and D. R. Brown, J. Biol. Chem., 2008, 283, 12831 CrossRef CAS PubMed; (d) A. D. Ogunniyi, L. K. Mahdi, M. P. Jennings, A. G. McEwan, C. A. McDevitt, M. B. Van der Hoek, C. J. Bagley, P. Hoffmann, K. A. Gould and J. C. Paton, J. Bacteriol., 2010, 192, 4489 CrossRef CAS PubMed.
- (a) N. C. N. Perera, G. I. Godahewa, S. Lee, M.-J. Kim, J. Y. Hwang, M. G. Kwon, S. D. Hwang and J. Lee, Fish Shellfish Immunol., 2017, 68, 435 CrossRef CAS PubMed; (b) S. Miriyala, I. Spasojevic, A. Tovmasyan, D. Salvemini, Z. Vujaskovic, D. S. Clair and I. Batinic-Haberle, Biochim. Biophys. Acta., 2012, 1822, 794 CrossRef CAS PubMed; (c) L. M. Siemankowski, J. Morreale and M. M. Briehl, Free Radical Biol. Med., 1999, 26, 919 CrossRef CAS PubMed.
- (a) C. B. Ambrosome, J. L. Freudenheim, P. A. Thompson, J. E. Vena, J. R. Marshall, S. Graham, R. Laughlin, T. Nemoto and P. G. Shields, Cancer Res., 1999, 59, 602 Search PubMed; (b) V. L. Kinnula, Y. Soini, K. Kvist-Mäkelä, E.-R. Savolainen and P. Koistinen, Antioxid. Redox Signaling, 2004, 4, 27 CrossRef PubMed; (c) H.-F. Huang, F. Guo, Y.-Z. Cao, W. Shi and Q. Xia, CNS Neurosci. Ther., 2012, 18, 811 CrossRef CAS PubMed; (d) G. Pani and T. Galeotti, Antioxid. Redox Signaling, 2011, 15, 1715 CrossRef CAS PubMed; (e) K. J. Horning, S. W. Caito, K. G. Tipps, A. B. Bowman and M. Aschner, Ann. Rev. Nutr., 2015, 35, 71 CrossRef CAS PubMed.
- J. L. Aschner and M. Aschner, Mol. Aspects Med., 2005, 26, 353 CrossRef CAS PubMed.
- (a) R. Rognstad, J. Biol. Chem., 1981, 256, 1608 CrossRef CAS PubMed; (b) D. L. Baly, C. L. Keen and L. S. Hurley, J. Nutr., 1985, 115, 872 CrossRef CAS PubMed.
- (a) M. Sidoryk-Wegrzynowicz and M. Aschner, J. Int. Med., 2013, 273, 466 CrossRef CAS PubMed; (b) V. A. Fitsanakis, C. Au, K. M. Erikson and M. Aschner, Neurochem. Int., 2006, 48, 426 CrossRef CAS PubMed; (c) K. Tuschl, P. B. Mills and P. T. Clayton, Int. Rev. Neurobiol., 2013, 110, 277 CrossRef CAS PubMed.
- (a) S. Mukhopadhyay, S. K. Mandal, S. Bhaduri and W. H. Armstrong, Chem. Rev., 2004, 104, 3981 CrossRef CAS PubMed; (b) S. B. Schmidt, P. E. Jensen and S. Husted, Trends Plant Sci., 2016, 21, 622 CrossRef CAS PubMed; (c) H. Dau and M. Haumann, Coord. Chem. Rev., 2008, 252, 273 CrossRef CAS.
- (a) R. M. Gomila and A. Frontera, Molecules, 2022, 27, 6597 CrossRef CAS PubMed; (b) S. Burguera, R. M. Gomila, A. Bauzá and A. Frontera, Crystals, 2023, 13, 187 CrossRef CAS; (c) Y. Xu, M. Calabrese, N. Demitri, A. Pizzi, T. Nag, I. Hung, Z. Gan, G. Resnati and D. L. Bryce, Chem. Commun., 2023, 59, 12609 RSC.
- A. Daolio, A. Pizzi, G. Terraneo, A. Frontera and G. Resnati, ChemPhysChem, 2021, 22, 2281 CrossRef CAS PubMed.
- H. M. Berman, J. Westbrook, Z. Feng, G. Gilliland, T. N. Bhat, H. Weissig, I. N. Shindyalov and P. E. Bourne, Nucleic Acids Res., 2000, 28, 235 CrossRef CAS PubMed.
- C. Adamo and V. Barone, J. Chem. Phys., 1999, 110, 6158 CrossRef CAS.
- M. Ernzerhof and G. E. Scuseria, J. Chem. Phys., 1999, 110, 5029 CrossRef CAS.
- S. Grimme, J. Antony, S. Ehrlich and H. Krieg, J. Chem. Phys., 2010, 132, 154104 CrossRef PubMed.
- A. Schäfer, H. Horn and R. Ahlrichs, J. Chem. Phys., 1992, 97, 2571 CrossRef.
- S. G. Balasubramani, G. P. Chen, S. Coriani, M. Diedenhofen, M. S. Frank, Y. J. Franzke, F. Furche, R. Grotjahn, M. E. Harding, C. Hattig, A. Hellweg, B. Helmich-Paris, C. Holzer, U. Huniar, M. Kaupp, A. M. Khah, S. K. Khani, T. Müller, F. Mack, B. D. Nguyen, S. M. Parker, E. Perlt, D. Rappoport, K. Reiter, S. Roy, M. Rückert, G. Schmitz, M. Sierka, E. Tapavicza, D. P. Tew, C. van Wüllen, V. K. Voora, F. Weigend, A. Wodynski and J. M. Yu, J. Chem. Phys., 2020, 152, 184107 CrossRef CAS PubMed.
- S. F. Boys and F. Bernardi, Mol. Phys., 1970, 19, 553 CrossRef CAS.
- M. J. Frisch, G. W. Trucks, H. B. Schlegel, G. E. Scuseria, M. A. Robb, J. R. Cheeseman, G. Scalmani, V. Barone, G. A. Petersson, H. Nakatsuji, X. Li, M. Caricato, A. V. Marenich, J. Bloino, B. G. Janesko, R. Gomperts, B. Mennucci, H. P. Hratchian, J. V. Ortiz, A. F. Izmaylov, J. L. Sonnenberg, D. Williams-Young, F. Ding, F. Lipparini, F. Egidi, J. Goings, B. Peng, A. Petrone, T. Henderson, D. Ranasinghe, V. G. Zakrzewski, J. Gao, N. Rega, G. Zheng, W. Liang, M. Hada, M. Ehara, K. Toyota, R. Fukuda, J. Hasegawa, M. Ishida, T. Nakajima, Y. Honda, O. Kitao, H. Nakai, T. Vreven, K. Throssell, J. A. Montgomery Jr, J. E. Peralta, F. Ogliaro, M. J. Bearpark, J. J. Heyd, E. N. Brothers, K. N. Kudin, V. N. Staroverov, T. A. Keith, R. Kobayashi, J. Normand, K. Raghavachari, A. P. Rendell, J. C. Burant, S. S. Iyengar, J. Tomasi, M. Cossi, J. M. Millam, M. Klene, C. Adamo, R. Cammi, J. W. Ochterski, R. L. Martin, K. Morokuma, O. Farkas, J. B. Foresman and D. J. Fox, Gaussian 16, Revision C.01, Gaussian, Inc., Wallingford CT, 2016 Search PubMed.
- R. Dennington, T. A. Keith and J. M. Millam, GaussView, Version 6, Semichem Inc., Shawnee Mission, KS, USA, 2016 Search PubMed.
- T. A. Keith, AIMAll (Version 19.10.12), TK Gristmill Software, Overland Park KS, USA, 2019 Search PubMed.
- E. D. Glendening, J. K. Badenhoop, A. E. Reed, J. E. Carpenter, J. A. Bohmann, C. M. Morales, P. Karafiloglou, C. R. Landis and F. Weinhold, NBO 7.0, Theoretical Chemistry Institute, University of Wisconsin, Madison, 2018 Search PubMed.
- J. Contreras-García, E. R. Johnson, S. Keinan, R. Chaudret, J.-P. Piquemal, D. N. Beratan and W. Yang, J. Chem. Theory Comput., 2011, 7, 625 CrossRef PubMed.
- W. Humphrey, A. Dalke and K. Schulten, J. Mol. Graphics, 1996, 14, 33 CrossRef CAS PubMed.
- K. L. Fillgrove, S. Pakhomova, M. R. Schaab, M. E. Newcomer and R. N. Armstrong, Biochemistry, 2007, 46, 8110 CrossRef CAS PubMed.
- S. Xiang and L. Tong, Nat. Struct. Mol. Biol., 2008, 15, 295 CrossRef CAS PubMed.
- D. Roeland Boer, J. A. Ruíz-Masó, J. R. López-Blanco, A. G. Blanco, M. Vives-Llàcer, P. Chacón, I. Usón, F. X. Gomis-Rüth, M. Espinosa, O. Llorca, G. del Solar and M. Coll, EMBO J., 2009, 28, 1666 CrossRef PubMed.
- M. N. Piña, A. Frontera and A. Bauzá, J. Phys. Chem. Lett., 2020, 11, 8259 CrossRef PubMed.
Footnote |
| † Electronic supplementary information (ESI) available: Table S1 and cartesian coordinates of the PDB models regarding 2P7P, 3BG5 and 3DKY structures. See DOI: https://doi.org/10.1039/d4cp01701c |
| This journal is © the Owner Societies 2024 |