
 Open Access Article
 This Open Access Article is licensed under a
 Creative Commons Attribution 3.0 Unported Licence
Amorphous-like thermal conductivity and high mechanical stability of cyclopentane clathrate hydrate
Ove
Andersson
 *a,
Md
Saiduzzaman
a,
Paulo H. B.
Brant Carvalho
b and
Ulrich
Häussermann
c
*a,
Md
Saiduzzaman
a,
Paulo H. B.
Brant Carvalho
b and
Ulrich
Häussermann
c
aDepartment of Physics, Umeå University, 901 87 Umeå, Sweden. E-mail: ove.b.andersson@umu.se
bDepartment of Chemistry – Ångström Laboratory, Uppsala University, 751 21 Uppsala, Sweden
cDepartment of Materials and Environmental Chemistry, Stockholm University, 106 91 Stockholm, Sweden
First published on 16th May 2024
Abstract
The thermal conductivity κ of cyclopentane clathrate hydrate (CP CH) of type II was measured at temperatures down to 100 K and at pressures up to 1.3 GPa. The results show that CP CH displays amorphous-like κ characteristic of many crystalline clathrate hydrates, e.g., tetrahydrofuran (THF) CH. The magnitude of κ is 0.47 W m−1 K−1 near the melting point of 280 K at atmospheric pressure, and it is almost independent of pressure and temperature T: ln![[thin space (1/6-em)]](https://www.rsc.org/images/entities/char_2009.gif) κ = −0.621−40.1/T at atmospheric pressure (in SI-units). This is slightly less than κ of type II CHs of water-miscible solvents such as THF. Intriguingly, unlike other water-rich type II clathrate hydrates of water-miscible molecules M (M·17 H2O), CP CH does not amorphize at pressures up to 1.3 GPa at 130 K and also remains stable up to 0.5 GPa at 240 K. This shows that CP CH is mechanically more stable than the previously studied water-rich type II CHs, and suggests that repulsive forces between CP and the H2O cages increase the mechanical stability of crystalline CP CH. Moreover, we show that κ of an ice-CH mixture, which often arises for CHs that form naturally, is described by the average of the parallel and series heat conduction models to within 5% for ice contents up to 22 wt%. The findings provide a better understanding of the thermal and stability properties of clathrate hydrates for their applications such as gas storage compounds.
κ = −0.621−40.1/T at atmospheric pressure (in SI-units). This is slightly less than κ of type II CHs of water-miscible solvents such as THF. Intriguingly, unlike other water-rich type II clathrate hydrates of water-miscible molecules M (M·17 H2O), CP CH does not amorphize at pressures up to 1.3 GPa at 130 K and also remains stable up to 0.5 GPa at 240 K. This shows that CP CH is mechanically more stable than the previously studied water-rich type II CHs, and suggests that repulsive forces between CP and the H2O cages increase the mechanical stability of crystalline CP CH. Moreover, we show that κ of an ice-CH mixture, which often arises for CHs that form naturally, is described by the average of the parallel and series heat conduction models to within 5% for ice contents up to 22 wt%. The findings provide a better understanding of the thermal and stability properties of clathrate hydrates for their applications such as gas storage compounds.
1. Introduction
Clathrate hydrates (CHs) are inclusion compounds characterized by an ice structure (host) that forms polyhedral cages capable of accommodating atoms and small molecules (guests) with diameters of up to about 9 Å.1–3 Numerous clathrate hydrates have been discovered, including naturally occurring ones, with notable attention given to CO2 and CH4 clathrates. These clathrates have attracted significant interest due to their potential involvement in mitigating (CO2 CH) and accelerating (CH4 CH) global warming. CH4 clathrates are found in substantial quantities within deep-sea sediment and permafrost, which is gradually thawing and releasing CH4, which is a strong greenhouse gas. However, clathrates can also securely store substantial amounts of gases such as the greenhouse gas CO2 and the energy-carrier H2.3,4 The thermal transport properties of clathrates are highly intriguing and may be of technological importance. Despite their crystalline structure, they exhibit amorphous, or glass-like, thermal conductivity, i.e., a low magnitude that shows only weak dependence on temperature, density, and pressure.5 This is a desirable property in thermoelectric materials, but the exact cause of this unusual behavior remains uncertain; it has been attributed to guest–host interactions6 as well as a feature of the large unit cell (Fig. 1).7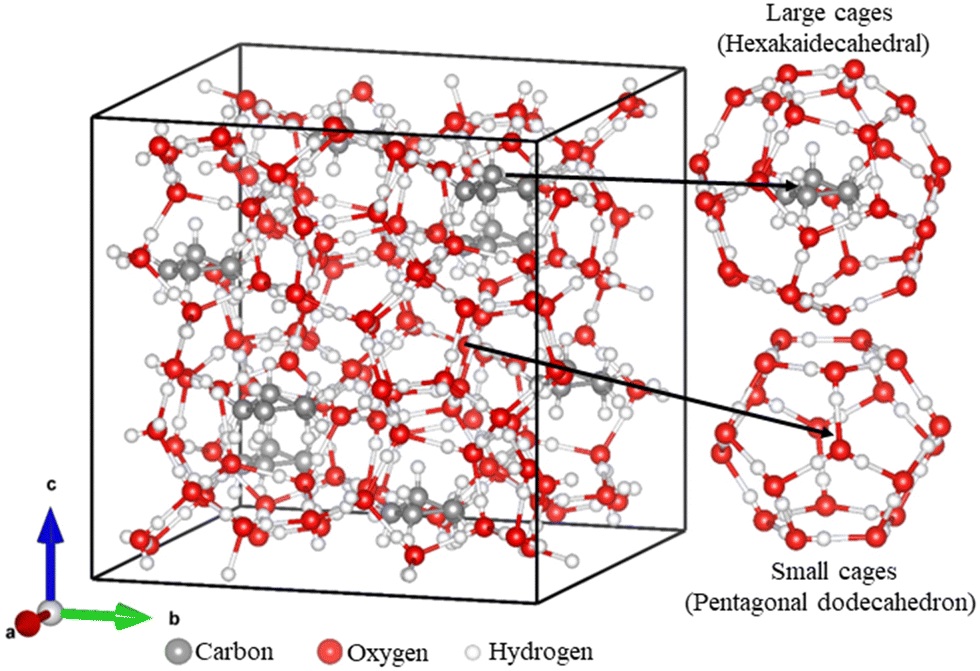 | ||
| Fig. 1 Unit cell of type II clathrate hydrate composed of 136 water molecules that form 16 empty small cages (pentagonal dodecahedron) and 8 large cages (hexakaidecahedral) with CP guests. This gives an ideal composition of CP:H2O of 1:(136/8), i.e., 1:17. The structure was generated with VESTA.20 | ||
The clathrate formation and phase behavior of cyclopentane (CP) clathrate hydrate have been studied both in mixtures and pure state,8–18 and its properties have been studied by calorimetry,19 nuclear magnetic resonance,21–23 infrared,24 Raman25 and dielectric spectroscopy.26 In this study, we have measured the thermal conductivity of CP CH, which has not been investigated before.27,28 This compound is interesting because of the unusual case of an essentially non-polar sizable guest molecule enclosed in cages of water molecules despite being immiscible in water. Previous studies of non-polar molecules or atoms forming CHs have encompassed small molecules such as methane, and the single atom noble gas Xe, which both form type I CHs.29 In contrast, CP forms a water-rich type II CH with ideal composition CP·17 H2O (Fig. 1).1 Consequently, the measurements make it possible to assess the effect of weak guest–host hydrogen bonds, which arise between weakly polar and water-miscible CH formers that also form water-rich type II CHs.30,31 The thermal conductivity of the water-rich (M·17 H2O) type II CHs formed by water-miscible guest molecules M, e.g., tetrahydrofuran, cyclobutanone and 1,3-dioxolane, has been studied in detail;32,33 it decreases by a few percent with increasing size of the guest, increases by 15% on proton-ordering and by 5% on deuteration of the ice host, but in all cases the glass-like behavior remains unchanged. Another interesting issue is the influence of CP on the stability of the type II CH. Upon compression at temperatures below 140 K, water-rich type II clathrates of water-miscible molecules typically collapse mechanically to a dense amorphous state near 1 GPa with almost no dependence on deuteration and guest size.34,35 Moreover, the collapsed state shows very similar transition properties to those of collapsed pure ice, high-density amorphous ice (HDA), which transforms further to, at least, two other amorphous states: very high-density (VHDA) and low-density amorphous ice.36,37 Here we present thermal conductivity results that show that CP CH displays the same amorphous-like thermal conductivity as type II CHs of water-miscible molecules, but no indication of mechanical collapse.
2. Experimental
Ultrapur water (Merck) was mixed with CP (Sigma-Aldrich, analytical standard, 99.5% by gas chromatography or reagent grade, 98.5%) 1:1 by volume using a homogenizer (IKA T18, Ultra Turrax®).22 The mixture was kept in a plastic tube sealed with parafilm, and the tube was immersed in ethanol which had been cooled to ca. −5 °C. The temperature of the water-CP mixture was monitored with a thermocouple inserted in the mixture during homogenization, and it was kept at about 4 °C. The rotational speed of the homogenizer was kept at 8000 rpm until partly freezing. The sample was thereafter quickly transferred to a well-sealed container and kept near 0 °C for 24 h. The excess liquid CP was removed and the sample was stored during 1–2 weeks at 2–6 °C.
The thermal conductivity of two different samples (labeled as #1 and #2) were studied; in sample #2, Ultrapur water was mixed with 1 wt% of tetrahydrofuran (THF, Sigma-Aldrich, ≥99.9%), which is a water-miscible clathrate former, to improve the growth of the clathrate. However, based on the thermal conductivity results, the ice-content in sample #2 was only slightly less than in sample #1. It remains uncertain whether this is due to the small amount of THF or simply because of slight differences in the production procedure. The production procedure was repeated several times, with minor changes in temperature, rotational speed and storage time. This process continued until a sample with low ice content was successfully produced.
Initial evaluation of the samples was made by recording the (natural) heating of ca. 0.5 g of sample in a well thermally isolated plastic test tube with a thermocouple immersed in the sample. The results showed that the best samples melted at (280.2 ± 0.7) K with a small indication of ice in the samples. Moreover, we studied one sample produced by the same procedure as sample #1 by X-Ray powder diffraction (XRD), PANalytical X-ray diffractometer (X'Pert3 Powder), using CuKα radiation with a wavelength (λ) of 1.5418 Å. Before the study, the sample was subjected to slight cryogrinding at liquid nitrogen temperature. Subsequently, it was placed on a glass substrate that was mounted on an aluminium plate cooled by dry ice, which kept the sample temperature at (−5 ± 3) °C. The XRD scan utilized a step size of 0.013° and a scan speed of 0.11° s−1 over a range of 8°≤ 2θ ≤ 50°. Each step was measured for an equivalent duration of 29 s. (A slower scan speed of 0.03° s−1 gave significant amount of hexagonal ice due to freezing of water vapour.) For comparison, samples of THF CH, 1,3-dioxolane (DXL) CH and hexagonal ice were studied. The CHs were produced by mixing Ultrapur water and THF or DXL (Sigma-Aldrich, 99.8%, ∼75 ppm butylated hydroxytoluene as an inhibitor to avoid peroxide formation) in molar concentrations of THF·16.0 H2O and DXL·16.5 H2O, and thereafter freezing the solution. (A THF/DXL:H2O molar concentration of slightly higher than the ideal 1:17 concentration prevents ice in the crystallized sample.) Subsequently, the CHs and hexagonal ice were subjected to identical cryogrinding and XRD analysis as CP CH; the XRD results for CP CH are shown in Fig. 2.
 | ||
| Fig. 2 XRD data recorded at 268 K for CP CH (λ = 1.5418 Å). Le Bail refinement shows that the CH is of type II with a = 17.388(5) Å. Peaks pertaining to hexagonal ice, ice Ih, could not be detected. | ||
The thermal conductivity was measured under pressure using the transient hot-wire method with an inaccuracy of ±2% and an imprecision of 0.2%.38 By applying high-pressure,39 it is possible to determine the thermal conductivity of powder samples. The hot-wire probe was a Ni-wire, 0.1 mm in diameter and ca. 40 mm long, which was inserted in a Teflon® sample cell. Temperature was measured by a calibrated Chromel versus Alumel thermocouple which was positioned close to the hot-wire. The cell was mounted on a bottom piston and inserted in a pressure cylinder of 1.3 GPa capacity. Before filling the cell, the pressure cylinder was cooled to ca. −10 °C by liquid nitrogen (#1) or dry ice (#2) while kept in a glove bag that had been purged several times with dry nitrogen gas. The cell was filled with the sample and sealed with a Teflon® lid; a steel seal with indium coating and a hardened steel top piston were inserted in the cylinder. (After the space near the wire probe had been filled with sample, glass microspheres of 0.2 mm in diameter were used to fill the remaining free space in the cell to reduce the amount of CP CH. Considering the thermal diffusivity of the sample, the wire must be surrounded by about 5 mm of sample to avoid errors due to a limited sample size.) The whole assembly was transferred to a vacuum chamber and clamped to the cold head of a closed He-cycle cryostat. The load was supplied by a fully automated hydraulic press; the pressure inside the cell was determined by measuring the signal from an oil pressure gauge, previously calibrated to an accuracy of 0.05 GPa (at 1 GPa) in a separate experiment. This calibration was achieved by utilizing the pressure-dependent resistance of a manganin wire.
The values for thermal conductivity were obtained from the results of the wire temperature rise during a 1.4 s pulse of about constant power. Throughout the pulse, the resistance of the Ni-wire was measured over time, allowing for determination of the temperature increase. The equation for the temperature rise was fitted to the experimental data points, thereby yielding the thermal conductivity.38,39 At low pressures, the thermal contact between the hotwire probe and the solid sample may become insufficient, potentially affecting the accuracy of the data.
3. Results and discussion
3.1 Sample characterization
To verify that the production of type II CP CH was successful, the XRD diffraction pattern was recorded at (268 ± 3) K both with slow and fast scan speed. Since the sample was open to humid air during preparation and measurements (see Experimental section), condensation during the slow scan speed caused the formation of significant amount of hexagonal ice in addition to any hexagonal ice already present in the sample. However, with the fast scan speed, no ice peaks could be resolved (Fig. 2). Full profile refinements40 were performed in GSAS-II41 with reliability factors Rw = 6.47%, χ2 = 1.84. Background was subtracted in the figure for clarity. The CP CH was fitted with the type II CH structure with a = 17.388(5) Å, which is in good agreement with that of other type II CHs.3 For example, it is only slightly larger than an estimate for THF CH at 273 K, a = 17.326 Å, obtained by extrapolation of data measured below 260 K.42The full width half maximum (FWHM) of XRD peaks is occasionally used to calculate crystal sizes via the Scherrer equation.43 Although small crystal sizes have never been suggested as a reason for the amorphous-like thermal conductivity of CHs, we compared the FWHM of the main XRD peak of CP CH with that of THF CH, DXL CH (see Experimental section) and hexagonal ice (XRD results not shown here) to exclude the possibility that CP CH is an exception. The calculated crystal sizes based on the FWHMs are 31 nm, 39 nm, 79 nm, 52 nm, for CP CH, THF CH, DXL CH and hexagonal ice, respectively. If one assumes that any contributions to peak broadening in addition to crystal size and instrumental parameters affect all samples equally, then the result implies that the microstructure of CP CH does not differ significantly from that of the other CHs. However, we note that the estimated crystal size for ice is unrealistically small, which raises questions about the applicability of the Scherrer equation for calculating the crystal size of the CH in our study.
Consequently, the XRD results show that the sample is a type II CH with an ice content below the detection limit of XRD, which is corroborated by the results for the (natural) heating curve (see inset in Fig. 3). A minimal ice impurity (less than 1 wt%) is in good agreement with the in situ estimates of the ice contents in the samples used for the thermal conductivity measurements, which are described in Section 3.3.
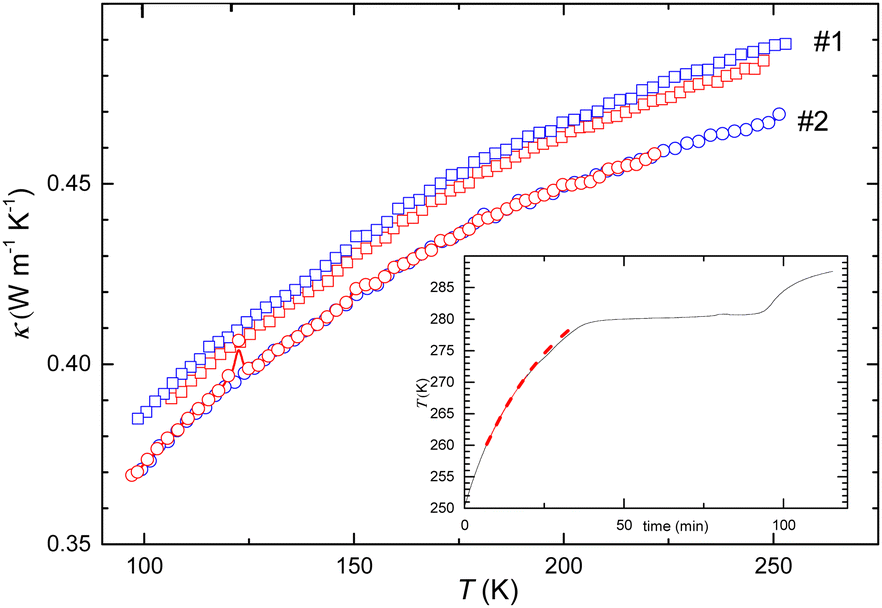 | ||
| Fig. 3 Thermal conductivity of CP CH measured as a function of temperature at 0.1 GPa. Results on heating (red) and cooling (blue) for: (□) sample #1 and (○) sample #2. As indicated by the spline curve between measurement points, the results of sample #2 show a small peak at 123 K on heating, which is due to a transition in (excess) CP. The solid line in the inset shows the (natural) heating curve of ∼0.5 g of sample #1, which was measured using a thermocouple immersed in the sample, before loading in the sample cell. The weak deviation from the red dashed line, which represents a fit of Newton's law of heating between 260 K and 270 K, indicates that a minute amount of ice is present in the sample; the plateau at (280.2 ± 0.7) K shows that a major part of the sample is CP CH. | ||
3.2 Isobaric thermal conductivity
After the sample had been cold loaded, the pressure was gradually increased with intermediate temperature cycles in the 100–255 K range while the thermal conductivity κ was measured. Pressure is applied to ensure a nonporous sample and good thermal contact between the wire probe and sample. This is normally achieved at pressures in the 0.05–0.1 GPa range; insufficient thermal contact is indicated by a significant deviation between the experimental data for the temperature rise of the wire probe and those obtained from the analytical solution in the fitting routine (see Experimental section). In the case of CP CH, 0.07 GPa was sufficient for good thermal contact, and the isobaric results for κ were measured on temperature cycling at 0.1 GPa.Fig. 3 shows the results on temperature cycling. It shows the characteristic behavior of CHs of weakly decreasing κ on cooling. The results for the two samples (see Experimental section) differ about 4%, which is more than the inaccuracy of the method. The difference is confidently attributed to different ice contents in the samples. Because of the immiscibility of CP in water, it is difficult to avoid ice and excess CP in the samples.10,17 However, the effect of excess CP on κ can be estimated from its known phase transitions that occur on cooling, and the ice content and its effect can be estimated from the change in κ caused by the pressure collapse of hexagonal ice, ice Ih. Sample #2 showed indeed signs of excess CP as indicated by a small peak in κ at 123 K measured on heating (Fig. 3). (The peak arises because of the heat of transformation, which reduces the temperature rise of the probe – see Experimental section.) This feature agrees well with the phase III to II transition in CP.44 Phase III has about 1.6 times higher κ than phase II and crystal-like temperature dependence (κ ∝ T−1), whereas κ of the plastic crystalline phase II is almost temperature independent.45 Thus, the unchanged magnitude and temperature dependence in κ below and above the peak, which is caused by the heat of transformation, shows that the effect of excess CP on κ is negligible. The thermal conductivity of sample #1, as indicated in Fig. 3, suggests no excess of CP. However, the higher values of κ imply the presence of ice, which has a higher κ than CHs.
To estimate the ice content, we use results for THF CH mixed with ice. Three THF CH samples with known ice content: 2.6 wt% (THF·17.55 H2O),46 13 wt% (THF·20.1 H2O) and 22 wt% ice (THF·23.0 H2O),47 have been studied before. The results are compiled in Fig. 4 together with results for (ice-free) THF CH, and hexagonal ice.39 Based on these data, we can investigate the possibility to use existing models of two component mixtures to predict the effect of ice on κ. We have evaluated several common models: Maxwell (MA),48 Effective Medium Approximation (EMA), parallel and series conduction (PC and SC),49 the average of parallel and series conduction (ave PC SC), and Lewis-Nielsen (LN) model.50 The equations for these models for κ of mixtures are:
 | (1) |
 | (2) |
 | (3) |
 | (4) |
 | (5) |
 | (6) |
 | (6b) |
 | (6c) |
 | ||
Fig. 4 Thermal conductivity plotted against temperature at 0.05 GPa: (![[hexagon filled, point down]](https://www.rsc.org/images/entities/char_e124.gif) ) hexagonal ice,39 (○) THF CH, (□) THF CH with 22 wt% ice, (△) THF CH with 13 wt% ice;47 ( ) hexagonal ice,39 (○) THF CH, (□) THF CH with 22 wt% ice, (△) THF CH with 13 wt% ice;47 ( ) THF CH with 2.6 wt% ice.46 (In the latter case, we have used the difference from the data for ice-free THF CH measured at 0.1 GPa in the same study, and added this to the data for ice-free THF CH at 0.05 GPa.) The red dashed lines show the average between parallel and series conduction and blue short-dashed lines show the LN-model for all three mixtures. The other tested models with poor agreement are shown only for the case of THF CH with 13 wt% ice: (dash-dotted line) EMA, (solid line) ME, (dotted line) parallel conduction, (short-dotted line) series conduction. ) THF CH with 2.6 wt% ice.46 (In the latter case, we have used the difference from the data for ice-free THF CH measured at 0.1 GPa in the same study, and added this to the data for ice-free THF CH at 0.05 GPa.) The red dashed lines show the average between parallel and series conduction and blue short-dashed lines show the LN-model for all three mixtures. The other tested models with poor agreement are shown only for the case of THF CH with 13 wt% ice: (dash-dotted line) EMA, (solid line) ME, (dotted line) parallel conduction, (short-dotted line) series conduction. | ||
Fig. 4 shows the results of the model calculations. The average between parallel and series conduction κave PC SC (eqn (5)) and the LN-model (eqn (6)) provide relatively good descriptions of κ for the three mixtures. The LN-model provides a slightly better description, but it requires the unknown values for A and ϕm, which here were chosen to get the best agreement. The difference between κave PC SC and the measured data is about 5% or less. Near the melting point of the CHs, the κave PC SC model shows slightly too low values 3–5% (5% for THF CH with 22 wt% ice), and it describes the temperature dependence with only a slight deviation. It describes the data for the CH with low ice content better than the LN-model. The other four models (eqn (1)–(4)) show poor agreement both regarding the magnitude of κ and its temperature dependence. The effect of a small amount of ice on κ is much larger than predicted by the MA and EMA models. The MA-model is derived for the case of dilute spherical inclusions (ice) in a matrix (CH),48 which indicates that the ice inclusions deviate significantly from spherical shape. Another indication of this is the parameter values in the empirical LN-model. The values which provide the best model function are attributed to a case with inclusions of randomly oriented rod-like grains with aspect ratio 15.50 Consequently, the model calculations suggest that the ice exists in the form rod-like inclusions in the CH, with good thermal contact between the ice and the CH.
A scanning electron microscope (SEM) study of methane, carbon dioxide and propane CHs,51 shows that the microstructure is highly dependent on the thermal history. Laboratory-grown samples from rounded ice grains kept under methane gas pressure, and heated to temperatures near or above the ice melting point, ultimately formed relatively pore-free regions of dense hydrate grains, with grain sizes typically several tens of micrometers. However, from this study, it is not possible to determine the shape of any remaining ice inclusions. In another SEM study, a sample mixture of methane CH and ice shows small pools of ice in the CH, but also rims of ice inclusions (see Fig. S3 in ref. 52); the latter are consistent with the effect of ice on κ of CP and THF CHs.
Ice and CHs have a structural relationship, albeit non-matching lattices, which can explain the relatively strong effect on κ of small ice contents. Simulation results indicate that the growth of the clathrate starts on ice grains (heterogeneous nucleation)53,54 but also that ice particles cannot nucleate heterogeneously on CH grains.55,56 Moreover, the results suggest that ice and CH are separated by an amorphous hydrate-like solid53 or an interfacial layer consisting of direct hydrogen bonds between ice and CH regions with a common hexagonal pattern, intermixed with disordered water due to the lattice mismatch.55,56 Although the details of the interface between ice and CH are not established, these simulation results suggest good thermal contact between CP CH and crystalline ice inclusions in agreement with the experimental results for κ.
The average between the parallel and series conduction model (eqn (5)) was applied to the isothermal data for κ of the two CP CH samples (Section 3.3). The results suggest that sample #1 contained ca. 1 wt% ice, which raises κ by about 4%, and that the amount of ice in sample #2 is below statistical significance. Fig. 5 shows the data for CP CH, which have been corrected for the ice content and transformed to atmospheric pressure conditions using the weak pressure dependence of κ. For comparison, we have inserted corresponding results for THF, DXL and cyclobutanone (CB) CHs. In these cases, we have combined our previously measured results with data reported by Ross and Andersson at 0.1 GPa46 and fitted functions of the form: lnκ = A − B/T (Table 1) after transformation to atmospheric pressure conditions. The transformation causes a decrease in κ of only 1.5%.
 | ||
| Fig. 5 Thermal conductivity (fitted functions, see Table 1) plotted as a function of temperature at atmospheric pressure for four clathrate hydrates with: CB, THF, DXL, and CP guests. The inset shows the thermal conductivity plotted as a function of guest diameter at 260 K and 100 K. The dashed lines show the general trend for CHs of water-miscible molecules at 100 K (blue) and 260 K (red). | ||
κ = A−B/T (SI-units) fitted to results for κ of clathrate hydrates at atmospheric pressure conditions. The functions provide descriptions from 100 K up to the melting point of the clathrate with an accuracy of about ± 2%
| Guest | A | B (K) |
|---|---|---|
| THF | −0.567 | 35.5 |
| DXL | −0.564 | 33.1 |
| CB | −0.601 | 41.9 |
| CP | −0.621 | 40.1 |
As shown in the inset of Fig. 5, the results for κ of THF, DXL and CB CHs decrease roughly linearly with increasing size of the guest molecule. The results for CP CH deviate from this correlation, but only by ca. 5%. The behavior for κ(T) of CP CH (with small amount of ice) is the same as that of THF, DXL and CB CHs. As mentioned, the intriguing amorphous-like κ for all CHs, and other inclusion compounds, is not yet fully understood. Theoretical and experimental studies have ascribed it to the large unit cell of CHs,7 and resonance phonon scattering due to rattling guests;6 similar behavior of other clathrates has been attributed to strong Umklapp scattering57 and flat dispersion relations (zero phonon velocity).58
3.3 Isothermal thermal conductivity and mechanical stability of the clathrate
After temperature cycling multiple times at low pressures to determine the temperature behavior, the sample was stabilized at 130 K to study the pressure dependence of κ and the mechanical stability of the clathrate (Fig. 6). At temperatures below ca. 140 K, water-rich type II CHs undergo pressure induced amorphization (PIA) near 1 GPa on isothermal pressurization.35 This is illustrated by previously published data for THF CH shown in Fig. 6a. These data show a weak decrease of κ near 0.9 GPa, which is likely due to an initial distortion of the cages before collapse. Molecular dynamics results suggest that the large, filled, cages start to distort first followed by successive collapse of the small cages.59 On pressurization above 1.05 GPa, κ of THF CH increases relatively abruptly because of the densification by about 14% during the collapse (Fig. 6a). This amorphization process occurs at a pressure slightly above that for ice Ih; THF CH mixed with ice shows a significant decrease in κ, which starts at about 0.8 GPa, due to the onset of ice amorphization (Fig. 6a). On further pressurization, also the clathrate amorphizes. The magnitude of κ for the ice-clathrate mixtures during pressurization up to 0.8 GPa and the subsequent two-step amorphization processes is described well by the average of parallel and series conduction and the LN-model. | ||
Fig. 6 Thermal conductivity measured on isothermal pressurization at 130 K. (a) (solid line) hexagonal ice during amorphization to HDA, (□) THF CH with 22 wt% ice, (△) THF CH with 13 wt% ice,47 and (dash-dotted line) THF CH, the dashed lines show the average of parallel and series conduction (red) and LN-model (blue); (b) ( ) experimental and (dashed lines) model data for sample #1, ( ) experimental and (dashed lines) model data for sample #1, ( ) experimental and (solid line) model data for sample #2. The models suggest ca. 1 wt% ice in sample #1 and significantly less than 1% in sample #2. ) experimental and (solid line) model data for sample #2. The models suggest ca. 1 wt% ice in sample #1 and significantly less than 1% in sample #2. | ||
Surprisingly, the data for CP CH in Fig. 6b show no signs of abrupt densification, which would lead to a significant increase in κ. Instead, κ of sample #1 initially increases at a constant weak rate on pressurization, followed by a weak decrease above 0.8 GPa. A decrease of κ on pressurization is highly unusual. However, this change coincides with the pressure at which ice amorphizes, which shows that the sample contains ice. The observed differences in the rate of change of κ with pressure, dκ/dp, and the higher κ values in sample #1 compared to sample #2 indicate that sample #1 contained a larger quantity of ice in comparison to sample #2. The ice content in the latter, if any, must be small because of the positive dκ/dp in the range above 0.8 GPa.
It is reasonable to assume that the average of parallel and series conduction (eqn (5)) and the LN-model can describe CP CH-ice mixtures equally well as THF CH-ice mixtures. Consequently, we can use the models to describe the change of κ of the sample during amorphization of ice. We do not have values for ice-free CP CH, but it is here assumed to be close to that for sample #2 (0.5% less – see red solid line in Fig. 6b). Since the results for the two samples show only a very small change in the slope of κ(p), the ice content must be small; tests with the two models indicate that the ice content of sample #1 is ca. 1 wt%. With this amount, the model data can emulate the observed change of slope in κ(p). The continued decrease of κ also in the pressure range above that of the collapse for ice Ih suggests that the collapsing ice distorts CP CH and that this distortion increases on further pressurization. Still, this distortion does not proceed to the extent that the sample amorphizes, which would cause a significant density increase and a concurrent increase of κ. The very small change in κ(p) of sample #2 shows that it was ice-free or almost ice-free and that the ice affects κ less than about 1%. A larger effect would give a similar response upon PIA as that observed for sample #1. In the case of sample #2, the leveling off of κ(p) on pressurization can be a combined effect of PIA of small amount of ice and decreasing compressibility. The latter explains the general behavior of a weakly decreasing dκ/dp for most solids and it can partly or fully explain the results for sample #2.
To further explore the state of the sample after pressurization up to 1.3 GPa, sample #2 was heated to 150 K at 1 GPa. This procedure follows that used previously for THF, DXL and CB CHs after PIA.35 The heating procedure of an amorphized CH homogenizes the sample and produces a densified amorphous state – the CH's counterpart to very high-density amorphous ice – concurrently as the sample undergoes a glass transition near 140 K.35,60 However, the results for CP CH in Fig. 7 show no indication of irreversible densification on heating. Instead, the values on cooling are slightly lower than on heating, which indicates that the density decreases on heating. Moreover, there is no sign of the feeble glass transition observed in amorphized DXL and THF CHs. Therefore, these data corroborate that CP CH does not undergo PIA up to 1.3 GPa.
 | ||
Fig. 7 Thermal conductivity measured on heating and subsequent cooling at 1.0 GPa: (○) CP CH, ( ) DXL CH (amorphous), and ( ) DXL CH (amorphous), and ( ) THF CH (amorphous). The arrows indicate the changes in temperature and κ. The vertical arrow indicates the small feature associated with a glass transition in amorphized CHs. ) THF CH (amorphous). The arrows indicate the changes in temperature and κ. The vertical arrow indicates the small feature associated with a glass transition in amorphized CHs. | ||
When amorphous CHs are depressurized at temperatures above ca. 120 K, these expand partly irreversibly and non-elastically into an expanded amorphous state. The process is like that observed for VHDA and the final state is termed expanded HDA. Due to the density decrease, this gradual process is observed as an accelerated decrease in data for κ on depressurization (Fig. 8). However, the results for CP CH display a distinctly different behavior; κ changes much less with pressure and it shows a linear pressure dependence. The results are typical for an elastically expanding crystal. Thus, these data also corroborate that CP CH does not amorphize within the pressure range of this study.
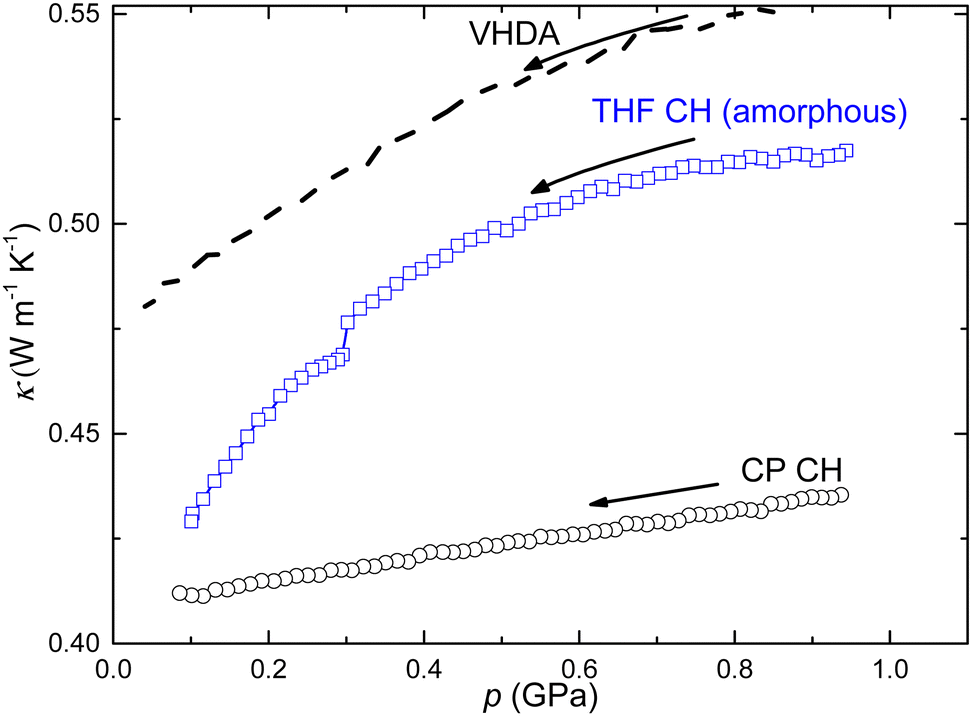 | ||
Fig. 8 Thermal conductivity measured on pressure decrease at 130 K: (○) CP CH, ( ) THF CH (amorphous), and (dashed line) very high density amorphous ice (VHDA, data scaled by a factor of 0.8). ) THF CH (amorphous), and (dashed line) very high density amorphous ice (VHDA, data scaled by a factor of 0.8). | ||
To explore the stability at higher temperatures, CP CH (sample #2) was isothermally pressurized at 240 K. At these temperatures, THF and CB CHs phase separate near 0.3 GPa,32,46 which is observed as an abrupt increase in κ due to the high κ of ice (Fig. 9). The results for CP CH show only a small feature near 0.32 GPa, whereas the phase separation into an ice-CH mixture appears to start above 0.5 GPa. (The small feature near 0.32 GPa might by an effect of the minute content of THF CH, or possibly excess liquid CP transforming to phase I; but the latter seems less likely because, according to the phase diagram,44,45 the transition occurs at about 0.2 GPa at 240 K.) The gradual increase of κ on pressurization above 0.5 GPa is likely due to an increasing content of pure ice, i.e., the sample gradually phase separates more and more upon pressurization. Because of the high κ of pure ice, the values increase with increasing content of ice V and, above 0.6 GPa, ice VI. These data are consistent with a higher stability of CP CH compared to CB and THF CHs.
 | ||
Fig. 9 Thermal conductivity measure as a function of pressure at 240 K: (○) CP CH, ( ) THF CH,46 and (△) CB CH.32 ) THF CH,46 and (△) CB CH.32 | ||
4. Conclusions
The thermal conductivity of CP CH is amorphous-like with a low magnitude which increases only weakly with temperature, pressure and density. The temperature, pressure and density behavior of κ is the same as that for CHs of water-miscible THF, DXL and CB, with only slightly lower magnitude of κ. This shows that the weak hydrogen bond between guest molecules and host lattice of the latter does not strongly affect κ; the results indicate that the weak hydrogen guest–host bonds raise κ by 5%.The results for the pressure dependence of κ show no signs of mechanical instability of the clathrate up to 1.3 GPa at 130 K. This is distinctly different from the behavior of type II CH of THF, DXL and CB, which form weak hydrogen bonds with the ice cages. We surmise that the repulsive force between the H2O host and the CP guest stabilizes the large cages of type II CHs and obstructs cage distortion, which initializes amorphization of type II CHs.59 This raises the amorphization pressure to above 1.3 GPa at 130 K. The results also show that the pressure for phase separation of CP CH into an ice-CH mixture occurs at significantly higher pressure than for the type II CHs of water-miscible THF, DXL and CB.
We find that the average between series and parallel conduction provides a reliable model, accurate within 5%, for estimating κ of ice-THF CH mixtures containing up to 22 wt% ice. This model is applicable in the temperature range from 100 K up to the melting point. Considering the structural similarity between CHs with different guest species, it is plausible that this model can also describe κ of other CH-ice mixtures, and the often-occurring ice mixtures of naturally occurring CHs.
Conflicts of interest
There are no conflicts to declare.Acknowledgements
We acknowledge financial support from Carl Tryggers Stiftelse and Stiftelsen Olle Engkvist Byggmästare (MS).Notes and references
- J. A. Ripmeester and S. Alavi, Clathrate Hydrates: Molecular Science and Characterization, Wiley-VCH GmbH, 2022 Search PubMed.
- D. W. Davidson, in Water, A comprehensive treatise, ed. F. Franks, Plenum Press, New York, 1973, p. 115 Search PubMed.
- E. D. Sloan and C. A. Koh, Clathrate Hydrates of Natural Gases, CNC Press, New York, 3rd edn, 2007 Search PubMed.
- W. L. Mao and H. K. Mao, Proc. Natl. Acad. Sci. U. S. A., 2004, 101, 708–710 CrossRef CAS PubMed.
- R. G. Ross, P. Andersson and G. Bäckström, Nature, 1981, 290, 322–323 CrossRef CAS.
- J. S. Tse and M. A. White, J. Phys. Chem., 1988, 92, 5006–5011 CrossRef CAS.
- M. W. C. Dharma-Wardana, J. Phys. Chem., 1983, 87, 4185–4190 CrossRef CAS.
- L. Cai, B. A. Pethica, P. G. Debenedetti and S. Sundaresan, Chem. Eng. Sci., 2014, 119, 147–157 CrossRef CAS.
- L. Cai, B. A. Pethica, P. G. Debenedetti and S. Sundaresan, Chem. Eng. Sci., 2016, 141, 125–132 CrossRef CAS.
- R. Sakemoto, H. Sakamoto, K. Shiraiwa, R. Ohmura and T. Uchida, Cryst. Growth Des., 2010, 10, 1296–1300 CrossRef CAS.
- H. Sojoudi, M. R. Walsh, K. K. Gleason and G. H. McKinley, Langmuir, 2015, 31, 6186–6196 CrossRef CAS PubMed.
- M. A. Kamel, A. S. Lobasov, S. Narayan, K. S. Pervunin and C. N. Markides, Cryst. Growth Des., 2023, 23, 4273–4284 CrossRef CAS.
- M. Maruyama, S. Nagayama, T. Misawa, S. Takeya and R. Ohmura, J. Chem. Thermodyn., 2023, 179, 106998 CrossRef CAS.
- G. Zylyftari, A. Ahuja and J. F. Morris, Chem. Eng. Sci., 2014, 116, 497–507 CrossRef CAS.
- S. Ho-Van, B. Bouillot, D. Garcia, J. Douzet, A. Cameirao, S. Maghsoodloo-Babakhani and J.-M. Herri, Chem. Eng. Technol., 2019, 42, 1481–1491 CrossRef CAS.
- Y. Zhang, P. G. Debenedetti, R. K. Prud’homme and B. A. Pethica, J. Phys. Chem. B, 2004, 108, 16717–16722 CrossRef CAS.
- X. Li, L. Negadi and A. Firoozabadi, Energy Fuels, 2010, 24, 4937–4943 CrossRef CAS.
- A. H. Mohammadi and D. Richon, Chem. Eng. Sci., 2009, 64, 5319–5322 CrossRef CAS.
- H. Delroisse, F. Plantier, L. Marlin, C. Dicharry, L. Frouté, R. André and J.-P. Torré, J. Chem. Thermodyn., 2018, 125, 136–141 CrossRef CAS.
- K. Momma and F. Izumi, J. Appl. Crystallogr., 2011, 44, 1272–1276 CrossRef CAS.
- D. M. Jacobs, M. D. Zeidler and O. Kanert, J. Phys. Chem. A, 1997, 101, 5241–5249 CrossRef CAS.
- N. N. Nguyen, R. Berger, M. Wagner, J. Thiel, H.-J. Butt and R. Graf, J. Phys. Chem. C, 2021, 125, 15751–15757 CrossRef CAS.
- L. W. Thrane, J. D. Seymour and S. L. Codd, J. Magn. Reson., 2019, 303, 7–16 CrossRef CAS PubMed.
- C. Lo, J. Zhang, P. Somasundaran and J. W. Lee, J. Colloid Interface Sci., 2012, 376, 173–176 CrossRef CAS PubMed.
- H. Li, P. Stanwix, Z. Aman, M. Johns, E. May and L. Wang, J. Phys. Chem. A, 2016, 120, 417–424 CrossRef CAS PubMed.
- H. Nelson, A. Ihrig, R. Kahlaub, P. Kibies, S. M. Kast and R. Böhmer, J. Non-Cryst. Solids, 2015, 407, 431–440 CrossRef CAS.
- S. Sun, L. Gu, Z. Yang, H. Lin and Y. Li, Nat. Gas Ind., 2022, B9, 246–263 Search PubMed.
- J. F. Gabitto and C. Tsouris, J. Thermodyn., 2010, 271291 Search PubMed.
- A. I. Krivchikov, O. A. Korolyuk and O. O. Romantsova, Low Temp. Phys., 2007, 33, 612–616 CrossRef CAS.
- R. D. Stoll and G. M. Bryan, J. Geophys. Res., 1979, 84, 1629–1634 CrossRef CAS.
- Stoll and Bryan (Ref. 30) have measured κ of propane CH, which is also a type II CH. Although their results are qualitatively in agreement with the results for cyclopentane CH, they did not use very high pressures. Consequently, their results pertain to a porous sample, which shows lower κ than a nonporous sample, which obstructs a quantitative comparison with CHs of water miscible molecules.
- P. Andersson and R. G. Ross, J. Phys. C: Solid State Phys., 1983, 16, 1423–1432 CrossRef CAS.
- O. Andersson and H. Suga, Phys. Chem. Solids, 1996, 57, 125–132 CrossRef CAS.
- Y. P. Handa, J. S. Tse, D. D. Klug and E. Whalley, J. Chem. Phys., 1991, 94, 623–627 CrossRef CAS.
- O. Andersson, P. H. B. Brant Carvalho, Y.-J. Hsu and U. Häussermann, J. Chem. Phys., 2019, 151, 014502 CrossRef PubMed.
- O. Mishima, L. D. Calvert and E. Whalley, Nature, 1985, 314, 76–78 CrossRef CAS.
- T. Loerting, C. Salzmann, I. Kohl, E. Mayer and A. Hallbrucker, Phys. Chem. Chem. Phys., 2001, 3, 5355–5359 RSC.
- B. Håkansson, P. Andersson and G. Bäckström, Rev. Sci. Instrum., 1988, 59, 2269–2275 CrossRef.
- O. Andersson and A. Inaba, Phys. Chem. Chem. Phys., 2005, 7, 1441 RSC.
- A. L. Bail, Powder Diffr., 2005, 20, 316–326 CrossRef.
- B. H. Toby and R. B. Von Dreele, J. Appl. Crystallogr., 2013, 46, 544–549 CrossRef CAS.
- J. S. Tse, J. Phys. Colloq., 1987, 48, 543–549 CrossRef.
- A. Patterson, Phys. Rev., 1939, 56, 978–982 CrossRef CAS.
- A. Würflinger, Phys. Chem., 1975, 79, 1195–1201 Search PubMed.
- P. Andersson, Mol. Phys., 1978, 35, 587–591 CrossRef CAS.
- R. G. Ross and P. Andersson, Can. J. Chem., 1982, 60, 881–892 CrossRef CAS.
- O. Andersson and G. P. Johari, J. Chem. Phys., 2009, 131, 114503 CrossRef PubMed.
- J. C. Maxwell, A Treatise on Electricity and Magnetism, Clarendon, Oxford, 1904, vol. 1 Search PubMed.
- J. E. Parrott and A. D. Stuckes, Thermal Conductivity of Solids, Pion, London, 1975 Search PubMed.
- L. E. Nielsen, Ind. Eng. Chem. Fundam., 1974, 13, 17–20 CrossRef CAS.
- L. A. Stern, S. H. Kirby, S. Circone and W. B. Durham, Am. Mineral., 2004, 89, 1162–1175 CrossRef CAS.
- R. Lu, L. A. Stern, W. L. Du Frane, J. C. Pinkston, J. J. Roberts and S. Constable, J. Geophys. Res.: Solid Earth, 2019, 124, 10877–10892 CrossRef CAS.
- P. Pirzadeh and P. G. Kusalik, J. Am. Chem. Soc., 2013, 135, 7278–7287 CrossRef CAS PubMed.
- Z. Zhang and G.-J. Guo, Phys. Chem. Chem. Phys., 2017, 19, 19496 RSC.
- M. H. Factorovich, P. M. Naullage and V. Molinero, J. Chem. Phys., 2019, 151, 114707 CrossRef PubMed.
- A. H. Nguyen, M. A. Koc, T. D. Shepherd and V. Molinero, J. Phys. Chem. C, 2015, 119, 4104–4117 CrossRef CAS.
- M. M. Koza, M. R. Johnson, R. Viennois, H. Mutka, L. Girard and D. Ravot, Nat. Mater., 2008, 7, 805–810 CrossRef CAS PubMed.
- M. Christensen, A. B. Abrahamsen, N. B. Christensen, F. Juranyi, N. H. Andersen, K. Lefmann, J. Andreasson, C. R. H. Bahl and B. B. Iversen, Nat. Mater., 2008, 7, 811–815 CrossRef CAS PubMed.
- P. H. B. Brant Carvalho, A. Mace, C. L. Bull, N. P. Funnell, O. Andersson and U. Häussermann, J. Chem. Phys., 2019, 150, 204506 CrossRef PubMed.
- P. H. B. Brant Carvalho, M. Ivanov, O. Andersson, T. Loerting, M. Bauer, C. A. Tulk, B. Haberl, L. L. Daemen, J. J. Molaison, K. Amann-Winkel, A. P. Lyubartsev, C. L. Bull, N. P. Funnell and U. Häussermann., Phys. Chem. Chem. Phys., 2023, 25, 14981–14991 RSC.
| This journal is © the Owner Societies 2024 |