
 Open Access Article
 This Open Access Article is licensed under a
 Creative Commons Attribution 3.0 Unported Licence
Mechanistic understanding of the thermal-assisted photocatalytic oxidation of methanol-to-formaldehyde with water vapor over Pt/SrTiO3†
Michel
Deitermann
ab,
Takuma
Sato
 b,
Yannik
Haver
a,
Alexander
Schnegg
b,
Martin
Muhler
ab and
Bastian Timo
Mei
*ac
b,
Yannik
Haver
a,
Alexander
Schnegg
b,
Martin
Muhler
ab and
Bastian Timo
Mei
*ac
aLaboratory of Industrial Chemistry, Ruhr University Bochum, 44780 Bochum, Germany. E-mail: Bastian.Mei@ruhr-uni-bochum.de
bMax Planck Institute for Chemical Energy Conversion, 45470 Mülheim an der Ruhr, Germany
cPhotocatalytic Synthesis Group, Faculty of Science & Technology of the University of Twente, PO Box 217, Enschede, The Netherlands
First published on 3rd May 2024
Abstract
Anaerobic thermal-assisted photocatalytic methanol conversion in the gas phase in the presence of water vapor has been suggested as an interesting way to generate formaldehyde as a valuable coupled product in addition to H2 production. Here, the reaction mechanism and photocatalyst deactivation are investigated in detail using in situ diffuse reflectance infrared fourier transform (DRIFTS) and electron paramagnetic resonance (EPR) spectroscopy. EPR shows that paramagnetic oxygen vacancies are not involved in the reaction mechanism over undoped SrTiO3. Instead, on an optimized 0.1 wt% Pt/SrTiO3 photocatalyst, methoxy species are formed by dissociative adsorption of methanol leading to formaldehyde formation while the formation of CO, CO2 (via a formate intermediate) and methyl formate occurs through three concurrent reactions from formyl species. Our findings suggest that CO adsorbed on Pt is a spectator species not perturbing the reaction kinetics, and deactivation is shown to be strongly correlated with the accumulation of formate groups on SrTiO3, which is more pronounced at high reaction temperatures. The mechanistic understanding provided here forms the basis for the further optimization of photocatalysts to increase methanol conversion and improve formaldehyde selectivity.
Introduction
Photocatalytic conversion of small alcohols is conceived as a means to release chemically stored H2 in a sustainable manner. Thus, photocatalytic methanol oxidation over metal oxide-based photocatalysts in both liquid1,2 and gas phase3–6 has been extensively studied with a strong emphasis on material design to improve H2 evolution rates.1–6 Despite the possibility of co-creation of value-added alcohol oxidation products, there has been little emphasis on the precise distribution and selective formation of valuable oxidation products.Recently, it was shown that performing methanol oxidation in the gas phase allows for modulation of the product distribution. For example, in the presence of O2, oxidation of methanol to formic acid and CO2 is favored,7,8 but the reduction of O2 is competing with the reduction of protons (H+) to H2.7,8 Using anaerobic reaction conditions with water as oxidant, photocatalytic conversion of methanol in the gas phase over Pt/SrTiO3 (Pt/STO) leads to the formation of valuable chemicals like formaldehyde or methyl formate in a distinctive temperature window <120 °C.9 Operation at temperatures above 120 °C resulted in a higher selectivity to CO at the expense of formaldehyde and methyl formate selectivity, and the photocatalyst was shown to suffer from severe deactivation with time on stream.9 Moreover, methanol conversion was found to be dependent on the Pt loading and 0.1 wt% of Pt deposited by reductive photodeposition resulted in the highest conversion of methanol.
Photocatalyst deactivation in photocatalytic methanol oxidation has been less of a concern in relevant mechanistic studies,10–16 and the long-term stability (hours–days) of photocatalysts at relevant reaction conditions like elevated temperatures has been barely addressed. If at all, catalyst deactivation is primarily explained by the accumulation of reaction intermediates.17,18 For example, formation of CO in photocatalytic methanol oxidation is frequently reported as side product, but the effects on the catalytic performance remain under debate.16,19–21 Based on temperature-programmed desorption (TPD) experiments, a high coverage of CO on Pt was reported by Walenta et al.19 using Pt/TiO2(110) catalysts. CO was suggested to be a spectator, thus not inhibiting the H2 formation rate. In contrast, Chiarello et al.16 reported the irreversible adsorption of CO on Pt nanoparticles (NPs) (>2 nm) during methanol reforming with water vapor causing catalyst poisoning.
Others20,21 argued that CO poisoning of the Pt sites is only problematic under dark conditions, as CO is constantly removed during illumination. Additionally, the water gas shift reaction (WGSR) was proposed to efficiently remove CO from the catalyst and lower the CO selectivity, which has been observed particularly for Cu-containing photocatalysts used at higher reaction temperatures.22
Similarly, evidence for the presence of formate on the photocatalyst surface has already been provided with the extent of formate group formation and consumption being dependent on the external reaction conditions like temperature or methanol partial pressure in the reactive gas mixture.4,11,13 Yet formate groups are mainly considered to be the intermediate species in CO2 and methyl formate formation, which are slow reaction steps compared with the formation of formate groups.11,13,14 Consequently, the accumulation of this species was observed but, so far, treated as reaction intermediate only.16 The influence of formate on catalyst deactivation by blocking of active sites was not further investigated. Matsubu et al.23 did even report a positive effect of strongly bound HCOx species as they limited the degree of the encapsulation of Rh particles by reducible supports and enabled the dynamic tuning of the selectivity during the thermally catalyzed CO2 reduction.
Besides poisoning by surface species, deactivation in heterogenous catalysis is often related to changes in the surface and bulk structure of the catalyst.24 In photocatalysis, however, formation of defects, like oxygen vacancies (OVs), in the crystal structure is usually considered to enhance visible light absorption or enhance reactant adsorption, in turn enhancing their activity.25,26 For reducible oxides like TiO2 and SrTiO3 (STO), defects have been engineered using reducing agents like H2,25 solid carbon,26 NaBH427 or plasma treatments.28 Haselmann et al.,17 however, also indicated that early-stage deactivation of Pt/–TiO2 photocatalysts in aqueous methanol reforming strongly correlates with the presence of OVs induced by either ultrasonic pretreatment or in situ UV illumination. Moreover, encapsulation of the Pt NPs was observed that might also result in photocatalyst deactivation.29,30 Thus, the role of defects in the deactivation of photocatalyst is yet to be explored in detail.
Considering the lack of a consistent description of the reaction mechanism of thermal-assisted photocatalytic (selective) methanol oxidation and photocatalyst deactivation, this work explores the reaction and deactivation mechanism of gas-phase methanol oxidation in the presence of water vapor using diffuse reflectance infrared Fourier transform spectroscopy (DRIFTS) over Pt/STO photocatalysts with a loading of 0.1 wt% Pt. In situ DRIFTS performed under illumination and at elevated reaction temperatures (100–200 °C) suggest that formate formation is strongly correlated with catalyst deactivation. Thus, it should be considered as inhibitor rather than spectator which is also supported by transient pulse measurements. Additionally, detailed electron paramagnetic resonance (EPR) measurements were performed and critically discussed with literature evidencing the minor role of defects, like OVs, in the reaction mechanism and particular catalyst deactivation over undoped STO.
Experimental
Photocatalyst synthesis
The photocatalyst was prepared by photodeposition (PD) of Pt using commercial STO (Sigma Aldrich, 99%). PD was carried out in a continuously stirred double-walled liquid-phase reactor equipped with a Hg lamp (500 W, 59 mW cm−2, UV Consulting Peschl) described in detail elsewhere.31 The PD of 0.1 wt% Pt was performed using a suspension of 2 g STO in 500 mL water (HPLC grade) and 50 mL methanol (VWR Chemicals, 100%) containing H2PtCl6 (Sigma Aldrich 99.995%) in the respective amount.9 During illumination (1 h), the temperature of the reactor walls was maintained at 30 °C while the immersion Hg lamp was cooled to 10 °C. The 0.1Pt/STO photocatalyst was obtained after filtration, washing (HPLC grade water, >500 mL) and freeze-drying (−50 °C for 24 h).Gas-phase photocatalytic measurements and pulse experiments
All gas-phase photocatalytic tests were performed with the set-up described elsewhere.9 The measurement procedure is described in detail in the ESI.† Long-term experiments under quasi steady-state conditions were performed by continuous dosing of methanol and/or water. Furthermore, the set-up allows for N2 (99.999%, air liquide), CO2 (99.995%, air liquide), CO (4% in N2, 99.999%, air liquide), and O2 (99.999%, air liquide) pulsing during activity testing using an integrated pulse loop (∼7 mL pulse volume). The standard reaction conditions used for pulse experiments, mechanistic studies and general understanding of photocatalyst deactivation are summarized in Table 1.| Reaction condition | Value |
|---|---|
| Reactor temperature T / °C | 100 |
| UV light intensity I / mW cm−2 | 52.9 |
Total volumetric gas flow ![[V with combining dot above]](https://www.rsc.org/images/entities/i_char_0056_0307.gif) total / mL min−1 total / mL min−1 |
50 |
| Methanol mole fraction yMeOH / % | 1.5 |
| Water mole fraction yH2O / % | 4.5 |
EPR measurements
X-band EPR spectra were collected using an MS-5000 (Magnettech GmbH, Freiberg Instruments) operated at either 100 K or RT. The STO (Sigma Aldrich) or 0.1Pt/STO sample (∼10 mg each) was placed in a 3.8 mm EPR tube. In selected measurements 50 μL of dry methanol (VWR Chemicals, 100%) was added. Illumination of the samples was carried out with a Hg UV lamp (Oriel instruments, 200 W, 280–400 nm) at RT and subsequent fast cooling in LN2 to avoid the possibility of defect passivation until the measurement was started. If not stated otherwise, the spectra were recorded at a microwave frequency of ∼9.64 GHz, in a magnetic field (B0) of 337 mT with a sweep range of ±30 mT, field modulation of 0.55 mT, microwave power of 0.2 mW (27 dB attenuation), and a field modulation frequency of 100 kHz averaging 9 scans to increase the signal-to-noise ratio. The EPR spectra were simulated using the MATLAB (2021) package EasySpin.32 Reduction of 0.1Pt/STO was performed in an EPR tube connected to a Schlenk line for 2.5 h at 150 °C in flowing H2 (100%). Additionally, the reduction of STO (250 mg) was carried out at 750 °C in flowing 2% H2/N2 (20 mL min−1) for 12 h in a tubular furnace to achieve the formation of OVs similar to a procedure described in literature.25 The sample was obtained as fine powder with grey color which was maintained after storage at RT for >2 days.DRIFTS measurements
DRIFTS measurements were performed using a high temperature reaction chamber (HTRC). The spectrometer and the HTRC were purged with He (10 mL min−1) for at least 30 min before the measurements. The actual measurement sequence included heating of the samples to 200 °C to efficiently remove surface adsorbed water and subsequent cooling of the photocatalyst in flowing He to the desired adsorption or reaction temperature. Afterwards, adsorption experiments of water and/or methanol on the 0.1Pt/STO surface in the dark were performed by allowing He to pass through a saturator containing water, methanol, or a water/methanol mixture. The photocatalyst was allowed to equilibrate with the respective gas phase for at least 30 min. Subsequently, pure He was used for purging the cell to efficiently remove weakly bound species. The difference spectra were obtained using background spectra obtained at the respective temperature in He only. Constant flow experiments using methanol/water mixtures were performed in the dark and under illumination (UV LEDs). Here, background subtraction was performed using a spectrum obtained after 1.5 h of constant purging in the dark with a saturated methanol/water in He mixture. Independent of the measurement procedure, a good signal-to-noise ratio was obtained by averaging 64 scans (3 min per spectrum). A more detailed description of the set-up and settings of the FTIR spectrometer used for DRIFTS experiments can be found in the ESI.†Results and discussion
Photocatalytic methanol oxidation in the gas phase
STO-based photocatalysts are widely employed in various (photocatalytic) reactions.33–36 Here, the thermal-assisted methanol oxidation in the gas phase has been performed using 0.1Pt/STO that was previously shown to be most active in methanol conversion and highly selective for formaldehyde formation.9 Extensive material characterization using N2 physisorption measurements (BET method), X-ray diffraction (XRD), UV–Vis diffuse reflectance spectroscopy (UV–Vis DRS), inductively coupled plasma optical emission spectroscopy (ICP-OES), high resolution transmission electron microscopy (HR-TEM), and energy-dispersive X-ray spectroscopy (EDX) confirmed the phase purity of STO and successful deposition of Pt NPs. X-ray photoelectron spectroscopy (XPS) measurements revealed that the Pt NPs are mainly in the Pt0 state (see ESI†).The time-resolved evolution rates of relevant methanol oxidation products obtained with 0.1Pt/STO in the thermal-assisted photocatalytic methanol oxidation (100–175 °C, UV LED illumination) are summarized in Fig. 1 using freshly coated catalyst plates for each reaction temperature. Each measurement was performed after pretreatment in humid N2 to remove organic residues that might originate from previous preparation steps (Fig. S8, ESI†). Clearly, with time-on-stream (TOS) deactivation is observed, which appears to be most pronounced for temperatures >100 °C. With increasing temperature, formaldehyde selectivity is compromised at the expanse of CO/CO2 formation and above a reaction temperature of 150 °C the evolution rate of formaldehyde after 6 h on stream is clearly inferior to the corresponding stable rate obtained at 100 °C. A similar trend, though with a more significant decrease in initial evolution rate, is also observed for methyl formate, while overall for CO and CO2 a consistent increase in their respective evolution rates is revealed. Independent of the reaction temperatures deactivation of the photocatalyst resulted in a decrease in methanol conversion leading to a similar conversion after 6 h on stream (see Fig. S9, ESI†).
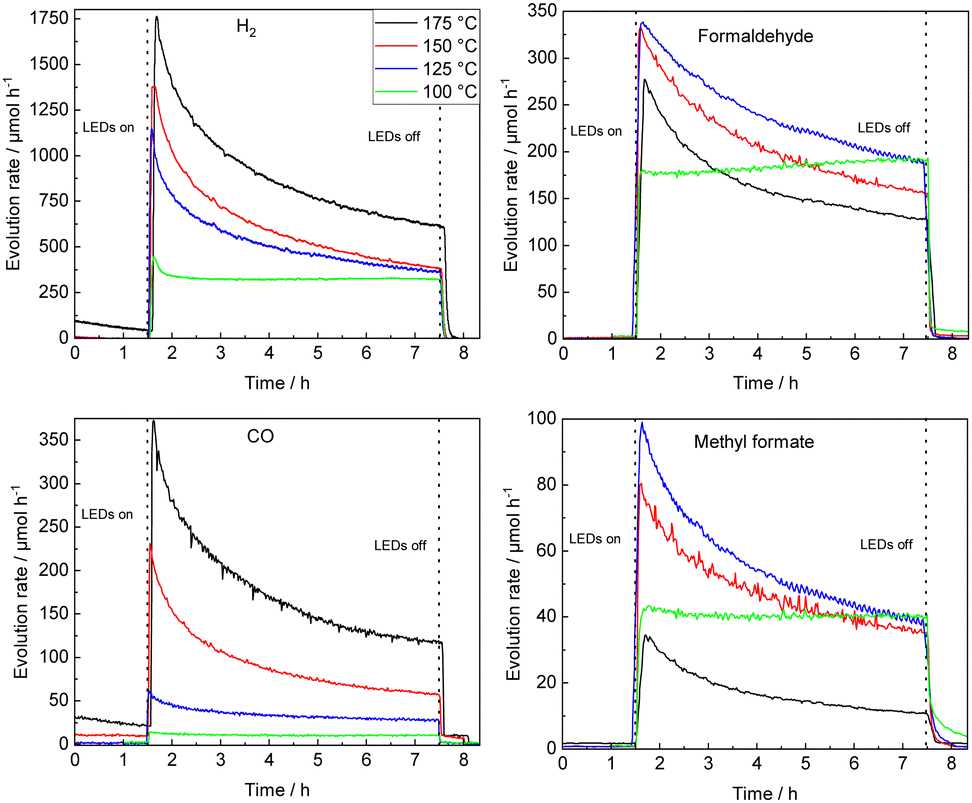 | ||
| Fig. 1 Temperature variation from 100 °C to 175 °C (single catalyst plates); temporal course of evolution rates of H2, formaldehyde, CO and methyl formate during UV illumination using a 0.1Pt/STO coated glass substrate in a flat-plate reactor. Smoothing (moving average over 10 data points, 8.5 min) was applied to the formaldehyde and methyl formate evolution rates at 125 °C and 175 °C. The methanol conversion XMeOH and CO2 evolution rates can be found in Fig. S9 (ESI†). | ||
Considering the negligible deactivation observed at 100 °C, a long-term experiment was performed (49 h of continuous illumination, see Fig. S10, ESI†). A low activity due to thermal methanol reforming (MR) (eqn (1)) is observed prior to illumination, while an immediate increase in formaldehyde and methyl formate is detected once the photocatalyst is illuminated.4,9
| CH3OH + H2O → 3H2 + CO2 | (1) |
Two temperature regimes are defined allowing to study the reaction mechanism and photocatalyst deactivation: at ≤100 °C a quasi-stable methanol conversion (negligible deactivation) and selective formaldehyde formation allows for evaluation of the reaction mechanism; ≥100 °C total oxidation of methanol is preferred and photocatalyst deactivation can be accessed.
EPR spectroscopy
To monitor the role of paramagnetic defects and trap states in the photoinduced charge transfer processes, EPR spectra were recorded on pristine STO, after reduction at 750 °C and on illuminated STO and Pt/STO in the presence and absence of MeOH (see Fig. S2 and the ESI,† for further details and simulations carried out to deconvolute the spectra). The 100 K EPR spectrum of STO (Fig. 2a) is dominated by an EPR line with nearly axial g-tensor (g1 = 2.0021, g2 = 2.0085 and g3 = 2.0910), which is assigned to O2− adsorbed on the STO surface.37–39 In addition, an isotropic signal from Ti3+ (giso = 1.978) in the STO lattice is observed.40 STO and Pt/STO samples exhibit the same EPR spectra (see Fig. S12, ESI†). Reduction of the sample at 750 °C (Fig. 2b), drastically alters the EPR spectrum. The O2− signal strongly reduces in intensity, while an intense isotropic EPR line centered at giso = 2.0039, appears. This signal has recently been ascribed to Ti3+/OV defects in STO annealed in H2 at 500 °C.41 In addition, the isotropic Ti3+ signal at giso = 1.9784 gains in intensity and an additional broad signal (g⊥ = 1.95 and g‖ = 1.93, line width of ∼50–95 mT) contributes to the EPR spectrum. The latter originates from Ti3+-sites in disordered STO phases, where pronounced site-to-site disorder leads to a broad distribution of g-values (g-strain).40,42,43 Furthermore a six line spectrum with a hyperfine splitting of 237 MHz is observed, which matches very well with reported values for Mn2+ (S = 5/2, I = 5/2) substituting Ti4+ sites.44 UV light exposure in the absence of MeOH only led to minimal changes of the EPR spectrum (see Fig. S12, ESI†). However, UV irradiation in the presence of MeOH significantly altered the EPR spectra of both STO (Fig. 2c) and Pt/STO (Fig. 2d). In STO in presence of methanol, UV irradiation led to the disappearance of the O2− signal, which does not reappear after switching off the light and exposure of the sample to air. The most significant change is a reversible increase of the Ti3+ defects in disordered STO phases (broad EPR signal g⊥ = 1.95 and g‖ = 1.93). After switching off the light source, the broad Ti3+ signal disappears. The metastable Ti3+ is assigned to the reduction of Ti4+ sites in the disordered surface areas of the STO by light generated electrons.40 Reduction by photoelectrons requires the presence of MeOH as a hole scavenger to avoid direct recombination of electrons and holes and is thus directly related to photocatalysis. This assignment is further supported by the spectral changes observed for the Pt/STO samples. While the Pt/STO spectrum after illumination and in the presence of MeOH also exhibits a strong decrease of the O2− signal, no surface Ti3+ states are formed. The absence of the metastable Ti3+ may be rationalized by the fact that in Pt/STO photogenerated electrons are trapped at the Pt–STO interface. Thus, EPR confirms the role of methanol as hole scavenger and Pt as electron trap. However, no evidence for localized paramagnetic OVs in the reaction or photocatalyst deactivation is obtained. OVs in the crystal lattice (bulk or surface) of STO were supposed to strongly influence photocatalytic activity in various reactions.25–28,34,35 A high number of surface OVs is considered beneficial by introducing specific adsorption sites for reactants or by changing the light absorption properties. Typically, these crystal defects cannot be induced under mild conditions as applied in this work requiring high temperature treatments (>400 °C) and strong reducing agents. Additionally, surface OVs are expected to readily re-oxidize in the presence of water.23 Nevertheless, it was reported that Pt NPs can activate hydrogen which can induce OV formation in STO even at much lower temperatures (∼150 °C).25 Depending on the Fermi energy, defects can take different charged or neutral states. In STO, paramagnetic OV (V1+O) are only predominant in a relatively narrow window of the Fermi energy around 2.5 eV, while diamagnetic states (V0O and V2+O) are predominant over most of the Fermi energy region.9 The absence of a clearly observable OV-EPR signal in STO and Pt/STO before and after MeOH oxidation studied herein, could therefore either be due to a very low OV abundance or due to OVs in diamagnetic states.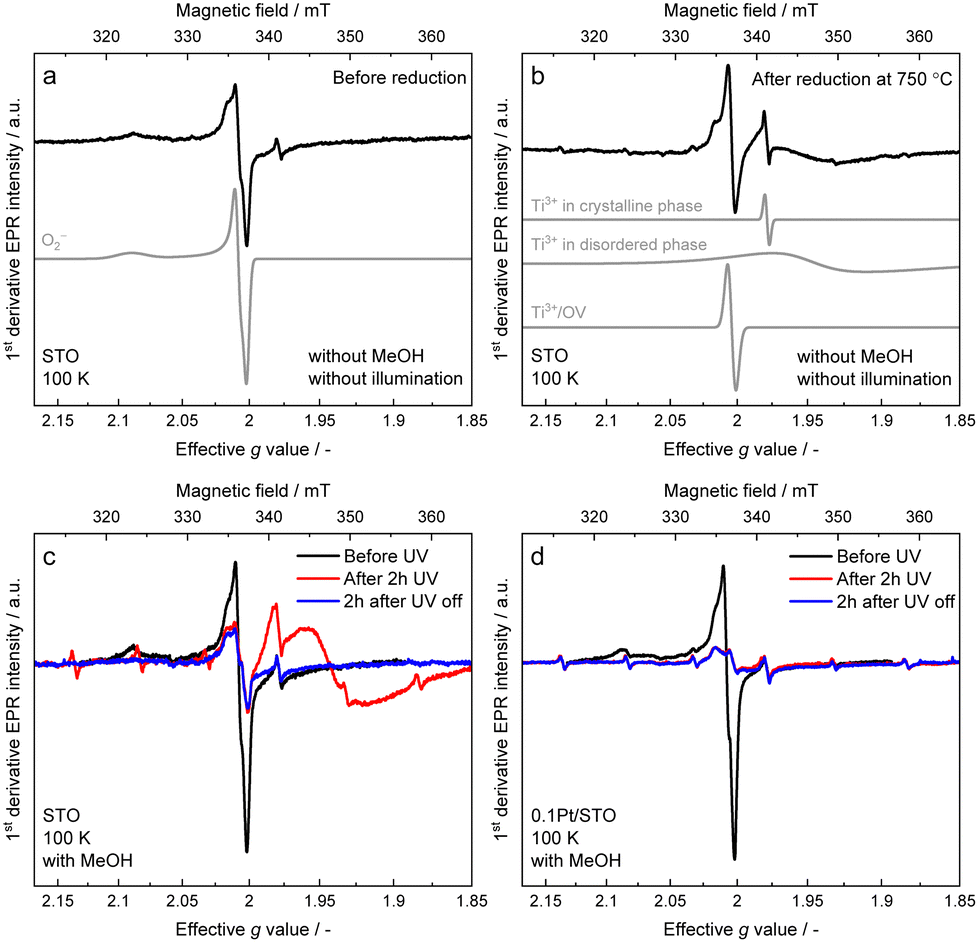 | ||
| Fig. 2 X-band EPR spectra on pristine STO (a), after reduction at 750 °C (b), on illuminated STO and Pt/STO in the presence of MeOH (c) and (d). Simulations of O2− (a), Ti3+ in crystalline phase, Ti3+ in disordered phases, and Ti3+/OV (b) are plotted offset as grey lines. | ||
IR spectroscopic investigations
To study the type, relative amount and stability of carbon-based adsorbates, DRIFTS measurements were performed under thermal and thermal-assisted photocatalytic conditions. The band assignment summarized in Table 2 is based on adsorption experiments with the single components methanol and water (Fig. S16 and S17, ESI†), ATR-IR measurements with pure components (Fig. S18, ESI†) and supported by literature reports.| Species | Absorption mode | Wavenumber / cm−1 | Ref. |
|---|---|---|---|
| Hydroxyl groups | ν(O–H) | 3659 | 16 and 45 |
| 3691 | |||
| Physisorbed water | ν(H–O–H) | 3800–3200 | 16 and 45–47 |
| Combination band | δ(H–O–H) | ∼2040 | |
| 1635 | |||
| Gas-phase water | ν(H–O–H) | 3950–3500 | 48 |
| δ(H–O–H) | 1900–1300 | ||
| Physisorbed methanol | ν as(C–H) | 2950 | 11 |
| ν s(C–H) | 2842 | ||
| ν(C–O) | 1033 | ||
| Methoxy groups | ν as(C–H) | 2921 | 11, 16, 49 and 50 |
| ν s(C–H) | 2814 | ||
| ν(C–O) | 1060 | ||
| ν(C–O) | 1157/1131 | ||
| Formate groups | ν(C–H) | 2864 | 16 and 22 |
| ν as(C–O) | 1610 + 1569 | ||
| ν s(C–O) | 1368, 1310 | ||
| Pt–CO (linear) | ν(M–C–O) | 2060 | 46 and 47 |
| Gas-phase CO2 |
ν
as(O![[double bond, length as m-dash]](https://www.rsc.org/images/entities/char_e001.gif) CO) CO) |
2347 (double band) | 48 |
| SrCO3 | ν as(C–O) | 1451 (see Fig. S16, ESI) | 51 |
| Not assigned | — | 1493 | — |
The spectra recorded during adsorption of methanol and water at 100 °C on 0.1Pt/STO and subsequent reactor purging are shown in Fig. 3. Upon contact of 0.1Pt/STO with the methanol–water mixture, bands related to physisorbed methanol, water and methoxy groups were observed suggesting that dissociative adsorption of methanol occurs. All bands were readily formed, and their maximum intensity was obtained already after ∼6 min pointing to a fast dissociative adsorption of methanol and water on STO.
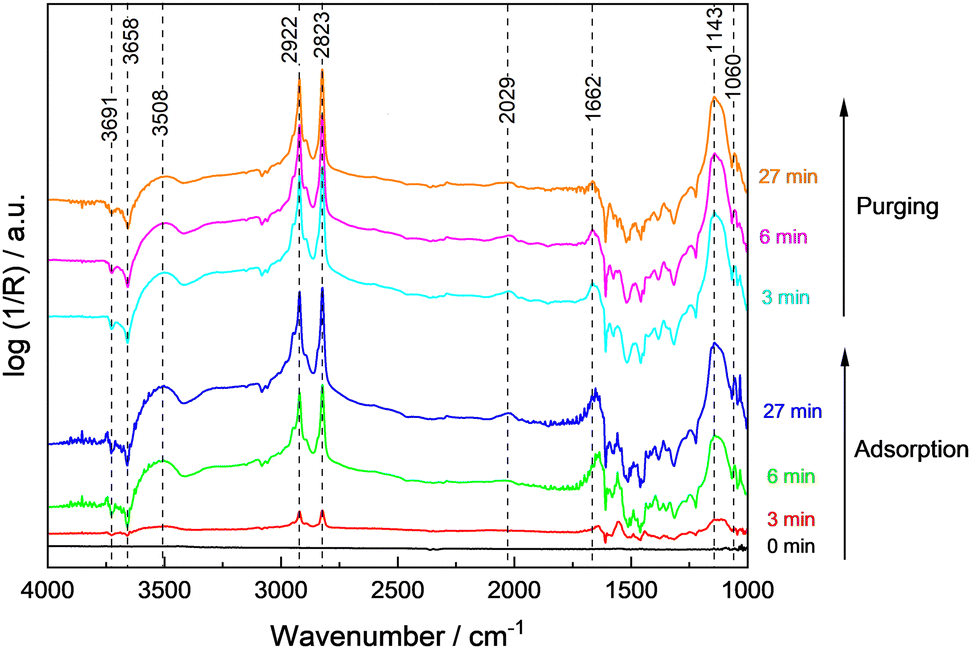 | ||
| Fig. 3 DRIFTS spectra obtained during adsorption of methanol and water on 0.1Pt/STO at 100 °C and subsequent purging with He. As background spectra, the clean surface before the contact to methanol and water at 100 °C was selected. | ||
During adsorption, the bands assigned to hydroxyl groups on the surface rapidly decreased indicating their consumption or replacement. Experiments performed with bare STO (Fig. S19, ESI†) indicate that adsorption and further reaction of adsorbates mainly occurs on the bare STO surface rather than at Pt sites in agreement with the general perception that thermal dissociation of methanol to methoxy groups is feasible on all STO facets in the presence of surface hydroxyl groups.52–54 It is also frequently suggested that the formation of methoxy groups occurs primarily on highly defective/reduced surfaces which seems unlikely based on the presented EPR measurements (Fig. 2). The band at ∼1033 cm−1 disappeared indicating the (partial) desorption of weakly bound methanol. Also, the bands related to physisorbed water gradually decreased. These results point to a competitive adsorption of methanol and water as methoxy groups and hydroxyl groups on the same STO surface sites. In addition to methoxy groups, a weak and broad band at ∼2030 cm−1 was observed. As this band was observed for 0.1Pt/STO (Fig. 3) and STO (Fig. S19, ESI†) during methanol/water adsorption, it is likely that the band is not related to CO adsorbed on Pt. Moreover, CO adsorbed on cationic sites like Ti4+ or Sr2+ may cause a more significant shift to even higher wavenumbers.46 Thus, we assigned the band to a combination band of the O–H–O scissoring and a broad liberation band.47 Overall, methoxy appears to be the predominant adsorbate present in the dark at 100 °C.
The thermal-assisted photocatalytic reaction at elevated temperatures (100 °C) using UV light irradiation was studied with a constant flow of methanol and water in He (Fig. 4). No significant changes of the methanol- and water-related bands were observed due to the fast adsorption and regeneration of the consumed surface species from the gas phase. The band related to CO adsorbed on Pt at 2060 cm−1 slowly increased, and formate bands at 1610 cm−1, 1569 cm−1 and 1368 cm−1 were detected at an increasing intensity with illumination time. Thus, methoxy species are considered important intermediates while both formate and Pt-adsorbed CO seem to be involved in deactivation. Additionally, the gradually increasing negative band at 1450 cm−1 points to the consumption of carbonate as residue in commercial STO on the surface during the photocatalytic reaction. The missing reflexes of SrCO3 in the XRD pattern of 0.1Pt/STO after PD (see Fig. S18, ESI†) indicate that only a minor amount of SrCO3 is present not significantly influencing the photocatalytic experiments.55
 | ||
| Fig. 4 DRIFT spectra during illumination of 0.1Pt/STO exposed to a constant flow of methanol (0.5%) and water (1.5%) in He (left). The spectral region 1800–1000 cm−1 is enlarged (right). As background spectra, the spectra before illumination at 100 °C were chosen revealing the differences to the experiments before illumination. | ||
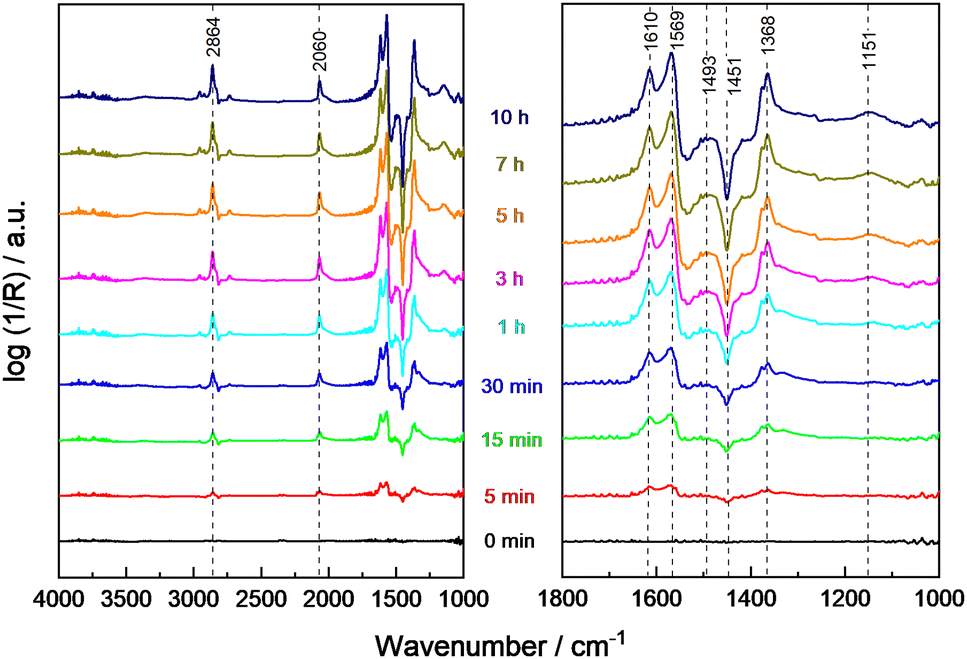
To rationalize the strong dependence of the product selectivity and deactivation (compare Fig. 1 and Fig. S9, ESI†) on the reaction temperature, in situ methanol oxidation has been performed at temperatures up to 200 °C (Fig. 5).9 In the absence of illumination, the amount of physisorbed water decreased as expected indicated by the lower intensity of the characteristic broad band at 3506 cm−1, but otherwise no significant changes were observed with increasing temperature. Thus, even at 200 °C, no change of the bands from hydroxyl groups (3659 cm−1 and 3691 cm−1) or of methoxy groups (2928 cm−1, 2825 cm−1, 1152 cm−1) were observed indicating a high stability or their fast regeneration from gas-phase water and methanol. The band of CO adsorbed on Pt at ∼2056 cm−1 slightly increased with temperature which points to an enhanced thermal decomposition of methanol forming CO. However, due to the low Pt content (0.1 wt%), this band remains small.
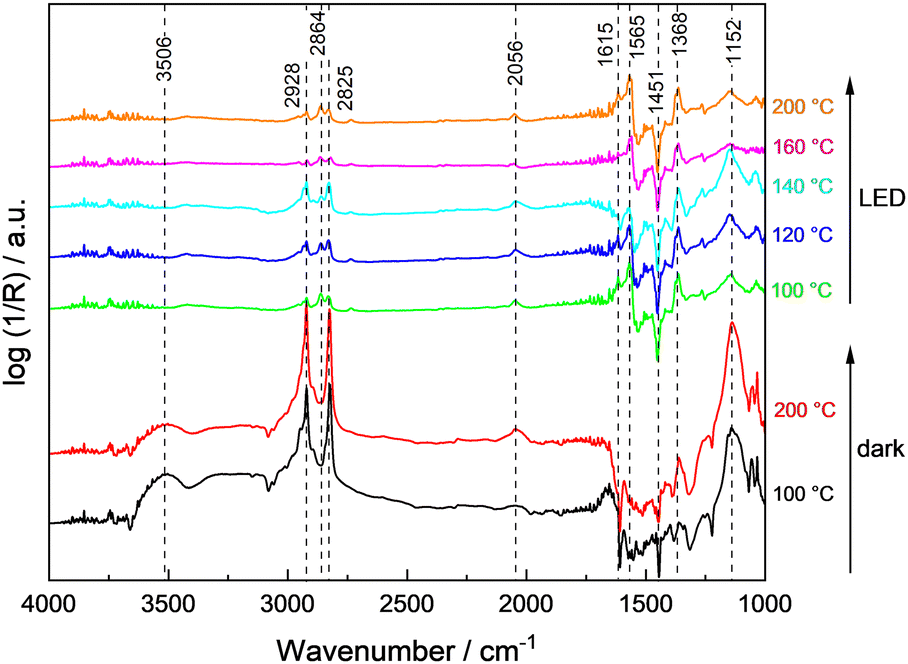 | ||
| Fig. 5 DRIFT spectra of 0.1Pt/STO obtained in the temperature range from 100 °C to 200 °C with flowing methanol (0.5%) and water (1.5%) in the dark and under UV illumination. The reaction temperature was increased in 10 K steps (not all shown here) and kept constant for 90 min for each step; spectra were recorded at the end of each step. The temperature ramp was carried out three times (background recording, dark reaction, and photocatalytic reaction) with the same sample. | ||
During sample illumination, the methoxy bands (2928 cm−1, 2825 cm−1, 1152 cm−1) were generally weaker pointing to a lower surface coverage in agreement with a fast thermal-assisted photocatalytic reaction. A fast desorption of methoxy groups due to the elevated temperatures as origin of the less intense bands is considered unlikely because of the negligible effect of temperature changes in the absence of illumination. Importantly, in all spectra rather intense formate bands were observed. Considering that formate bands at 2864 cm−1, 1615 cm−1 and 1565 cm−1 were only obtained during illumination, formate formation is considered as a kinetically limited photocatalytic step. In the temperature range <140 °C, the amount of methoxy groups was increasing with temperature, whereas the surface coverage of formate was constantly decreasing. This trend reversed at temperatures ≥140 °C and formate groups appear to be of higher surface abundance. Importantly, no bands related to formaldehyde or methyl formate were detected during the in situ DRIFTS analysis suggesting their fast desorption.
In comparison to the data obtained in the continuously-operated flat-plate reactor (see Fig. 1) which revealed severe changes in catalyst activity, stability and selectivity at temperatures ≥120 °C, a mismatch in temperature of about 20 °C was obtained, likely caused by the indirect temperature measurements in DRIFTS studies.9 Still in general, the low methoxy surface coverage at high temperatures agrees well with the high methanol conversion. The change in selectivity to CO at the expense of formaldehyde and methyl formate formation is in line with the more intense CO band observed in the DRIFTS measurements, and the intensity increase of bands associated to formate suggest its contribution to deactivation of 0.1Pt/STO at higher reaction temperatures. Nevertheless, CO adsorbed on Pt sites cannot be fully excluded as deactivating species based on the DRIFTS measurements.
Reaction mechanism, deactivation and regeneration
Based on the DRIFTS results discussed above and the evolved gas-phase products, a mechanism for the thermal-assisted photocatalytic methanol oxidation in the gas phase is proposed, which is also supported by recent literature.4,9,11,13 Frequently, thermal and photocatalytic reaction steps were considered to be concurrent, with UV illumination accelerating specific reaction steps. However, the experimental evidence presented in this work suggests that certain reaction steps proceed exclusively under illumination. Due to the observed displacement of hydroxyl groups by methoxy groups, it is assumed that methanol and water adsorb competitively on the same sites,16 and that all oxidation reactions occur on STO as illustrated in Fig. 6.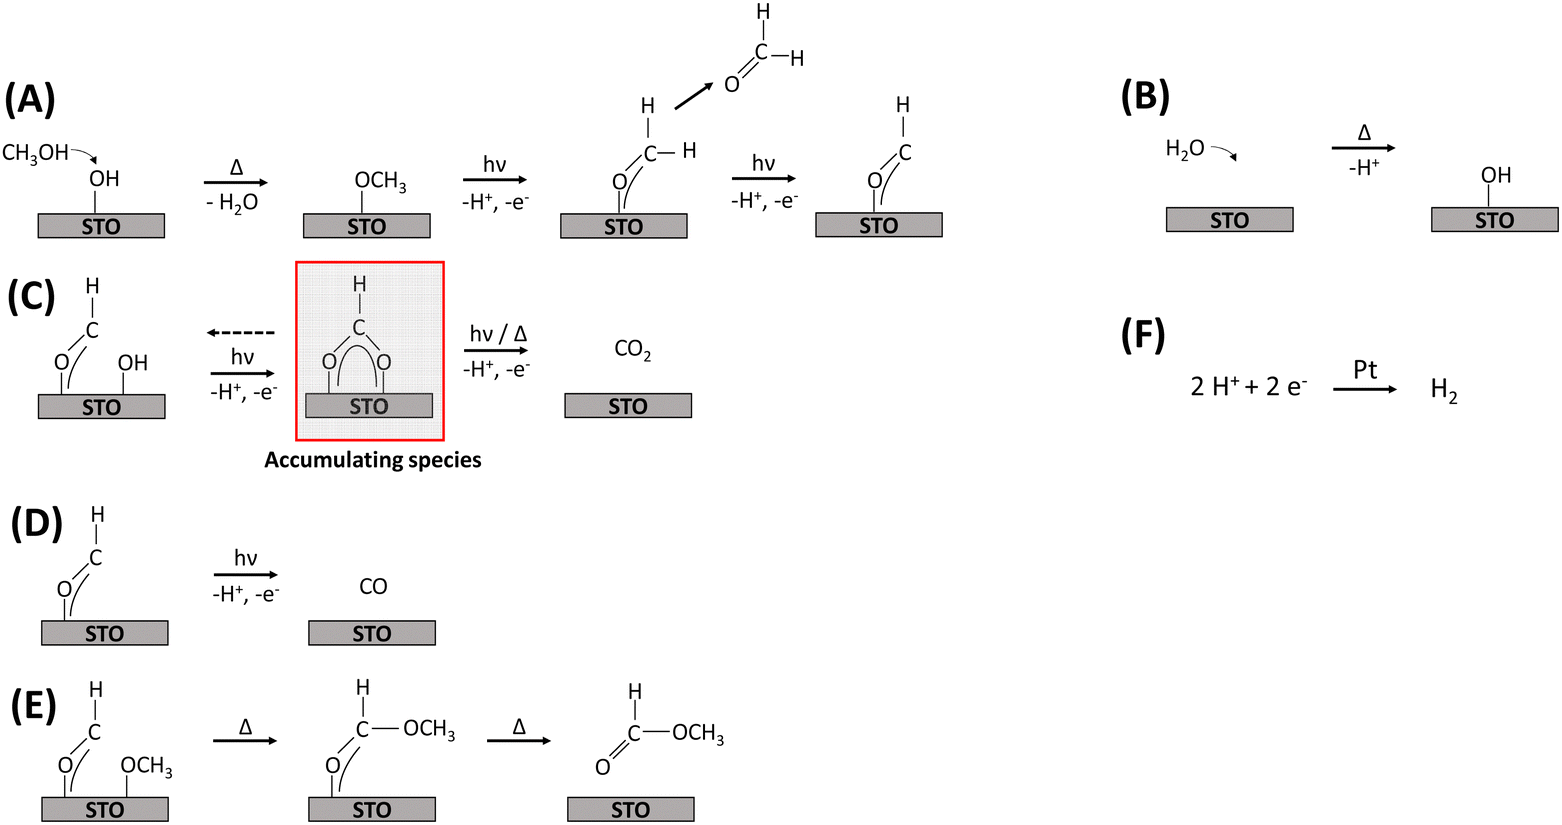 | ||
| Fig. 6 Proposed reaction mechanism for the thermal-assisted photocatalytic methanol oxidation in the gas phase (steps (A)–(F)) including the main carbon-based reactants, intermediates, and products as well as the reduction of H+ at Pt NPs. The accumulated formate species was highlighted (see (C)) as it is proposed to be the main deactivating species. Note that, the regeneration of hydroxyl and methoxy groups must be considered to fulfil the hydrogen balance. Step F does not take into account the total amount of H+ produced by other steps. The trace compounds CH4, dimethoxy methane and dimethyl ether were omitted. | ||
The initial step of the proposed methanol oxidation mechanism (Fig. 6) is the thermal dissociative adsorption of methanol on the STO surface which is supported by the DRIFTS analysis discussed above (see Fig. 3 and Fig. S19, ESI†) (A). This step requires the presence of hydroxyl groups which are continuously regenerated by gas-phase water (B). Our DRIFTS results suggest that both molecular methanol and methoxy groups are present during the reaction (Fig. 3). However, Shen et al.15 provided evidence based on TPD experiments under UHV conditions that methoxy groups are oxidized much faster by photogenerated holes with formaldehyde being the primary product.13,15 Formaldehyde either desorbs or is further oxidized to a formyl intermediate (A). Although no spectroscopic evidence for the presence of formyl species was found here, its presence has been proposed before11,14 and, as highlighted below, agrees well with the observation of the evolution of formaldehyde and consecutive products (Fig. 1). Formyl species are converted in three concurrent consecutive reactions on the STO surface: oxidation to CO2via formate species as a relatively stable intermediate which is supported by the increasing formate bands during the photocatalytic reaction and requires the presence of adjacent hydroxyl groups (Fig. 4) (C); further dehydrogenation of formyl groups to CO (D); or cross coupling between formyl and methoxy species yielding methyl formate (E). Previously, it has been shown that with decreasing methanol and constant water partial pressure an increase in the selectivity to CO/CO2 and a simultaneous decrease in methyl formate selectivity is obtained.9 A similar change of the product distribution was obtained when the reaction temperature in the flat-plate reactor was increased to >125 °C.9 In agreement with the decreasing methoxy bands and stable hydroxy bands observed here at temperatures ≥140 °C (Fig. 5), a lower coverage of methoxy groups can be correlated with a lower selectivity to methyl formate supporting the mutual influence of reaction C, D and E depending on the surface coverage of methoxy and hydroxy groups. Additionally, the evolution of formic acid (via the formate intermediate) may occur even if it is not detected due to the easy decomposition of formic acid on noble metal-containing catalysts at elevated temperatures either to CO2 and H2 or to CO and water according to eqn (2) and (3).4,56,57 These steps were omitted in the mechanism (Fig. 6), as no experimental evidence for the presence of formic acid was found here.
| HCOOH → CO2 + H2 | (2) |
| HCOOH → CO + H2O | (3) |
Considering the presented reaction mechanism and the DRIFTS data discussed above, changes in selectivity towards CO formation with increasing temperature are rationalized by a decrease in neighboring formyl and methoxy groups caused by the lower surface coverage of methoxy groups (Fig. 5). Moreover, dehydrogenation of the formyl groups to CO was favored over oxidation to CO2 again due to the generally slow oxidation of formate to CO2 being in agreement with formate accumulation at the surface.
H2 evolution (step F) proceeds alongside methanol oxidation. For H2 evolution, two fundamentally different approaches regarding the type of hydrogen surface species are currently discussed in literature. In analogy to electrochemical H2 evolution, H+ released at the oxidation sites are subsequently reduced to H2 by trapped photogenerated electrons at the metal cocatalyst. In contrast, the Heiz group suggested a fundamentally different hole-mediated disproportionation mechanism where the metal cocatalyst acts as recombination center for atomic hydrogen when deposited on a reducible semiconductor which enables diffusion of atomic hydrogen rather than acting as reduction site. Furthermore, the Heiz group suggested that photoexcited electrons are not trapped by cocatalyst particles but on the photocatalyst leading to negatively charged states which act as starting point of the catalytic cycle. The strict separation of half reactions, often made in photocatalysis, is thus not applicable in that case.19,58,59 However, we observed a strong dependence of the reaction kinetics on the presence of water being the H+ transport medium, and for the Pt loading an optimum Pt amount for every photocatalytic system was derived.9 Additionally, EPR measurements indicated that Pt NPs capture photogenerated electrons supporting the commonly accepted mechanism of H+ reduction at the surface of Pt NPs after surface migration via hydroxyl groups being favored in the presence of water.57 Thus, H2 formation is depicted here as reduction of H+ by trapped photogenerated electrons on the Pt NPs but overall the mechanistic sequence also allows to consider both oxidation and reduction half-reactions as interconnected and rationalizes the formation of the observed products while closing the carbon and hydrogen balances.
Photocatalyst deactivation appears to be strongly related to formate surface coverage on STO and CO on Pt sites and is shown to be reversible which was revealed using O2 pulses (Fig. 7). Methanol conversion increased by pulsing O2, and, as a consequence, all product evolution rates increased while the product distribution remained unchanged.
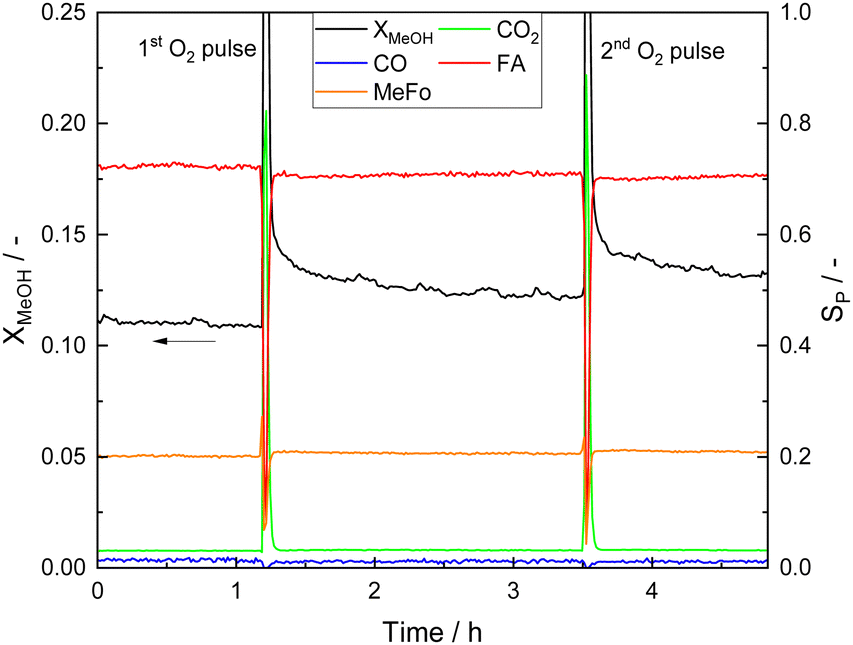 | ||
| Fig. 7 X MeOH profiles and product distribution before, after and during the first and second O2 pulse. The O2 pulses were performed after the quasi-steady state was reached at standard reaction conditions (Table 1) which corresponds to t = 0 h. | ||
The coverage with formate groups increased with reaction temperature (see Fig. 5) and clear evidence for CO adsorbed on Pt was observed by DRIFTS. After a certain illumination time, the intensity of the corresponding CO bands was not further increasing suggesting a constant CO coverage under the applied reaction conditions. Estimation of the released amount of additional CO2 produced during O2 pulsing reveals that the amount of CO2 (1.92 × 10⁻⁵ mol) exceeds the number of Pt atoms by one order of magnitude (1.54 × 10⁻⁶ mol, even without considering the surface-to-volume ratio of the Pt atoms in the NPs). Therefore, oxidation of adsorbed CO on Pt is not sufficiently explaining deactivation, being also in agreement with CO and CO2 pulses that are not affecting photocatalytic performance (Fig. S20, ESI†). Furthermore, the low CO conversion during the WGSR over 0.1Pt/STO under dark and illuminated conditions (Fig. S21, ESI†) indicates that a fast removal of CO from Pt as it was proposed before20,21 is unlikely under the conditions applied here. Other organic adsorbates on the STO surface must be the main source of CO2 during the O2 pulse and be responsible for catalyst deactivation. Thus, deactivation is primarily caused by adsorbed formate on STO with COads on Pt being a spectator species present at high amounts on the surface of the photocatalyst. The additional formation of polymeric moieties with high molecular weight from formaldehyde which might further deactivate the catalyst is not likely due to the elevated reaction temperatures,60 and, correspondingly, no related bands were observed. Though, not evidenced by the spectroscopic date provided here, formate formation might also occur as consequence of the WGSR on Pt nanoparticles and may, in addition to COads, block Pt sites.61,62
Obviously, the type and binding strength of the STO surface sites is a crucial factor. Therefore, controlling formaldehyde desorption, formate formation and its further oxidation to CO2 through, among other factors, surface site engineering will likely contribute to lower catalyst deactivation and high formaldehyde selectivity even at elevated reaction temperatures.
Conclusions
This work presents a detailed in situ DRIFTS study to deduce the reaction mechanism of the thermal-assisted anaerobic gas-phase methanol photooxidation over Pt-modified SrTiO3 providing insights into the deactivation mechanism. The primary oxidation product formaldehyde produced in conjunction with H2 as coupled product agrees with the formation of formyl species. Formyl species are thus identified as key intermediate for three concurrent reactions resulting in CO2, CO and methyl formate formation. Moreover, formation of methoxy groups from methanol and surface hydroxyl groups are found to occur under thermal conditions, while oxidation of methoxy groups to formaldehyde is exclusively driven by photocatalysis. Deactivation of the photocatalytic process occurs particularly at higher temperatures and is caused by the sluggish kinetics of the oxidation of stable formate groups to CO2 and its corresponding accumulation at the surface of 0.1Pt/STO which is shown to be reversible by O2 pulsing. Using EPR spectroscopy, participation of paramagnetic OVs in the thermal-assisted photocatalytic reaction mechanism is excluded over undoped SrTiO3. This study contributes to the development of an efficient procedure for catalyst regeneration and to enhancing the long-term stability of the photocatalytic reaction.Author contributions
M. Deitermann: conceptualization, data curation, formal analysis, investigation, methodology, visualization, writing – original draft. T. Sato: data curation, formal analysis, investigation, methodology. Y. Haver: data curation, formal analysis, investigation. A. Schnegg: investigation, methodology, supervision. M. Muhler: conceptualization, funding acquisition, resources, supervision, writing – review & editing. B. Mei: conceptualization, supervision, writing – review & editing.Conflicts of interest
There are no conflicts to declare.Acknowledgements
This work was supported by the International Max Planck Research School on Reactive Structure Analysis for Chemical Reactions (IMPRS-RECHARGE) and the “Center for Solvation Science ZEMOS” funded by the German Federal Ministry of Education and Research BMBF, German Research Foundation (DFG) under CRC/TRR 247 and by the Ministry of Culture and Research of North Rhine-Westphalia.Notes and references
- L. S. Al-Mazroai, M. Bowker, P. Davies, A. Dickinson, J. Greaves, D. James and L. Millard, Catal. Today, 2007, 122, 46–50 CrossRef CAS.
- G. L. Chiarello, E. Selli and L. Forni, Appl. Catal., B, 2008, 84, 332–339 CrossRef CAS.
- M. Bingham and A. Mills, J. Photochem. Photobiol., A, 2020, 389, 112257 CrossRef CAS.
- A. Caravaca, H. Daly, M. Smith, A. Mills, S. Chansai and C. Hardacre, React. Chem. Eng., 2016, 1, 649–657 RSC.
- G. L. Chiarello, L. Forni and E. Selli, Catal. Today, 2009, 144, 69–74 CrossRef CAS.
- G. L. Chiarello, M. H. Aguirre and E. Selli, J. Catal., 2010, 273, 182–190 CrossRef CAS.
- L. M. Ahmed, I. Ivanova, F. H. Hussein and D. W. Bahnemann, Int. J. Photoenergy, 2014, 2014, 1–9 CrossRef.
- D. A. Armstrong, R. E. Huie, W. H. Koppenol, S. V. Lymar, G. Merényi, P. Neta, B. Ruscic, D. M. Stanbury, S. Steenken and P. Wardman, Pure Appl. Chem., 2015, 87, 1139–1150 CrossRef CAS.
- M. Deitermann, Y. Haver, B. T. Mei and M. Muhler, Adv. Sustainable Syst., 2023, 2300329 Search PubMed.
- T. H. Chiang, H. Lyu, T. Hisatomi, Y. Goto, T. Takata, M. Katayama, T. Minegishi and K. Domen, ACS Catal., 2018, 8, 2782–2788 CrossRef CAS.
- M. El-Roz, P. Bazin, M. Daturi and F. Thibault-Starzyk, Phys. Chem. Chem. Phys., 2015, 17, 11277 RSC.
- M. El-Roz, M. Kus, P. Cool and F. Thibault-Starzyk, J. Phys. Chem. C, 2012, 116, 13252 CrossRef CAS.
- J. Schnee, M. Daturi and M. El-Roz, Catal. Sci. Technol., 2020, 10, 5618–5627 RSC.
- K. R. Phillips, S. C. Jensen, M. Baron, S.-C. Li and C. M. Friend, J. Am. Chem. Soc., 2013, 135, 574–577 CrossRef CAS PubMed.
- M. Shen and M. A. Henderson, J. Phys. Chem. Lett., 2011, 2, 2707–2710 CrossRef CAS.
- G. L. Chiarello, D. Ferri and E. Selli, Appl. Surf. Sci., 2018, 450, 146–154 CrossRef CAS.
- G. M. Haselmann and D. Eder, ACS Catal., 2017, 7, 4668–4675 CrossRef CAS.
- G. M. Haselmann, B. Baumgartner, J. Wang, K. Wieland, T. Gupta, C. Herzig, A. Limbeck, B. Lendl and D. Eder, ACS Catal., 2020, 10, 2964–2977 CrossRef CAS.
- C. A. Walenta, C. Courtois, S. L. Kollmannsberger, M. Eder, M. Tschurl and U. Heiz, ACS Catal., 2020, 10, 4080–4091 CrossRef CAS.
- M. Bowker, D. James, P. Stone, R. Bennett, N. Perkins, L. Millard, J. Greaves and A. Dickinson, J. Catal., 2003, 217, 427–433 CrossRef CAS.
- A. Dickinson, D. James, N. Perkins, T. Cassidy and M. Bowker, J. Mol. Catal. A: Chem., 1999, 146, 211–221 CrossRef CAS.
- F. Platero, A. López-Martín, A. Caballero and G. Colón, ChemCatChem, 2021, 13, 3878–3888 CrossRef CAS.
- J. C. Matsubu, S. Zhang, L. DeRita, N. S. Marinkovic, J. G. Chen, G. W. Graham, X. Pan and P. Christopher, Nat. Chem., 2017, 9, 120 CrossRef CAS PubMed.
- A. J. Martín, S. Mitchell, C. Mondelli, S. Jaydev and J. Pérez-Ramírez, Nat. Catal., 2022, 5, 854 CrossRef.
- S. Peng, C. Gan, Y. Yang, S. Ji and Y. Li, Energy Technol., 2018, 6, 2166–2171 CrossRef CAS.
- Y. Fan, Y. Liu, H. Cui, W. Wang, Q. Shang, X. Shi, G. Cui and B. Tang, Nanomaterials, 2020, 10, 2572 CrossRef CAS PubMed.
- H. Tan, Z. Zhao, W.-B. Zhu, E. N. Coker, B. Li, M. Zheng, W. Yu, H. Fan and Z. Sun, ACS Appl. Mater. Interfaces, 2014, 6, 19184–19190 CrossRef CAS PubMed.
- Y. Kim, M. Watanabe, A. Takagaki, J. Matsuda and T. Ishihara, ChemCatChem, 2019, 11, 6270–6274 CrossRef CAS.
- B. Mei, K. Han and G. Mul, ACS Catal., 2018, 8, 9154 CrossRef CAS PubMed.
- B. Mei, C. Wiktor, S. Turner, A. Pougin, G. van Tendeloo, R. A. Fischer, M. Muhler and J. Strunk, ACS Catal., 2013, 3, 3041–3049 CrossRef CAS.
- G. W. Busser, B. Mei and M. Muhler, ChemSusChem, 2012, 5, 2200–2206 CrossRef CAS PubMed.
- S. Stoll and A. Schweiger, J. Magn. Reson., 2006, 178, 42–55 CrossRef CAS PubMed.
- K. Han, D. M. Haiber, J. Knöppel, C. Lievens, S. Cherevko, P. Crozier, G. Mul and B. Mei, ACS Catal., 2021, 11, 11049–11058 CrossRef CAS PubMed.
- G. Zhao, G. W. Busser, C. Froese, B. Hu, S. A. Bonke, A. Schnegg, Y. Ai, D. Wei, X. Wang, B. Peng and M. Muhler, J. Phys. Chem. Lett., 2019, 10, 2075–2080 CrossRef CAS PubMed.
- Y. Hu, G. Zhao, Q. Pan, H. Wang, Z. Shen, B. Peng, G. W. Busser, X. Wang and M. Muhler, ChemCatChem, 2019, 11, 5139–5144 CrossRef CAS.
- T. Rath, M. Deitermann, G. Zhao, G. Wilma Busser, H. Jansen, P. Schwiderowski, W. Xia and M. Muhler, ChemPhotoChem, 2021, 5, 521–525 CrossRef CAS.
- V. N. Belevskii, I. Volnov and S. A. Tokareva, Consultants Bureau, 1971, 1366–1367 Search PubMed.
- S. M. Prokes, J. L. Gole, X. Chen, C. Burda and W. E. Carlos, Adv. Funct. Mater., 2005, 15, 161–167 CrossRef CAS.
- M. Anpo, M. Che, B. Fubini, E. Garrone, E. Giamello and M. C. Paganini, Top. Catal., 1999, 189–198 CrossRef CAS.
- R. F. Howe and M. Gratzel, J. Phys. Chem., 1985, 89, 4495–4499 CrossRef CAS.
- X. Zhou, N. Liu, T. Yokosawa, A. Osvet, M. E. Miehlich, K. Meyer, E. Spiecker and P. Schmuki, ACS Appl. Mater. Interfaces, 2018, 10, 29532 CrossRef CAS PubMed.
- S. Livraghi, M. Chiesa, M. C. Paganini and E. Giamello, J. Phys. Chem. C, 2011, 115, 25413 CrossRef CAS.
- K. Lau, F. Niemann, K. Abdiaziz, M. Heidelmann, Y. Yang, Y. Tong, M. Fechtelkord, T. C. Schmidt, A. Schnegg, R. K. Campen, B. Peng, M. Muhler, S. Reichenberger and S. Barcikowski, Angew. Chem., Int. Ed., 2023, 62, e202213968 CrossRef CAS PubMed.
- R. A. Maier, A. C. Johnston-Peck and M. P. Donohue, Adv. Funct. Mater., 2016, 26, 8325 CrossRef CAS.
- K. I. Hadjiivanov, Adv. Catal., 2014, 57, 99–318 CAS.
- K. I. Hadjiivanov, J. Chem. Soc., Faraday Trans., 1998, 94, 1901–1904 RSC.
- B. L. Mojet, S. D. Ebbesen and L. Lefferts, Chem. Soc. Rev., 2010, 39, 4643–4655 RSC.
- U.S. Secretary of Commerce, “NIST Chemistry Webbook”, 2023, https://webbook.nist.gov/chemistry/. last accessed 22.12.23.
- F. Boccuzzi, A. Chiorino and M. Manzoli, J. Power Sources, 2003, 118, 304–310 CrossRef CAS.
- A. Nuhu, J. Soares, M. Gonzalez-Herrera, A. Watts, G. Hussein and M. Bowker, Top. Catal., 2007, 44, 293–297 CrossRef CAS.
- N. Tipcompor, T. Thongtem, A. Phuruangrat and S. Thongtem, Mater. Lett., 2012, 87, 153–156 CrossRef CAS.
- N. Aas, T. J. Pringle and M. Bowker, J. Chem. Soc., Faraday Trans., 1994, 90, 1015–1022 RSC.
- L.-Q. Wang, K. F. Ferris, S. Azad and M. H. Engelhard, J. Phys. Chem. B, 2005, 109, 4507–4513 CrossRef CAS PubMed.
- R. Huang, V. Fung, Y. Zhang, D. R. Mullins, Z. Wu and D.-E. Jiang, J. Phys. Chem. C, 2018, 122, 7210–7216 CrossRef CAS.
- B. Boga, N. Steinfeldt, N. G. Moustakas, T. Peppel, H. Lund, J. Rabeah, Z. Pap, V.-M. Cristea and J. Strunk, Catal, 2022, 12, 978 CAS.
- H. Bahruji, M. Bowker, P. R. Davies and F. Pedrono, Appl. Catal., B, 2011, 107, 205 CrossRef CAS.
- G. L. Chiarello, D. Ferri and E. Selli, J. Catal., 2011, 280, 168–177 CrossRef CAS.
- C. A. Walenta, S. L. Kollmannsberger, C. Courtois, R. N. Pereira, M. Stutzmann, M. Tschurl and U. Heiz, Phys. Chem. Chem. Phys., 2019, 21, 1491–1496 RSC.
- M. Eder, M. Tschurl and U. Heiz, J. Phys. Chem. Lett., 2023, 14, 6193–6201 CrossRef CAS PubMed.
- W. M. D. Bryant and J. B. Thompson, J. Polym. Sci., Part A-1: Polym. Chem., 1971, 9, 2523 CrossRef CAS.
- J. Zhao, Y. Bai, Z. Li, J. Liu, W. Wang, P. Wang, B. Yang, R. Shi, G. I. N. Waterhouse, X.-D. Wen, Q. Dai and T. Zhang, Angew. Chem., Int. Ed., 2023, 62, e202219299 CrossRef CAS PubMed.
- A. A. Gokhale, J. A. Dumesic and M. Mavrikakis, J. Am. Chem. Soc., 2008, 130, 1402–1414 CrossRef CAS PubMed.
Footnote |
| † Electronic supplementary information (ESI) available: Experimental set-up and procedure of DRIFTS measurements, XP spectrum, DRIFTS spectra, EPR spectra with detailed analysis and simulations, additional pulse experiments, water gas shift experiments. See DOI: 10.1039/d4cp01106f |
| This journal is © the Owner Societies 2024 |