 Open Access Article
The physico-geometrical reaction pathway and kinetics of multistep thermal dehydration of calcium chloride dihydrate in a dry nitrogen stream†
Kazuki
Kato
and
Nobuyoshi
Koga
 *
*
Department of Science Education, Division of Educational Sciences, Graduate School of Humanities and Social Sciences, Hiroshima University, 1-1-1 Kagamiyama, Higashi-Hiroshima 739-8524, Japan. E-mail: nkoga@hiroshima-u.ac.jp; Fax: +81-82-424-7092; Tel: +81-82-424-7092
First published on 27th March 2024
Abstract
Several inorganic hydrates exhibit reversible reactions of thermal dehydration and rehydration, which is potentially applicable to thermochemical energy storage. Detailed kinetic information on both forward and reverse reactions is essential for refining energy storage systems. In this study, factors determining the reaction pathway and kinetics of the multistep thermal dehydration of inorganic hydrates to form anhydride via intermediate hydrates were investigated as exemplified by the thermal dehydration of CaCl2·2H2O (CC-DH) in a stream of dry N2. The formation of CaCl2·H2O (CC-MH) as the intermediate hydrate is known during the thermal dehydration of CC-DH to form its anhydride (CC-AH). However, the two-step kinetic modeling based on the chemical reaction pathway considering the formation of the CC-MH intermediate failed in terms of the reaction stoichiometry and kinetic behavior of the component reaction steps. The kinetic modeling was refined by considering the physico-geometrical reaction mechanism and the self-generated reaction conditions to be a three-step reaction. The multistep reaction was explained as comprising the surface reaction of the thermal dehydration of CC-DH to CC-AH and subsequent contracting geometry-type reactions from CC-DH to CC-MH and from CC-MH to CC-AH occurring consecutively in the core of the reacting particles surrounded by the surface product layer of CC-AH. The acceleration of the linear advancement rate of the reaction interface during both contracting geometry-type reactions was revealed through multistep kinetic analysis and was described by a decrease in the water vapor pressure at the reaction interface as the previous reaction step proceeded and terminated.
1. Introduction
Several inorganic hydrates can be applied to thermochemical energy storage systems because of their specific features characterized by the reversible thermal dehydration and rehydration processes accompanied by endothermic and exothermic effects, respectively.1–4 The phase relation between the reactant and product hydrates in the dehydration and rehydration cycle is determined by the thermodynamics of the relevant reactions. However, complex multistep reaction behavior is occasionally observed in both thermal dehydration and rehydration, even for simple single-step reactions based on chemical thermodynamics. One obvious cause of the multistep reaction behavior is the heterogeneous nature of thermal dehydration and rehydration in solid–gas systems.5–9 The geometrical constraints of a reaction generate specific constructions of the reacting particles comprising the reactant and product phases at different reaction steps. At each reaction stage, specific reaction conditions are generated at the reaction interface, which regulate the apparent kinetic behavior. As a result, the multistep reaction behavior can be observed as successive physico-geometrical reaction stages. A typical phenomenon is the formation of a surface product layer in the initial stage of both dehydration and rehydration reactions.10–15 The surface product layer sometimes blocks the diffusional removal of water vapor generated at the reaction interface during thermal dehydration and the intake of water vapor during rehydration, temporarily stopping the reaction. The reaction is reactivated by the formation of diffusion channels in the surface product layer, possibly because of the crystal growth of the solid product and crack formation. In this physico-geometrical scheme, the reaction is separated into two reaction steps. In addition, the physico-geometrical reaction constraint and self-generated reaction conditions therein vary with the applied sample and reaction conditions, such as morphological characteristics, sampling conditions, heating conditions, and atmospheric gas.When the multistep thermal dehydration of an inorganic hydrate occurs by partially overlapping along the temperature coordinate, the chemical reaction pathway and the kinetics of component reactions are expected to vary with the physico-geometrical constraints of the component reactions. Thermal dehydration of calcium chloride hydrates is one such example, which is a candidate for thermochemical energy storage technology via cyclic thermal dehydration and hydration of anhydride.16–24 Among calcium chloride hydrates with different numbers of crystallization water, calcium chloride dihydrate (CC-DH) is a stable compound, which appears as an intermediate hydrate during the thermal dehydration of hexahydrate and tetrahydrate to form calcium chloride anhydride (CC-AH).21 CC-DH is also a stable product of the hydration of CC-AH.16 A relatively smooth mass loss curve for the thermal dehydration of CC-DH to form CC-AH was reported by Karunadasa et al.,21 when CC-DH was heated at a constant heating rate (β) of 10 K min−1 in a stream of dry N2:
| CaCl2·2H2O(s) → CaCl2(s) + 2H2O(g) | (1) |
However, they also identified two partially overlapping endothermic peaks in differential thermal analysis (DTA) during thermal dehydration. In addition, mixed phases of calcium chloride monohydrate (CC-MH) and CC-AH were confirmed midway during thermal dehydration. Besides, Molenda et al.16 reported that the thermal dehydration of CC-DH proceeded stoichiometrically to form CC-AH via stable CC-MH in two well-separated mass loss steps when CC-DH was heated at a small β of 0.2 K min−1 and a high water vapor pressure (p(H2O)) of approximately 5 kPa.
| CaCl2·2H2O(s) → CaCl2·H2O(s) + H2O(g) | (2) |
| CaCl2·H2O(s) → CaCl2(s) + H2O(g) | (3) |
In this study, the reaction behavior of the thermal dehydration of CC-DH to form CC-AH was systematically investigated under different heating program modes in a stream of dry N2 and N2–H2O mixed gases with different p(H2O) values for revealing the physico-geometrical reaction pathway and kinetics of component reaction steps. Herein, as the first part of the research outcome, we report the specific features of the multistep thermal dehydration of CC-DH to form CC-AH in a dry N2 stream. The multistep reaction pathway was interpreted by kinetic analysis of simultaneous thermogravimetry (TG)–derivative TG (DTG)–DTA curves using the mathematical deconvolution analysis (MDA)8,35–38 and kinetic deconvolution analysis (KDA),8,35,36,39 supplemented by identification of the intermediate crystalline hydrate phases using high temperature X-ray diffractometry (XRD) and in situ microscopic observation of the morphological changes during the reactions. The kinetic modeling of multistep thermal dehydration was initially examined based on the partially overlapping two-step reaction model according to eqn (2) and (3). Then, the refinement of the multistep kinetic model was attempted by considering the physico-geometrical features and the effect of self-generated water vapor, revealing the reaction pathway to finally form CC-AH and the geometry of each component reaction step. Furthermore, the influence of the self-generated reaction conditions on the kinetic behavior of each component reaction step was discussed based on the specific kinetic features revealed by the refined multistep kinetic modeling. We discuss the interaction between the thermodynamic phase relation controlled by temperature and p(H2O) and the physico-geometrical kinetic features of the thermal dehydration of inorganic hydrates to determine the apparent reaction pathway and specific kinetic features of the component reaction steps, as exemplified by the thermal dehydration of CC-DH in a stream of dry N2. The findings reported in this paper are expected to become a foothold for further comprehensive understanding of the kinetics of thermal dehydration of CC-DH under various p(H2O) conditions.
2. Experimental
2.1. Sample characterization
CC-DH (special grade, >99.9%), purchased from FUJIFILM Wako Chem., was sieved into different particle size fractions using a series of stainless sieves and an electronic shaker (MVS-1, As-One). To avoid deliquescence of sample particles, the sieving procedure was performed in a glove box in a dry N2 atmosphere. The sieved particles with a relatively large size of 300–500 μm fraction were used as samples because of the relatively slow deliquescence rate due to the smaller specific surface area. The sample was characterized by powder XRD, Fourier transform infrared spectroscopy (FTIR), and simultaneous TG–DTA. The XRD pattern was recorded using a diffractometer (RINT 2200 V, Rigaku) in a stream of dry N2 at a flow rate (qv) of 100 cm3 min−1 for the sample press-fitted to a sample holder without crushing the sample particles, for which the 2θ value was scanned from 5° to 60° at a scan speed of 4° min−1 in steps of 0.02° by irradiating Cu-Kα (40 kV, 20 mA). The FTIR spectrum was recorded using a spectrometer (FT-IR 8400s, Shimadzu) for the sample diluted with KBr using the diffuse reflectance method. TG–DTA curves were recorded using a top-loading type instrument (DTG60, Shimadzu) for approximately 3 mg of the sample particles weighed in a Pt pan (diameter: 6 mm; depth: 2.5 mm). The sample was allowed to stand for 90 min at 303 K in a stream of dry N2 (qv = 100 cm3 min−1) to remove water absorbed via the deliquescence and subsequently heated from 303 to 473 K at a β of 5 K min−1 while recording TG–DTA curves.The particle morphology and surface texture were observed using a stereomicroscope (SZX7, Olympus) and an optical microscope (BH-2, Olympus), respectively. For the observations using the stereomicroscope, sample particles were exposed to an ambient atmosphere at room temperature, and the changes in the surface texture due to deliquescence were traced. The sample particles were weighed in an Al pan (diameter: 6 mm; depth: 2 mm) and placed in a heating stage (STJ-M100-01-P-HU-SP, S.T. Japan) at 303 K in a stream of dry N2 (qv = 100 cm3 min−1), during which the changes in the surface texture of partially deliquesced particles during the sampling procedure were observed using an optical microscope.
2.2. Thermal dehydration behavior
The changes in the XRD pattern as the thermal dehydration proceeded were traced by high temperature XRD measurements using a RINT 2200V equipped with a heating chamber and programmable temperature controller (PTC-20A, Rigaku). The sample particles, press-fitted on a Pt plate without crushing, were heated from 303 to 423 K at a β of 2 K min−1 in a stream of dry N2 (qv = 100 cm3 min−1), during which isothermal holding sections for 15 min were inserted every 10 K. The XRD patterns of the samples were recorded during each isothermal holding section under the measurement conditions used for the measurement at room temperature in the sample characterization.Using the microscope (BH-2)–heating stage (STJ-M100-01-P-HU-SP) system used in the sample characterization, the changes in the surface texture as the thermal dehydration proceeded were continuously monitored. Several sample particles set in an Al pan (diameter: 6 mm; depth: 2 mm) were placed in the heating stage and stood at 303 K for 4 h in a stream of dry N2 (qv = 100 cm3 min−1). Thereafter, the sample particles were heated from 303 to 453 K at a β of 5 K min−1 and the digital images of the surface texture were recorded every 30 s.
2.3. Kinetic measurements
The mass loss behavior of the thermal dehydration of CC-DH to form CC-AH was systematically traced in a stream of dry N2 (qv = 300 cm3 min−1) using a TG–DTA instrument with a horizontally arranged differential balance (TG-8121, Thermoplus Evo2 system, Rigaku). The sample particles were weighed in a Pt pan (diameter: 5 mm; depth: 2.5 mm) as the initial sample mass (m0) to be 3.0 mg and placed in the TG–DTA instrument. The samples were allowed to stand at 303 K in a stream of dry N2 (qv = 300 cm3 min−1) for 90 min before the TG–DTG measurements to remove water molecules absorbed on the particle surfaces by deliquescence during sampling. Three heating program modes, including isothermal, linear nonisothermal, and constant transformation rate thermal analysis (CRTA) modes, were used for recording TG–DTG curves. Notably, CRTA is one technique categorized in sample controlled thermal analysis,40 in which the sample is heated at a preset β, while during the mass loss process, the mass loss rate is regulated to a constant value C by automatically altering the sample temperature via feedback control by continuously monitoring the mass loss rate. In a series of TG–DTG measurements under isothermal conditions, samples were heated from 303 K to different temperatures (329 ≤ T/K ≤ 333) at a β of 5 K min−1 and held at the preset temperature while recording the mass loss curves. A series of TG–DTG curves under linear nonisothermal conditions were recorded by heating samples from 303 to 473 K at different β values (0.5 ≤ β/K min−1 ≤ 10). Under CRTA conditions, samples were heated from 303 to 473 K at a β of 2 K min−1, while during the mass loss process, the sample temperature was controlled to maintain various constant C values (3 ≤ C/μg min−1 ≤ 18).3. Results and discussion
3.1. Sample characterization
Fig. S1 and S2 (ESI†) show the XRD pattern and FTIR spectrum of the sample, respectively. The XRD pattern corresponds to the previously reported pattern for CC-DH (orthorhombic, SG = Pbcn(60), a = 5.8930, b =7.4690, c = 12.0700, α = β = γ = 90.000, ICCD-PDF 01-070-0385).41 The FTIR spectrum exhibited infrared absorption peaks, attributable to O–H stretching, H–O–H bending, and calcium chloride lattice vibrations,23,42 as listed in Table S1 (ESI†).The sample particles were cuboidal in shape (Fig. S3, ESI†). Upon exposing the sample particles at room temperature in the ambient atmosphere, they immediately began to deliquesce, forming a liquid dome (Fig. S4, ESI†). Therefore, by briefly exposing the sample particles in the ambient atmosphere during the sampling procedures for thermoanalytical (TA) measurements, partial deliquescence occurred on the particle surfaces. The partially deliquesced particle surfaces were dehydrated upon exposure at room temperature to a stream of dry N2 (Fig. S5, ESI†), during which a polycrystalline CC-DH layer was formed covering the single crystalline CC-DH core. Therefore, for TA measurements, the weighed samples should be allowed to stand for a certain time at room temperature in a stream of dry N2 to dehydrate the deliquesced surface portion and recover CC-DH.
3.2. Thermal dehydration behavior
Fig. 1 shows the TG–DTG–DTA curves for the thermal dehydration of CC-DH (300–500 μm) at a β of 5 K min−1 in a stream of dry N2 (qv = 100 cm3 min−1). Repeated measurements (N = 7) showed the average value of the total mass loss to be 24.6 ± 0.7%, which corresponds to the calculated value for the thermal dehydration of CC-DH to form anhydride (eqn (1), calculated value: 24.5%). Notably, from the TG–DTG–DTA curves (Fig. 1), both the DTG and endothermic DTA curves exhibited two distinguishable peaks, indicating the contribution of two partially overlapping processes to the formation of CC-AH. This observation is consistent with that previously reported by Karunadasa et al.21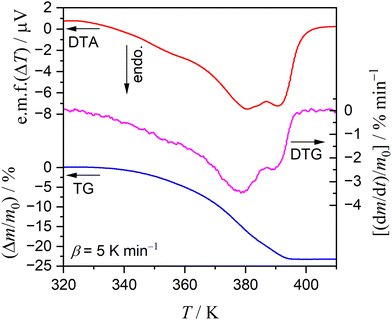 | ||
| Fig. 1 TG–DTG–DTA curves for the thermal dehydration of CC-DH (300–500 μm; m0 = 2.89 mg) to form CC-AH recorded at a β of 5 K min−1 in a stream of dry N2 (qv = 100 cm3 min−1). | ||
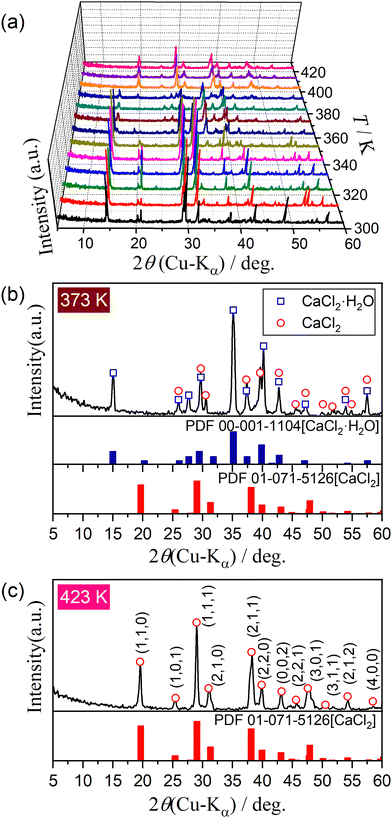
Fig. 2 shows the changes in the XRD patterns during the heating of CC-DH using the stepwise isothermal heating program in a stream of dry N2. Three XRD patterns were observed during heating from room temperature to 323 K (Fig. 2(a)). Attenuation of XRD peaks attributed to CC-DH started between 333 and 343 K, and an XRD pattern of monohydrate phase (CC-MH, PDF 00-001-1104)43 appeared, accompanied by minor diffraction peaks attributed to CC-AH (tetragonal, SG = P42/mnm(136), a = b = 6.3972, c = 4.1926, α = β = γ = 90.000, ICCD-PDF 01–071–5126)44 (Fig. 2(b)). The appearance of mixed phases of CC-MH and CC-AH midway during the thermal dehydration of CC-DH has also been reported by Karunadasa et al.21 The reaction initiation temperature determined by the XRD measurements agreed with that determined by the TG–DTG–DTA measurements with reference to the initiation of the mass loss process. The diffraction peaks of the CC-MH intermediate started to attenuate at temperatures between 383 and 393 K, and the XRD pattern at temperatures greater than 403 K perfectly agreed with that of CC-AH (Fig. 2(c)). The temperature range of the dehydration of the CC-MH intermediate, i.e., 383–403 K, corresponds to the temperature range of the second DTG and DTA peaks in Fig. 1. Thus, the thermal dehydration of CC-DH to CC-AH proceeds abstractly in two reaction steps via the CC-MH intermediate.
3.3. Formal kinetic analysis of the overall reaction
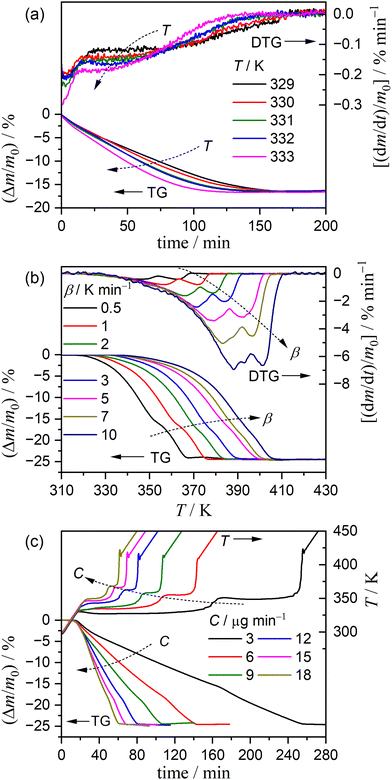
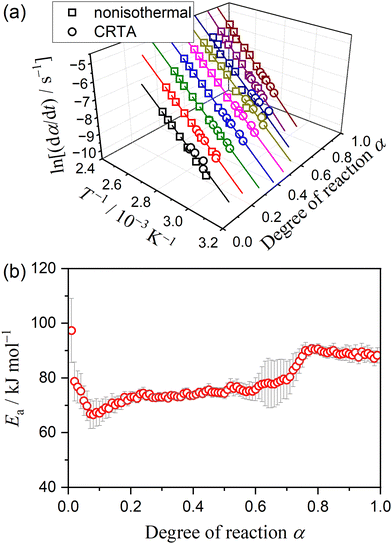
Fig. 3 shows the TG–DTG curves for the thermal dehydration of CC-DH under isothermal and linear nonisothermal conditions in a stream of dry N2, as well as the TG–temperature profile curves under CRTA conditions. Under isothermal conditions at a temperature around the reaction initiation temperature (Fig. 3(a)), the mass loss process terminated midway before the thermal dehydration was completed to form CC-AH. The mass loss value reached 16.4 ± 0.8%, which is greater than the mass loss value corresponding to the formation of a single CC-MH phase (12.2%) and less than that of complete dehydration to CC-AH (24.5%). The DTG curves exhibited a sharp peak at the early stage of the mass loss process and subsequently a gradual mass loss. The reaction rate systematically increased with increasing measurement temperature in both early-stage and subsequent gradual mass loss processes. The TG–DTG curves under linear nonisothermal conditions exhibited the total mass loss value of 24.8 ± 0.5% (Fig. 3(b)), which approximately corresponds to the formation of CC-AH. Two distinguishable DTG peaks were observed during the overall mass loss process, irrespective of β. TG curves also showed two mass loss steps, in which the mass loss stopped temporarily at a mass loss value slightly exceeding that corresponding to CC-MH formation. Both mass loss steps systematically shifted to higher temperatures with increasing β. The total mass loss value determined by the TG curves under CRTA conditions also corresponded to the CC-AH formation (24.3 ± 0.6%; Fig. 3(c)). The temperature profile under CRTA conditions exhibited a two-step temperature variation to complete thermal dehydration. The two-step mass loss process was also detected by TG as a slight change in the slope of the constant rate mass loss. The border of the two mass loss steps appeared at a mass loss value that slightly exceeded the formation of a single CC-MH phase, as in the reactions under linear nonisothermal conditions. The temperature profile curve systematically shifted to higher temperatures with increasing C in both mass loss steps. An overview of the TG–DTG curves of the three heating program modes shows that the thermal dehydration of CC-DH to form CC-AH under linear nonisothermal and CRTA conditions can be interpreted as a partially overlapping two-step process. Furthermore, the mass loss process observed under isothermal conditions is expected to correspond to the first mass loss step under linear nonisothermal and CRTA conditions.The TA curves recorded under linear nonisothermal and CRTA conditions were converted to kinetic curves by calculating the degree of reaction (α) with reference to the total mass loss value to form CC-AH. The multistep dehydration behavior was examined by analyzing the isoconversional kinetic relationship at each α value based on the logarithmic form of the differential kinetic equation for the single-step reaction.45–47
 | (4) |
3.4. Two-step kinetic modeling
Because of the presence of CC-MH as the intermediate product during the thermal dehydration of CC-DH to form CC-AH and the variation of Ea value from 70 to 90 kJ mol−1 midway through the reaction, as well as the two-step mass loss behavior observed by TG–DTG curves under linear nonisothermal and CRTA conditions, kinetic modeling as an independent two-step reaction was initially attempted by assuming the chemical reaction pathway viaeqn (2) and (3). For an overview of the expected two-step reaction, DTG curves recorded under linear nonisothermal conditions were separated by fitting using the statistical function, Fi(t). | (5) |
with
 | (6) |
| f(α) = αm(1 − α)n[−ln(1 − α)]p | (7) |
Peak separation analysis using MDA was further refined based on the cumulative kinetic equation for the independent multistep process.8,35,36,39
 | (8) |
 | (9) |
| Program mode | i | c i | E a,i/kJ mol−1 | A i /s−1 | SB(mi, ni, pi) |
R
2![[thin space (1/6-em)]](https://www.rsc.org/images/entities/char_2009.gif)
|
||
|---|---|---|---|---|---|---|---|---|
| m i | n i | p i | ||||||
| a Determination coefficient of the nonlinear least-squares analysis. | ||||||||
| Linear nonisothermal | 1 | 0.63 ± 0.01 | 72.7 ± 0.2 | (6.46 ± 0.01) × 107 | −0.66 ± 0.01 | 0.70 ± 0.02 | 0.71 ± 0.02 | 0.9969 |
| 2 | 0.37 ± 0.01 | 81.5 ± 0.3 | (1.06 ± 0.01) × 109 | −0.50 ± 0.01 | 1.05 ± 0.02 | 1.12 ± 0.02 | ||
| CRTA | 1 | 0.67 ± 0.02 | 72.7 ± 0.2 | (6.46 ± 0.01) × 107 | −0.67 ± 0.02 | 0.69 ± 0.01 | 0.69 ± 0.02 | 0.9887 |
| 2 | 0.33 ± 0.02 | 81.6 ± 0.2 | (1.05 ± 0.01) × 109 | −0.52 ± 0.01 | 1.00 ± 0.02 | 1.08 ± 0.02 | ||
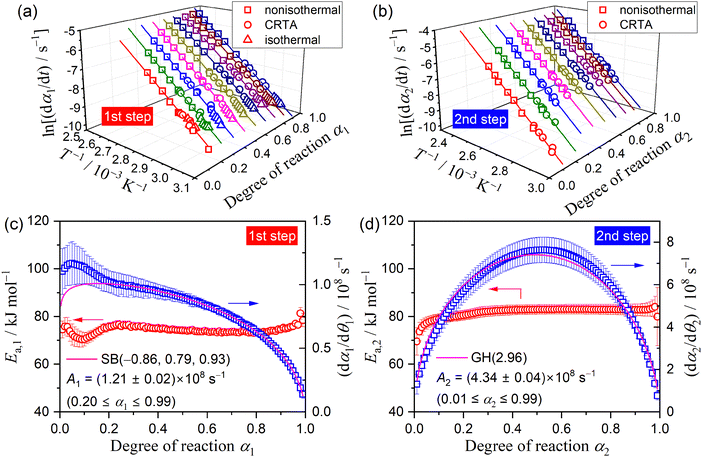
Using the KDA results, kinetic curves of each reaction step under linear nonisothermal and CRTA conditions were created for the first and second reaction steps (Fig. S11 and S12, respectively, ESI†). The KDA results were further inspected by analyzing the separated kinetic curves through formal kinetic analysis comprising the Friedman plot (eqn (4)) and subsequent master plot method (eqn (6)), for which the kinetic curves recorded under isothermal conditions (Fig. 3(a)) were merged into a series of kinetic curves of the first reaction step. Fig. 6 shows the results of the formal kinetic analysis of each reaction step. In both reaction steps, the Friedman plots exhibited significant linear correlations at each αi value (Fig. 6(a) and (b)). The Ea values were approximately constant in the major part of each reaction step: Ea,1 = 74.5 ± 1.1 kJ mol−1 (0.20 ≤ α1 ≤ 0.80; Fig. 6(c)) and Ea,2 = 82.7 ± 0.7 kJ mol−1 (0.20 ≤ α2 ≤ 0.90; Fig. 6(d)). However, distinguishable deviations of the Ea,i values from the average value of each reaction step were observed for the initial (α1 ≤ 0.20) and final (α1 ≥ 0.80) stages of the first reaction step and the initial stage of the second reaction step (α2 ≤ 0.20). The experimental master plot for the first reaction step exhibited a deceleration trend (Fig. 6(c)), but dα1/dθ1 values in the initial stage (α1 ≤ 0.20) deviated from the SB(−0.86, 0.79, 0.93) curve, which provided the best fit for the latter stage of the first reaction step (0.20 ≤ α1 ≤ 0.99). The deviation of Ea,1 and dα1/dθ1 values in the initial stage of the first reaction step indicates the necessity to consider alternative reactions step in the initial stage of the overall reaction.
The experimental master plot of the second reaction step (Fig. 6(d)) was a smooth curve with the maximum midway through the reaction at α2 = 0.53. In the scheme of a contracting geometry-type model, such rate behavior is expected for the phase-boundary-controlled model with an acceleration of the linear advancement rate of the reaction interface as the reaction advances, as described by the Galwey–Hood model, GH(n):12,58
| f(α) = 2n(1 − α)1−1/n[1 − (1 − α1/n)]1/2 | (10) |
3.5. Three-step kinetic modeling based on chemical and physico-geometrical schemes
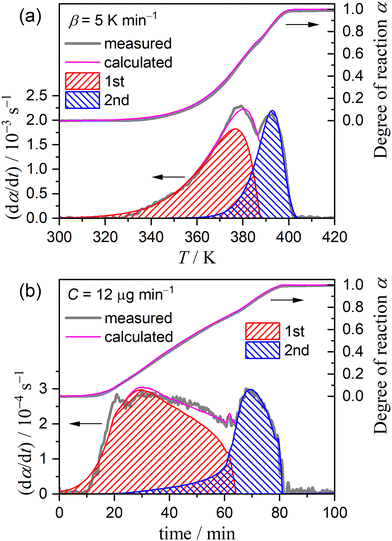
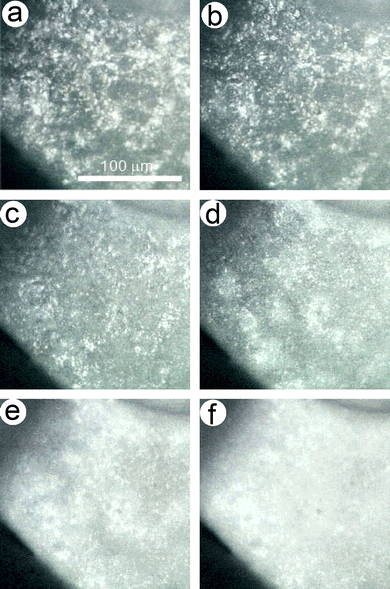
Several issues were found in the preliminarily examined two-step kinetic modeling: (1) the contribution of the first reaction step exceeded the ideal value of 0.5 estimated for the thermal dehydration of CC-DH to form CC-MH (Fig. 5 and Table 1); (2) a variation in the apparent Ea,1 value was observed before and after at α1 = 0.2 (Fig. 6(c)); and (3) the shape of the experimental master plot varied before and after α1 = 0.2 (Fig. 6(c)). Fig. 7 shows changes in the surface morphology of a selected sample particle observed when heated at a β = 5 K min−1 in a stream of dry N2 (qv = 100 cm3 min−1). The original sample surfaces were characterized by a roughened texture (Fig. 7(a)), attributable to partial deliquescence of the particle surface in an ambient air and subsequent dehydration to CC-DH in a stream of dry N2. In the initial stage of thermal dehydration of CC-DH (Fig. 7(b) and (c)), the surfaces were reconstructed to have a smoother texture because of the surface reaction. At the established stage of the first reaction step, the surface texture changed by forming holes to be the diffusion path of the water vapor produced by the internal reaction (Fig. 7(d)). Thereafter, in the overlapping stage of the first and second reaction steps, dramatic changes in the surface texture were observed (Fig. 7(e) and (f)). Therefore, the previously separated first reaction step can be further separated into two reaction steps characterized by the surface and internal reaction processes, and the overall reaction can be described as a partially overlapping three-step model based on both the chemical reaction pathway and the physico-geometrical constraints of the solid-state reaction. Notably, the previously separated second reaction step is to be the third reaction step in the three-step kinetic modeling.Practically, the KDA for the overall process was reexamined by setting the total number of reaction steps to three (N = 3 in eqn (8)). The initial values of the kinetic parameters of the second and third reaction step were substituted from the optimized kinetic parameters of the first and second reaction steps in the previous two-step kinetic modeling. For the newly introduced first reaction step in the three-step kinetic modeling, the average Ea,1 value in 0.01 ≤ α1 ≤ 0.20 in the two-step kinetic modeling was adapted as the initial Ea,1 value. The kinetic exponents in SB(m1, n1, p1) were tentatively set to SB(0, 1, 0), which corresponds to the first-order rate law. Thereafter, the order of the initial A1 value in the three-step kinetic modeling was graphically determined. Using the basal numerical settings, KDA was performed for each overall kinetic curve recorded under linear nonisothermal and CRTA conditions for optimizing the kinetic parameters of the first and second reaction steps in the three-step model. Similarly, the overall kinetic curves recorded under isothermal conditions were subjected to KDA of the two-step process corresponding to the first and second reaction steps in the three-step model, because these only covered the first reaction step in the two-step kinetic modeling for the overall process of thermal dehydration of CC-DH to form CC-AH.
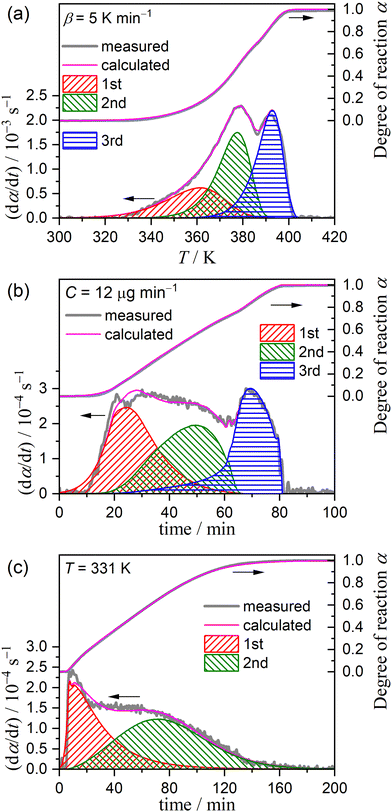
Fig. 8 shows typical KDA results for the thermal dehydration of CC-DH to form CC-AH, assuming an independent three-step process, while the results for all kinetic curves under linear nonisothermal, CRTA, and isothermal conditions are shown in Fig. S13–S15 (ESI†), respectively. Table 2 lists the kinetic parameters determined by KDA. The three-step kinetic modeling resulted in the contributions of component steps being (c1, c2, c3) = (0.26 ± 0.02, 0.37 ± 0.01, 0.37 ± 0.01) and (c1, c2, c3) = (0.34 ± 0.03, 0.33 ± 0.02, 0.33 ± 0.02) under linear nonisothermal and CRTA conditions, respectively. Notably, the relative contributions c2 and c3 are comparable under both linear nonisothermal and CRTA conditions, although a detectable difference in c1 can be found between the two heating conditions. The other kinetic parameters were practically invariant between linear nonisothermal and CRTA conditions. Comparing the first and second reaction steps, slightly greater Ea (kJ mol−1) and A (s−1) values for the second reaction step were observed, e.g., (Ea,1, Ea,2) = (66.8 ± 0.8, 72.5 ± 0.4) and (A1, A2) = ((2.47 ± 0.03) × 107, (1.16 ± 0.03) × 108) under linear nonisothermal conditions. Notably, the Ea,3 and A3 values were the same as the respective values determined for the second reaction step in the previously examined two-step kinetic modeling. In addition, in each reaction step, the kinetic model function characterized by the kinetic exponents in SB(mi, ni, pi) was comparable between the reactions under linear nonisothermal and CRTA conditions.
| Program mode | i | c i | E a,i/kJ mol−1 | A i /s−1 | SB(mi, ni, pi) |
R
2![[thin space (1/6-em)]](https://www.rsc.org/images/entities/char_2009.gif)
|
||
|---|---|---|---|---|---|---|---|---|
| m i | n i | p i | ||||||
| a Determination coefficient of the nonlinear least-squares analysis. | ||||||||
| Linear nonisothermal | 1 | 0.26 ± 0.02 | 66.8 ± 0.8 | (2.47 ± 0.03) × 107 | 0.11 ± 0.01 | 0.93 ± 0.06 | 0.11 ± 0.01 | 0.9985 |
| 2 | 0.37 ± 0.01 | 72.5 ± 0.4 | (1.16 ± 0.03) × 108 | −0.61 ± 0.02 | 1.07 ± 0.08 | 1.13 ± 0.03 | ||
| 3 | 0.37 ± 0.01 | 81.5 ± 0.3 | (1.06 ± 0.01) × 109 | −0.50 ± 0.01 | 1.05 ± 0.02 | 1.12 ± 0.02 | ||
| CRTA | 1 | 0.34 ± 0.03 | 67.0 ± 0.3 | (2.44 ± 0.01) × 107 | 0.09 ± 0.01 | 0.92 ± 0.01 | 0.10 ± 0.01 | 0.9918 |
| 2 | 0.33 ± 0.02 | 72.4 ± 0.3 | (1.19 ± 0.01) × 108 | −0.58 ± 0.01 | 1.04 ± 0.01 | 1.16 ± 0.02 | ||
| 3 | 0.33 ± 0.02 | 81.8 ± 0.6 | (1.05 ± 0.01) × 109 | −0.52 ± 0.01 | 1.00 ± 0.02 | 1.08 ± 0.02 | ||
| Isothermal | 1 | 0.42 ± 0.01 | 66.5 ± 0.4 | (2.49 ± 0.01) × 107 | 0.10 ± 0.01 | 1.12 ± 0.05 | 0.11 ± 0.01 | 0.9641 |
| 2 | 0.58 ± 0.01 | 71.9 ± 0.2 | (1.17 ± 0.01) × 108 | −0.57 ± 0.01 | 1.31 ± 0.04 | 1.18 ± 0.01 | ||
In the scheme of the three-step kinetic modeling for the thermal dehydration of CC-DH to form CC-AH, the reaction under isothermal conditions, which paused midway through the mass loss process, can be interpreted as corresponding to the process comprising the first two reaction steps. The separation of the isothermal mass loss process into independent two-step processes by KDA (Fig. 8(c)) resulted in kinetic parameters comparable to those determined for the first and second reaction steps under linear nonisothermal and CRTA conditions (Table 2).
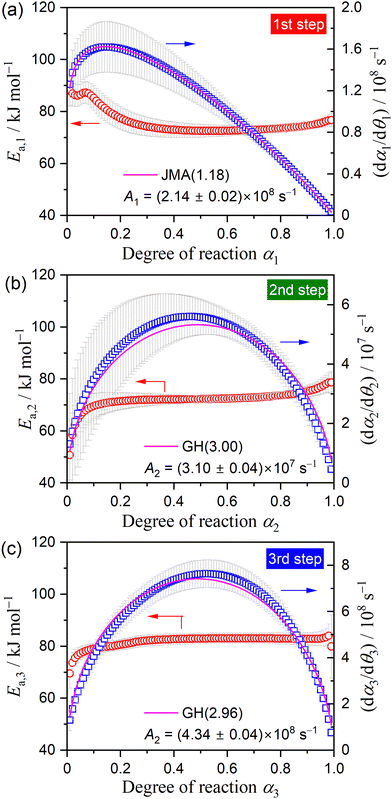
The KDA results for each overall kinetic curve provided a series of kinetic curves under linear nonisothermal, CRTA, and isothermal conditions for the first and second reaction steps in the three-step kinetic modeling (Fig. S16 and S17, ESI†). These kinetic curves were reanalyzed using a formal kinetic procedure comprising isoconversional and master plot methods. Friedman plots with a statistically significant linear correlation at different αi values in each reaction step were observed for both the first and second reaction steps (Fig. S18, ESI†). Fig. 9 shows the Ea,i values at different αi values and the experimental master plots of (dαi/dθi) versus αi for the three component steps, in which the results of the third reaction step are equivalent to those of the second reaction step in the two-step kinetic modeling described above (Fig. 6(d)). For the first reaction step, the Ea,1 value initially decreased from 87 to 75 kJ mol−1 (α1 < 0.2) and subsequently maintained an approximately constant value with the average of 73.4 ± 1.2 kJ mol−1 to the end of the first reaction step (Fig. 9(a)), which is slightly greater than that determined by KDA. The contribution of the thermal dehydration of the CC-DH surface recovered by the dehydration of deliquescence portion is possibly the cause of the variation in the Ea,1 value in the initial stage of the first reaction step. However, the difference in c1 values observed between the linear nonisothermal and CRTA conditions (Table 2) indicates the possibility that the surface reaction expands beyond the deliquescence portion. The experimental master plot drawn using the average Ea,1 value initially exhibited acceleration behavior in the α1 range of the initial Ea,1 decrease (α1 < 0.2) and subsequently switched to deceleration behavior. According to eqn (6), the experimental master plot was well fitted by a nucleation and growth type model known as the Johnson–Mehl–Avrami model (eqn (11)),59–62 JMA(m), with m = 1.18 ± 0.01 and A1 = (2.14 ± 0.01) × 108 s−1.
| f(α) = m(1 − α)[−ln(1 − α)]1−1/m | (11) |
For the second reaction step (Fig. 9(b)), an approximately constant Ea,2 value with an average value of 72.4 ± 0.5 kJ mol−1 was obtained during the main stage of the reaction step (0.2 ≤ α2 ≤ 0.8). The experimental master plot exhibited the maximum reaction rate at α2 = 0.46 and closely fitted using the GH(3.00) model (eqn (10)), providing A2 = (3.10 ± 0.04) × 107 s−1. The Friedman plot for the third reaction step provided an Ea,3 value comparable to that determined by KDA, i.e., Ea,3 = 82.7 ± 0.7 kJ mol−1 (0.20 ≤ α2 ≤ 0.90; Fig. 9(c)). Notably, the rate behavior characterized by the experimental master plot for the third reaction step with the maximum rate at α3 = 0.53 is comparable with that for the second reaction step. The experimental master plot of the third reaction step was satisfactorily fitted by the GH(n) model with the optimized kinetic exponent n = 2.96 ± 0.08 and A3 = (4.34 ± 0.04) × 108 s−1. Because the contributions c2 and c3 were practically identical, the second and third reaction steps are expected to occur successively with the same geometrical constraints of the three-dimensional (3D) interface shrinkage characterized by the acceleration of the linear advancement rate of the reaction interface as described by the GH(∼3).
Fig. 10 shows a model of the physico-geometrical reaction pathway developed based on the kinetic results of the three-step kinetic modeling for the thermal dehydration of CC-DH in a stream of dry N2. The first reaction step occurred on the CC-DH particle surface (Fig. 10(a)), supported by the microscopic observation of the changes in the surface morphology (Fig. 7). It is also reasonable that the surface reaction was regulated by a nucleation and growth type kinetic model (Fig. 9(a)), indicating the consumption of the surface portion of CC-DH particles. In addition to the potential reactivity of the reactant surface for the thermal dehydration of solids, deformation of the surface morphology by partial deliquescence in ambient air during the weighing the sample particles and subsequent dehydration of the liquefied surface portion to CC-DH in a stream of dry N2 can further enhance the reactivity of the CC-DH particle surfaces.
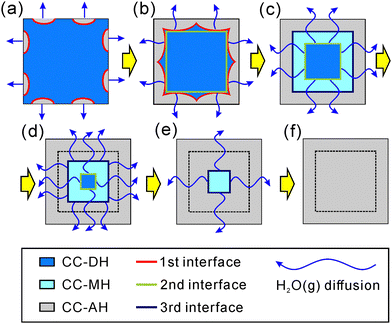 | ||
| Fig. 10 Schematic representation of the physico-geometrical reaction pathway for the three-step thermal dehydration of CC-DH to form CC-AH in a stream of dry N2. | ||
The formation of the surface product layer and its blocking action of the diffusional removal of water vapor generated at the reaction interface advancing inward toward the particle center is a possible cause for the switching of the physico-geometrical reaction mode to the subsequent reaction step because of the increase in p(H2O) at the reaction interface. In some reversible thermal dehydration of inorganic hydrates such as calcium sulfate dihydrate,26,63–65 the change in p(H2O) alters not only the physico-geometrical reaction mechanism but also the chemical reaction pathway by forming intermediate hydrates different from the solid product of the surface reaction. The second reaction step of the thermal dehydration of CC-DH was geometrically constrained by the 3D interface shrinkage (Fig. 9(b); Fig. 10(b) and (c)). The same geometrical constraint was expected for the third reaction step (Fig. 9(c); Fig. 10(d)–(f)). In addition, the contributions c2 and c3 for the second and third reaction steps to the overall process were practically identical. Therefore, the chemical reactions for the second and third reaction steps can be explained by the thermal dehydration from CC-DH to form CC-MH (eqn (2)) and from CC-MH to form CC-AH (eqn (3)), respectively. Notably, the presence of both CC-MH and CC-AH phases midway through the reaction was confirmed by XRD (Fig. 2(b)). The successive advancement of two separated reaction interfaces of CC-MH–CC-DH and CC-AH–CC-MH in the internal particles is indicated by the same geometrical constraint for these reaction steps occurring by partially overlapping (Fig. 10(c)–(f)).
In the three-step model, the first reaction step should be the thermal dehydration of CC-DH to form CC-AH without forming a CC-MH intermediate. Thus, switching from the first to second reaction steps is accompanied by a change in the reaction mode from direct dehydration to the formation of CC-AH to the formation of intermediate CC-MH induced by the increase in p(H2O) at the internal reaction interface of CC-AH–CC-DH. The hypothesis of the change in the reaction mode induced by the increase in p(H2O) is partially supported by the thermal dehydration behavior of CC-DH in the presence of atmospheric water vapor. In a stream of wet N2 gas characterized by a p(H2O) value of 4.2 kPa, the first reaction step disappears, and the two-step mass loss process with practically the same contribution as explained by eqn (2) and (3) is observed by the TG measurement (Fig. S19, ESI†).
The other specific characteristics of the thermal dehydration behavior are due to the acceleration of the linear advancement rate of the reaction interface in the 3D contracting geometry scheme observed in both the second (Fig. 9(b)) and third (Fig. 9(c)) reaction steps. The second reaction step is initiated by overlapping with the first reaction step of the surface reaction process. The diffusional removal of the water vapor produced at the reaction interface of the second reaction step is initially retarded by the relatively high p(H2O) in the diffusion path because of the water vapor produced by the surface reaction process (the first reaction step). The p(H2O) value in the surface product layer gradually decreases as the first reaction step is terminated, which accelerates the linear advancement rate of the reaction interface of the second reaction step. In the third reaction step, the high p(H2O) at the reaction interface is because of the supply of water vapor from the internal reaction interface of the second reaction step (dehydration of CC-DH to form CC-MH). The supply also gradually decreases as the second reaction step proceeds to the end, and the gradual decrease in p(H2O) at the reaction interface of the third reaction step accelerates the linear advancement rate of the reaction interface. In the second and third reaction steps, the acceleration behavior of the linear advancement rate of the reaction interface can be attributed to the decrease in p(H2O) at the reaction interface as the previous reaction step proceeds to the end.
4. Conclusions
On heating CC-DH in a stream of dry N2, CC-AH was produced via partially overlapping multistep mass loss processes (Fig. 1). The primary cause of the multistep thermal dehydration was the formation of intermediate CC-MH midway during the overall thermal dehydration, as observed by XRD (Fig. 2(b)). However, the two-step kinetic modeling based on the reaction pathway of the thermal dehydration of CC-DH to form CC-AH via CC-MH (Fig. 5) resulted in an excess contribution c1 of the first reaction step beyond that expected from the reaction stoichiometry of eqn (2) and (3), i.e., 0.5. The kinetic results of the first reaction step in the two-step kinetic modeling exhibited variations in the Ea,1 value in the initial part of the reaction step, accompanied by a specific trend of the experimental master plot different from the subsequent process (Fig. 6(c)). Microscopically, the initial part of the first reaction step was confirmed to occur by nucleation and growth on the particle surface (Fig. 7). Therefore, the subsequent process in the first reaction step in the two-step kinetic modeling could proceed by the movement of the reaction interface generated by the surface reaction inward toward the particle center.Considering both the chemical reaction pathway and physico-geometrical constraints of the solid-state reaction, the overall thermal dehydration process was remodeled as a partially overlapping three-step process (Fig. 8), in which the third reaction step corresponded to the second reaction step in the previous two-step kinetic modeling. The comparable contributions of the second and third reaction steps, c2 = c3, were observed from the kinetic results of the three-step kinetic modeling (Table 2), indicating that the second and third reaction steps corresponded to the thermal dehydration from CC-DH to CC-MH (eqn (2)) and from CC-MH to CC-AH (eqn (3)), respectively, which in turn indicated that thermal dehydration proceeded directly from CC-DH to CC-AH during the first reaction step described by the surface nucleation and growth type model of JMA(∼1.2) with the apparent Arrhenius parameters of Ea,1 = ∼67 kJ mol−1 and A1 = ∼2.5 × 10⁷ s−1 (Fig. 9(a)). Because the first reaction step in the three-step kinetic modeling formed the surface product layer, the second reaction step of the thermal dehydration of CC-DH to form CC-MH was geometrically constrained by the 3D shrinkage of the reaction interface in the geometrical scheme of the core–shell structure of the CC-DH core and CC-AH shell. The acceleration of the linear advancement rate of the reaction interface as the reaction proceeded was the specific characteristic of the second reaction step, which was described by the GH(3) model with Ea,2 = ∼72 kJ mol−1 and A2 = ∼108 s−1 (Fig. 9(b)). The same physico-geometrical reaction mechanism accompanied by the acceleration of the linear advancement rate of the reaction interface was observed for the third reaction step of the thermal dehydration of CC-MH to form CC-AH with Ea,3 = ∼82 kJ mol−1 and A3 = ∼109 s−1 (Fig. 6(d) and 9(c)). The geometrical relationship between the partially overlapping second and third reaction steps can be explained by the consecutive shrinkage of the two reaction interfaces of CC-DH–CC-MH (second step) and CC-MH–CC-AH (third step) in the particle core surrounded by the surface product layer of CC-AH produced during the first reaction step. In the three-step kinetic modeling, the switching of the chemical reaction mode from the direct dehydration of CC-DH to CC-AH in the first reaction step to the dehydration of CC-DH to the CC-MH intermediate in the second step is attributable to the difference in p(H2O) in each reaction step, in which the first reaction step of the surface reaction occurs at a relatively low p(H2O) whereas the second reaction step of the internal interface shrinkage occurs at a relatively high self-generated p(H2O). The possible cause of the acceleration of the linear advancement rate of the reaction interface expected for the second and third reaction steps can also be explained by the gradual decrease in p(H2O) at the reaction interface as the respective previous reaction steps proceed to the end.
The example of the thermal dehydration of CC-DH in a stream of dry N2 is suggestive of the kinetic analysis of the multistep thermal dehydration of inorganic hydrates. The multistep reaction behavior should be interpreted based on both the chemical reaction scheme determined by the thermodynamics of the phase relationship and the physico-geometrical kinetic features of the solid-state reaction. The physico-geometrical constraints create specific reaction conditions during the individual reaction steps, especially p(H2O) generated by the reaction itself. The phase relation for the thermal dehydration is altered by the self-generated p(H2O) at the reaction sites, which causes the thermal dehydration mode to switch, forming different intermediate hydrates. The variation in self-generated p(H2O) during each reaction step, caused by the progress and termination of the previous reaction step as well as the progress of the present reaction step, directly influences the kinetics of the relevant reaction step. Because of the complex interaction of the phase relation for the thermal dehydration and the self-generated reaction conditions originating from the physico-geometrical kinetic features of the component reaction steps, the chemical reaction pathway and kinetics of the multistep thermal dehydration of inorganic hydrates can dramatically change depending on the preset reaction conditions, including sample particle size, sample mass, heating condition, and atmospheric p(H2O).
Conflicts of interest
There are no conflicts of interest to declare.Acknowledgements
The present work was supported by JSPS KAKENHI Grant Numbers 19K02708, 22H01011, and 22K02946.References
- H. U. Rammelberg, T. Schmidt and W. Ruck, Energy Procedia, 2012, 30, 362–369 CrossRef CAS
.
- K. E. N’Tsoukpoe, T. Schmidt, H. U. Rammelberg, B. A. Watts and W. K. L. Ruck, Appl. Energy, 2014, 124, 1–16 CrossRef
.
- F. Trausel, A.-J. de Jong and R. Cuypers, Energy Procedia, 2014, 48, 447–452 CrossRef CAS
.
- P. A. J. Donkers, L. C. Sögütoglu, H. P. Huinink, H. R. Fischer and O. C. G. Adan, Appl. Energy, 2017, 199, 45–68 CrossRef CAS
.
-
A. K. Galwey and M. E. Brown, Thermal Decomposition of Ionic Solids, Elsevier, Amsterdam, 1999 Search PubMed
.
- A. K. Galwey, Thermochim. Acta, 2000, 355, 181–238 CrossRef CAS
.
- N. Koga and H. Tanaka, Thermochim. Acta, 2002, 388, 41–61 CrossRef CAS
.
-
N. Koga, in Handbook of Thermal Analysis and Calorimetry, ed. S. Vyazovkin, N. Koga and C. Schick, Elsevier, Amsterdam, 2018, 2nd edn, vol. 6, ch. 6, pp. 213–251 Search PubMed
.
- N. Koga, S. Vyazovkin, A. K. Burnham, L. Favergeon, N. V. Muravyev, L. A. Pérez-Maqueda, C. Saggese and P. E. Sánchez-Jiménez, Thermochim. Acta, 2023, 719, 179384 CrossRef CAS
.
- H. Tanaka and N. Koga, J. Phys. Chem., 1988, 92, 7023–7029 CrossRef CAS
.
- N. Koga and H. Tanaka, J. Phys. Chem., 1994, 98, 10521–10528 CrossRef CAS
.
- T. Wada and N. Koga, J. Phys. Chem. A, 2013, 117, 1880–1889 CrossRef CAS PubMed
.
- T. Wada, M. Nakano and N. Koga, J. Phys. Chem. A, 2015, 119, 9749–9760 CrossRef CAS PubMed
.
- M. Hara and N. Koga, Phys. Chem. Chem. Phys., 2023, 25, 12081–12096 RSC
.
- M. Hotta, T. Tone and N. Koga, J. Phys. Chem. C, 2021, 125, 22023–22035 CrossRef CAS
.
- M. Molenda, J. Stengler, M. Linder and A. Wörner, Thermochim. Acta, 2013, 560, 76–81 CrossRef CAS
.
- K. E. N'Tsoukpoe, H. U. Rammelberg, A. F. Lele, K. Korhammer, B. A. Watts, T. Schmidt and W. K. L. Ruck, Appl. Therm. Eng., 2015, 75, 513–531 CrossRef
.
- C. Barreneche, A. I. Fernández, L. F. Cabeza and R. Cuypers, Appl. Energy, 2015, 137, 726–730 CrossRef CAS
.
- H. U. Rammelberg, T. Osterland, B. Priehs, O. Opel and W. K. L. Ruck, Sol. Energy, 2016, 136, 571–589 CrossRef CAS
.
- A. D. Pathak, S. Nedea, H. Zondag, C. Rindt and D. Smeulders, Phys. Chem. Chem. Phys., 2016, 18, 10059–10069 RSC
.
- K. S. P. Karunadasa, C. H. Manoratne, H. M. T. G. A. Pitawala and R. M. G. Rajapakse, J. Phys. Chem. Solids, 2018, 120, 167–172 CrossRef CAS
.
- M. Gaeini, A. L. Rouws, J. W. O. Salari, H. A. Zondag and C. C. M. Rindt, Appl. Energy, 2018, 212, 1165–1177 CrossRef CAS
.
- S. Wei, R. Han, Y. Su, W. Zhou, J. Li, C. Su, J. Gao, G. Zhao and Y. Qin, Energy Convers. Manage., 2020, 212, 112694 CrossRef CAS
.
- K. Heijmans, S. Nab, B. Klein Holkenborg, A. D. Pathak, S. Gaastra-Nedea and D. Smeulders, Comput. Mater. Sci., 2021, 197, 110595 CrossRef CAS
.
- Y. Yamamoto, L. Favergeon and N. Koga, J. Phys. Chem. C, 2020, 124, 11960–11976 CrossRef CAS
.
- J. G. D. Preturlan, L. Vieille, S. Quiligotti and L. Favergeon, J. Phys. Chem. C, 2020, 124, 26352–26367 CrossRef CAS
.
- Y. Zushi, S. Iwasaki and N. Koga, Phys. Chem. Chem. Phys., 2022, 24, 29827–29840 RSC
.
- M. Hotta, Y. Zushi, S. Iwasaki, S. Fukunaga and N. Koga, Phys. Chem. Chem. Phys., 2023, 25, 27114–27130 RSC
.
- M. Fukuda, L. Favergeon and N. Koga, J. Phys. Chem. C, 2019, 123, 20903–20915 CrossRef CAS
.
- N. Koga, L. Favergeon and S. Kodani, Phys. Chem. Chem. Phys., 2019, 21, 11615–11632 RSC
.
- S. Kodani, S. Iwasaki, L. Favergeon and N. Koga, Phys. Chem. Chem. Phys., 2020, 22, 13637–13649 RSC
.
- N. Koga, Y. Sakai, M. Fukuda, D. Hara, Y. Tanaka and L. Favergeon, J. Phys. Chem. C, 2021, 125, 1384–1402 CrossRef CAS
.
- M. Hotta, T. Tone, L. Favergeon and N. Koga, J. Phys. Chem. C, 2022, 126, 7880–7895 CrossRef CAS
.
- M. Hotta, L. Favergeon and N. Koga, J. Phys. Chem. C, 2023, 127, 13065–13080 CrossRef CAS
.
- N. Koga, Y. Goshi, S. Yamada and L. A. Pérez-Maqueda, J. Therm. Anal. Calorim., 2013, 111, 1463–1474 CrossRef CAS
.
- S. Vyazovkin, A. K. Burnham, L. Favergeon, N. Koga, E. Moukhina, L. A. Pérez-Maqueda and N. Sbirrazzuoli, Thermochim. Acta, 2020, 689, 178597 CrossRef CAS
.
- A. Perejón, P. E. Sánchez-Jiménez, J. M. Criado and L. A. Pérez-Maqueda, J. Phys. Chem. B, 2011, 115, 1780–1791 CrossRef PubMed
.
- R. Svoboda and J. Málek, J. Therm. Anal. Calorim., 2013, 111, 1045–1056 CrossRef CAS
.
- P. E. Sánchez-Jiménez, A. Perejón, J. M. Criado, M. J. Diánez and L. A. Pérez-Maqueda, Polymer, 2010, 51, 3998–4007 CrossRef
.
-
O. T. Sørensen and J. Rouquerol, Sample Controlled Thermal Analysis, Kluwer, Dordrecht, 2003 Search PubMed
.
- A. Leclaire and M. M. Borel, Acta Crystallogr., Sect. B: Struct. Crystallogr. Cryst. Chem., 1977, 33, 1608–1610 CrossRef
.
- D. Agarwal and V. K. Kasana, Int. Res. J. Pure Appl. Chem., 2019, 18, 1–10 CrossRef
.
- J. D. Hanawalt, H. W. Rinn and L. K. Frevel, Ind. Eng. Chem., Anal. Ed., 1938, 10, 457–512 CrossRef CAS
.
- M. A. C. Wevers, J. C. Schön and M. Jansen, J. Solid State Chem., 1998, 136, 233–246 CrossRef CAS
.
- S. Vyazovkin, A. K. Burnham, J. M. Criado, L. A. Pérez-Maqueda, C. Popescu and N. Sbirrazzuoli, Thermochim. Acta, 2011, 520, 1–19 CrossRef CAS
.
- N. Koga, J. Therm. Anal. Calorim., 2013, 113, 1527–1541 CrossRef CAS
.
-
N. Koga, J. Šesták and P. Simon, in Thermal Analysis of Micro, Nano- and Non-Crystalline Materials, ed. J. Šesták and P. Simon, Springer, Dordrecht, 2013, ch. 1, pp. 1–28 Search PubMed
.
- H. L. Friedman, J. Polym. Sci., Part C, 1964, 6, 183–195 CrossRef
.
- T. Ozawa, J. Therm. Anal., 1970, 2, 301–324 CrossRef CAS
.
- J. Málek, Thermochim. Acta, 1992, 200, 257–269 CrossRef
.
- N. Koga, Thermochim. Acta, 1995, 258, 145–159 CrossRef CAS
.
- F. J. Gotor, J. M. Criado, J. Málek and N. Koga, J. Phys. Chem. A, 2000, 104, 10777–10782 CrossRef CAS
.
- J. M. Criado, L. A. Pérez-Maqueda, F. J. Gotor, J. Málek and N. Koga, J. Therm. Anal. Calorim., 2003, 72, 901–906 CrossRef CAS
.
- T. Ozawa, Bull. Chem. Soc. Jpn., 1965, 38, 1881–1886 CrossRef CAS
.
- J. Šesták and G. Berggren, Thermochim. Acta, 1971, 3, 1–12 CrossRef
.
- J. Šesták, J. Therm. Anal., 1990, 36, 1997–2007 CrossRef
.
- J. Šesták, J. Therm. Anal. Calorim., 2011, 110, 5–16 CrossRef
.
- A. K. Galwey and W. J. Hood, J. Phys. Chem., 1979, 83, 1810–1815 CrossRef CAS
.
- W. A. Johnson and R. F. Mehl, Trans. Am. Inst. Min. Metall. Eng., 1939, 135, 416–442 Search PubMed
.
- M. Avrami, J. Chem. Phys., 1939, 7, 1103–1112 CrossRef CAS
.
- M. Avrami, J. Chem. Phys., 1940, 8, 212–224 CrossRef CAS
.
- M. Avrami, J. Chem. Phys., 1941, 9, 177–184 CrossRef CAS
.
- S. Iwasaki and N. Koga, Phys. Chem. Chem. Phys., 2020, 22, 22436–22450 RSC
.
- S. Iwasaki, Y. Zushi and N. Koga, Phys. Chem. Chem. Phys., 2021, 23, 22972–22983 RSC
.
- S. Iwasaki, Y. Zushi and N. Koga, Phys. Chem. Chem. Phys., 2022, 24, 9492–9508 RSC
.
Footnote |
| † Electronic supplementary information (ESI) available: S1. Sample characterization (Fig. S1–S5 and Table S1); S2. Two-step kinetic modeling (Fig. S6–S12 and Table S2); S3. Three-step kinetic modeling (Fig. S13–S19). See DOI: https://doi.org/10.1039/d4cp00790e |
| This journal is © the Owner Societies 2024 |

