
 Open Access Article
 This Open Access Article is licensed under a Creative Commons Attribution-Non Commercial 3.0 Unported Licence
Out-of-focus spatial map imaging of magnetically deflected sodium ammonia clusters†‡
D. P.
Borgeaud dit Avocat
 ,
H.
Yang
,
A.
Nitsche
,
J.
Wenger
,
B. L.
Yoder
and
R.
Signorell
*
,
H.
Yang
,
A.
Nitsche
,
J.
Wenger
,
B. L.
Yoder
and
R.
Signorell
*
Department of Chemistry and Applied Biosciences, ETH Zurich, CH-8093 Zurich, Switzerland. E-mail: ruth.signorell@phys.chem.ethz.ch
First published on 31st May 2024
Abstract
This paper introduces out-of-focus spatial map imaging (SMI) as a detection method for magnetic deflection of molecular/cluster beams, using Nam(NH3)n to illustrate its capabilities. This method enables imaging of the complete spatial distribution, simplifying measurements and allowing for cluster-size-resolved analysis by shifting away from traditional in-focus SMI conditions. Incorporating out-of-focus SMI with TOF-MS and velocity map imaging into a single setup allows for direct assessment of clusters' magnetic moments without needing to pre-select velocities. Key findings include a slower relaxation for Na(NH3)4 compared to Na(NH3)3 and Na(NH3)5, unexpectedly high deflection for larger clusters up to Na(NH3)9, hinting at changes in cluster dynamics as the first solvation shell closes. The study also covers the first measurements of Na2(NH3)1 and Na3(NH3)n, showing distinct deflection behaviors and underscoring the improved capabilities of the new detection method.
Introduction
The use of inhomogeneous magnetic fields in magnetic deflection experiments for atomic, molecular, or cluster beams has found diverse applications within the scientific community.1,2 The spatial deflection reveals direct information about the time-averaged projection of the magnetic moment on the deflection axis, thereby offering valuable new insights into the size and geometry of the deflected species.3–6 For example, magnetic deflection was used to gain information on the geometry of nanoalloys, composed of aluminium, gallium or indium tin clusters,4 sodium doped solvent clusters, with ammonia, water, methanol or dimethyl ether as a solvent,5 or the effect of oxidation on the magnetism of cobalt oxide clusters.6The original experiment by Stern and Gerlach, measured magnetic deflection by capturing an image of the detector and manually reading the distances of the deflected species from the undeflected position.7 Since their pioneering work, similar deflection experiments have been carried out on atoms, molecules, and clusters. The detection in these experiments can be grouped into three main categories: slit experiments, position-resolved mass spectrometry and imaging techniques.
Non-movable slit experiments quantify deflection by comparing the measured ion intensities that pass the slit with and without magnetic field.8,9 Scanning experiments involve displacing the slit10–12 or the ionization laser13–15 along the deflection axis and recording the mass signals at each displacement position. This provides more information on the spatial deflection pattern, but it is more time-consuming and may lead to intensity variations due to experimental instabilities.
Position-resolved mass spectrometry is an often employed detection technique in deflection experiments.16–20 This method exploits different flight times for different cluster positions to resolve deflection spectra for multiple masses in a single measurement, allowing the resolution of the position and mass simultaneously. However, as the ionization position is inferred from the time of flight, it does not directly offer an image of the deflection pattern, and requires a compromise between mass resolution and position resolution.
Abd El Rahim et al.21 extended the position-resolved mass spectrometry method for an electric deflection experiment to an imaging technique for the parallel measurement of 2-dimensional positions and time of flight, enabling the simultaneous collection of electric deflection of different masses. The experiment employed a Wiley–McLaren extraction setup coupled with an additional electrostatic lens and delay line detection. De Knif et al.6 implemented delay lines in their experiment to measure magnetic deflection using a reflectron time of flight mass spectrometer. Their setup combines spatial imaging with high mass resolution provided by the reflectron.
Velocity map imaging (VMI)22,23 has become a fundamental tool in various spectroscopic studies, including photoelectron spectroscopy,24,25 femto- and attosecond pump–probe spectroscopy26 and the dynamics of chemical reactions.27–29 The key to VMI's widespread application lies in its ability to precisely map the velocity coordinates of electrons or ions onto a detector, minimizing the influence of their initial spatial coordinates. Eppink and Parker extended this concept to map the spatial distribution of particles.22 This technique, spatial map imaging (SMI), is accomplished with the same electrostatic lens setup as VMI. Since then, SMI has found various applications in determining the spatial overlap of two lasers,30,31 to image the distribution of peptides and proteins on a surface,32 or to measure photoelectron spectra in combination with VMI.33 Stei et al.34 were the first to present a detailed characterisation of the mapping of the ions introduced by a six-plate extraction setup. They used a Taylor series up to second order to describe the mapping induced by the electrostatic lens.
In this work, we extend the work of Stei et al. using a Wiley McLaren extractor, where the extraction of the ions is described by a linear mapping of positions and velocities. This linear expression allows for easy calibration and a wide range of tunability for deflection measurements. The tunability allows fast measurements via VMI, time-of-flight mass spectrometry, and out-of-focus SMI. Combining the three methods allows for cluster-resolved measurements by mass-gating of the deflection setup. It also removes the necessity for velocity preselection of the clusters, as the distribution is measured with VMI.
Magnetic deflection of sodium ammonia clusters (Na(NH3)n, where 1 ≤ n ≤ 9, Na2(NH3)1, Na3(NH3)1, and Na3(NH3)2) are investigated with out-of-focus SMI. The obtained results are compared with a previous study,5 and the advantages of the new detection setup are highlighted.
Methods
Experimental
The general experimental setup used in this work is similar to setups previously used in our research group.5,9,35 Hence, only a brief description of the experiment is provided here. Fig. 1 shows a schematic representation.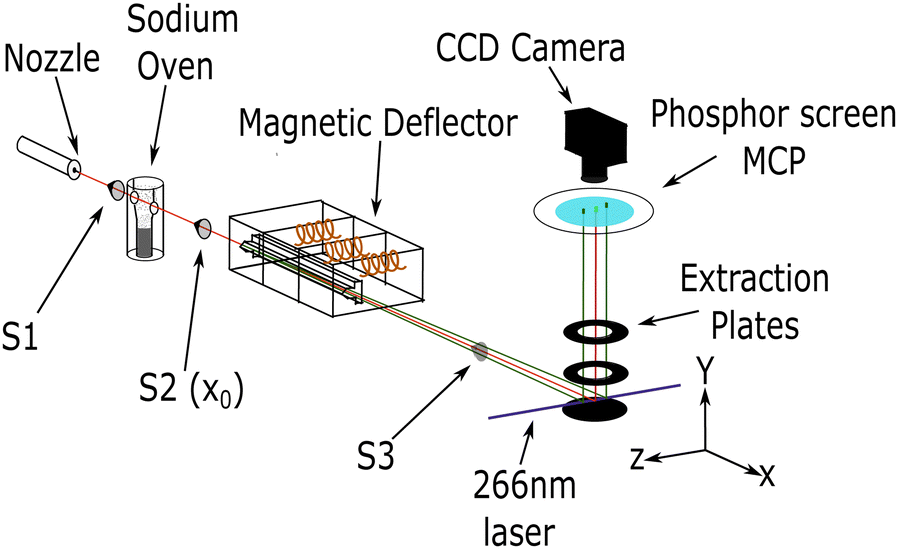 | ||
| Fig. 1 Sketch of the experimental setup consisting of four vacuum chambers separated by skimmers (S1–S3). The molecular beam trajectory for deflector-off measurements is represented by a red line, while the trajectory of a spin 1/2 particle with the deflector on is depicted by green lines. For deflection measurements, S3 was removed. | ||
Molecular clusters were generated with a continuous, neat supersonic expansion through a nozzle with a diameter of 50 μm. For ammonia gas, a pressure of 2.5 bar and a nozzle temperature between 20 °C and 100 °C was used. After passing the first skimmer (S1) (1.5 mm diameter), the resulting cluster beam of ammonia was doped with 1, 2, or 3 sodium atoms. An oven temperature of 230 °C was used for single doping, and 240 °C was used for multiple doping.36
Subsequently, the sodium-doped clusters passed through a 1 mm diameter skimmer (S2) and entered the deflection chamber, which houses the pulsed Stern–Gerlach (SG) deflector.5,9 The calibration measurements for out-of-focus SMI were performed with the deflector turned off and an additional final skimmer (S3) of 2 mm diameter (see ESI‡). For the spatially resolved deflection measurements, the skimmer S3 was removed and replaced with a 25 mm diameter hole to allow for the detection of all deflected clusters. To achieve the highest possible deflection in our pulsed SG setup, timings for the three coils in the magnetic deflector are synchronized with the laser pulse. The singly-doped ammonia clusters were measured with magnetic field pulses, as in our previous study (FWHM ≈ 300 μs).9 The multiply-doped clusters were measured with longer pulses (FWHM ≈ 500 μs), which match better the transit time of our cluster beam through the deflector.
When reaching the ionization region within the extraction optics, the neutral clusters were photoionized by a pulsed (7 ns) 266 nm (4.66 eV) Nd:YAG laser. The resulting photoions were extracted perpendicular to the molecular beam and the deflection/laser propagation axis. The extraction setup is comprised of 3 electrodes: a repeller, an extractor and a ground plate. These plates are uniformly spaced 30 mm apart, each with an outer diameter of 108 mm. Central holes with a diameter of 40 mm are featured in both the repeller and extractor plates. The spacing between the plates and the size of the holes have been increased compared with our previous study. This modification enhances the extraction of spatial information when measuring deflection.
The clusters were detected using either time-of-flight (TOF) mass spectrometry, mass-gated velocity map imaging (VMI) or mass-gated out-of-focus spatial map imaging (SMI). The perpendicular configuration of the deflection axis and TOF axis allows for the analysis of the spatial distribution of the deflected beam, as well as the determination of the molecular beam propagation velocities.
Computational
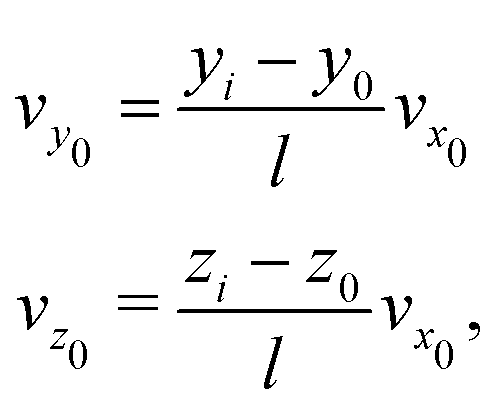
In this section, we summarize our modeling approaches used to simulate the deflection and mapping induced by the electrostatic lens, highlighting the improvements over the models employed in our previous work.5,9 The molecular dynamics (MD) simulations involve generating trajectories for clusters starting from the entry point of the deflector and extending up to the ionization region. The dimensions of the experimental setup, including the deflector dimensions, flight distances, skimmer diameters, skimmer positions, and ionization region, are incorporated into our model.The cluster's initial coordinates (y0, z0) were randomly sampled within the hole opening of the second skimmer (S2) placed at x0, while the velocity along the propagation direction (vx0) was experimentally determined by VMI measurements. The initial velocities in the perpendicular directions vy0, vz0 were determined from vx0 and the position of the cluster at the point of ionization (yi, zi) as measured by out-of-focus SMI:
 | (1) |
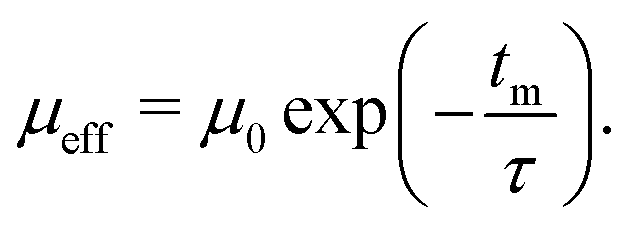
Within the deflector, the clusters were propagated as point particles with a given mass and a spin of 1/2 or 0. The equations of motion are solved using the Verlet algorithm. When deflection patterns deviate from the ideal spin 1/2 behavior, we employed the reduced deflection model outlined in our previous work.5 In this model, we scale the magnetic moment μ0 of an individual particle with defined spin ms = ±1/2 by an exponential decay function, defined by the interaction time with the magnetic field at time tm and a characteristic relaxation time τ:
 | (2) |
The ion trajectories were simulated using SIMION,37 where the geometry of our setup was incorporated. The results of the MD simulations were used as input for the SIMION simulations.
Results and discussion
Characterization of out-of-focus SMI
In 2-dimensional electrostatic imaging, the phase space coordinates at the point of ionization, denoted as![[r with combining right harpoon above (vector)]](https://www.rsc.org/images/entities/i_char_0072_20d1.gif) i = (x, z)T and
i = (x, z)T and ![[v with combining right harpoon above (vector)]](https://www.rsc.org/images/entities/i_char_0076_20d1.gif) i = (vx, vz)Ti, are mapped onto the detector's coordinates, which are represented by d. Utilizing a Wiley–McLaren extractor, we have observed that the final positions of the ions in the detection plane (along the x and z axis) can be determined through a linear mapping of their initial positions and velocities at ionization. This relationship is given as follows:
i = (vx, vz)Ti, are mapped onto the detector's coordinates, which are represented by d. Utilizing a Wiley–McLaren extractor, we have observed that the final positions of the ions in the detection plane (along the x and z axis) can be determined through a linear mapping of their initial positions and velocities at ionization. This relationship is given as follows:| d = Mri + Mvi, | (3) |
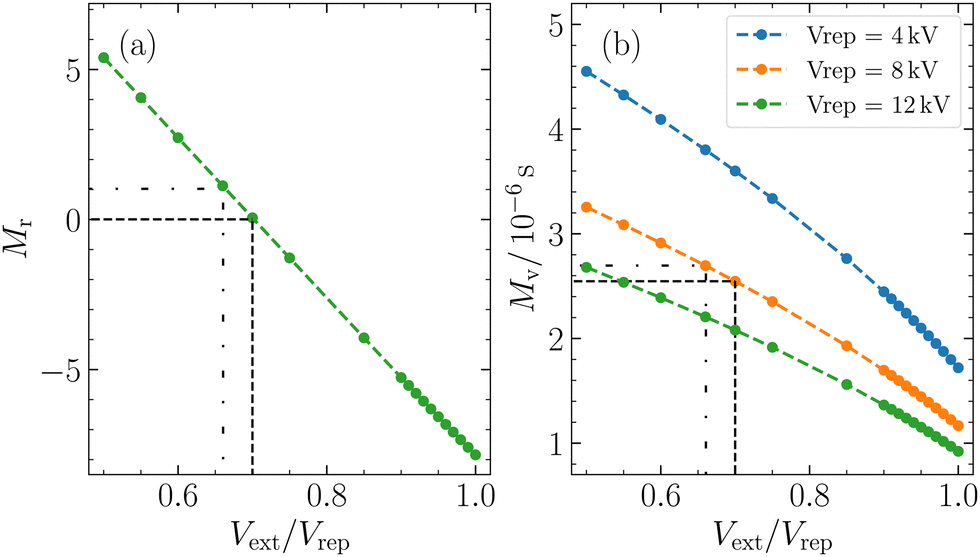 | ||
| Fig. 2 Magnification of the positions Mr (a) and velocities Mv (b) is illustrated in the figure. These magnifications were calculated with SIMION for Na(MeOH) by mapping the position and velocities of the clusters at ionization and detection. The extractor voltage was swept while keeping the repeller voltage constant. The curves for three different repeller voltages are displayed. The black dotted line at Vext/Vrep = 0.66 represents the ratio where a magnification of Mr = 1 is achieved, whereas the black dashed line at Vext/Vrep = 0.7 represents VMI conditions (Mr = 0). | ||
The magnification factor of cluster positions Mr depends exclusively on the extractor/repeller voltage ratio Vext/Vrep and remains unaffected by the magnitude of the repeller voltage. Analogous to a lens, adjusting Vext/Vrep corresponds to modifying the focal length of the electrostatic lens and therefore the magnification. On the other hand, the magnification factor of the velocities Mv is not only influenced by this ratio but also by the repeller voltage and the kinetic energy of the ion.30
M r = 0 corresponds to the VMI condition, an often employed detection technique in photofragment imaging experiments and the most common working region for imaging using a Wiley–McLaren extractor.22,38 This configuration focuses the initial positions of clusters with the same vx and vz, resulting in the position on the detector being solely determined by their velocities.
Another frequently used working region of a Wiley–McLaren extraction setup is (in-focus) SMI. It is characterized by Mv = 0 and occurs when Vext/Vrep is close to 1.33,39,40 In such a scenario, the position of the ions is directly mapped onto the detector, thereby focusing clusters with identical initial positions onto the same position on the detector, independent of their velocities. It is important to note that in our particular experimental setup, for our kinetic energies, we do not strictly meet the criteria for in-focus SMI, as Mv is never equal to zero (Fig. 2(b)). This is due to the geometry of our extraction setup. However, other research papers have reported the achievement of in-focus SMI in their setups, showing its feasibility under certain conditions.22,30,33,39
In contrast, any voltage ratio deviating from these ideal conditions (Mr = 0 or Mv = 0) is often termed “out-of-focus” VMI,22,31 which can also be referred to as out-of-focus SMI. These settings lead to non-zero values for both Mr and Mv, causing a convolution of the initial position and velocity distributions on the detector. In Fig. 3, we illustrate two working conditions used in this work, namely VMI Mr = 0, and out-of-focus SMI at Mr = 1. Fig. 3(a) illustrates the working principle of VMI. Our clusters have a vx centered around 1000 ms−1, while the perpendicular velocities (vy, vz) do not exceed ±5 ms−1. This is shown in Fig. 3(a) as the clusters are tightly focused in the z-direction. In the x-direction, however, we can measure the velocity distribution of the neutral cluster beam.
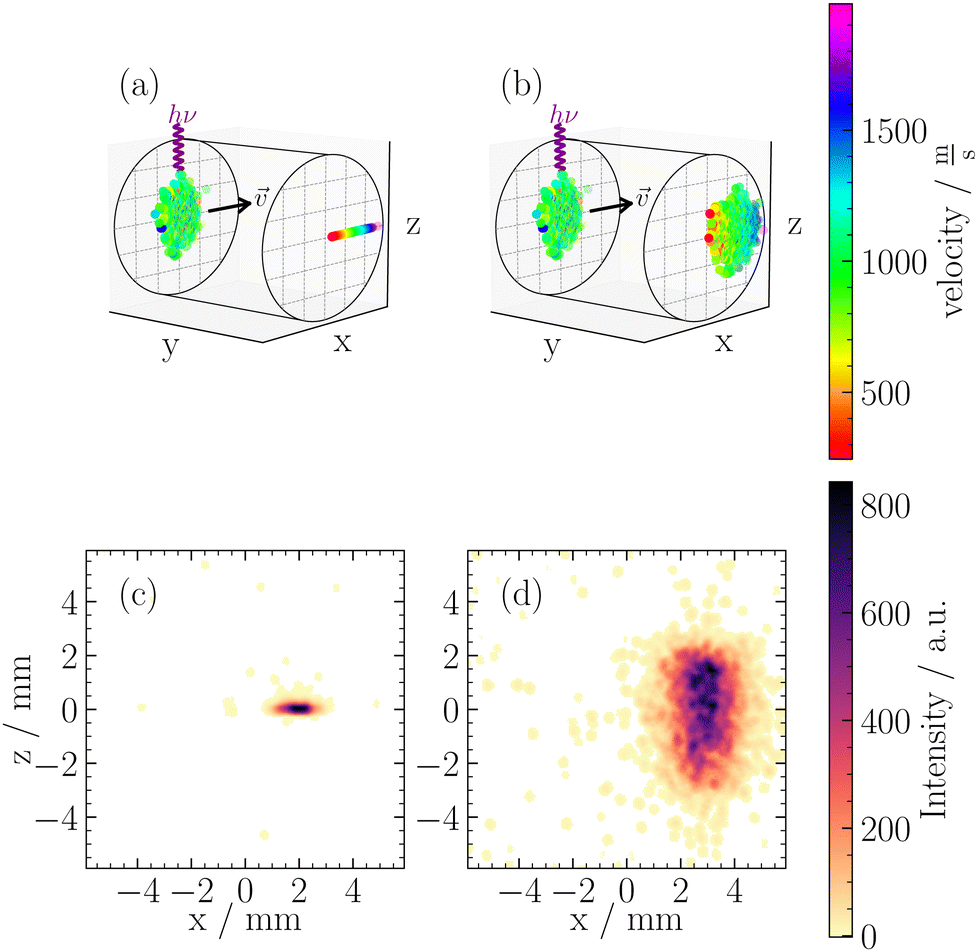 | ||
| Fig. 3 The extraction process is depicted for two magnifications: Mr = 0 (a) and Mr = 1 (b). In (a) and (b), the colored dots on the left face of the cylinder represent the molecular beams cross-section at ionization, while the colored dots in the right face represent the detected image. The color code represents the particle velocities. Panels (c) and (d) show experimental results for NaNH3 clusters recorded for two conditions: velocity map imaging (VMI), Mr = 0 (c), and out-of-focus SMI with Mr = 1 (d). | ||
Using eqn (3), for a velocity of ±5 ms−1 and a Mv = 2.7 × 10⁻⁶ s, we calculated a spread in spatial mapping of ±13 μm for a given position at ionization. This spread is negligible compared to the scale of deflection observed (mm scale for Mr = 1) and is comparable to the channel spacing of our MCP (10 μm). The negligible velocity in the z-direction enables spatially resolved imaging in this coordinate across a wide range of Vext/Vrep ratios. This is illustrated in Fig. 3(b), where out-of-focus SMI is demonstrated for Mr = 1. It is noteworthy that in the z-direction, the width at ionization is preserved after extraction. In the x-direction, however, the large velocity distribution results in a broadening of the original size. Specifically, one observes the convolution of the position distribution at ionization with the velocity distribution, leading to a blurring of the initial spatial distribution at detection.
Within the broad operational range of magnifications of positions, we opt to work at Mr = 1 as it offers a favourable balance between resolution and signal-to-noise ratio. Additionally, Mr = 1 is achieved at Vext/Vrep = 0.66, which is close to our condition for time focusing (Vext/Vrep = 0.662). Time focusing ensures the same arrival times at the detector for ions of the same mass, independent of their initial positions and velocities in the detection plane. The alignment between time focusing and out-of-focus SMI is needed for cluster-resolved measurements and could not be achieved using in-focus SMI.
Deflection of Na(NH3)n
In this section, we employ out-of-focus SMI, at Mr = 1, to analyze the deflection of sodium ammonia clusters. We present the deflection results for Na(NH3) clusters measured at currents I = 300 A, 400 A, and 700 A in Fig. 4. These currents dictate the strength of the magnetic field gradient, thereby influencing the deflection degree of the clusters.9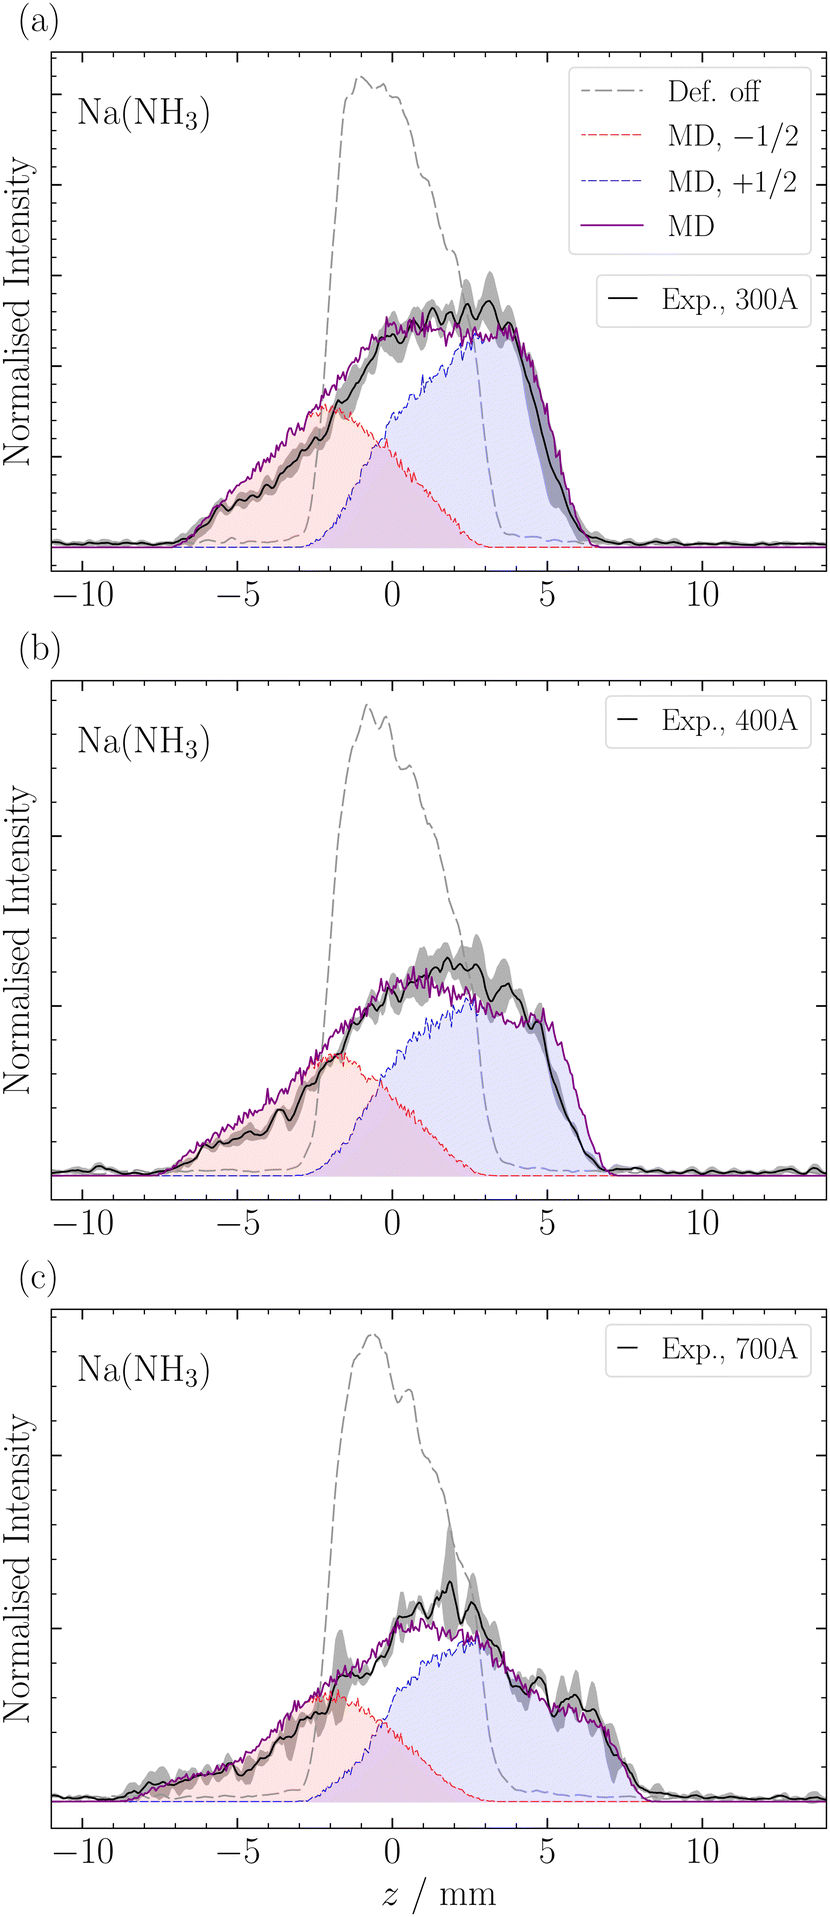 | ||
| Fig. 4 Magnetic deflection of Na(NH3) measured at a magnification of Mr = 1 and a current of 300 A, 400 A, and 700 A ((a)–(c)). The dashed grey and the black lines correspond to the experimental spatial distribution when the deflector is off and on, respectively. The purple line illustrates the total deflection obtained in our simulations, while the red and blue lines delineate the contributions of the two spin projections. Shaded areas represent experimental uncertainties at 1σ. | ||
The experimental results show higher intensities at positive z-positions, indicating that the ms = +1/2 beamlet is more intense than the ms = −1/2 beamlet. This observation is attributed to the deflector's geometry, where the magnetic field gradient along the y-axis, the axis perpendicular to the deflection and propagation, causes particle focusing above the origin and defocusing below it.9 The narrow ionization slice of the laser along the y-axis, coupled with the deflector's focusing properties, results in an enhanced intensity of the ms = +1/2 clusters. Moreover, instead of the two distinct peaks typically expected in a spin 1/2 system, our experiments revealed a single, broadened peak. The broadening can be traced back to the clusters' velocity distribution, spanning over Δvx ≈ 500 ms−1 (Fig. 5) and the pulsed nature of our magnetic field in time (FWHM ≈ 300 μs). Only the central velocities vx ≈ 1100 ± 200 ms−1 of the overall cluster velocity distribution are deflected, whereas the other velocities do not experience a significant magnetic field gradient.5 By comparing the experimental results with our MD simulations, which incorporate the velocities of the clusters and the geometry of the experimental setup, we can determine the effective magnetic moment of the clusters (eqn (2)). The deflection of NaNH3 in Fig. 4 closely matches our MD simulations for an ideal spin 1/2 system with a mass of 40.02 Da. The results show that the combination of VMI with out-of-focus SMI allow to adequately understand the deflection behavior of clusters, even for a broad velocity distribution.
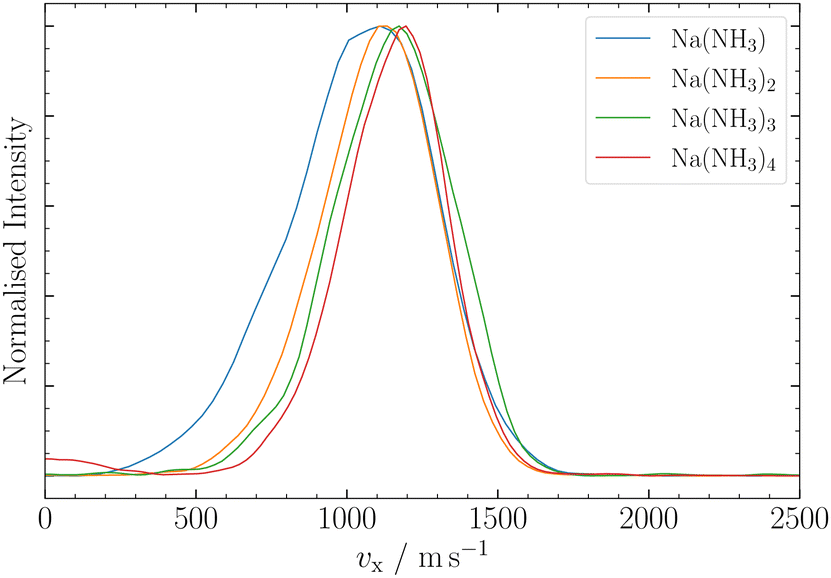 | ||
| Fig. 5 Ion VMI results for Na(NH3)n, n = 1–4. Na(NH3)1 and Na(NH3)2 were measured with a nozzle temperature of T = 25 °C, whereas Na(NH3)3 and Na(NH3)4 were measured at T = 100 °C. | ||
For larger clusters with Na(NH3)n 2 ≤ n ≤ 9, we observe reduced deflection compared with the expected outcome for an ideal spin-1/2 system due to spin-relaxation.5 Reduced deflection results in a smaller difference between deflector on and off measurements (Fig. 6). The reduced deflection can be explained through the avoided crossing model.2,8,41 Specifically, for systems with a single unpaired electron  the Zeeman effect induces a splitting into two distinct eigenstates based on spin orientation, with the degree of splitting increasing with magnetic field strength. Incorporating rotational and vibrational states further increases the number of Zeeman-like levels in the Zeeman diagram. Importantly, even a weak coupling between spin and rotational states leads to avoided crossings at magnetic field strengths where accidental degeneracies would otherwise occur. As the clusters traverse the magnetic field, they encounter these crossings. In response to the changing magnetic field, if a cluster passes through an avoided crossing adiabatically, it undergoes a spin flip. Several spin-flips would result in diminished deflection. This phenomenon implies that molecular clusters with a higher density of populated rovibrational states will experience more frequent spin transitions, resulting in comparatively less pronounced deflection.
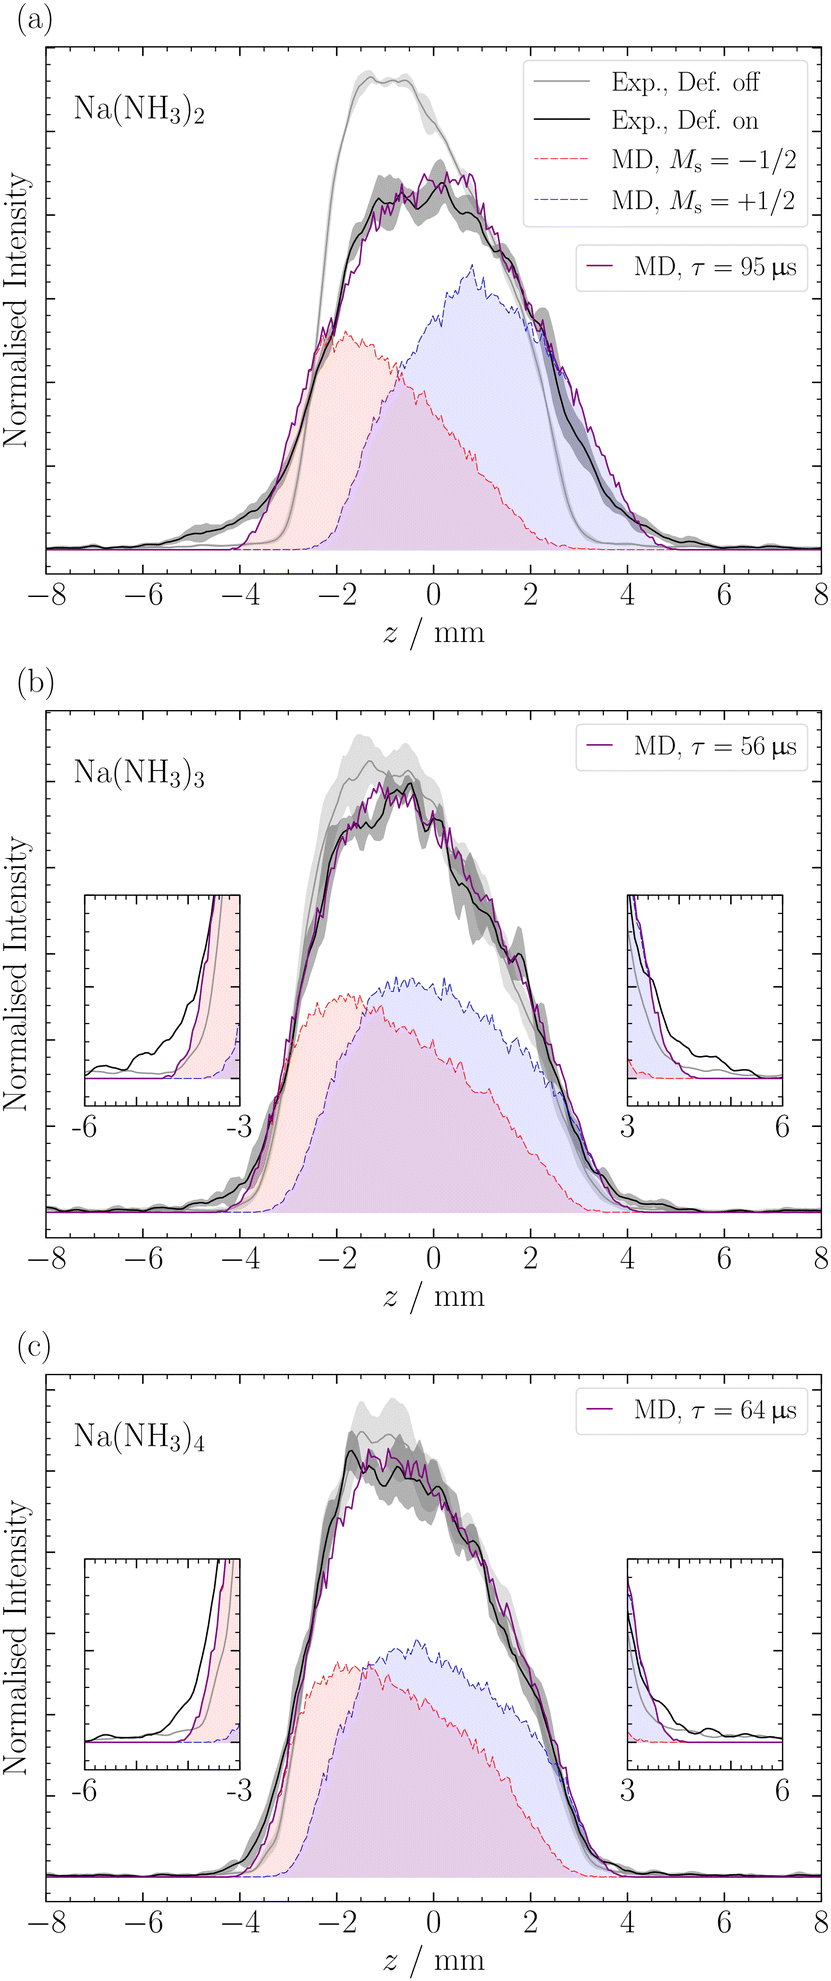 | ||
| Fig. 6 Magnetic deflection of Na(NH3)n, 2 ≤ n ≤ 4 ((a)–(c)), measured at Mr = 1 and at a current of 700 A. The grey and black error bars correspond to the experimental spatial distributions when the deflector is off and on, respectively. The purple line illustrates the total deflection observed in our simulations, while the red and blue shaded areas delineate the contributions of the two spin projections. Notably, for clusters larger than Na(NH3)1, the deflection deviates from that expected for a spin-1/2 system. The figure showcases the deflection with the χ2-optimized τ values. Shaded areas represent uncertainties at 1σ. | ||
The reduced deflection for larger clusters is illustrated in Fig. 6 for Na(NH3)n, where 2 ≤ n ≤ 4. To address spin relaxation in our analysis, we use an exponential decay model for the magnetic moment according to eqn (2). We fit the relaxation time τ to the observed reduced deflection. The simulated deflection results for the smallest χ2-value are shown in Fig. 6 and the optimal τ values are summarised in Table 1 for this work (τSMI) and our previous study (τslit), where we used a non-moveable slit to quantify deflection.5
| Na(NH3)n | τ SMI/μs | τ slit/μs |
|---|---|---|
| 1 | >250 | >250 |
| 2 | 95(5) | 92(12) |
| 3 | 56(5) | 72(12) |
| 4 | 64(3) | 62(10) |
| 5 | 47(4) | n/a |
| 6 | 38(9) | n/a |
| 7 | 38(12) | n/a |
| 8 | 36(9) | n/a |
| 9 | 37(14) | n/a |
| Na2(NH3)n | τ SMI/μs | τ slit/μs |
|---|---|---|
| 1 | No deflection | n/a |
| Na3(NH3)n | τ SMI/μs | τ slit/μs |
|---|---|---|
| 1 | 31(6) | n/a |
| 2 | 28(7) | n/a |
In Fig. 6, we observe a good agreement between the MD simulations and the experimental data for the different clusters, particularly in the center of the profile around z = ±3 mm. However, we note a discrepancy in the data at the edges of the molecular beam. The discrepancy appears most pronounced for the ms = −1/2 component of Na(NH3)2 and, to a lesser extent, in Na(NH3)3 and Na(NH3)4. This deviation might be attributed to the limitations of our exponential decay Ansatz to fully capture the spatial information provided by our experimental setup. However, more experiments are required to confirm this behavior.
In a previous magnetic deflection study,5 we found that the relaxation time for Na(NH3)3 to be longer than that of Na(NH3)4, though their error bars were overlapping. This finding was counter-intuitive, given our previous photoelectron study,42 where Na(NH3)4 was identified as a “magic number” in terms of the photoelectron anisotropy (β) parameter.42 Combined with quantum chemical calculations, we concluded that Na(NH3)4 in our molecular beam was dominated by a highly symmetric cluster with tetrahedral symmetry and an isoenergetic cluster with C3v symmetry.42 The rotational state analysis performed in our previous magnetic deflection study5 indicated that the density of states for the symmetric tetrahedral cluster is comparable to that of Na(NH3)2. This led us to anticipate a longer relaxation time for this symmetric cluster as the isomers of Na(NH3)3 have lower symmetries. The current observation in Table 1 is consistent with our expectations: we now find a longer relaxation time for Na(NH3)4 compared to Na(NH3)3. This outcome is not only supported by our theoretical predictions but also shows the enhanced sensitivity of our newly applied method of out-of-focus SMI.
The comparison of the degree of deflection of Na(NH3)4 and Na(NH3)3 in Fig. 6 provides a good illustration that without simulation, the degree of deflection does not directly represent relaxation times. Na(NH3)4 shows deflection comparable to Na(NH3)3, which, however, does not mean that their relaxation times are the same (Table 1). The reason is that the degree of deflection is also influenced by the mass (deflection is inversely proportional to the mass) and to a lesser extent by other experimental conditions (e.g. the velocity distribution).
As the relaxation time of Na(NH3)3, the relaxation time of Na(NH3)5 (τ = 47 μs) lies below the relaxation time of Na(NH3)4 (Table 1). This further highlights the special relaxation behaviour of the highly symmetric Na(NH3)4 cluster. Furthermore, the comparatively high value of the relaxation time of Na(NH3)5 compared with that of the Na(NH3)3 was unexpected because Na(NH3)5 has much smaller rotational constants and also a dense rotational spectrum because it has no highly symmetric isomers.24,42 The lowest-lying isomer for Na(NH3)5 resembles a trigonal bipyramidal structure; however, the axial ammonia molecules are slightly bent, disrupting its symmetry. Hartweg et al.24 reported an almost isoenergetic structure where Na(NH3)5 forms a tetrahedral core, and the fifth ammonia molecule is positioned in the second solvation shell. Even more surprising than the comparatively long relaxation time of the Na(NH3)5 were the high and constant relaxation times of the larger clusters with 6 ≤ n ≤ 9 (Table 1). All these clusters have higher masses and many asymmetric isomers, small rotational constants and dense rotational spectra. Therefore, we expected to observe no deflection for these clusters due to fast spin relaxation. A potential explanation for the unexpectedly slow relaxation of these large clusters could come from the different role ammonia molecules might play in the relaxation process depending on whether they are in the first solvation shell or in the second shell. It is conceivable that the molecules in the first shell contribute much more to spin relaxation because of their stronger interaction with the Na atom. Evaluation of this hypothesis will require in-depth theoretical modelling beyond the possibilities of an experimental group. Such studies combined with our experimental data could contribute to a deeper molecular-level understanding of magnetic relaxation mechanisms in solvents.
Deflection of Nam(NH3)n
De Heer et al.43 previously reported on the magnetic deflection of bare sodium clusters Nam, noting that clusters with an even number of sodium atoms exhibited no deflection. For Na2, this aligns with calculations that find the triplet ≈700 meV higher in energy than the singlet.44 As expected, we also observed no deflection for Na2(NH3)1 (Fig. 7a). This is consistent with De Heer's findings and is supported by our quantum chemical calculations (see ESI‡).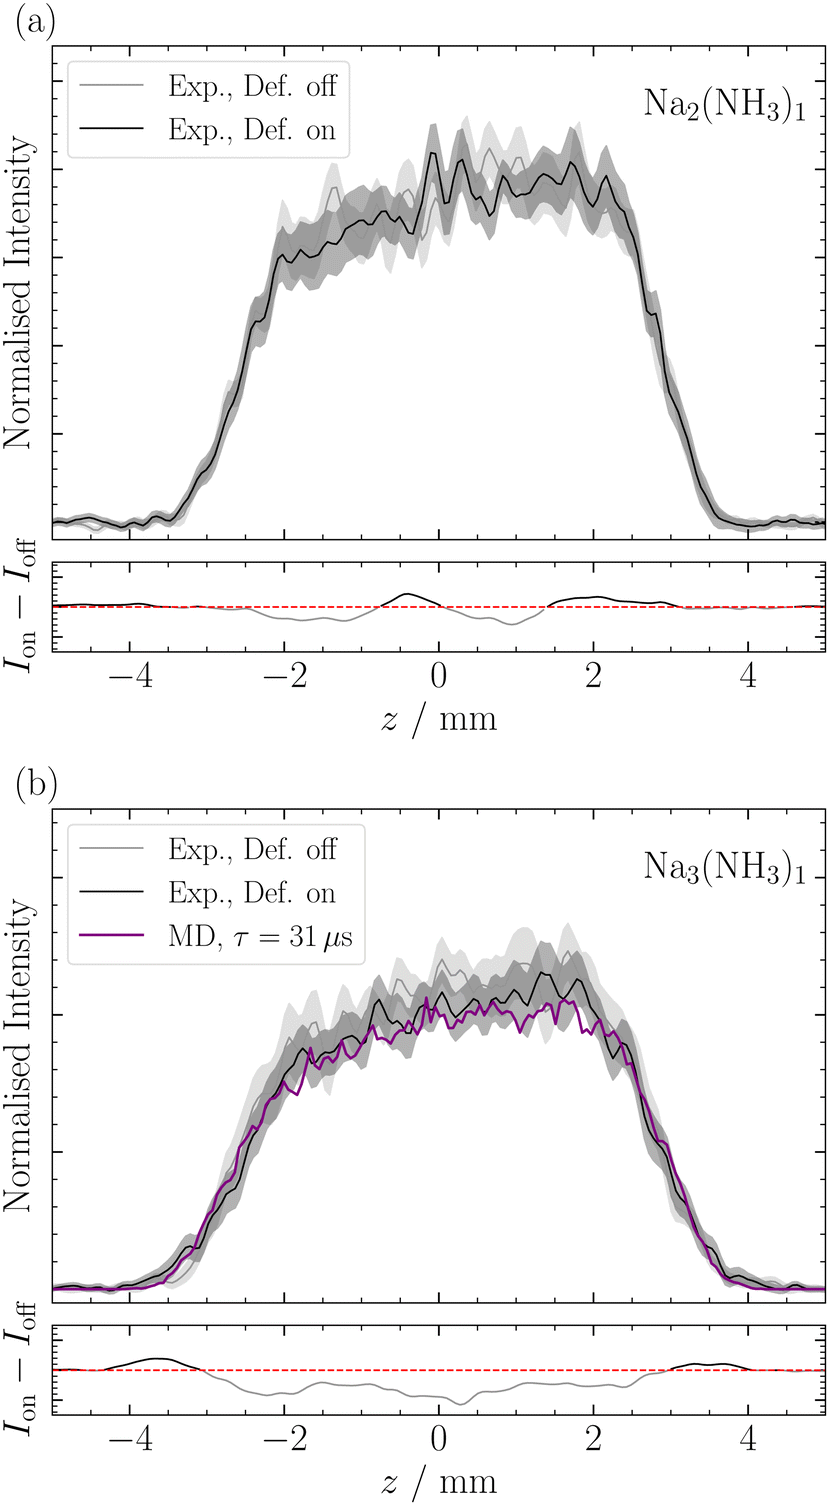 | ||
| Fig. 7 Magnetic deflection of Na2(NH3)1 (a) and Na3(NH3)1 (b) measured at Mr = 1 and a current of I = 500 A for “long” magnetic field pulses. The grey and black error bars represent the experimental spatial distributions with the deflector off and on, respectively. In (b), the purple line illustrates the total deflection observed in our simulations, using the χ2-optimized relaxation times τ. Below each image, a smoothed intensity difference plot (deflector on minus deflector off) is shown. In these plots, black regions indicate where the deflector on signal is higher, and grey areas indicate where the deflector off signal is higher. Shaded areas represent uncertainties at the 1σ level. | ||
For Na3, De Heer et al.43 observed reduced deflection compared with to a non-relaxing spin 1/2 system. This was attributed to spin relaxation during the transit time of the deflector. The two lowest-lying isomers for Na3 have C2v and D3h symmetries, with the latter lying higher in energy by ≈80 meV.45 Our measurements of Na3(NH3)1 (Table 1 and Fig. 7b) also indicate slight deflection, although close to our detection limit. We observe a small increase in intensity at the profile's edges and a depletion of signal in the center, similar to the deflection observed for Na(NH3)n. Note, the deflection of Na3(NH3)1 is less compared to Na(NH3)1 mainly because the rotational constants of the former are much smaller (see ESI‡). All structures we found for Na3(NH3)1 are asymmetric rotors with the highest point groups being Cs, and in each isomer, the N atom of the NH3 lies in the plane defined by the 3 Na atoms, with the nitrogen assuming various positions around the Na3 manifold (see ESI‡). This structural asymmetry, in addition to the already observed reduced deflection for Na3 by de Heer et al., explains the short relaxation times we recorded for Na3(NH3)1. For Na3(NH3)2, the relaxation time we determine seems even slightly shorter than the one for Na3(NH3)1 (Table 1). This can likely be attributed to smaller rotational constants, as only asymmetric rotors were found for this cluster. (see ESI‡) Interestingly, the decrease of the relaxation time between n = 1 and n = 2 is much more pronounced for singly-doped sodium clusters compared with triply-doped sodium clusters (Table 1).
Conclusions
In this work, we have introduced a new approach to measure magnetic deflection using out-of-focus spatial map imaging, utilizing a 3-plate Wiley–McLaren type extractor. This methodology, novel in its application, enabled us to work outside the conventional conditions of spatial map imaging, particularly by allowing us to operate near the time-focusing condition for cluster-resolved measurements. The integration of velocity map imaging with this setup facilitated the measurement of the velocity distribution of ions along the propagation axis of the molecular beam, crucial for determining the effective magnetic moments of the clusters.This approach marks an improvement over our previous non-movable slit experiment by enabling the acquisition of the complete spatial distribution. This capability makes a more detailed analysis possible, exemplified by the determination of spin relaxation times of Nam(NH3)n clusters. A key finding is the observed slower relaxation for Na(NH3)4 compared with Na(NH3)3 and Na(NH3)5, an effect caused by the especially high symmetry of Na(NH3)4, which is in line with our theoretical predictions. For the larger clusters, Na(NH3)5 through Na(NH3)9, we observe unexpectedly high deflection. Especially surprising was the fact that we find a fairly slow relaxation time that is similar for all clusters from n = 6 to n = 9. Furthermore, we performed deflection measurements on Na2(NH3)1 and Na3(NH3)n. For Na2(NH3)1, no deflection was observed due to the cluster's singlet state character. In contrast, Na3(NH3)1 and Na3(NH3)2 exhibited a significant reduction in deflection compared to a non-relaxing spin 1/2 system, in line with previously observed reduced deflection of Na3.43
While other measurement techniques for magnetic deflection offer the advantage of simultaneous mass measurements without the need for a delay line, they often require repeated measurements of the same cluster or face trade-offs between spatial and mass resolution. We offer out-of-focus SMI as a complementary method to other detection techniques where fast deflection images can be recorded under time focusing conditions. Furthermore, the multiplexing allows for easy switching between TOF-MS, VMI and out-of-focus SMI.
Conflicts of interest
There are no conflicts to declare.Acknowledgements
This project was supported by the Swiss National Science Foundation (SNSF Project No. 200020_200306) and ETH Zurich. We express our gratitude to Jonathan Barnes for the useful discussions and to D. Stapfer and M. Steger from our workshops for technical support.Notes and references
- T. M. Fuchs, F. Rivic and R. Schäfer, Phys. Rev. A, 2021, 104, 012820 CrossRef CAS.
- X. Xu, S. Yin, R. Moro and W. A. de Heer, Phys. Rev. B: Condens. Matter Mater. Phys., 2008, 78, 054430 CrossRef.
- A. Lehr, F. Rivic and R. Schäfer, J. Am. Chem. Soc., 2023, 145, 2070–2074 CrossRef CAS PubMed.
- F. Rivic, A. Lehr, T. M. Fuchs and R. Schäfer, Faraday Discuss., 2023, 242, 231–251 RSC.
- J. V. Barnes, D. P. Borgeaud dit Avocat, E. Simmen, H. Yang, B. L. Yoder and R. Signorell, J. Phys. Chem. A, 2023, 127, 8544–8555 CrossRef CAS PubMed.
- K. De Knijf, J. van der Tol, P. Ferrari, S. Scholiers, G.-L. Hou, P. Lievens and E. Janssens, Phys. Chem. Chem. Phys., 2023, 25, 171–182 RSC.
- W. Gerlach and O. Stern, Zeitschrift für Physik, 1922, 9, 349–352 CrossRef CAS.
- A. Amirav and G. Navon, Phys. Rev. Lett., 1981, 47, 906–909 CrossRef CAS.
- J. V. Barnes, M. Beck, S. Hartweg, A. Luski, B. L. Yoder, J. Narevicius, E. Narevicius and R. Signorell, Phys. Chem. Chem. Phys., 2021, 23, 846–858 RSC.
- G. Tikhonov, V. Kasperovich, K. Wong and V. V. Kresin, Phys. Rev. A: At., Mol., Opt. Phys., 2001, 64, 063202 CrossRef.
- N. A. Kuebler, M. B. Robin, J. J. Yang, A. Gedanken and D. R. Herrick, Phys. Rev. A: At., Mol., Opt. Phys., 1988, 38, 737–749 CrossRef CAS PubMed.
- B. S. Kamerin, J. W. Niman and V. V. Kresin, J. Chem. Phys., 2020, 153, 081101 CrossRef PubMed.
- T. Hihara, S. Pokrant and J. Becker, Chem. Phys. Lett., 1998, 294, 357–362 CrossRef CAS.
- D. M. Cox, D. J. Trevor, R. L. Whetten, E. A. Rohlfing and A. Kaldor, J. Chem. Phys., 1986, 84, 4651–4656 CrossRef CAS.
- D. C. Douglass, A. J. Cox, J. P. Bucher and L. A. Bloomfield, Phys. Rev. B: Condens. Matter Mater. Phys., 1993, 47, 12874–12889 CrossRef CAS PubMed.
- M. B. Knickelbein, J. Chem. Phys., 2001, 115, 5957–5964 CrossRef CAS.
- L. Miao, Z. Liu, Z. Chen, X. Wang, Z. Zhou, J. Zhao, S. Fang, G. Yin, Z. Jia, J. Liu, R. Moro, W. A. deHeer and L. Ma, Rev. Sci. Instrum., 2022, 93, 113310 CrossRef CAS PubMed.
- W. A. de Heer and P. Milani, Rev. Sci. Instrum., 1991, 62, 670–677 CrossRef CAS.
- A. Diaz-Bachs, M. I. Katsnelson and A. Kirilyuk, New J. Phys., 2018, 20, 043042 CrossRef.
- V. Zamudio-Bayer, K. Hirsch, L. Ma, K. De Knijf, X. Xu, A. awicki, A. Terasaki, P. Ferrari, B. Von Issendorff, P. Lievens, W. A. De Heer, J. T. Lau and E. Janssens, Phys. Rev. Res., 2023, 5, 033103 CrossRef CAS.
- M. Abd El Rahim, R. Antoine, L. Arnaud, M. Barbaire, M. Broyer, C. Clavier, I. Compagnon, P. Dugourd, J. Maurelli and D. Rayane, Rev. Sci. Instrum., 2004, 75, 5221–5227 CrossRef CAS.
- A. T. J. B. Eppink and D. H. Parker, Rev. Sci. Instrum., 1997, 68, 3477–3484 CrossRef CAS.
- D. W. Chandler and P. L. Houston, J. Chem. Phys., 1987, 87, 1445–1447 CrossRef CAS.
- S. Hartweg, J. Barnes, B. L. Yoder, G. A. Garcia, L. Nahon, E. Miliordos and R. Signorell, Science, 2023, 380, 1161–1165 CrossRef CAS PubMed.
- A. Sanov and R. Mabbs, Int. Rev. Phys. Chem., 2008, 27, 53–85 Search PubMed.
- M. J. J. Vrakking, Phys. Chem. Chem. Phys., 2014, 16, 2775 RSC.
- J. Mikosch, S. Trippel, C. Eichhorn, R. Otto, U. Lourderaj, J. X. Zhang, W. L. Hase, M. Weidemüller and R. Wester, Science, 2008, 319, 183–186 CrossRef CAS PubMed.
- S. J. Greaves, R. A. Rose and A. J. Orr-Ewing, Phys. Chem. Chem. Phys., 2010, 12, 9129 RSC.
- E. Carrascosa, J. Meyer and R. Wester, Chem. Soc. Rev., 2017, 46, 7498–7516 RSC.
- P. Johnsson, A. Rouzée, W. Siu, Y. Huismans, F. Lépine, T. Marchenko, S. Düsterer, F. Tavella, N. Stojanovic, H. Redlin, A. Azima and M. J. J. Vrakking, Opt. Lett., 2010, 35, 4163–4165 CrossRef CAS PubMed.
- Y. Yifrach, R. Rahimi, A. Portnov and I. Bar, Spectrochim. Acta, Part A, 2020, 237, 118404 CrossRef CAS PubMed.
- S. L. Luxembourg, T. H. Mize, L. A. McDonnell and R. M. A. Heeren, Anal. Chem., 2004, 76, 5339–5344 CrossRef CAS PubMed.
- Y. Yifrach, R. Rahimi, A. Portnov, J. H. Baraban and I. Bar, J. Chem. Phys., 2021, 154, 134201 CrossRef CAS PubMed.
- M. Stei, J. von Vangerow, R. Otto, A. H. Kelkar, E. Carrascosa, T. Best and R. Wester, J. Chem. Phys., 2013, 138, 214201 CrossRef PubMed.
- B. L. Yoder, A. H. C. West, B. Schläppi, E. Chasovskikh and R. Signorell, J. Chem. Phys., 2013, 138, 044202 CrossRef PubMed.
- B. L. Yoder, J. H. Litman, P. W. Forysinski, J. L. Corbett and R. Signorell, J. Phys. Chem. Lett., 2011, 2, 2623–2628 CrossRef CAS.
- SIMION Ion Optics Simulation Software Version 8.0, Idaho National Engineering Laboratory, 2006 Search PubMed.
- W. Benjamin, Imaging in Molecular Dynamics – Technology and Applications, Cambridge University Press, 2003 Search PubMed.
- H. Ye, S. Trippel, M. Di Fraia, A. Fallahi, O. D. Mücke, F. X. Kärtner and J. Küpper, Phys. Rev. Appl., 2018, 9, 044018 CrossRef CAS.
- D. W. Chandler, P. L. Houston and D. H. Parker, J. Chem. Phys., 2017, 147, 013601 CrossRef PubMed.
- T. M. Fuchs and R. Schäfer, Phys. Rev. A, 2019, 100, 012512 CrossRef CAS.
- A. H. C. West, B. L. Yoder, D. Luckhaus and R. Signorell, J. Phys. Chem. A, 2015, 119, 12376–12382 CrossRef CAS PubMed.
- W. de Heer, P. Milani and A. Chatelain, Z. Phys. D, 1991, 19, 241–245 CrossRef CAS.
- H.-K. Chung, K. Kirby and J. F. Babb, Phys. Rev. A: At., Mol., Opt. Phys., 2001, 63, 032516 CrossRef.
- A. W. Hauser, J. V. Pototschnig and W. E. Ernst, Chem. Phys., 2015, 460, 2–13 CrossRef CAS.
Footnotes |
| † The data repository related to this article can be found at https://doi.org/10.3929/ethz-b-000674545. |
| ‡ Electronic supplementary information (ESI) available. See DOI: https://doi.org/10.1039/d4cp00788c |
| This journal is © the Owner Societies 2024 |