
 Open Access Article
 This Open Access Article is licensed under a
 Creative Commons Attribution 3.0 Unported Licence
IR spectroscopic characterization of 3d transition metal carbene cations, FeCH2+ and CoCH2+: periodic trends and a challenge for DFT approaches†
Frank J.
Wensink
 a,
Corry E.
Smink
a,
P. B.
Armentrout
*b and
Joost M.
Bakker
*a
a,
Corry E.
Smink
a,
P. B.
Armentrout
*b and
Joost M.
Bakker
*a
aInstitute for Molecules and Materials, FELIX Laboratory, Radboud University, Toernooiveld 7, 6525 ED Nijmegen, The Netherlands. E-mail: joost.bakker@ru.nl
bDepartment of Chemistry, University of Utah, 315 South 1400 East, Salt Lake City, Utah 84112, USA. E-mail: armentrout@chem.utah.edu
First published on 7th February 2024
Abstract
A combination of IR multiple-photon dissociation (IRMPD) action spectroscopy and quantum chemical calculations was employed to investigate the [M,C,2H]+ (M = Fe and Co) species. These were formed by reacting laser ablated M+ ions with oxirane (ethylene oxide, c-C2H4O) in a room temperature ion trap. IRMPD spectra for the Fe and Co species are very similar and exhibit one major band. Comparison with density functional theory (DFT) and coupled cluster with single and double excitations (CCSD) calculations allows assignment of the spectra to MCH2+ carbene structures. For these 3d transition metal systems, experimental IRMPD spectra compare relatively poorly with DFT calculated IR spectra, but CCSD calculated spectra are a much better match primarily because the M–C stretch gains significant intensity. The origins of this behavior are explored in some detail. The present results are also compared to previous results for the 4d and 5d congeners and the periodic trends in these structures are evaluated.
Introduction
Research investigating the functionalization of the C–H bonds of alkanes has a long history.1 The bottleneck in making such a process both energy-efficient and selective is the activation of the strong C–H bonds. Methane is the most commonly studied alkane, largely because it is a major component of natural gas and the simplest alkane molecule. Selective C–H bond activation is particularly important because it is desirable to convert methane into liquid fuels like methanol that remain energy rich but are more easily transported. In general, the direct use of methane in catalytic processes is not presently pursued because the available processes are not sufficiently specific or energy efficient. Instead, the starting point is often thermal cracking, after which the available products are used to synthesize more valuable chemicals. The direct utilization of methane still requires the development of more effective C–H bond activation catalysts, especially those for earth abundant metals.Potentially, studies of models systems of active catalyst sites provide a means to rationally design the needed catalysts. Model systems can provide a more detailed description of the fundamental interactions between methane and the active site,2 allowing insight into how to manipulate the site for better efficiency and/or selectivity. Isolation of such model systems in the gas phase allows the most detailed information on the intrinsic interaction to be obtained as the perturbing effects of solvent or support are absent. Previous studies have found that several third-row (5d) transition metal (TM) cations, Ta+, W+, Os+, Ir+, and Pt+, will activate methane at room temperature. These dehydrogenation reactions lead to formation of [M,C,2H]+ products.3–7 IR spectroscopic characterization of these [M,C,2H]+ products showed that [Ta,C,2H]+ and [W,C,2H]+ have MCH2+ carbene structures but are unsymmetrical because of distortions induced by agostic interactions.8–10 In contrast, [Pt,C,2H]+ has a carbene structure with C2v symmetry. Although Ir+ also exhibited experimental evidence for a symmetric IrCH2+ carbene structure, the main species formed for both [Os,C,2H]+ and [Ir,C,2H]+ was a hydrido metal carbyne HMCH+.8–11 Notably, the favored HIrCH+ structure had been discarded on the basis of theoretical relative energies,12 demonstrating the need for experimental spectroscopic characterization. In contrast to third-row TM cations, none of the first-row (3d) TM cations dehydrogenates methane exothermically,5,13–16 and although the second-row (4d) TM cations, Zr+ and Nb+ have been reported to dehydrogenate methane at room temperature,5,17 guided ion beam studies demonstrate that such reactions are endothermic for all 4d TM cations.15,18,19 To understand the underlying reasons why the reactions of the lighter 3d TM cations with methane are unproductive and endothermic, it is of interest to characterize the structures of [M,C,2H]+ products where M is a first-row TM.
Because Os+ and Ir+ were shown to be the most reactive 5d TM ions for methane dehydrogenation and also show the most diversity in their structures,4,6–9,11 we have previously studied the bonding nature and structures of [M,C,2H]+ with their second-row congeners: the elements of groups 8 and 9, M = Ru and Rh.20 The present study continues this examination of periodic trends by focusing on the first-row congeners, M = Fe and Co. Earlier studies investigated the M+–CH2 bond strengths for first-row TMs and found that the bond dissociation energy (BDE, D0) decreased with an increase in the promotion energy (required for promoting a d electron to an s orbital) of the atomic metal cation.21 The iron carbene cation BDE, D0(Fe+–CH2), was determined to be 3.53 ± 0.04 eV in guided ion beam tandem mass spectrometry (GIBMS) experiments22,23 and ≤3.54 ± 0.02 eV by photodissociation,24 such that formation of FeCH2+ + H2 from reaction with methane is endothermic by 1.21 ± 0.04 eV given D0(CH2–H2) = 4.743 ± 0.001 eV.25D0(Co+–CH2) was experimentally determined to be 3.29 ± 0.05 eV by GIBMS16 and ≤3.43 ± 0.02 eV by photodissociation,24 such that dehydrogenation of methane requires 1.46 ± 0.05 (≥1.31 ± 0.02) eV. In both the iron and cobalt systems, the cross sections measured for the M+ + CH4 → [M,C,2H]+ + H2 reactions had threshold energies that exceeded the endothermicities, clearly showing the presence of an energy barrier, which is more than likely found in the exit channel.16,23
Elsewhere, CCSD calculations on the [M,C,2H]+ species indicate that FeCH2+ has 4B1 and 4B2 electronic states that are nearly degenerate, similar to CoCH2+, which has nearly degenerate 3A1 and 3A2 electronic states.26 A potential energy surface (PES) for reaction between Co+ and CH4 identified the physisorbed Co(CH4)+ complex as the only intermediate that could be formed exothermically along the surface leading toward CoCH2+ + H2.16,27 A similar conclusion holds for the reaction between Fe+ and CH4.23,28
Because neither Fe+ nor Co+ reacts exothermally with methane,14,16 we react the corresponding M+ ions with oxirane (ethylene oxide, c-C2H4O) in order to form the [M,C,2H]+ of interest. Oxirane readily reacts with many TM cations because of its ring strain and because [M,C,2H]+ formation is accompanied by the stable CH2O neutral product. As a consequence, extraction of CH2 from oxirane requires much less energy than from methane, D0(CH2–CH2O) = 3.375 ± 0.004 eV, compared to D0(CH2–H2) = 4.743 ± 0.001 eV.25 Thus, the thermochemistry noted above indicates that formation of MCH2+ + CH2O in the reaction of M+ with oxirane, is exothermic by 0.16 ± 0.04 eV for M = Fe. For M = Co, the reaction is either slightly endothermic by 0.08 ± 0.05 eV or exothermic by ≤0.06 ± 0.02 eV. Indeed, the reaction of Fe+ with oxirane has been shown to result in formation of both FeO+ and FeCH2+ at thermal energies,29 whereas Co+ + oxirane results mainly in CoCH2+, CoCO+, and CoC2H4O+.30 In that study, the kinetic energy dependence of the CoCH2+ cross section was consistent with a slightly endothermic process but the reaction is still appreciable (reaction efficiency near 10% at thermal energies).
In the present work, we probe the structure of the [M,C,2H]+ product ions for M = Fe and Co using a combination of infrared multiple photon dissociation (IRMPD) action spectroscopy and theoretical calculations. IRMPD spectra are recorded using the same Fourier transform ion cyclotron resonance (FTICR) mass spectrometer recently used to show that the reaction of Pt+ with two methane molecules leads to the formation of a Pt+(ethene) complex following two dehydrogenations and C–C coupling.31 In that same work, we demonstrated that the spectrum of [Pt,C,2H]+ recorded with this instrument is consistent with that reported previously,8 where [Pt,C,2H]+ was formed in a molecular beam environment without mass-isolation prior to irradiation. Earlier attempts to record IRMPD spectra of [M,C,2H]+ with M = Fe and Co were unsuccessful in the molecular beam apparatus because the ion intensities were insufficient. Here, we take advantage of the possibility to react TM+ with c-C2H4O over longer times and to mass-isolate the formed [M,C,2H]+ species in order to obtain the desired spectra.
Critically, these small ions also form benchmark systems for the accuracy of the quantum chemical methods. Previously, we found that relatively standard density functional theory (DFT) methods proved sufficient to accurately predict the IR fingerprints, both in terms of frequencies and IR intensities, necessary for assigning the experimental IR spectra of [M,C,2H]+ species with M 5d elements.8–11,31 For the 4d elements M = Ru and Rh, the same conclusion holds, even though the assignment for the [Rh,C,2H]+ species was complicated by the multi-reference character of RhCH2+.20 In contrast, here, we find that these comparisons are not so straightforward for 3d elements. We therefore employ higher-level methods to interpret the observed spectra.
Methods
Experimental
The experimental procedure here mirrors that followed in our recent work on the similar [Ru,C,2H]+ and [Rh,C,2H]+ species.20 The atomic metal (Fe, Co) cations were formed by irradiating a solid metal target disk with a frequency doubled Nd:YAG laser at 30 Hz.32 Helium gas was injected by a pulsed valve in order to collisionally cool the metal ions and guide them to an orifice where the gas mixture adiabatically expanded into vacuum, further cooling all species. The ions were transferred by a radio-frequency (rf) only quadrupole mass filter, to a rf quadrupole ion trap having rectangular electrodes. There the ions were trapped by collisions with 5 × 10⁻⁴ mbar of argon buffer gas, which contained a partial pressure of 1 × 10⁻⁶ mbar of oxirane. After accumulating for approximately 400 ms, atomic metal cations and product ions were released from the trap by lowering the voltage on the exit electrode of the ion trap. The ions were then guided into one of four cells of the FTICR mass spectrometer integrated with the cavity of the Free Electron Laser for IntraCavity Experiments (FELICE). The first FTICR cell (cell 1) was located in the laser focus and the fourth was 30 cm from the focus, which reduces the photon fluence by a factor of 14. After ion capture, unwanted masses were ejected from the FTICR cell using a combination of chirped and single-frequency rf excitation pulses,33 leaving only [M,C,2H]+ ions. Resonant absorption of IR photons at a vibrational band of the ion increased the internal energy of the ions leading to fragmentation. IRMPD spectra were recorded by monitoring intensities of precursor (Ip) and fragment (Ifrag) ions present in the FTICR cell after irradiation. The resulting spectrum is provided as the fragmentation yield Y:
The IR light of FELICE was scanned over the 300–2000 cm−1 spectral range for the present work. FELICE produced micropulses at 1 GHz, with macropulses that lasted between 6–10 µs at a repetition rate of either 5 or 10 Hz. A single macropulse with the ions in FTICR cell 4 (low fluence) was used to record all spectra unless indicated otherwise. Macropulse energies of FELICE ranged from 0.3 to 0.5 J moving from low to high frequencies. This corresponds to macropulse fluences ranging from 0.9 to 6.6 J cm−2 in FTICR cell 4. The spectral bandwidth was near transform limited and the full-width at half-maximum (FWHM) was approximately 0.7% of the central frequency during the present experiments. To locate the band frequencies listed below, Gaussian curves were fitted to the experimental IRMPD spectra.
Computational
All calculations were performed here using the Gaussian 16 software package.34 Generally, molecular structures for all species were located using unrestricted B3LYP hybrid functional and the def2-TZVPPD basis set, which treats all electrons explicitly for H, C, Fe, and Co.35–37 This combination was used because it has performed well in calculating the IR spectra of the 5d [M,C,2H]+ species and the M+–CH2 BDEs calculated at this level match experimental values relatively well: D0(Fe+–CH2) was calculated to be 3.66 eV (experimentally 3.53 ± 0.04 eV) and D0(Co+–CH2) = 3.24 eV (3.29 ± 0.05 eV), as outlined in Table 1. These calculated values (as well as all others provided below) include zero-point vibrational energies. True minima in the structures were verified by ensuring that the calculated harmonic vibrational frequencies were all real. For comparison with the experimental spectra, the unscaled theoretical harmonic vibrational frequencies had simulated rovibrational envelopes included by assuming pure a-, b-, or c-type transitions.38 To mimic the FELICE spectral bandwidth, the resulting rovibrational transition lines were convolved with a Gaussian line shape having a FWHM of 0.9% of the central frequency. To simulate additional broadening effects, convolutions were also done employing a 9% FWHM bandwidth.| Species | Fragments | Bond dissociation energy D0 (eV) | |
|---|---|---|---|
| Theorya | Experiment | ||
a ![[thin space (1/6-em)]](https://www.rsc.org/images/entities/char_2009.gif) Theoretical values are calculated at the uB3LYP/def2-TZVPPD level of theory.
b Ref. 39.
c Ref. 22.
d Ref. 24.
e Ref. 16.
f Uses D0(C–H2) = 3.320 ± 0.001 eV.25 Theoretical values are calculated at the uB3LYP/def2-TZVPPD level of theory.
b Ref. 39.
c Ref. 22.
d Ref. 24.
e Ref. 16.
f Uses D0(C–H2) = 3.320 ± 0.001 eV.25
|
|||
| FeCH2+ | FeC+ + H2 | 3.30 | 2.86 ± 0.22b |
| Fe+ + CH2 | 3.66 | 3.56 ± 0.22,b 3.53 ± 0.04,c ≤3.54 ± 0.02d | |
| CoCH2+ | CoC+ + H2 | 3.77 | 3.08 ± 0.22,b 3.01 ± 0.30,cef ≤3.15 ± 0.30def |
| Co+ + CH2 | 3.24 | 3.64 ± 0.22,b 3.29 ± 0.05,c ≤3.43 ± 0.02d | |
Additional geometry and frequency calculations were done at second-order Møller–Plesset, MP2(full),40 and coupled cluster with single and double excitations, CCSD(full),41 levels (where full indicates correlation of all explicit electrons) using the same def2-TZVPPD basis set. These were followed by single point calculations with added perturbative triple excitations, i.e., at the CCSD(T,full) level. For FeCH2+, calculations using several additional DFT approaches were also pursued.
Notably, no scaling factors were used to compare the theoretical spectra with experiment, which is unusual for these types of systems.8–11,20,31,42 Nevertheless, such scaling factors were not found to improve the agreement between theory and experiment and therefore are not used throughout this work.
Results & discussion
Reactions between M+ (M = Fe, Co) and oxirane resulted in the product mass distributions shown in Fig. S1 of the ESI.† We observed ionic products [M,C,2H]+, MO+, [M,O,H]+, and [M,O,2H]+ for both M. For Fe+, the former two products were observed in earlier experiments,29 but the latter two were not. We assume these species are the result of reaction with a water contaminant present in the c-C2H4O gas or tubing. In the reaction between Co+ and oxirane, we do observe [Co,C,2H]+ and CoO+ but not the CoCO+ species observed before in a single bimolecular encounter.30 We also observe a [Co,C,3H]+ species (which would not have been observed easily in the low mass resolution ion beam experiments). Formation of CoCH3+ + HCO from Co+ + c-C2H4O is endothermic by 0.29 ± 0.04 eV.22 The absence or presence of these species might be a result of multiple reactions with c-C2H4O or involve electronic excitation of Co+. Observed [Co,O,2H]+ and [Co,O,H]+ species again are likely to result from reactions with a water contaminant.IR spectroscopy of FeCH2+
Fig. 1a shows the experimental IRMPD spectrum of [Fe,C,2H]+ (m/z = 70) constructed using the 56Fe isotope of the two observed fragment masses Fe+ and FeC+. The spectrum is dominated by a strong and broad band peaking at 632 cm−1. This band has a shoulder on the high frequency side with a maximum near 767 cm−1. Fig. S2a of the ESI† shows a potential band could be discerned in only the Fe+ fragmentation channel just above 1000 cm−1. A careful analysis of the mass-spectra underlying the IR spectra shows that this band results from formation of Fe+ by fragmentation of a [Fe,C,3H]+ minor product that was not mass-eliminated before irradiation, see a typical example in Fig. S3 in the ESI.† As [Fe,C,3H]+ does not dissociate by loss of H2 + H, this band does not appear in the FeC+ fragmentation product spectrum. A second band for [Fe,C,3H]+ is observed to coincide with the main band of [Fe,C,2H]+, and therefore has no influence on the current spectrum because of the low intensity of the [Fe,C,3H]+ product.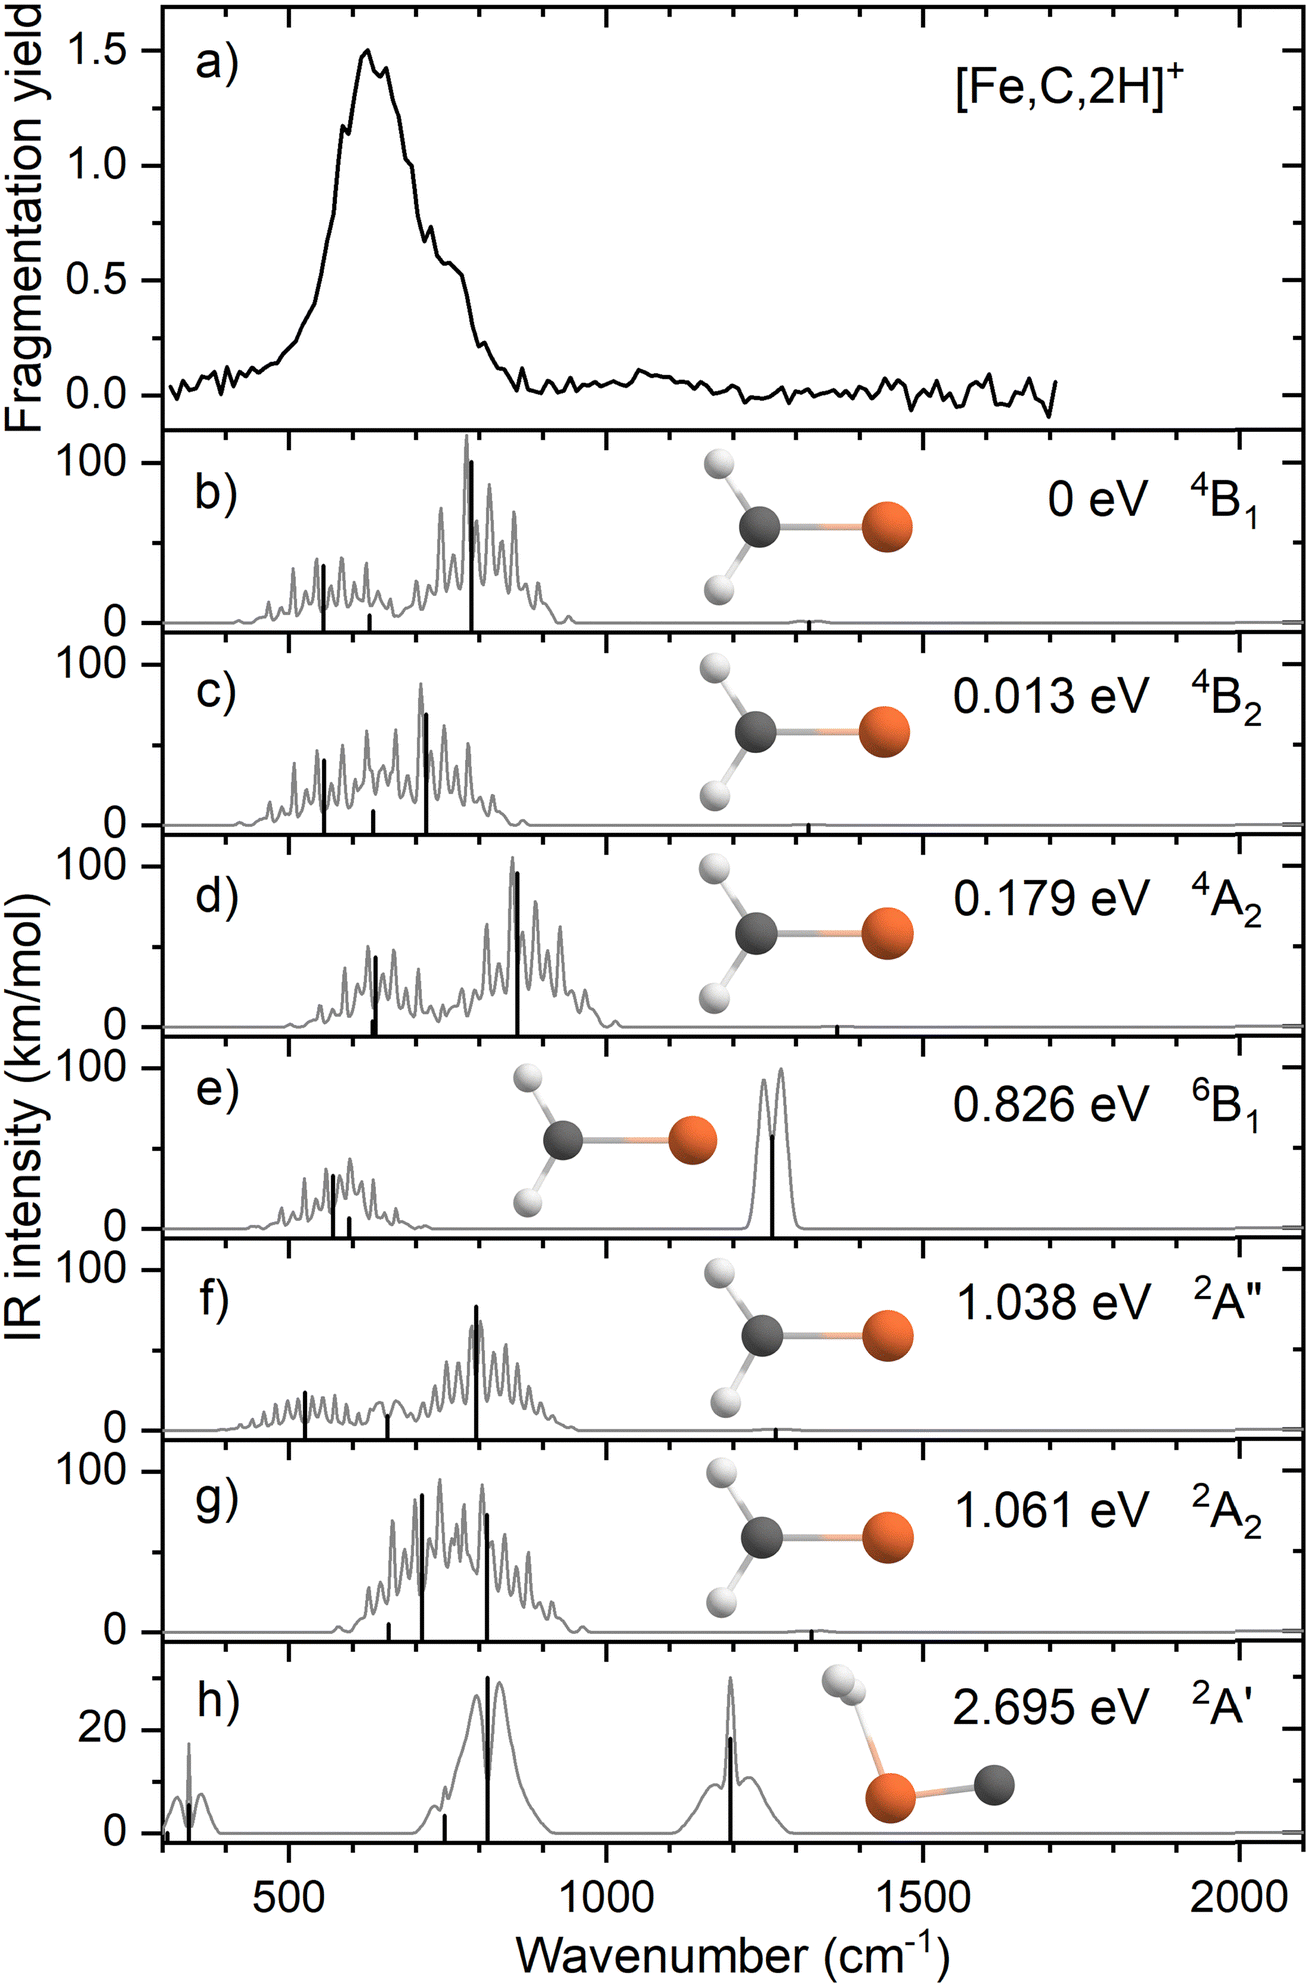 | ||
| Fig. 1 (a) Experimental IRMPD spectrum of [Fe,C,2H]+; (b)–(h) B3LYP/def2-TZVPPD calculated IR spectra of different [Fe,C,2H]+ states and isomers with the harmonic vibrations in black and the rovibrational envelopes in grey accompanied by geometric structure, relative energy, and electronic state. | ||
When fragmentation occurred, up to 50% of the original [Fe,C,2H]+ intensity was retained, and the yield of Fe+ was roughly twice that of FeC+, as shown in Fig. S2a of the ESI.† This observation appears at odds with the calculated dissociation energies for the fragmentation channels of [M,C,2H]+ listed in Table 1, which indicate that formation of FeC+ and H2 is thermodynamically preferred. However, formation of Fe+ + CH2 requires direct cleavage of the Fe–C bond over a loose transition state (TS), whereas formation of FeC+ + H2 is more complicated as it requires cleavage of both C–H bonds and formation of the H2 bond, and thus likely involves a tight TS. Such a tight TS would make the latter process entropically less favorable, and further, it potentially could result in a barrier in excess of the endothermicity shown in Table 1.
The calculated ground state (GS) for [Fe,C,2H]+ is a C2v symmetric iron carbene geometry, FeCH2+, with a 4B1 electronic state and a covalent double bond between the metal and CH2 group. Note that formation of this quartet spin species would require a spin surface crossing if the reactant Fe+ ions were efficiently cooled to their 6D ground state; however, it is also possible that the laser ablation source creates a population of the low-lying 4F excited state of Fe+. With the convention that the z-axis is the symmetry axis and that the molecule lies in the yz plane, the 4B1 GS has a Fe–C σ bonding molecular orbital (MO) (a1 symmetry, using 3dz2 on Fe, double occupancy), a Fe–C π bond (b1, Fe 3dxz, double), three non-bonding MOs localized on Fe: (a1, 3dx2−y2, double; a2, 3dxy, single; a1, 4s, single), and an antibonding MO combining the Fe 3dyz and CH2 orbitals (b2, single). Thus, the valence MO occupation (excluding the four CH2 bonding electrons) is (1a1)2(1b1)2(2a1)2(1a2)1(3a1)1(1b2)1.
Several additional electronic states were found on the quartet spin surface that also have the symmetric C2v structure. A second electronic state, 4B2, calculated to lie only 0.013 eV higher in energy, reverses the occupation of the 3dx2−y2 (2a1) and 3dxy (1a2) MOs; their non-bonding character explains the small energy difference between these two states. In another low-lying state (4A2), one electron in the 3dx2−y2 (2a1) MO is transferred to the antibonding 1b2 MO, leading to decreased stability, 0.18 eV above the GS. Additional carbene structures were located for different spin states. A 6B1 state located 0.83 above the GS has a MO occupation of (1a1)2(1b1)1(2a1)2(1a2)1(3a1)1(1b2)1(2b1)1 where the 2b1 MO is the antibonding version of the 1b1 Fe–C π bond. Two carbene structures were found on the doublet surface, of which the lowest, 2A″ has the same electron configuration as the 4B1 ground state, (1a1)2(1b1)2(2a1)2(1a2)1(3a1)1(1b2)1, but is slightly distorted from C2v symmetry (although the MOs can still be labeled using this symmetry) with Fe–H distances of 2.52 and 2.58 Å. This state lies 1.04 eV above the GS. The second doublet state located, a 2A2 (1a1)2(1b1)2(2a1)2(1a2)1(3a1)0(1b2)2 state with C2v symmetry, lies only 0.02 eV above the 2A″ state. A summary of all structures and electronic states, including energies relative to the reactants, found in this study is presented in the ESI,† Table S1.
We also explicitly checked whether stable agostic iron carbene geometries could be located, but as there are no empty 3d orbitals on Fe+, these all converged to symmetric carbene geometries. We did find a hydrido iron carbyne structure, HFeCH+ but only on the sextet surface (6A″) lying 3.32 eV above the GS. The lowest energy species with both hydrogen atoms connected to iron is a dihydrogen iron carbide, (H2)FeC+ (2A′) at 2.70 eV. Here, the H–H bond distance of 0.787 Å is slightly longer than the 0.743 Å calculated here at the same level of theory for the free H2 molecule. A dihydrido iron carbide, H2FeC+ (H–H distance is 2.88 Å) in a 4A″ state was found 5.54 eV above the GS.
Fig. 1b–h shows the simulated IR spectra of different [Fe,C,2H]+ isomers and states located computationally. Many species shown have calculated vibrational modes near the experimental bands. Of the six fundamental vibrations of C2v metal carbenes, two correspond to the symmetric and antisymmetric C–H stretch vibrations and are calculated to lie near 3100 cm−1. Four modes are located somewhere between 500 and 1500 cm−1: the CH2 rocking mode (in-plane CH2 bend, b2 symmetry, b-type transition), the M–C stretch (a1, a-type), the CH2 wagging mode (out-of-plane CH2 bend, b1, c-type), and the CH2 scissoring mode (a1, a-type). For the FeCH2+ (4B1) GS structure, these modes are calculated at 554, 627, 787, and 1321 cm−1, respectively, Table 2, with the C–H stretches at 3078 and 3182 cm−1. According to B3LYP calculations, the CH2 wagging and rocking vibrations are most intense (36 and 101 km mol−1), whereas the Fe–C stretch and CH2 scissoring mode (both involving a-type transitions) have calculated intensities of only 5 and 1 km mol−1, respectively. The effects of varying the MO occupation on the calculated IR spectrum are only marginal, with the main difference being a shift of the CH2 out-of-plane wagging vibration from 787 cm−1 (4B1 GS) to 716 cm−1 (4B2), Table 2.
| Experiment | Theory B3LYP/CCSDa | Mode description | |||
|---|---|---|---|---|---|
| Frequency (cm−1) | Strength | Frequency (cm−1) | Intensity (km mol−1) | ||
| a B3LYP and CCSD calculations used the def2-TZVPPD basis set. | |||||
| FeCH2+ (4B1) | 554/570 | 36/45 | CH2 rocking | ||
| 632 | s | 627/647 | 5/43 | M–C stretch | |
| 767 | m | 787/754 | 101/106 | CH2 wagging | |
| — | — | 1321/1358 | 1/1 | CH2 scissor | |
| FeCH2+ (4B2) | 555/567 | 40/50 | CH2 rocking | ||
| 632 | s | 632/646 | 9/43 | M–C stretch | |
| 767 | m | 716/744 | 69/98 | CH2 wagging | |
| — | — | 1319/1359 | 0/1 | CH2 scissor | |
| CoCH2+ (3A2) | 622/625 | 36/41 | CH2 rocking | ||
| 673 | s | 631/690 | 0/25 | M–C stretch | |
| 811 | s | 877/861 | 88/100 | CH2 wagging | |
| 948 | m | 1377/1410 | 3/23 | CH2 scissor | |
| CoCH2+ (3A1) | 601/624 | 31/39 | CH2 rocking | ||
| 673 | s | 625/693 | 1/14 | M–C stretch | |
| 811 | s | 893/881 | 89/100 | CH2 wagging | |
| 948 | m | 1382/1416 | 3/30 | CH2 scissor | |
The rotational profile simulations for all species in Fig. 1 reflect the large rotational constants involved (e.g., 9.98, 0.39, and 0.38 cm−1 for the 4B1 GS), which, in combination with the room temperature conditions of the experiment, lead to broad bands with complex substructure. The exothermicity of the reaction of Fe+ with oxirane is 0.16 ± 0.04 eV, indicating that the three lowest energy states are accessible at thermal energies (and potentially others if appreciable electronic excitation were retained by Fe+). Indeed, the energy difference between the 4B1 and 4B2 states is so small that population of both states is reasonable. Nevertheless, none of the three low-energy species in panels b–d yields a very convincing match with the experiment, although for all three structures, a broad absorption is predicted with the center of gravity close to the center of the experimentally observed band.
Comparison between simulated spectra for higher energy species and the experimental spectrum does not offer reason to suspect their presence. The 6B1 structure at +0.83 eV has a significantly different IR spectrum, most notably from the intensity increase of the CH2 scissoring mode to 58 km mol−1, while the CH2 wagging mode massively red shifts to 142 cm−1 and is left with an intensity of 14 km mol−1. The only spectrum that shows a compact band structure is that calculated for the 2A2 species, which arguably resembles the experimental spectrum best in shape but is shifted to the blue; it is, however, difficult to see how the formation of a structure at more than 1 eV above the GS could be favored, especially given the number of spin crossings required for its formation.
Alternative levels of theory for the spectroscopy of FeCH2+
Because of the mismatch in the comparison of the B3LYP computational spectra with experiment, we also explored other levels of theory, starting with MP2. The MP2 calculation of the 4B1 state provided similar vibrational frequencies as the B3LYP calculation, 593, 660, 710, 1409, 3160, and 3273 cm−1, but to our surprise, the intensity profile was substantially different, primarily because the intensities of the two a-type transitions were much higher, 76 and 34 km mol−1, respectively, versus 5 and 1 km mol−1 for B3LYP (see Fig. S4, ESI†). The enhanced intensity of the Fe–C stretch would be sufficient to better reproduce the experimental band, whereas the enhanced intensity of the CH2 scissors mode is inconsistent with the failure to observe a band in this wavenumber range. To explore this phenomenon further, we performed CCSD/def2-TZVPPD calculations. CCSD(T)//CCSD calculations place the 4B2 state only 0.0005 eV above the 4B1 GS. CCSD geometry optimizations for the 4B1/4B2 states provide similar frequency predictions as the B3LYP results, 570/567, 647/646, 754/744, 1358/1359, 3122/3122, and 3228/3227 cm−1, but again the intensity profile is distinct. Now, the CH2 rock (b-type) and wag (c-type) have similar intensities (45/50 and 106/98, respectively), whereas the a-type Fe–C stretch has a much larger predicted intensity (43/43 km mol−1) compared to the B3LYP results. Unlike the MP2 results, the scissors (a-type) mode has an intensity (<1/<1 km mol−1) consistent with experiment. Fig. 2 compares the CCSD predicted spectrum for the 4B1 GS (the 4B2 spectrum is very similar, see Fig. S5b of the ESI†) with the experimental spectrum and clearly provides an improved match compared with the B3LYP results of Fig. 1. Fig. 2 also includes a predicted spectrum with the Fe–C stretch band having an intensity that matches the MP2 calculation. As shown in Fig. 2c that includes more broadening, the latter is probably the best match to the experimentally observed band. It can also be realized that some of variations in intensities may be a result of comparing the multiple photon experimental absorptions with the single photon theoretical predictions.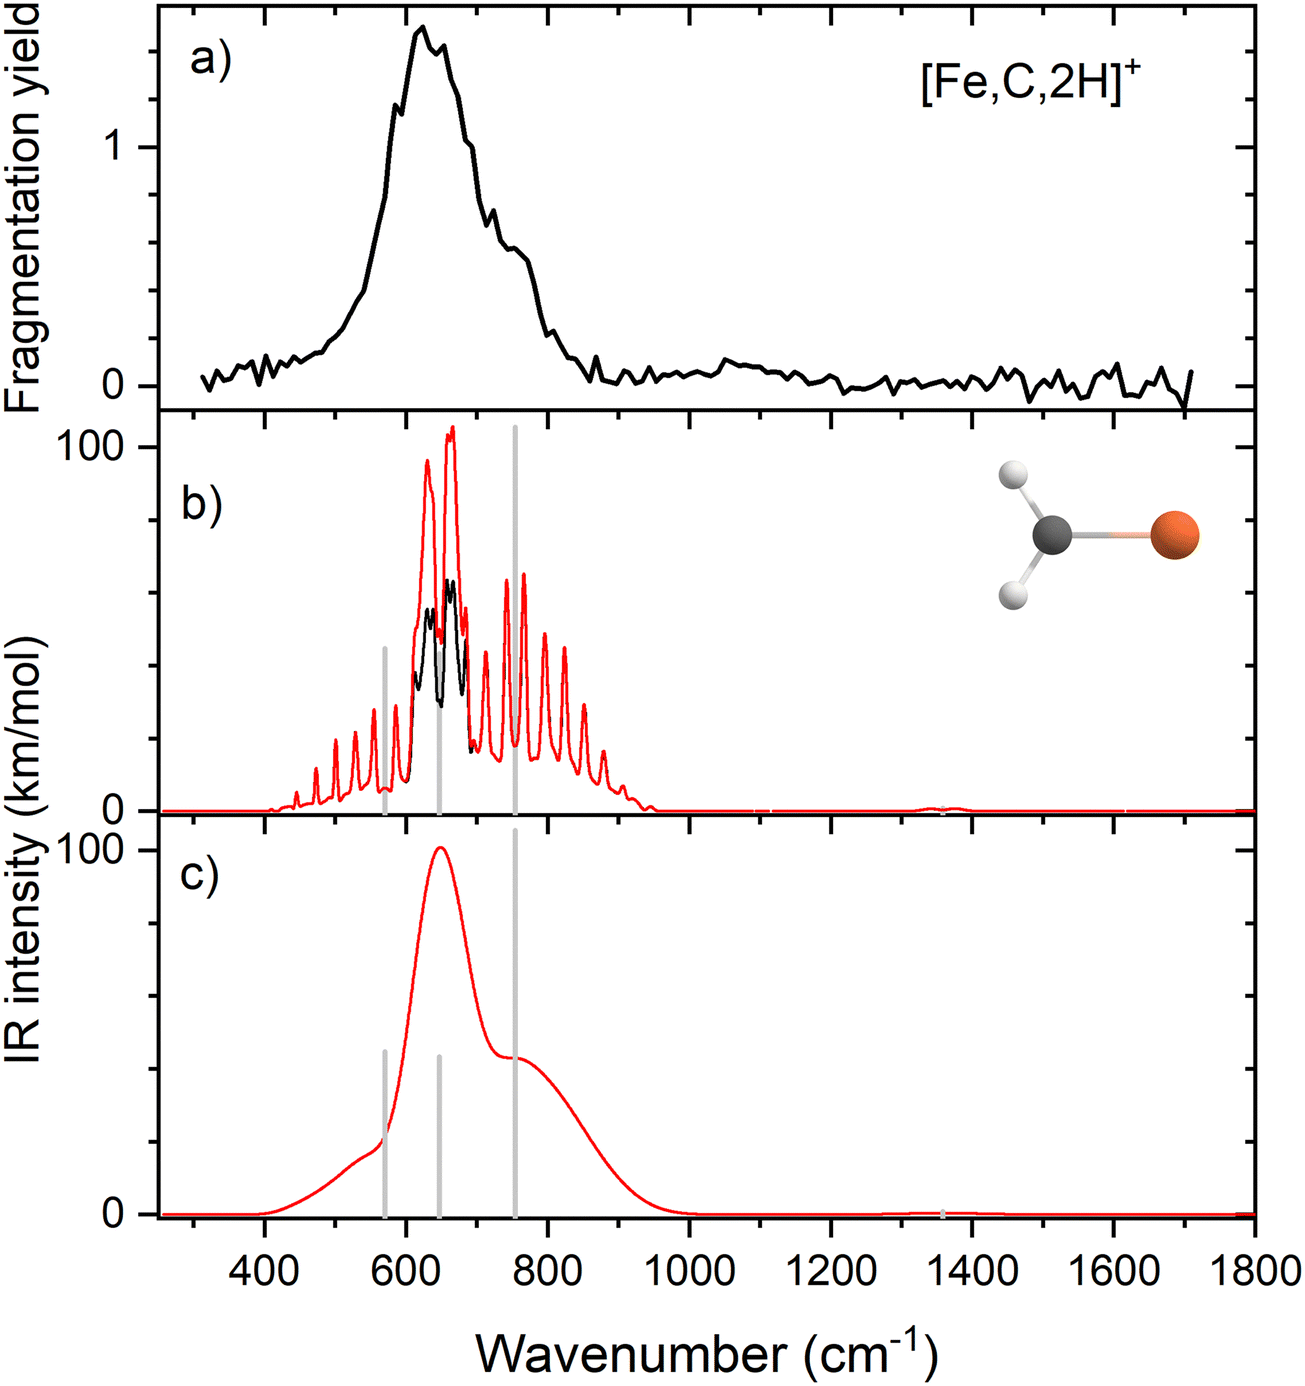 | ||
| Fig. 2 (a) Experimental IRMPD spectrum of [Fe,C,2H]+; (b) harmonic stick spectrum of the FeCH2+ (4B1) structure at the CCSD/def2-TZVPPD level and rovibrational simulations using the original IR intensity for the Fe–C stretch mode at 43 km mol−1 (black) and with a double value (red); (c) same as (b) but convolved with a 9% FWHM Gaussian lineshape function to simulate broadening effects. | ||
The enhanced intensity in the Fe–C stretch in both MP2 and CCSD computations is the result of a well-known phenomenon in DFT calculations,43 which generally underestimate the charge separation in something like the Fe–CH2 bond and therefore the dipole derivative with respect to the Fe–C stretch. For instance, in the 4B1 ground state, the charges on Fe and CH2 calculated (using the natural bond orbital formalism)44 at the equilibrium geometry using B3LYP are +1.16 e and −0.16 e, respectively, (for a charge difference of 1.32 e), but +1.51 e and −0.51 e for CCSD (charge difference of 2.01 e). As the bond extends by 0.2 Å, the charge difference changes by +0.02 e for B3LYP (leading to very low IR intensity) but by −0.15 e for CCSD (yielding a moderate IR intensity). This phenomenon was explored further by examining results for several other density functionals,35,36,45–55 as detailed in Table 3. In general, all DFT approaches show the same trends with the predicted intensity of the Fe–C stretch varying from 3–24 km mol−1, while maintaining the CH2 wag at 96–109 km mol−1 (except M06-2X at 83 km mol−1). All of these lie less than about half the intensity found at the CCSD level. The predicted frequency for the Fe–C stretch is insensitive to the level of theory, varying from 619 to 675 cm−1, which indicates that the different levels of theory yield similar force constants for this motion. In contrast, the CH2 wag shows modest dispersion, 678–808 cm−1. This is shown pictorially in Fig. 3 for all four modes accessible in the present experiment. The Fe–C stretch shows the largest range of intensities with the DFT values clustered at low values, CCSD being intermediate, and MP2 relatively high. The CH2 wags have comparable intensities for all levels of theory. The dispersion in intensities is also generally small for the CH2 rock and scissors motions. Here, the outliers for the CH2 rock are MN15L (1 km mol−1) and TPSS (24 km mol−1), with all other levels of theory clustered between 36 and 55 km mol−1. Note that these two levels also predict frequencies much lower than other levels. For the CH2 scissors, the outliers are MP2 harmonic (34 km mol−1) and anharmonic (44 km mol−1) with all other levels of theory, including CCSD, predicting a very weak band intensity. Here, most levels of theory predict a frequency between 1313 and 1358 cm−1, whereas the MP2 calculations shift this up by more than 50 cm−1. Because of the disparity in the predicted intensities of the M–C stretch, we treat its intensity as a potential adjustable parameter in further comparisons between theory and experiment. The experimentally observed band positions, together with harmonic normal mode frequencies and intensities calculated at the B3LYP and CCSD levels are combined in Table 2.
| Level of theory | CH2 rock | Fe–C stretch | CH2 wag | CH2 scissors |
|---|---|---|---|---|
| TPSS46 | 509 (24) | 619 (3) | 808 (102) | 1313 (0) |
| B3LYP35,36 | 554 (36) | 627 (5) | 787 (101) | 1321 (1) |
| B3LYP-GD3BJ47 | 555 (36) | 627 (5) | 787 (101) | 1321 (1) |
| X3LYP36,48 | 556 (37) | 630 (6) | 784 (101) | 1321 (1) |
| ωB97X-D49 | 549 (44) | 675 (7) | 790 (109) | 1345 (6) |
| PW6B95D350 | 549 (40) | 638 (8) | 776 (104) | 1327 (1) |
| B3PW9135,45 | 544 (36) | 639 (9) | 769 (103) | 1307 (1) |
| Cam-B3LYP51 | 554 (42) | 655 (10) | 786 (107) | 1335 (6) |
| MN15L52 | 449 (1.4) | 632 (11) | 770 (96) | 1318 (<1) |
| PBE053 | 548 (40) | 645 (12) | 754 (104) | 1305 (<1) |
| M06-2X54 | 560 (48) | 625 (16) | 678 (83) | 1311 (3) |
| BHHLYP36 | 586 (52) | 648 (23) | 728 (97) | 1358 (3) |
| PBE0-DH55 | 635 (55) | 654 (24) | 802 (104) | 1363 (1) |
| CCSD(full)41 | 570 (45) | 647 (43) | 754 (106) | 1358 (1) |
| MP2(full)40 | 593 (47) | 660 (76) | 710 (81) | 1409 (34) |
| MP2(full) – anharmonic | 569 (44) | 657 (88) | 682 (82) | 1432 (44) |
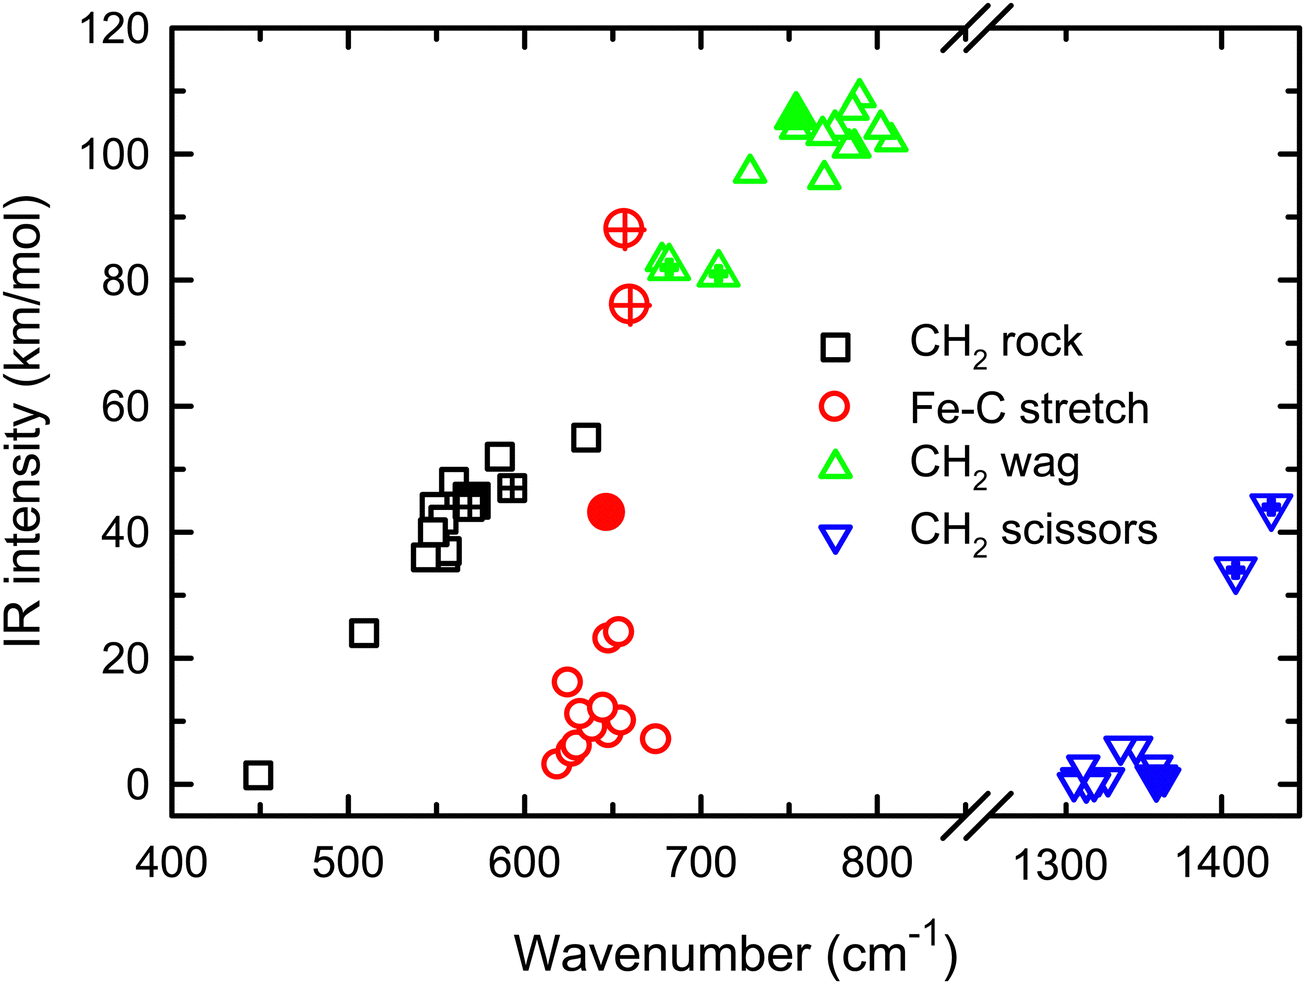 | ||
| Fig. 3 Theoretical IR intensities versus wavenumber for the four vibrations accessible experimentally in the present experiments. CCSD results are closed symbols and MP2 results are hatched. | ||
IR spectroscopy of CoCH2+
Resonant IR irradiation of [Co,C,2H]+ (m/z = 73) leads to two photofragments, Co+ and CoC+, with Co+ being the major fragment (∼90%), as shown in Fig. S2b of the ESI.† This result is consistent with the thermochemistry in Table 1. Similar to the Fe case, the calculated dissociation energies for the fragmentation channels of [Co,C,2H]+ listed in Table 1 slightly favor formation of CoC+ and H2. As discussed above, the observation that Co–CH2 cleavage dominates may be because dehydrogenation is entropically less favorable and could have a barrier in excess of the endothermicity shown in Table 1.Fig. 4a shows the experimental IRMPD spectrum of [Co,C,2H]+. It shows one dominant band, which appears to consist of two maxima around 673 and 811 cm−1. The band has a relatively long tail to the blue which could be a third, weaker band. Its center is estimated around 948 cm−1. Fig. 4b–g shows the B3LYP simulated IR spectra of different [Co,C,2H]+ isomers and states. The ground state is a symmetric cobalt carbene geometry, CoCH2+, with a 3A2 electronic state. The MOs are the same as for FeCH2+, such that the valence MO configuration for the 3A2 state is (1a1)2(1b1)2(2a1)2(1a2)1(3a1)1(1b2)2, with the singly occupied MOs being the 3dxy (1a2) and 4s (3a1) MOs. A 3A1 state, only 0.050 eV higher in energy, is obtained by moving an electron from the 3dx2−y2 (2a1) MO to the 3dxy (1a2) MO, both non-bonding. Thus, the 3A2 and 3A1 states of CoCH2+ are analogous to the 4B1 and 4B2 states of FeCH2+ with addition of the extra electron to the antibonding 1b2 MO. If the 1b2 MO is singly occupied instead of the 3a1 or 1a2 MOs, 3B1 and 3B2 states are found and lie 0.41 and 0.90 eV above the GS. Singlet spin states of CoCH2+ (1A1 and 1A2) were found 0.71 and 0.77 eV above the GS. These states have the same valence MO configuration as the triplet states, but the two singly occupied MOs are singlet coupled instead of triplet coupled, leading to the higher energy. Similar to [Fe,C,2H]+, trial structures for agostic cobalt carbenes collapsed into the symmetric carbenes, again because there are no empty 3d orbitals to support this distorted structure. The lowest energy quintet spin species is a distorted carbene with a 5A′ state found at 0.86 eV with one of the hydrogen atoms closer to the cobalt atom (2.56 and 2.63 Å). A second quintet carbene (5A″) was found 0.94 eV above the GS and has both hydrogen atoms bent slightly out of the molecular plane (H–H–Co–C dihedral angle of 7.3°). The lowest-energy hydrido cobalt carbyne, HCoCH+, was found on the quintet surface (5A′) at 3.26 eV above the GS. All geometries with two hydrogens bound to cobalt converged to dihydrogen cobalt carbides, (H2)CoC+, with the lowest being a 1A′ state with an energy 3.09 eV above the GS. Table S1 of the ESI† lists all [Co,C,2H]+ species located theoretically.
 | ||
| Fig. 4 (a) Experimental IRMPD spectrum of [Co,C,2H]+, the black trace is the average of two scans, the red trace is a single scan; (b)–(g) B3LYP/def2-TZVPPD calculated IR spectra of different [Co,C,2H]+ states and isomers with the harmonic vibrations in black and the rovibrational envelopes in grey accompanied by geometric structure, relative energy, and electronic state. | ||
In contrast to the spectra calculated for Fe carbene isomers, those for cobalt carbene states are very much alike. As for the analogous FeCH2+ states, the 3A2 and 3A1 states of CoCH2+ shift the CH2 rocking frequency, from 622 to 601 cm−1, respectively, and the CH2 wagging mode, from 877 to 893 cm−1. The intensities of the CH2 rocking and CH2 wagging modes differ by at most 16%. The Co–C stretch and CH2 scissoring modes both shift less than 5 cm−1 and have intensities below 3 km mol−1 in B3LYP calculations. Like the FeCH2+ results, the B3LYP spectra do not provide a good reproduction of the experimental spectrum for any structure located theoretically, Fig. 4.
Therefore, we again tested MP2 and CCSD approaches. Similar to FeCH2+, the intensity profile obtained from MP2 calculations (Fig. S4, ESI†) greatly enhances the Co–C stretch, such that it is slightly more intense than the CH2 out-of-plane wag (intensities of 76 and 83 km mol−1 for the 3A2 and 3A1 states, respectively). CCSD(T)//CCSD calculations indicate that the 3A1 state lies only 0.015 eV above the 3A2 GS. Fig. 5 shows the spectrum predicted by the CCSD level of theory for the 3A2 GS, where the Co–C stretch has a predicted intensity of 25 km mol−1 (the spectrum for the low-lying 3A1 state is very similar as shown in Fig. S5d of the ESI†). As for the case of FeCH2+, the experimental spectrum is matched better if the intensity of this band is approximately twice that predicted at the CCSD level. Here, the moderate IR intensity (23 km mol−1) predicted for the CH2 scissor vibration is not matched by the observed spectrum. In any case, we attribute the experimental spectrum to a combination of the symmetric cobalt carbene cation in both the closely-spaced 3A2 and 3A1 states because the reaction of ground state Co+ (3F, 3d8) with oxirane is slightly endothermic, by 0.08 ± 0.05 eV. Thus, formation of these states can be driven by near-thermal energies, as shown previously.50 Although contributions from electronically excited states could be present, the lowest energy excited state of Co+, 5D (4s13d7), should be less reactive than the 3F (3d8) GS because the 4s orbital is occupied.56
 | ||
| Fig. 5 (a) Experimental IRMPD spectrum of [Co,C,2H]+; (b) harmonic stick spectrum of the CoCH2+ (3A2) structure at the CCSD/def2-TZVPPD level and rovibrational simulations using the original IR intensity for the Co–C stretch mode at 25 km mol−1 (black) and with a double value (red); (c) same as (b) but convolved with a 9% FWHM Gaussian lineshape function to simulate broadening effects. | ||
Clearly, although the CCSD level reproduces the experimental spectrum with reasonable fidelity in the 500–1200 cm−1 range, the predicted peak near 1400 cm−1 (CH2 scissors) is not found in the experimental spectrum. When irradiating [Co,C,2H]+ under higher IR fluences (not shown), we observed a broad, unresolved band stretching from 500–1800 cm−1. We speculate that under the current experimental conditions, IR excitation is not efficient enough to induce fragmentation at the predicted 1400 cm−1 band and that higher intensities rapidly lead to non-resonant absorption.
Group 8 and 9 trends: carbene verses hydrido carbyne
In previous work, we have presented the experimental IRMPD spectra of [Ru,C,2H]+, [Rh,C,2H]+,20 [Os,C,2H]+, and [Ir,C,2H]+,8–11 the 4d and 5d congeners of the group 8 and 9 species presented in this study. If we put the current assignments for Fe and Co in perspective with the previous findings, we note that both 5d elements (Os and Ir) prefer the formation of a hydrido carbyne structure, whereas the 3d elements form carbene structures. Our recent work showed that the 4d elements are mixed, with Ru forming both structures and Rh yielding only the carbene.20 Energetically, 5d hydrido carbynes are preferred, but more strongly so for the group 8 elements as indicated by the energetics presented in Fig. 6. This is consistent with the assignment of the product of osmium (a group 8 element) to HOsCH+ (2A′), whereas part of the product for iridium (group 9) is assigned to a carbene structure (0.3 eV higher in energy). This trend appears to hold for 4d elements, where the 4B2 ruthenium carbene is almost isoenergetic with the 2A′ hydrido ruthenium carbyne, whereas the HRhCH+ (1A′) is significantly higher in energy than the RhCH2+ (1A1). For 3d elements, hydrido carbyne structures are not competitive at all, lying several eV higher in energy. Thus, as one moves down a group in the periodic table, hydrido carbyne structures become increasingly competitive in terms of energy compared to carbene structures, but less so along a row. | ||
| Fig. 6 Energetic comparison between the lowest energy species of carbene (MCH2+) and hydrido carbyne (HMCH+) structures for group 8 and 9 metal cations. For each, the lowest energy state of both configurations is indicated together with the energy difference, E(HMCH+) − E(MCH2+), in eV. B3LYP energetics for Os are taken from ref. 6, 11 and for Ir from ref. 8 the other values are from this work. B3LYP/def2-TZVPPD energies are shown in blue and CCSD(T)//CCSD energies are in green. CCSD calculations for HCoCH+ on the quintet spin surface did not converge (dnc). | ||
One rationale for these trends is thermodynamic. H–M![[triple bond, length as m-dash]](https://www.rsc.org/images/entities/char_e002.gif) CH+ has four covalent bonds to the metal whereas MCH2+ only has two covalent M
CH+ has four covalent bonds to the metal whereas MCH2+ only has two covalent M![[double bond, length as m-dash]](https://www.rsc.org/images/entities/char_e001.gif) C bonds. In general, the 5d TM have stronger bonds to C and H than the 4d or 3d TM, e.g., for group 9, see Fig. 4 in ref. 4 (for group 8, see ref. 6, 19, 22, 24, 57 and 39). Thus, the more highly coordinated hydrido carbyne structure becomes more favorable for 5d relative to 4d TMs and even more so for 3d TMs. In addition, one can also consider the promotion energies required to put the metal cation into an electronic configuration needed for bonding. (Here, the promotion energies are averaged over all spin–orbit levels and taken from ref. 58.) For the group 8 elements, both MCH2+ and HMCH+ species correlate with an (n − 1)d6ns1 electronic configuration on M+ so the thermodynamic considerations dictate the vertical trends. For the group 9 elements, the triplet states of MCH2+ correlate with the (n − 1)d7ns1 electronic configuration on M+. This is the ground state (GS) for Ir+, a low-lying state for Co+ (0.43 eV above the 5F, 3d8 GS), but a high-energy state for Rh+, 2.13 eV higher in energy than the 5F (4d8) GS. Thus, the RhCH2+ prefers the 1A1 state that correlates with the 5F (4d8) GS. For the HMCH+ structures of the group 9 elements, the 1A′ GS correlates with either an (n − 1)d6ns2 or low-spin (n − 1)d7ns1 (3F) electronic configuration on M+. The former configuration is generally higher in energy, whereas the latter lies 1.21, 3.13, and 1.33 eV above the GS of Co+, Rh+, and Ir+, respectively. Because these promotion energies are much higher than those for the group 8 metal cations, the HMCH+ structures are more favorable for group 8 than for group 9, as seen in Fig. 6.
C bonds. In general, the 5d TM have stronger bonds to C and H than the 4d or 3d TM, e.g., for group 9, see Fig. 4 in ref. 4 (for group 8, see ref. 6, 19, 22, 24, 57 and 39). Thus, the more highly coordinated hydrido carbyne structure becomes more favorable for 5d relative to 4d TMs and even more so for 3d TMs. In addition, one can also consider the promotion energies required to put the metal cation into an electronic configuration needed for bonding. (Here, the promotion energies are averaged over all spin–orbit levels and taken from ref. 58.) For the group 8 elements, both MCH2+ and HMCH+ species correlate with an (n − 1)d6ns1 electronic configuration on M+ so the thermodynamic considerations dictate the vertical trends. For the group 9 elements, the triplet states of MCH2+ correlate with the (n − 1)d7ns1 electronic configuration on M+. This is the ground state (GS) for Ir+, a low-lying state for Co+ (0.43 eV above the 5F, 3d8 GS), but a high-energy state for Rh+, 2.13 eV higher in energy than the 5F (4d8) GS. Thus, the RhCH2+ prefers the 1A1 state that correlates with the 5F (4d8) GS. For the HMCH+ structures of the group 9 elements, the 1A′ GS correlates with either an (n − 1)d6ns2 or low-spin (n − 1)d7ns1 (3F) electronic configuration on M+. The former configuration is generally higher in energy, whereas the latter lies 1.21, 3.13, and 1.33 eV above the GS of Co+, Rh+, and Ir+, respectively. Because these promotion energies are much higher than those for the group 8 metal cations, the HMCH+ structures are more favorable for group 8 than for group 9, as seen in Fig. 6.
Fig. 6 shows that the hydrido carbyne structures for 4d and 5d elements are found on the same or a lower spin surface as that of the lowest energy carbene structure. However, for Fe and Co, the lowest energy hydrido carbynes were found on the sextet and quintet spin surfaces, respectively. To investigate whether we might have missed carbyne structures on the lower spin surfaces, the potential energy surfaces (PESs) connecting the MCH2+ and HMCH+ structures were calculated for both metal cations investigated in this study (Fig. 7). PESs were generated by starting from a symmetric carbene structure and systematically increasing the C–M–H angle while the rest of the molecule was allowed to relax. The PES scans were generated for both the A′ and A″ configurations in dashed and solid lines, respectively. No stable minimum for a hydrido carbyne structure for Fe or Co is found on any of the two lowest spin surfaces, explaining why all trial hydrido carbyne geometries for [Fe,C,2H]+ and [Co,C,2H]+ converged into the carbene structure. For Co, a very shallow well was located along the 1A′ surface, but this species is 3.7 eV above the symmetric cobalt carbene ground state.
 | ||
| Fig. 7 Potential energy surfaces of [M,C,2H]+ along the C–M–H angle calculated at the uB3LYP/def2-TZVPPD level of theory. Solid diamonds indicate calculated structures that successfully converged to true minima at the indicated C–M–H angle. Solid lines indicate A″ states while A′ states are indicated by dashed lines. The doublet spin surface is depicted in green, quartet in black, singlet in blue and triplet in red. All energy values are relative to the GS symmetric carbene structures. | ||
Group 8 and 9 trends: charge separation
The observation that the intensities of the M–C stretches of FeCH2+ and CoCH2+ are not predicted well at DFT levels of theory leads one to wonder how extensive this particular problem is. As noted above, our work with the 5d TM systems utilized B3LYP calculations that reproduced the experimental spectra with fidelity. Likewise, our recent studies of [Ru,C,2H]+ showed comparable predictions between B3LYP and CCSD levels of theory.20 For [Rh,C,2H]+, the situation was complicated by the multireference character of the RhCH2+ states such that more advanced CCSD methods supplied the best reproduction of the data. Here, we directly compare the B3LYP and CCSD predictions for the group 8 and 9 transition metals to see how pervasive the problem is. We find that for the 4B1 states of the group 8 carbenes, the only mode that changes intensity drastically (factor of 8 or more) is the M–C stretch for FeCH2+. For both RuCH2+ and OsCH2+, the intensity of the M–C stretch remains very small. For the group 9 carbenes in the 3A2 state, CoCH2+ shows a dramatic increase in intensity for the M–C stretch and a more modest increase for the CH2 scissors, whereas for RhCH2+ and IrCH2+, the M–C stretch intensities are comparable for B3LYP and CCSD calculations and the CH2 scissors changes by factors of less than three. The results are summarized in Table S5 of the ESI.† Thus, the failure of DFT in predicting the intensities of the M–C stretch appears to be confined to the first-row (3d) TM.Conclusion
Reacting the 3d group 8 and 9 transition metal ions (M+ = Fe+ and Co+) with oxirane in a room temperature ion trap led to the formation of [M,C,2H]+. These species were mass isolated in the FTICR mass spectrometer coupled to the infrared intracavity free-electron laser FELICE, where they were spectroscopically characterized. The IRMPD spectra of [M,C,2H]+ with M = Fe and Co each contain one broad band around 700 cm−1 with minor differences in the extent of substructure. On the basis of B3LYP and CCSD(T)//CCSD energetics, both structures are expected to be carbenes. Comparison of the experimental IRMPD spectra with the predictions from DFT calculations offer poor agreement, making the assignment of structures tenuous at best. Calculations at the CCSD level offer a large improvement in the predicted intensities for the M–C stretch vibrations that match the experimental spectrum much better, although for CoCH2+, a simultaneous increase in the CH2 scissor mode intensity is not matched by experiment. Nevertheless, these calculations suggest the structures of [M,C,2H]+ for M = Fe and Co are indeed carbenes, each in two nearly degenerate electronic states.The experimental spectra for [Fe,C,2H]+ and [Co,C,2H]+ are reproduced much better by CCSD calculations than by B3LYP calculations, primarily because the predicted intensity of the M–C stretch is much higher according to CCSD calculations. Indeed, enhanced M–C stretch intensities (consistent with MP2 calculations) provide even better agreement with experiment. This failure of the B3LYP functional appears to be systematic for all DFT approaches, although some functionals yield improved intensities but still do not match the CCSD predictions. This appears to be a consequence of a reduced separation in charge in the MCH2+ species. Exploration of this effect as one moves down the periodic table indicates that this failure does not propagate from the 3d TM to the 4d and 5d TM, where DFT approaches provide spectra that are in good agreement with experiment. Further, we explore the relative stabilities of the MCH2+versus HMCH+ species in terms of the periodic trends for these group 8 and 9 transition metals: Fe, Ru, Os and Co, Rh, Ir. It appears that promotion energy arguments are involved coupled with the number and strength of the covalent bonds needed to form the two structures.
Conflicts of interest
There are no conflicts to declare.Acknowledgements
This work was funded by NWO's Materials for Sustainability program (grant no. 739.017.008). We gratefully acknowledge the Nederlandse Organisatie voor Wetenschappelijk Onderzoek (NWO) for the support of the FELIX Laboratory and for CPU time on the Dutch National Supercomputers Cartesius and Snellius (project number 2021.055). Financial support was also provided by the National Science Foundation (grant no. CHE-2313553).References
- R. H. Crabtree, Organometallic alkane CH activation, J. Organomet. Chem., 2004, 689(24), 4083–4091, DOI:10.1016/j.jorganchem.2004.07.034; K. L. Stone and A. S. Borovik, Lessons from Nature: Unraveling Biological C–H Bond Activation, Curr. Opin. Chem. Biol., 2009, 13(1), 114–118 CrossRef PubMed.
- D. K. Bohme and H. Schwarz, Gas-Phase Catalysis by Atomic and Cluster Metal Ions: The Ultimate Single-Site Catalysts, Angew. Chem., Int. Ed., 2005, 44, 2336–2354 CrossRef CAS PubMed; J. Roithová and D. Schröder, Selective Activation of Alkanes by Gas-Phase Metal Ions, Chem. Rev., 2010, 110(2), 1170–1211 CrossRef PubMed; J. Sauer and H. J. Freund, Models in Catalysis, Catal. Lett., 2015, 145(1), 109–125 CrossRef.
- S. W. Buckner, T. J. MacMahon, G. D. Byrd and B. S. Freiser, Gas-Phase Reactions of Nb+ and Ta+ with Alkanes and Alkenes. C–H Bond Activation and Ligand-Coupling Mechanisms, Inorg. Chem., 1989, 28, 3511–3518 CrossRef CAS; K. K. Irikura and J. L. Beauchamp, Osmium Tetroxide and Its Fragment Ions in the Gas Phase: Reactivity with Hydrocarbons and Small Molecules, J. Am. Chem. Soc., 1989, 111, 75–85 CrossRef; K. K. Irikura and J. L. Beauchamp, Electronic Structure Considerations for Methane Activation by Third-row Transition-metal Ions, J. Phys. Chem., 1991, 95, 8344–8351 CrossRef; K. K. Irikura and J. L. Beauchamp, Methane Oligomerization in the Gas Phase by Third-Row Transition-Metal Ions, J. Am. Chem. Soc., 1991, 113, 2769–2770 CrossRef; U. Achatz, M. Beyer, S. Joos, B. S. Fox, G. Niedner-Schatteburg and V. E. Bondybey, The Platinum Hydrido-Methyl Complex: A Frozen Reaction Intermediate?, J. Phys. Chem. A, 1999, 103, 8200–8206 CrossRef; X.-G. Zhang, R. Liyanage and P. B. Armentrout, The Potential Energy Surface for Activation of Methane by Pt+: A Detailed Guided-Ion Beam Study, J. Am. Chem. Soc., 2001, 123, 5563–5575, DOI:10.1021/ja010382o; P. B. Armentrout, S. Shin and R. Liyanage, Guided-Ion Beam and Theoretical Study of the Potential Energy Surface for Activation of Methane by W+, J. Phys. Chem. A, 2006, 110, 1242–1260, DOI:10.1021/jp052732p; L. G. Parke, C. S. Hinton and P. B. Armentrout, Experimental and Theoretical Studies of the Activation of Methane by Ta+ and the Bond Energies of Ta+-CHx (x = 1–3), J. Phys. Chem. C, 2007, 111, 17773–17787, DOI:10.1021/jp070855z.
- F.-X. Li, X.-G. Zhang and P. B. Armentrout, The Most Reactive Third-row Transition Metal: Guided Ion Beam and Theoretical Studies of the Activation of Methane by Ir+, Int. J. Mass Spectrom., 2006, 255/256, 279–300, DOI:10.1016/j.ijms.2006.02.021.
- A. Shayesteh, V. V. Lavrov, G. K. Koyanagi and D. K. Bohme, Reactions of Atomic Cations with Methane: Gas Phase Room-Temperature Kinetics and Periodicities in Reactivity, J. Phys. Chem. A, 2009, 113, 5602–5611 CrossRef CAS PubMed.
- P. B. Armentrout, L. Parke, C. Hinton and M. Citir, Activation of Methane by Os+: Guided Ion Beam and Theoretical Studies, ChemPlusChem, 2013, 78(9), 1157–1173, DOI:10.1002/cplu.201300147.
- P. B. Armentrout, Methane Activation by 5d Transition Metals: Energetics, Mechanisms, and Periodic Trends, Chem. – Eur. J., 2017, 23, 10–18, DOI:10.1002/chem.201602015.
- V. J. F. Lapoutre, B. Redlich, A. F. G. van der Meer, J. Oomens, J. M. Bakker, A. Sweeney, A. Mookherjee and P. B. Armentrout, Structures of the Dehydrogenation Products of Methane Activation by 5d Transition Metal Cations, J. Phys. Chem. A, 2013, 117, 4115–4126, DOI:10.1021/jp400305k.
- C. J. Owen, G. C. Boles, V. Chernyy, J. M. Bakker and P. B. Armentrout, Structures of the Dehydrogenation Products of Methane Activation by 5d Transition Metal Cations Revisited: Deuterium Labeling and Rotational Contours, J. Chem. Phys., 2018, 148, 044307, DOI:10.1063/1.5016820.
- J. M. Bakker, C. J. Owen, S. W. Nooteboom, O. V. Lushchikova and P. B. Armentrout, Structural characterization of [M,C,2H]+ products formed by reaction of 5d metal cations Pt+ and Ir+ with ethylene oxide and Ta+ with methane using messenger spectroscopy, J. Mol. Spectrosc., 2021, 378, 111472, DOI:10.1016/j.jms.2021.111472.
- P. B. Armentrout, S. Kuijpers, O. Lushchikova, R. L. Hightower, G. C. Boles and J. M. Bakker, Spectroscopic Identification of the Carbyne Hydride Structure of the Dehydrogenation Product of Methane Activation by Osmium Cations, J. Am. Soc. Mass Spectrom., 2018, 29, 1781–1791, DOI:10.1007/s13361-018-1929-7.
- J. K. Perry, G. Ohanessian and W. A. Goddard, Mechanism and Energetics for Dehydrogenation of Methane by Gaseous Iridium Ions, Organometallics, 1994, 13, 1870–1877 CrossRef CAS.
- L. F. Halle, P. B. Armentrout and J. L. Beauchamp, Formation of Chromium Carbene Ions by Reaction of Electronically Excited Chromium Ions with Methane in the Gas Phase, J. Am. Chem. Soc., 1981, 103, 962–963 CrossRef CAS; N. Aristov and P. B. Armentrout, Methane Activation by V+: Electronic and Translational Energy Dependence, J. Phys. Chem., 1987, 91, 6178–6188 CrossRef; L. S. Sunderlin and P. B. Armentrout, Methane Activation by Ti+: Electronic and Translational Energy Dependence, J. Phys. Chem., 1988, 92, 1209–1219 CrossRef; R. Georgiadis and P. B. Armentrout, Translational and Electronic Energy Dependence of Chromium Ion Reactions with Methane, J. Phys. Chem., 1988, 92, 7067–7074 CrossRef; R. Georgiadis and P. B. Armentrout, Translational and Electronic Energy Dependence of the Reaction of Mn+ with Ethane, Int. J. Mass Spectrom. Ion Process., 1989, 91, 123–133 CrossRef; F. Liu, X.-G. Zhang and P. B. Armentrout, Activation of CH4 by Gas-phase Ni+ and the Thermochemistry of Ni Ligand Complexes, Phys. Chem. Chem. Phys., 2005, 7, 1054–1064, 10.1039/B500639M.
- R. H. Schultz, J. L. Elkind and P. B. Armentrout, Electronic Effects in C–H and C–C Bond Activation: State-specific Reactions of Fe+(6D, 4F) with Methane, Ethane and Propane, J. Am. Chem. Soc., 1988, 110, 411–423 CrossRef CAS.
- L. S. Sunderlin and P. B. Armentrout, Periodic Trends in Chemical Reactivity: Reactions of Sc+, Y+, La+, and Lu+ with Methane and Ethane, J. Am. Chem. Soc., 1989, 111, 3845–3855, DOI:10.1021/ja00193a015.
- C. L. Haynes, Y.-M. Chen and P. B. Armentrout, The Potential Energy Surface for Activation of Methane by Co+: An Experimental Study, J. Phys. Chem., 1995, 99, 9110–9117 CrossRef CAS.
- Y. A. Ranasinghe, T. J. MacMahon and B. S. Freiser, Formation of Thermodynamically Stable Dications in the Gas Phase by Thermal Ion-Molecule Reactions: Ta2+ and Zr2+ with Small Alkanes, J. Phys. Chem., 1991, 95, 7721–7726 CrossRef CAS; P. A. M. Van Koppen, P. R. Kemper, J. E. Bushnell and M. T. Bowers, Methane Dehydrogenation by Ti+: A Cluster-Assisted Mechanism for σ-Bond Activation, J. Am. Chem. Soc., 1995, 117(7), 2098–2099, DOI:10.1021/ja00112a026.
- Y.-M. Chen and P. B. Armentrout, Activation of Methane by Gas-Phase Rh+, J. Phys. Chem., 1995, 99, 10775–10779 CrossRef CAS; Y.-M. Chen, M. R. Sievers and P. B. Armentrout, Activation of CH4, C2H6, C3H8, and c-C3H6 by Gas-phase Pd+ and the Thermochemistry of Pd-ligand Complexes, Int. J. Mass Spectrom. Ion Processes, 1997, 167/168, 195–212 CrossRef; M. R. Sievers, Y.-M. Chen, C. L. Haynes and P. B. Armentrout, Activation of CH4, C2H6, and C3H8 by Gas-Phase Nb+ and the Thermochemistry of Nb-ligand Complexes, Int. J. Mass Spectrom., 2000, 195/196, 149–170 CrossRef; P. B. Armentrout and M. R. Sievers, Activation of CH4 by Gas-phase Zr+ and the Thermochemistry of Zr ligand Complexes, J. Phys. Chem. A, 2003, 107, 4396–4406 CrossRef; P. B. Armentrout, Activation of CH4 by Gas-phase Mo+ and the Thermochemistry of Mo-ligand Complexes, J. Phys. Chem. A, 2006, 110, 8327–8338 CrossRef PubMed.
- P. B. Armentrout and Y.-M. Chen, Activation of Methane by Ru+: Experimental and Theoretical Studies of the Thermochemistry and Mechanism, Int. J. Mass Spectrom., 2016, 413, 135–149, DOI:10.1016/j.ijms.2016.05.003.
- F. J. Wensink, C. E. Smink, B. C. Stevenson, R. P. Steele, P. B. Armentrout and J. M. Bakker, IR spectroscopic characterization of [M,C,2H]+ (M = Ru and Rh) products formed by reacting 4d transition metal cations with oxirane: Spectroscopic evidence for multireference character in RhCH2+, Phys. Chem. Chem. Phys., 2024 10.1039/d4cp00012a.
- P. B. Armentrout, L. S. Sunderlin and E. R. Fisher, Intrinsic Transition Metal–Carbon Double Bond Dissociation Energies: Periodic Trends in M+–CH2 Bond Strengths, Inorg. Chem., 1989, 28(25), 4436–4437 CrossRef CAS.
- P. B. Armentrout and B. L. Kickel, Gas-Phase Thermochemistry of Transition Metal Ligand Systems: Reassessment of Values and Periodic Trends, in Organometallic Ion Chemistry, ed. B. S. Freiser, Kluwer, 1996, pp. 1–45 Search PubMed.
- C. L. Haynes, Y.-M. Chen and P. B. Armentrout, The Reaction of FeCH2+ + D2: Probing the [FeCH4]+ Potential Energy Surface, J. Phys. Chem., 1996, 100, 111–119 CrossRef CAS.
- J. Husband, F. Aguirre, C. J. Thompson, C. M. Laperle and R. B. Metz, Photofragment Spectroscopy of FeCH2+, CoCH2+, and NiCH2+ near the M+–CH2 Dissociation Threshold, J. Phys. Chem. A, 2000, 104(10), 2020–2024, DOI:10.1021/jp993652m.
- B. Ruscic and D. H. Bross, Active Thermochemical Tables (ATcT) values based on ver. 1.124 of the Thermochemical Network, Argonne National Laboratory, 2022. Available at https://ATcT.anl.gov (accessed 10/18/22).
- S. Villaume, A. Strich, C. A. Ndoye, C. Daniel, S. A. Perera and R. J. Bartlett, Theoretical Study of the Electronic Structure of MCH2+ (M = Fe, Co, Ni), J. Chem. Phys., 2007, 126(15), 154318 CrossRef PubMed.
- D. G. Musaev, K. Morokuma, N. Koga, K. A. Nguyen, M. S. Gordon and T. R. Cundari, Ab initio study of the molecular and electronic structure of CoCH2+ and of the reaction mechanism of CoCH2+ + H2, J. Phys. Chem., 1993, 97(44), 11435–11444, DOI:10.1021/j100146a016.
- D. G. Musaev and K. Morokuma, Ab initio molecular orbital study of the molecular and electronic structure of FeCH2+ and of the reaction mechanism of FeCH2+ +H2, J. Chem. Phys., 1994, 101(12), 10697–10707, DOI:10.1063/1.467883 (acccessed 9/28/2023).
- S. K. Loh, E. R. Fisher, L. Lian, R. H. Schultz and P. B. Armentrout, State Specific Reactions of Fe+(6D, 4F) with O2 and cyclo-C2H4O: D°0(Fe+-O) and Effects of Collisional Relaxation, J. Phys. Chem., 1989, 93, 3159–3167 CrossRef CAS.
- E. R. Fisher and P. B. Armentrout, Reactions of Co+, Ni+, and Cu+ with Cyclopropane and Ethylene Oxide: Metal Methylidene Ion Bond Energies, J. Phys. Chem., 1990, 94, 1674–1683, DOI:10.1021/j100367a083.
- F. J. Wensink, N. Roos, J. M. Bakker and P. B. Armentrout, C–H Bond Activation and C–C Coupling of Methane on a Single Cationic Platinum Center: A Spectroscopic and Theoretical Study, Inorg. Chem., 2022, 61(29), 11252–11260, DOI:10.1021/acs.inorgchem.2c01328.
- F. J. Wensink, M. G. Münst, J. Heller, M. Ončák, J. M. Bakker and C. Van Der Linde, IR Multiple Photon Dissociation Spectroscopy of MO2+ (M = V, Nb, Ta), J. Chem. Phys., 2020, 153(17), 171101 CrossRef CAS PubMed; C. Berg, T. Schindler, G. Niedner-Schatteburg and V. E. Bondybey, Reactions of Simple Hydrocarbons with Nbn+: Chemisorption and Physisorption on Ionized Niobium Clusters, J. Chem. Phys., 1995, 102(12), 4870–4884 CrossRef.
- A. G. Marshall, C. L. Hendrickson and G. S. Jackson, Fourier Transform Ion Cyclotron Resonance Mass Spectrometry: A Primer, Mass Spectrom. Rev., 1998, 17(2), 1–35 CrossRef CAS PubMed.
- M. J. Frisch, G. W. Trucks, H. B. Schlegel, G. E. Scuseria, M. A. Robb, J. R. Cheeseman, G. Scalmani, V. Barone, G. A. Petersson, H. Nakatsuji, X. Li, M. Caricato, A. V. Marenich, J. Bloino, B. G. Janesko, R. Gomperts, B. Mennucci, H. P. Hratchian, J. V. Ortiz, A. F. Izmaylov, J. L. Sonnenberg, D. Williams-Young, F. Ding, F. Lipparini, F. Egidi, J. Goings, B. Peng, A. Petrone, T. Henderson, D. Ranasinghe, V. G. Zakrzewski, J. Gao, N. Rega, G. Zheng, W. Liang, M. Hada, M. Ehara, K. Toyota, R. Fukuda, J. Hasegawa, M. Ishida, T. Nakajima, Y. Honda, O. Kitao, H. Nakai, T. Vreven, K. Throssell, J. A. Montgomery, Jr., J. E. Peralta, F. Ogliaro, M. J. Bearpark, J. J. Heyd, E. N. Brothers, K. N. Kudin, V. N. Staroverov, T. A. Keith, R. Kobayashi, J. Normand, K. Raghavachari, A. P. Rendell, J. C. Burant, S. S. Iyengar, J. Tomasi, M. Cossi, J. M. Millam, M. Klene, C. Adamo, R. Cammi, J. W. Ochterski, R. L. Martin, K. Morokuma, O. Farkas, J. B. Foresman and D. J. Fox, Gaussian 16 Rev C.01, Gaussian Inc., Wallingford, CT, 2016 Search PubMed.
- A. D. Becke, Density-functional Thermochemistry. III. The Role of Exact Exchange, J. Chem. Phys., 1993, 98, 5648–5652 CrossRef CAS.
- C. Lee, W. Yang and R. G. Parr, Development of the Colle-Salvetti Correlation-Energy Formula into a Functional of the Electron Density, Phys. Rev. B: Condens. Matter Mater. Phys., 1988, 37, 785–789 CrossRef CAS PubMed.
- A. Weigand, X. Cao, T. Hangele and M. Dolg, Relativistic Small-Core Pseudopotentials for Actinium, Thorium, and Protactinium, J. Phys. Chem. A, 2014, 118(13), 2519–2530, DOI:10.1021/jp500215z.
- W. L. Meerts and M. Schmitt, Application of Genetic Algorithms in Automated Assignments of High-Resolution Spectra, Int. Rev. Phys. Chem., 2006, 25(3), 353–406 Search PubMed.
- R. L. Hettich and B. S. Freiser, Gas-Phase Photodissociation of FeCH2+ and CoCH2+: Determination of the Carbide, Carbyne, and Carbene Bond Energies, J. Am. Chem. Soc., 1986, 108(10), 2537–2540 CrossRef CAS.
- C. Möller and M. S. Plesset, Note on an Approximation Treatment for Many-Electron Systems, Phys. Rev., 1934, 46, 618–622 CrossRef.
- R. J. Bartlett, Many-body Perturbation Theory and Coupled Cluster Theory for Electron Correlation in Molecules, Annu. Rev. Phys. Chem., 1981, 32, 359–401 CrossRef CAS.
- P. B. Armentrout, B. C. Stevenson, F. Yang, F. J. Wensink, O. V. Lushchikova and J. M. Bakker, Infrared Spectroscopy of Gold Carbene Cation (AuCH2+): Covalent or Dative Bonding?, J. Phys. Chem. A, 2019, 123, 8932–8941, DOI:10.1021/acs.jpca.9b08049; O. W. Wheeler, M. Salem, A. Gao, J. M. Bakker and P. B. Armentrout, Sequential Activation of Methane by Ir+: An IRMPD and Theoretical Investigation, Int. J. Mass Spectrom., 2019, 435, 78–92, DOI:10.1016/j.ijms.2018.10.007; O. W. Wheeler, M. Salem, A. Gao, J. M. Bakker and P. B. Armentrout, Activation of C–H bonds in Pt+ + xCH4 Reactions, where x = 1–4: Identification of the Platinum Dimethyl Cation, J. Phys. Chem. A, 2016, 120(31), 6216–6227, DOI:10.1021/acs.jpca.6b05361.
- Y. Zhang and W. Yang, A challenge for density functionals: Self-interaction error increases for systems with a noninteger number of electrons, J. Chem. Phys., 1998, 109(7), 2604–2608, DOI:10.1063/1.476859 (acccessed 9/14/2023); M. Lundberg and P. E. M. Siegbahn, Quantifying the effects of the self-interaction error in DFT: When do the delocalized states appear?, J. Chem. Phys., 2005, 122(22), 224103, DOI:10.1063/1.1926277 (acccessed 9/14/2023); D. Hait and M. Head-Gordon, Delocalization Errors in Density Functional Theory Are Essentially Quadratic in Fractional Occupation Number, J. Phys. Chem. Lett., 2018, 9(21), 6280–6288, DOI:10.1021/acs.jpclett.8b02417; K. R. Bryenton, A. A. Adeleke, S. G. Dale and E. R. Johnson, Delocalization error: The greatest outstanding challenge in density-functional theory, Wiley Interdiscip. Rev. Comput. Mol. Sci., 2023, 13(2), e1631, DOI:10.1002/wcms.1631.
- E. D. Glendening, A. E. Reed, J. E. Carpenter and F. Weinhold, NBO Version 3.1, Gaussian, Inc., Pittsburgh, 2003 Search PubMed.
- J. P. Perdew, J. A. Chevary, S. H. Vosko, K. A. Jackson, M. R. Pederson, D. J. Singh and C. Fiolhais, Atoms, molecules, solids, and surfaces: Applications of the generalized gradient approximation for exchange and correlation, Phys. Rev. B: Condens. Matter Mater. Phys., 1992, 46(11), 6671–6687, DOI:10.1103/PhysRevB.46.6671; J. P. Perdew, K. Burke and Y. Wang, Generalized gradient approximation for the exchange-correlation hole of a many-electron system, Phys. Rev. B: Condens. Matter Mater. Phys., 1996, 54(23), 16533–16539, DOI:10.1103/PhysRevB.54.16533.
- J. Tao, J. P. Perdew, V. N. Staroverov and G. E. Scuseria, Climbing the Density Functional Ladder: Nonempirical Meta-Generalized Gradient Approximation Designed for Molecules and Solids, Phys. Rev. Lett., 2003, 91(14), 146401, DOI:10.1103/PhysRevLett.91.146401.
- S. Grimme, S. Ehrlich and L. Goerigk, Effect of the Damping Function in Dispersion Corrected Density Functional Theory, J. Comput. Chem., 2011, 32(7), 1456–1465 CrossRef CAS PubMed.
- X. Xu and W. A. Goddard, The X3LYP extended density functional for accurate descriptions of nonbond interactions, spin states, and thermochemical properties, Proc. Natl. Acad. Sci., 2004, 101(9), 2673–2677, DOI:10.1073/pnas.0308730100.
- J.-D. Chai and M. Head-Gordon, Long-range corrected hybrid density functionals with damped atom–atom dispersion corrections, Phys. Chem. Chem. Phys., 2008, 10(44), 6615–6620, 10.1039/B810189B.
- Y. Zhao and D. G. Truhlar, Density Functionals with Broad Applicability in Chemistry, Acc. Chem. Res., 2008, 41, 157 CrossRef CAS PubMed.
- T. Yanai, D. P. Tew and N. C. Handy, A new hybrid exchange–correlation functional using the Coulomb-attenuating method (CAM-B3LYP, Chem. Phys. Lett., 2004, 393(1–3), 51–57, DOI:10.1016/j.cplett.2004.06.011.
- H. S. Yu, X. He and D. G. Truhlar, MN15-L: A New Local Exchange-Correlation Functional for Kohn–Sham Density Functional Theory with Broad Accuracy for Atoms, Molecules, and Solids, J. Chem. Theory Comput., 2016, 12(3), 1280–1293, DOI:10.1021/acs.jctc.5b01082.
- C. Adamo and V. Barone, Toward reliable adiabatic connection models free from adjustable parameters, Chem. Phys. Lett., 1997, 274(1–3), 242–250, DOI:10.1016/S0009-2614(97)00651-9.
- Y. Zhao and D. G. Truhlar, The M06 Suite of Density Functionals for Main Group Thermochemistry, Thermochemical Kinetics, Noncovalent Interactions, Excited States, and Transition Elements: Two New Functionals and Systematic Testing of Four M06-Class Functionals and 12 Other Functionals, Theor. Chem. Acc., 2008, 120, 215–241 Search PubMed.
- E. Brémond and C. Adamo, Seeking for parameter-free double-hybrid functionals: The PBE0-DH model, J. Chem. Phys., 2011, 135(2), 024106, DOI:10.1063/1.3604569 (acccessed 9/14/2023).
- J. L. Elkind and P. B. Armentrout, State-specific Reactions of Atomic Transition Metal Ions with H2, HD and D2: Effects of d Orbitals on Chemistry, J. Phys. Chem., 1987, 91, 2037–2045 CrossRef CAS.
- P. B. Armentrout and Y.-M. Chen, Activation of C2H6, C3H8, HC(CH3)3, and c-C3H6 by Gas-Phase Ru+ and the Thermochemistry of Ru-ligand Complexes, J. Am. Soc. Mass Spectrom., 1999, 10, 821–839 CrossRef CAS; P. B. Armentrout and I. Kretzschmar, Guided Ion Beam and Theoretical Studies of the Reaction of Ru+ with CS2 in the Gas-phase: Thermochemistry of RuC+, RuS+, and RuCS+, Phys. Chem. Chem. Phys., 2010, 12, 4078–4091, 10.1039/b926429a.
- A. Kramida, Y. Ralchenko, J. Reader and N. A. Team, NIST Atomic Spectra Database (ver. 5.7.1), National Institute of Standards and Technology, Gaithersburg, MD, 2012. Available: https://physics.nist.gov/asd.
Footnote |
| † Electronic supplementary information (ESI) available: Figures showing the mass spectrum for reaction of Fe+ and Co+ with oxirane, branching ratios for the photofragmentation of [Fe,C,2H]+ and [Co,C,2H]+, comparisons of the experimental spectrum of [Fe,C,2H]+ and [Co,C,2H]+ to spectra calculated at the MP2(full)/def2-TZVPPD and CCSD/def2-TZVPPD levels. Tables provide details regarding the calculated states of [M,C,2H]+ and relative intensities of vibrational bands for group 8 and 9 metal carbene cations. See DOI: https://doi.org/10.1039/d4cp00026a |
| This journal is © the Owner Societies 2024 |