Dissecting the chiral recognition of TLR4/MD2 with Neoseptin-3 enantiomers by molecular dynamics simulations†
Received
18th December 2023
, Accepted 22nd February 2024
First published on 1st March 2024
Abstract
Toll-like receptor 4 (TLR4) is a pivotal innate immune recognition receptor that regulates intricate signaling pathways within the immune system. Neoseptin-3 (Neo-3), a recently identified small-molecule agonist for mouse TLR4/MD2, exhibits chiral recognition properties. Specifically, the L-enantiomer of Neo-3 (L-Neo-3) effectively activates the TLR4 signaling pathway, while D-Neo-3 fails to induce TLR4 activation. However, the underlying mechanism by which TLR4 enantioselectively recognizes Neo-3 enantiomers remains poorly understood. In this study, in silico simulations were performed to investigate the mechanism of chiral recognition of Neo-3 enantiomers by TLR4/MD2. Two L-Neo-3 molecules stably resided within the cavity of MD2 as a dimer, and the L-Neo-3 binding stabilized the (TLR4/MD2)2 dimerization state. However, the strong electrostatic repulsion between the hydrogen atoms on the chiral carbon of D-Neo-3 molecules caused the relative positions of two D-Neo-3 molecules to continuously shift during the simulation process, thus preventing the formation of D-Neo-3 dimer as well as their stable interactions with the surrounding residues in (TLR4/MD2)2. Considering that L-Neo-3 could not sustain a stable dimeric state in the bulk aqueous environment, it is unlikely that L-Neo-3 entered the cavity of MD2 as a dimeric unit. Umbrella sampling simulations revealed that the second L-Neo-3 molecule entering the cavity of MD2 exhibited a lower binding energy (−25.75 kcal mol−1) than that of the first L-Neo-3 molecule (−14.31 kcal mol−1). These results imply that two L-Neo-3 molecules enter the cavity of MD2 sequentially, with the binding of the first L-Neo-3 molecule facilitating the entry of the second one. This study dissects the binding process of Neo-3 enantiomers, offering a comprehensive understanding of the atomic-level mechanism underlying TLR4's chiral recognition of Neo-3 molecules.
Introduction
Toll-like receptor 4 (TLR4) is a crucial component of innate immune recognition receptors that regulate intricate and precise signaling pathways within the immune system.1–4 TLR4 is associated with myeloid differentiation protein 2 (MD2), a β-cup fold structure composed of two antiparallel β sheets, creating a large hydrophobic pocket crucial for binding diverse ligands, particularly lipopolysaccharide (LPS) from the cell wall of Gram-negative bacteria.5–8 Upon binding of agonistic ligands to MD2, it results in the formation of TLR4/MD2 dimerization, initiating the recruitment of the intracellular adaptor Toll/Interleukin-1 receptor (TIR) domain and subsequently activating the downstream signaling pathway.9 Dysregulation of the TLR4 signaling pathway can lead to numerous pathological conditions, including chronic inflammation,10 asthma,11 neuropathic pain,12,13etc. In addition, recent studies have indicated that psychoactive substances, including morphine,14,15 cocaine,16 and methamphetamine,17 can activate TLR4/MD2 to enhance reward signaling, therefore contributing to drug addiction. Consequently, several small molecules targeting TLR4/MD2 have been developed to modulate TLR4 signaling.18 To date, most of the small molecule ligands show no stereoselectivity toward TLR4. Recently Neoseptin-3, a small-molecule TLR4 agonist with no structural similarity to LPS, exhibited chiral recognition toward mouse TLR4/MD2.19 The L-enantiomer of Neo-3 (L-Neo-3) efficiently activates the mouse TLR4 signaling pathway but the D-enantiomer of Neo-3 (D-Neo-3) shows no TLR4 activation ability. However, the mechanism by which TLR4/MD2 achieves chiral discrimination of Neo-3 enantiomers remains unknown.
In this study, molecular dynamics simulations were employed to investigate the chiral recognition of Neo-3 enantiomers by TLR4/MD2. Umbrella sampling simulations were used to dissect the binding process of L-Neo-3 with TLR4/MD2. This study would provide an understanding of the atomic-level mechanism underlying TLR4's chiral recognition of Neo-3 enantiomer, which would shed light on the future development of stereoselective TLR4 small molecule modulators.
Methods
System preparation
The (TLR4/MD2)2 complex that binds four L-Neo-3 was extracted from the crystal structure (PDB: 5IJC),19 named as (2*L-Neo-3/TLR4/MD2)2 complex. The (TLR4/MD2)2 complex that binds four D-Neo-3 was obtained by manually altering the chirality of the chiral carbon of L-Neo-3 in (2*L-Neo-3/TLR4/MD2)2 complex. The structural details of the complexes are shown in Fig. S1 (ESI†). The missing residues and hydrogen atoms of (TLR4/MD2)2 were added at pH = 7.0 using Maestro.20
Molecular dynamics simulations
The heterotetramer (TLR4/MD2)2 bound with Neo-3 was solvated in an explicitly represented TIP3P water box with a concentration of 150 mM NaCl by CHARMM-GUI web server.21 The box size was set to 160 × 160 × 160 Å3 with periodic boundary conditions, containing approximately 392![[thin space (1/6-em)]](https://www.rsc.org/images/entities/char_2009.gif) 800 atoms. All MD simulations were conducted using the GROMACS2019.5 program22 and the CHARMM36 force field23,24 was applied. The electronic potential of L-Neo-3 and D-Neo-3 molecules was calculated using the Gaussian09 program with the B3LYP density functional method and the 6-311+G(d,p) basis set.25–27 The partial charges of Neo-3 and other parameters, including bond, angle, torsion, and van der Waals terms, were obtained using Antechamber.28 The LINCS algorithm29 was used to constrain all bonds involving hydrogen. van der Waals interactions were switched and cut off at 10 Å and 12 Å. Long-range electrostatic interactions were handled using the particle-mesh Ewald (PME) method30 with a cut-off value of 12 Å. Pressure and temperature were maintained at 1 atm and 310.15 K using the Parrinello–Rahman31,32 and Nosé–Hoover temperature coupling algorithms.33,34 Each system underwent an initial energy minimization using the steepest descent algorithm and was subsequently equilibrated for 1 ns. Harmonic constraints were applied on heavy atoms of the protein (95.6 kcal mol−1 for the backbone and 9.56 kcal mol−1 for the side chain) during the equilibration phase. Non-constrained simulations were carried out for 200 ns with the isobaric isothermal ensemble (NPT). Two more replicas were run for each system to ensure the reproducibility of results.
800 atoms. All MD simulations were conducted using the GROMACS2019.5 program22 and the CHARMM36 force field23,24 was applied. The electronic potential of L-Neo-3 and D-Neo-3 molecules was calculated using the Gaussian09 program with the B3LYP density functional method and the 6-311+G(d,p) basis set.25–27 The partial charges of Neo-3 and other parameters, including bond, angle, torsion, and van der Waals terms, were obtained using Antechamber.28 The LINCS algorithm29 was used to constrain all bonds involving hydrogen. van der Waals interactions were switched and cut off at 10 Å and 12 Å. Long-range electrostatic interactions were handled using the particle-mesh Ewald (PME) method30 with a cut-off value of 12 Å. Pressure and temperature were maintained at 1 atm and 310.15 K using the Parrinello–Rahman31,32 and Nosé–Hoover temperature coupling algorithms.33,34 Each system underwent an initial energy minimization using the steepest descent algorithm and was subsequently equilibrated for 1 ns. Harmonic constraints were applied on heavy atoms of the protein (95.6 kcal mol−1 for the backbone and 9.56 kcal mol−1 for the side chain) during the equilibration phase. Non-constrained simulations were carried out for 200 ns with the isobaric isothermal ensemble (NPT). Two more replicas were run for each system to ensure the reproducibility of results.
The root-mean-square deviations (RMSDs) and root-mean-square fluctuations (RMSFs) were calculated through internal modules of GROMACS.22 Protein–protein and protein–ligand interactions were analyzed by MDAnalysis35 and ProLIF.36 VMD37 and PyMol38 were used to visualize the trajectories of the simulation.
Binding free energy calculation
800 snapshots were taken from the last 80 ns non-constrained MD trajectory for every replicate to calculate the binding free energy of L-Neo-3 and D-Neo-3 to (TLR4/MD2)2 using the molecular mechanics-Poisson–Boltzmann solvent accessible surface area (MM-PBSA) method:39,40
| ΔGbonding = Gcomplex − (Gprotein + Gligand) |
Here, Gcomplex is the total free energy of the protein–ligand complex in the solvent. Gprotein and Gligand respectively represent the total free energies of the protein and ligand in the solvent. The free energy for each term can be given by the following equation:
| Gx = 〈EMM〉 + 〈Gsolvation〉 − TΔS |
| EMM = Ebonded + Enobonded = Ebonded + (Evdw + Eelec) |
| Gsolvation = Gsol-polar + Gsol-nonpolar |
where x is the protein or ligand or protein–ligand complex. 〈EMM〉 is the average molecular mechanical potential energy in a vacuum. The term 〈Gsolvation〉 is the solvation free energy. Ebonded is the bonded interactions consisting of bond, angle, dihedral, and improper interactions. Nonbonded interactions (Enonbonded) include both van der Waals (EvdW) and electrostatic (Eelec) interactions that are modeled using the Lennard-Jones and Coulomb potential functions. The Gsol-polar and Gsol-nonpolar are the electrostatic and nonelectrostatic contributions to the solvation free energy. The entropic contribution to free energy (−TΔS) was ignored because of the low reliability and computational cost.17
Potential of mean force (PMF) calculation
The Umbrella Sampling (US) method41 was employed to investigate the free energy changes associated with the binding process of two L-Neo-3 to (TLR4/MD2)2. The reaction coordinate (RC) was defined as the distance between the center of mass of heavy atoms of L-Neo-3 and the center of mass of the Cα atoms of the β-cup fold in MD.6,17 The centers of the US windows were evenly spaced along the reaction coordinate (RC) at intervals of 0.5 Å. The sampling range for L-Neo-3A and L-Neo-3B were set as 0 to 30.0 Å and 6.0 to 30.0 Å, resulting in 60 and 48 windows, respectively. Each window was run for 10 ns, and only the last 8 ns were utilized to reconstruct the free energy profile.
The free energy profiles were rebuilt using the weighted histogram analysis method (WHAM),42,43 with a tolerance set to 10−6. Statistical uncertainties were estimated using the bootstrap method.44
Results and discussion
The Neo-3 enantioselectively activates mouse TLR4/MD2 signaling pathway,19 yet the underlying mechanism of its stereoselective recognition remains unclear. To address this, (2*L-Neo-3/TLR4/MD2)2 (Fig. 1A) and (2*D-Neo-3/TLR4/MD2)2 (Fig. 1B) systems were constructed and 200 ns MD simulations were performed. In all systems, (TLR4/MD2)2 reached stable states during the 200 ns (Fig. 2 and Fig. S2, ESI†). The MM/PBSA method was utilized to calculate the binding free energies of Neo-3 enantiomers to the TLR4/MD2 complex (Table 1). The D-Neo-3 molecules displayed relatively poor affinity for the TLR4/MD2, with a binding free energy of −5.21 kcal mol−1. In contrast, L-Neo-3 exhibited significantly stronger affinity, evidenced by a binding free energy of −34.87 kcal mol−1. Energy decomposition analysis further indicated that van der Waals interactions predominantly drive the binding of Neo-3 enantiomers to TLR4/MD2. Additionally, it was observed that D-Neo-3 has higher polar dissolution energy, which contributes to its comparatively higher binding free energy.
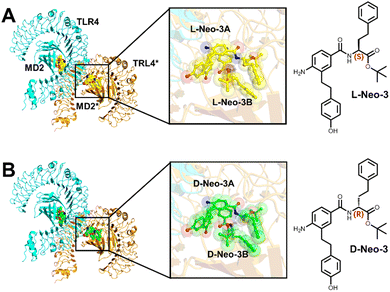 |
| | Fig. 1 (A) Structure of (2*L-Neo-3/TLR4/MD2)2 complex; (B) structure of (2*D-Neo-3/TLR4/MD2)2 complex. | |
 |
| | Fig. 2 RMSDs of the protein backbone atoms during the simulation of (2*L-Neo-3/TLR4/MD2)2 (blue) and (2*D-Neo-3/TLR4-MD2)2 (orange) systems. | |
Table 1 MM-PBSA-derived binding free energies for L-Neo-3/D-Neo-3 binding to TLR4-MD2 (kcal mol−1). All values are derived from the average of three independent calculations. Numbers after ± present standard errors
| Ligand |
ΔEvdw |
ΔEelec |
ΔGsol-polar |
ΔGsol-nonpolar |
ΔGbinding |
| 2*L-Neo-3 |
−161.09 ± 1.96 |
−27.84 ± 1.92 |
171.79 ± 4.06 |
−17.78 ± 0.17 |
−34.87 ± 3.06 |
| 2*D-Neo-3 |
−161.42 ± 2.33 |
−43.29 ± 1.80 |
217.15 ± 4.27 |
−17.68 ± 0.17 |
−5.21 ± 3.27 |
To elucidate the differences in binding energy, the interactions of L-Neo-3 (Fig. 3A) and D-Neo-3 (Fig. 3B) with the TLR4/MD2 were examined. Although L-Neo-3 and D-Neo-3 interacted with similar types of residues in the last 80 ns of the simulation trajectories, there was a significant difference in the frequency of these interactions (Fig. 3C–F). Both L-Neo-3A and D-Neo-3A engaged extensively with MD2's surrounding residues (Fig. 3C). Notably, L-Neo-3B was found to interact more frequently with MD2 residues close to TLR4* compared to D-Neo-3B (Fig. 3D). This was particularly evident with residues F126, Y131, C133, and I153. Furthermore, both L-Neo-3A (Fig. 3E) and L-Neo-3B (Fig. 3F) demonstrated a higher frequency of interactions with TLR4* residues compared to their D-Neo-3 counterparts. These interactions involved residues I411, M412, S413, R434, E437, F438, S439, and L442. Notably, residues S413, R434, E437, and S439, confirmed to be crucial for TLR4 signaling pathway activation by L-Neo-3 molecules through site-directed mutagenesis experiments,19 were part of these interactions. This suggests that L-Neo-3 is capable of establishing more stable interactions simultaneously with the MD2 and the TLR4*, compared to D-Neo-3.
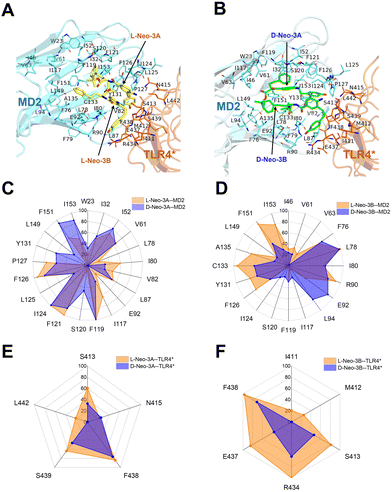 |
| | Fig. 3 (A) and (B) The representative binding modes of L-Neo-3 (A) and D-Neo-3 (B) with (TLR4/MD2)2. (C)–(F) Fingerprints of interaction frequencies between L/D-Neo-3A (C) and (E) and L/D-Neo-3B (D) and (F) with MD2 (C) and (D) or TLR4* (E) and (F). | |
To elucidate how L-Neo-3 or D-Neo-3 influences the flexibility of (TLR4/MD2)2, the RMSF of the Cα atoms of (TLR4/MD2)2 from the (2*L-Neo-3/TLR4/MD2)2 and (2*D-Neo-3/TLR4/MD2)2 systems were calculated. The binding of D-Neo-3 made (TLR4/MD2)2 have higher RMSF values than those of (2*L-Neo-3/TLR4/MD2)2 system (Fig. S3, ESI†). These fluctuations were particularly pronounced, especially in the C-terminal of TLR4 and the β-sheets of MD2 (Fig. 4). Considering the approaching of the C-termini of two TLR4s is essential for TLR4 signaling activation, the distance between the C-termini of TLR4 and TLR4* was directly analyzed (Fig. 5A). During the simulations of the (2*D-Neo-3/TLR4/MD2)2 system, there was an observed increase in the distance between the C-termini of TLR4 and TLR4*(Fig. 5B), suggesting a tendency towards depolymerization of the (TLR4/MD2)2 complex when it is bound to D-Neo-3 molecules. In contrast, in the (2*L-Neo-3/TLR4/MD2)2 system, this distance remained relatively stable throughout the simulation (Fig. 5B), indicating that L-Neo-3 binding stabilizes the activated (TLR4/MD2)2 dimerization state. Moreover, the average contact area between TLR4* and MD2, TLR4 and MD2*, as well as TLR4* and TLR4 were measured (Fig. 5C). It was observed that the (2*D-Neo-3/TLR4/MD2)2 system exhibited a smaller contact area at the dimerization interface compared to the (2*L-Neo-3/TLR4/MD2)2 system (Fig. 5D). This finding aligns with the earlier results, suggesting that D-Neo-3 is incapable of maintaining the activated conformation of the TLR4/MD2.
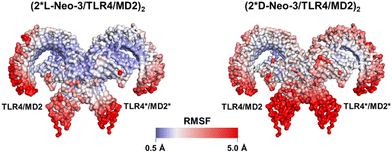 |
| | Fig. 4 RMSFs of the Cα atoms of protein during the last 80 ns trajectories in the simulation of (2*L-Neo-3/TLR4/MD2)2 and (2*D-Neo-3/TLR4/MD2)2 systems. The RMSF color scale is shown at the bottom. | |
 |
| | Fig. 5 (A) Position of the selected residues (K598-P618 of TLR4 and TLR4*) for calculating the distance between C-termini of TLR4 and TLR4*; (B) changes in the distance between the C-termini of TLR4 and TLR4* during simulation of the (2*L-Neo-3/TLR4/MD2)2 and (2*D-Neo-3/TLR4/MD2)2 systems; (C) locations of the interfaces between TLR4* and MD2, TLR4 and MD2*, as well as TLR4* and TLR4; (D) average contact area between TLR4* and MD2, TLR4 and MD2*, as well as TLR4* and TLR4 during the last 80 ns of the trajectories in the simulations of (2*L-Neo-3/TLR4/MD2)2 and (2*D-Neo3/TLR4/MD2)2 systems. Data are presented as the mean ± SD. | |
The detailed protein–protein interactions at the dimerization interface were then thoroughly analyzed (Fig. 6). A consistent observation across (2*L-Neo-3/TLR4/MD2)2 and (2*D-Neo-3/TLR4/MD2)2 systems was the formation of two stable hydrogen bonds involving N415* of TLR4* and L125 of MD2. These bonds were between the sidechain nitrogen (donor) of N415* and the backbone oxygen (acceptor) of L125, and vice versa, as illustrated in Fig. 6A and B. However, in the (2*D-Neo-3/TLR4/MD2)2 system, the frequency of the hydrogen bond between the backbone nitrogen of N415* of TLR4* and the backbone oxygen of G123 of MD2 was lower than in the (2*L-Neo-3/TLR4/MD2)2 system. Contrary to the (2*L-Neo-3/TLR4/MD2)2 system, the hydrogen bond between the backbone oxygen of E437* of TLR4* and the sidechain nitrogen of R90 of MD2 was absent in the (2*D-Neo-3/TLR4/MD2)2 system (Fig. 6B). Furthermore, the hydrogen bonding network involving S362*, S364*, S384*, and S386* of TLR4* and the corresponding residues of TLR4 in the (2*D-Neo-3/TLR4/MD2)2 system was nearly disrupted (Fig. 6D). This contrasted with the (2*L-Neo-3/TLR4/MD2)2 system, where this hydrogen bonding network was mainly preserved (Fig. 6C). Collectively, these findings suggest that L-Neo-3, but not D-Neo-3, is capable of maintaining the activated (TLR4/MD2)2 dimerization state through protein–protein interactions, which may explain D-Neo-3's inability to activate TLR4 signaling.
 |
| | Fig. 6 Frequencies of hydrogen bond interactions between TLR4* and MD2 protein (A) and (B) as well as the hydrogen bond interaction between TLR4* and TLR4 protein (C) and (D) in the (2*L-Neo-3/TLR4/MD2)2 system (A) and (C) and the (2*D-Neo-3/TLR4/MD2)2 system (B) and (D). The interaction frequency was defined as the number of frames in which interactions occur between specified residues divided by the total number of frames. | |
The motion trajectories of two L-Neo-3 and two D-Neo-3 molecules within the MD2 cavity were analyzed to understand the low interaction frequency between D-Neo-3 and TLR4*. As shown in Fig. 7A, the two L-Neo-3 molecules maintained stable positions throughout the simulations, in contrast to the two D-Neo-3 molecules, which demonstrated frequent positional changes. Additionally, the occurrence of hydrogen bonding and π–π stacking interactions was significantly less frequent between the two D-Neo-3 molecules compared to the two L-Neo-3 molecules (Fig. 7B). These observations suggest that the two D-Neo-3 molecules are unable to form stable interactions with each other inside the MD2 cavity. The analysis of interaction energy also confirms this point, the average electrostatic interaction and van der Waals interaction between two L-Neo-3 were stronger interaction than two D-Neo-3 during last 80 ns MD simulation (Fig. S4, ESI†).
 |
| | Fig. 7 (A) Trajectories depicting the movement of two L-Neo-3 molecules (left) and two D-Neo-3 molecules (right) in the cavity of MD2. The positions of L-Neo-3 and D-Neo-3 were shown at 8 ns intervals during the last 80 ns of the simulation trajectories; (B) frequency analysis of hydrogen bonds and π–π stacking interactions between two L-Neo-3 molecules or two D-Neo-3 molecules within the cavity of MD2; (C) positions of two L-Neo-3 molecules (left) and two D-Neo-3 molecules (right) within the cavity of MD2 at the beginning of the simulations. Atom colors correspond to their partial charges, as indicated by the color scale at the bottom (unit: e = 1.602176 × 10⁻¹⁹ C). | |
To understand why two D-Neo-3 molecules cannot form stable interactions within the MD2 cavity, We analyzed the charge distribution of L-Neo-3 and D-Neo-3 at the beginning of production simulation using restrained electro static potential (RESP) analysis.45 This method analyzes the electron density distribution of molecules based on the electron wave function. The charge distribution of all atoms in both L-Neo-3 and D-Neo-3 molecules was summarized in Table S1 (ESI†). Notably, the hydrogen atoms on the chiral carbon of the two D-Neo-3 molecules, each carrying a positive charge of 0.178 e, were positioned close to each other (Fig. 7C). This proximity led to strong electrostatic repulsion, disrupting the stability of hydrogen bonds and π–π stacking between the two D-Neo-3 molecules. In contrast, the hydrogen atoms on the chiral carbon of the two L-Neo-3 molecules were oriented in opposite directions, effectively minimizing electrostatic repulsion. This orientation facilitated the formation of stable hydrogen bonds and π–π stacking interactions between the two L-Neo-3 molecules. These findings demonstrate that the two L-Neo-3 molecules are capable of establishing stable interactions with each other, thereby effectively interacting with MD2 and the neighboring TLR4 to stabilize the formation of TLR4/MD2 dimer. Conversely, when two D-Neo-3 molecules attempt to interact, the strong electrostatic repulsion between the hydrogen atoms on their chiral carbons hinders their ability to form stable interactions. Despite frequent changes in their relative positions during the simulation, the D-Neo-3 molecules failed to find stable interaction patterns with each other or the surrounding residues. Consequently, the (TLR4/MD2)2 complex may dissociate under thermal disturbance in the presence of D-Neo3, owing to the lack of ligand-mediated protein–protein interactions.
L-Neo-3 binds as a dimer within the hydrophobic pocket of MD2.19 To explore the potential for TLR4/MD2 directly recognizing L-Neo-3 dimer, molecular dynamics simulations of L-Neo-3 dimer was investigated to check the possibility of L-Neo-3 dimer in aqueous solution. Across three parallel simulations, it was noted that the distance between the centers of mass of the two L-Neo-3 molecules varied widely, ranging from 5 to 80 Å (Fig. S5, ESI†). This suggests that two L-Neo-3 molecules struggle to maintain a stable dimeric state in aqueous solution. Consequently, it appears more likely that L-Neo-3 molecules bind sequentially to MD2, rather than entering into the MD2 cavity as a pre-formed dimer. The crystal structure analysis of the (TLR4/MD2)2 complex with L-Neo-3 revealed that Neo-3A has a lower average crystallographic B-factor than Neo-3B (14.4 vs. 22.9 Å2).19 This difference suggests that Neo-3A is more ordered and binds more tightly within the receptor complex. This observation suggests a potential sequential binding mechanism, wherein Neo-3A preferentially binds to the complex prior to Neo-3B. Such experimental findings lend support to our theoretical predictions concerning the sequential entry of L-Neo-3 molecules into the MD2 cavity.
To delve deeper into how L-Neo-3 molecules enter the cavity of MD2 sequentially, umbrella sampling (US) simulations were performed to calculate the binding free energy. The quality of the US simulations was assessed by analyzing the overlap of sampling histograms. As illustrated in Fig. S6 (ESI†), the windows of each sampling simulation showed significant overlap with neighboring windows. The free energy profile for the first L-Neo-3 molecule entering into the MD2 cavity is depicted in Fig. 8, where the lowest energy well was found to be −14.31 kcal mol−1. Interestingly, the binding free energy for the second L-Neo-3 molecule entering into the cavity of MD2 was much lower (−25.75 kcal mol−1) compared to the first L-Neo-3 molecule. This finding suggests that the entry of one L-Neo-3 molecule into the MD2 cavity facilitates the entry of another L-Neo-3 molecule.
 |
| | Fig. 8 Binding free energy profiles of two L-Neo-3 molecules sequentially binding to the cavity of MD2. Free energy for L-Neo-3 in bulk water is set to zero. Shaded regions represent statistical uncertainties in the free energy. | |
To gain a deeper understanding of the synergy involved in the binding of two L-Neo-3 molecules to TLR4/MD2, the binding process was further dissected. Initially, as L-Neo-3A approached TLR4/MD2 from the water, it formed hydrophobic interactions with I411*, A414*, and F438* of TLR4*, and established a hydrogen bond with R434* of TLR4* (Fig. 9A, RC = 18 Å). It then transitioned to the interface between TLR4* and MD2, where it engaged in hydrophobic interactions with MD2 residues I80, L87, F119, F121, and I124, and created π–π stacking interactions with F126 of MD2 and F438* of TLR4* (Fig. 9B, RC = 12 Å). In the final stage, L-Neo-3A penetrated deeper into the MD2 cavity, forming π–π stacking interactions with F121, F126, and F151 of MD2, and F438* of TLR4*, while also establishing hydrophobic interactions with I153 and L78 of MD2 (Fig. 9C, RC = 8 Å). In a similar manner, L-Neo-3B approached TLR4* from the solution (Fig. 9D, RC = 17 Å). The key difference emerged in L-Neo-3B's entry into the MD2 cavity, which was primarily facilitated by hydrogen bonding and π–π stacking interactions with the already bound L-Neo-3A molecule (Fig. 9E, RC = 11 Å; Fig. 9F, RC = 10 Å). The presence of these interactions provided additional drive for L-Neo-3B to enter into the MD2 cavity. This is considered to be a crucial factor contributing to the observed synergistic effect during the binding of two L-Neo-3 molecules to TLR4/MD2.
 |
| | Fig. 9 Snapshots illustrating the entry process of L-Neo-3A (A)–(C) and L-Neo-3B (D)–(F) into the cavity of MD2 from the solvent. TLR4* and MD2 are depicted in gray and pale cyan cartoons, respectively. Hydrogen bonding and π–π stacking interactions between L-Neo-3A and L-Neo-3B are indicated by purple and red dashed lines. | |
Conclusions
In this study, molecular dynamics simulations were employed to investigate the chiral selective activation of TLR4/MD2 by Neo-3 enantiomers. Our simulations demonstrated that two L-Neo-3 molecules formed stable interactions with each other through hydrogen bonding and π–π stacking. Concurrently, these molecules also developed stable interactions with MD2 and the neighboring TLR4*, thereby stabilizing the dimerization state of TLR4/MD2. Conversely, two D-Neo-3 molecules were unable to establish stable interactions within the MD2 cavity, due to significant electrostatic repulsion between the hydrogen atoms at their chiral centers. This led to less effective interactions with both MD2 and the adjacent TLR4. Additionally, the entry of L-Neo-3 molecules into the MD2 cavity was sequential instead of occurring as pre-formed dimers, with the penetration of the first L-Neo-3 molecule enhancing the entry of the second. This research offers an in-depth atomic-level insight into the differential recognition of Neo-3 enantiomers by TLR4/MD2, which could inform the future development of stereoselective small molecule modulators targeting TLR4.
Data and software availability
The initial structure of the (TLR4/MD2)2 complex was obtained from https://www.rcsb.org/. The CHARMM-GUI platform is accessible from https://charmm-gui.org/. The GROMACS package was downloaded from https://www.gromacs.org/. The VMD software was downloaded from https://www.ks.uiuc.edu/Development/. The free version of PyMol was obtained from https://github.com/schrodinger/pymol-open-source. The MDanalysis python package was downloaded from https://www.mdanalysis.org/. The Prolif python package was downloaded from https://prolif.readthedocs.io/en/latest/index.html/. The Gaussian software was obtained from the Supercomputing Center of University of Science and Technology of China. The data sets generated and/or analyzed during the current study are available the Zenodo platform, which can be retrieved using the following link: https://zenodo.org/records/10369180.
Author contributions
X. W. designed research; C. Z., S. W., and M. L. performed simulations; C. Z., S. W., M. L., P. L., X. D., Y. W., and X. W. analyzed data; C. Z., S. W., Y. W., and X. W. wrote the paper.
Conflicts of interest
The authors declare that they have no conflicts of interest with the contents of this article.
Acknowledgements
This work was supported by the Strategic Priority Research Program of the Chinese Academy of Sciences (XDB0450102), the National Natural Science Foundation of China (22277118), the Beijing National Laboratory for Molecular Sciences (BNLMS202108), Science and Technology Development Plan Project of Jilin Province (20220402045GH), and the Chinese Academy of Sciences (CAS) Pioneer Hundred Talents Program. Computing time was supported by the Tianhe Supercomputer at National Supercomputer Center in Tianjin and the ORISE Supercomputer.
References
- H. M. Kim, B. S. Park, J.-I. Kim, S. E. Kim, J. Lee, S. C. Oh, P. Enkhbayar, N. Matsushima, H. Lee, O. J. Yoo and J.-O. Lee, Cell, 2007, 130, 906–917 CrossRef CAS PubMed.
- S. Bhattarai, Q. Li, J. Ding, F. Liang, E. Gusev, O. Lapohos, G. J. Fonseca, E. Kaufmann, M. Divangahi and B. J. Petrof, Nat. Commun., 2022, 13, 879 CrossRef CAS PubMed.
- J. Geng, Y. Shi, J. Zhang, B. Yang, P. Wang, W. Yuan, H. Zhao, J. Li, F. Qin, L. Hong, C. Xie, X. Deng, Y. Sun, C. Wu, L. Chen and D. Zhou, Nat. Commun., 2021, 12, 3519 CrossRef CAS PubMed.
- X. Tang, M. Fang, R. Cheng, J. Niu, X. Huang, K. Xu, G. Wang, Y. Sun, Z. Liao, Z. Zhang, J. Mwangi, Q. Lu, A. Wang, L. Lv, C. Liu, Y. Miao and R. Lai, Research, 2024, 7, 0301 CrossRef PubMed.
- R. Shimazu, S. Akashi, H. Ogata, Y. Nagai, K. Fukudome, K. Miyake and M. Kimoto, J. Exp. Med., 1999, 189, 1777–1782 CrossRef CAS PubMed.
- B. S. Park, D. H. Song, H. M. Kim, B.-S. Choi, H. Lee and J.-O. Lee, Nature, 2009, 458, 1191–1195 CrossRef CAS PubMed.
- O. Takeuchi and S. Akira, Cell, 2010, 140, 805–820 CrossRef CAS PubMed.
- U. Ohto, K. Fukase, K. Miyake and T. Shimizu, Proc. Natl. Acad. Sci. U. S. A., 2012, 109, 7421–7426 CrossRef CAS PubMed.
- L. A. J. O'Neill and A. G. Bowie, Nat. Rev. Immunol., 2007, 7, 353–364 CrossRef PubMed.
- G. S. Hotamisligil, Nature, 2017, 542, 177–185 CrossRef CAS PubMed.
- H. Hammad and B. N. Lambrecht, Cell, 2021, 184, 1469–1485 CrossRef CAS PubMed.
- T. Zhang, C. Lin, S. Wu, S. Jin, X. Li, Y. Peng and X. Wang, Front. Immunol., 2022, 13, 873054 CrossRef CAS PubMed.
- K. Inoue and M. Tsuda, Nat. Rev. Neurosci., 2018, 19, 138–152 CrossRef CAS PubMed.
- X. Wang, L. C. Loram, K. Ramos, A. J. de Jesus, J. Thomas, K. Cheng, A. Reddy, A. A. Somogyi, M. R. Hutchinson, L. R. Watkins and H. Yin, Proc. Natl. Acad. Sci. U. S. A., 2012, 109, 6325–6330 CrossRef CAS PubMed.
- X. Zhang, R. Li, H. Xu, G. Wu, S. Wu, H. Wang, Y. Wang and X. Wang, Phys. Chem. Chem. Phys., 2023, 25, 29656–29663 RSC.
- A. L. Northcutt, M. R. Hutchinson, X. Wang, M. V. Baratta, T. Hiranita, T. A. Cochran, M. B. Pomrenze, E. L. Galer, T. A. Kopajtic, C. M. Li, J. Amat, G. Larson, D. C. Cooper, Y. Huang, C. E. O'Neill, H. Yin, N. R. Zahniser, J. L. Katz, K. C. Rice, S. F. Maier, R. K. Bachtell and L. R. Watkins, Mol. Psychiatry, 2015, 20, 1525–1537 CrossRef CAS PubMed.
- X. Zhang, Y. Wang, H. Wang, H. Li, T. Zhang, Y. Peng and X. Wang, J. Chem. Inf. Model., 2020, 60, 1607–1613 CrossRef CAS PubMed.
- Y. Wang, S. Zhang, H. Li, H. Wang, T. Zhang, M. R. Hutchinson, H. Yin and X. Wang, Acc. Chem. Res., 2020, 53, 1046–1055 CrossRef CAS PubMed.
- Y. Wang, L. Su, M. D. Morin, B. T. Jones, L. R. Whitby, M. M. R. P. Surakattula, H. Huang, H. Shi, J. H. Choi, K.-W. Wang, E. M. Y. Moresco, M. Berger, X. Zhan, H. Zhang, D. L. Boger and B. Beutler, Proc. Natl. Acad. Sci. U. S. A., 2016, 113, E884–E893 CAS.
- G. Madhavi Sastry, M. Adzhigirey, T. Day, R. Annabhimoju and W. Sherman, J. Comput.-Aided Mol. Des., 2013, 27, 221–234 CrossRef CAS PubMed.
- S. Jo, T. Kim, V. G. Iyer and W. Im, J. Comput. Chem., 2008, 29, 1859–1865 CrossRef CAS PubMed.
- D. Van Der Spoel, E. Lindahl, B. Hess, G. Groenhof, A. E. Mark and H. J. Berendsen, J. Comput. Chem., 2005, 26, 1701–1718 CrossRef CAS PubMed.
- R. B. Best, X. Zhu, J. Shim, P. E. M. Lopes, J. Mittal, M. Feig and A. D. MacKerell, Jr., J. Chem. Theory Comput., 2012, 8, 3257–3273 CrossRef CAS PubMed.
- J. Lee, X. Cheng, J. M. Swails, M. S. Yeom, P. K. Eastman, J. A. Lemkul, S. Wei, J. Buckner, J. C. Jeong, Y. Qi, S. Jo, V. S. Pande, D. A. Case, C. L. Brooks, III, A. D. MacKerell, Jr., J. B. Klauda and W. Im, J. Chem. Theory Comput., 2016, 12, 405–413 CrossRef CAS PubMed.
- A. D. Becke, Phys. Rev. A: At., Mol., Opt. Phys., 1988, 38, 3098–3100 CrossRef CAS PubMed.
- K. Raghavachari, Theor. Chem. Acc., 2000, 103, 361–363 Search PubMed.
- C. Lee, W. Yang and R. G. Parr, Phys. Rev. B: Condens. Matter Mater. Phys., 1988, 37, 785–789 CrossRef CAS PubMed.
- D. A. Case, H. M. Aktulga, K. Belfon, D. S. Cerutti, G. A. Cisneros, V. W. D. Cruzeiro, N. Forouzesh, T. J. Giese, A. W. Götz, H. Gohlke, S. Izadi, K. Kasavajhala, M. C. Kaymak, E. King, T. Kurtzman, T.-S. Lee, P. Li, J. Liu, T. Luchko, R. Luo, M. Manathunga, M. R. Machado, H. M. Nguyen, K. A. O’Hearn, A. V. Onufriev, F. Pan, S. Pantano, R. Qi, A. Rahnamoun, A. Risheh, S. Schott-Verdugo, A. Shajan, J. Swails, J. Wang, H. Wei, X. Wu, Y. Wu, S. Zhang, S. Zhao, Q. Zhu, T. E. Cheatham, III, D. R. Roe, A. Roitberg, C. Simmerling, D. M. York, M. C. Nagan and K. M. MerzJr., J. Chem. Inf. Model., 2023, 63, 6183–6191 CrossRef CAS PubMed.
- B. Hess, H. Bekker, H. J. C. Berendsen and J. G. E. M. Fraaije, J. Comput. Chem., 1997, 18, 1463–1472 CrossRef CAS.
- P. P. Ewald, Ann. Phys., 1921, 369, 253–287 CrossRef.
- M. Parrinello and A. Rahman, J. Appl. Phys., 1981, 52, 7182–7190 CrossRef CAS.
- S. Nosé and M. L. Klein, Mol. Phys., 1983, 50, 1055–1076 CrossRef.
- W. G. Hoover, Phys. Rev. A: At., Mol., Opt. Phys., 1985, 31, 1695–1697 CrossRef PubMed.
- S. Nosé, Mol. Phys., 1984, 52, 255–268 CrossRef.
- N. Michaud-Agrawal, E. J. Denning, T. B. Woolf and O. Beckstein, J. Comput. Chem., 2011, 32, 2319–2327 CrossRef CAS PubMed.
- C. Bouysset and S. Fiorucci, J. Cheminf., 2021, 13, 72 Search PubMed.
- W. Humphrey, A. Dalke and K. Schulten, J. Mol. Graphics Modell., 1996, 14, 33–38 CrossRef CAS PubMed.
- W. L. DeLano, Proteins, 2002, 30, 442–454 Search PubMed.
- R. Kumari, R. Kumar and A. Lynn, J. Chem. Inf. Model., 2014, 54, 1951–1962 CrossRef CAS PubMed.
- N. A. Baker, D. Sept, S. Joseph, M. J. Holst and J. A. McCammon, Proc. Natl. Acad. Sci. U. S. A., 2001, 98, 10037–10041 CrossRef CAS PubMed.
- G. M. Torrie and J. P. Valleau, Chem. Phys. Lett., 1974, 28, 578–581 CrossRef CAS.
- S. Kumar, J. M. Rosenberg, D. Bouzida, R. H. Swendsen and P. A. Kollman, J. Comput. Chem., 1992, 13, 1011–1021 CrossRef CAS.
- J. S. Hub, B. L. de Groot and D. van der Spoel, J. Chem. Theory Comput., 2010, 6, 3713–3720 CrossRef CAS.
- F. Zhu and G. Hummer, J. Comput. Chem., 2012, 33, 453–465 CrossRef CAS PubMed.
- C. I. Bayly, P. Cieplak, W. Cornell and P. A. Kollman, J. Phys. Chem., 1993, 97, 10269–10280 CrossRef CAS.
Footnote |
| † Electronic supplementary information (ESI) available: Fig. S1. Structural details of simulation systems. Fig. S2. RMSDs of the protein backbone atoms in the second (A) and third (B) independent repeated simulations of (2*L-Neo-3/TLR4/MD2)2 and (2*D-Neo-3/TLR4/MD2)2 systems. Fig. S3. RMSFs of the Cα atoms of TLR4 (A), TLR4* (B), MD2 (C), and MD2* (D) during the last 80 ns trajectories in the simulation of (2*L-Neo-3/TLR4/MD2)2 and (2*D-Neo-3/TLR4/MD2)2 systems. Fig. S4. (A) and (B) Changes in Coulomb interaction energy (A) and van der Waals (vdW) interaction energy (B) between two L-Neo-3 or two D-Neo-3 molecules within the cavity of MD2 during the last 80 ns of MD trajectories; (C) the average Coulomb interaction energy (red) and vdW interaction energy (blue) between two L-Neo-3 or two D-Neo-3 molecules within the cavity of MD2 over the last 80 ns of MD trajectories. Fig. S5. (A)–(C) Time evolution of distance between two L-Neo-3 molecules within 0.15 M NaCl solution in three independent repeated simulations. (D) The relative position of two L-Neo-3 at the beginning (left) and ending (right) in the first simulation. Fig. S6. Histogram analysis of the overlap between umbrella windows along the reaction coordinates of L-Neo-3A (A) and L-Neo-3B (B) binding to TLR4/MD2. Table S1. RESP charges of all atoms of L-Neo-3 and D-Neo-3 molecules. See DOI: https://doi.org/10.1039/d3cp06124h |
|
| This journal is © the Owner Societies 2024 |
Click here to see how this site uses Cookies. View our privacy policy here. 
 Open Access Article
 This Open Access Article is licensed under a Creative Commons Attribution-Non Commercial 3.0 Unported Licence
 *a and
Xiaohui
Wang
*a and
Xiaohui
Wang


