
Investigation of the effects on proton relaxation times upon encapsulation in a water-soluble synthetic receptor†
Krishna N.
Chaudhary
a,
Kyra I.
Brosnahan
a,
Lucas J.
Gibson-Elias
b,
Jose L.
Moreno
Jr
b,
Briana L.
Hickey
b,
Richard J.
Hooley
 b and
Bethany G.
Caulkins
*a
b and
Bethany G.
Caulkins
*a
aDepartment of Natural Sciences, Pitzer and Scripps Colleges, Claremont, California, 91711, USA. E-mail: BCaulkins@scrippscollege.edu
bDepartment of Chemistry, University of California–Riverside, Riverside, CA 92521, USA
First published on 18th March 2024
Abstract
Sequestration of small molecule guests in the cavity of a water-soluble deep cavitand host has a variety of effects on their NMR properties. The effects of encapsulation on the longitudinal (T1) and transverse (T2) relaxation times of the protons in variably sized guest molecules are analyzed here, using inversion recovery and spin-echo experiments. Sequestration of neutral organic species from the bulk solvent reduces the overall proton relaxation times, but the magnitude of this effect on different protons in the same molecule has a variety of contributors, from the motion of the guest when bound, to the position of the protons in the cavity and the magnetic anisotropy induced by the aromatic walls of the host. These subtle effects can have large consequences on the environment experienced by the bound guest, and this sheds light on the nature of small molecules in enclosed environments.
Introduction
Macrocyclic cavity-containing hosts have been exploited for a variety of applications in supramolecular chemistry,1 including catalysis2a biosensing,2b–h molecular recognition,1,2i,j and the study of the behavior of small molecules in confined environments.3 Deep cavitands such as TCC (Fig. 1)4 and other related deep-cavity macrocyclic hosts5,6 are capable of confining small, neutral organic substrates in an environment separate from the bulk medium. Some effects of this confinement include enhanced reactivity,7 and sequestration from the external medium.8 Sequestration can lead to effects like enhanced room temperature phosphorescence of pyrene derivatives,8d selective protection of isomeric esters against solvolysis,5a and the possibility of sequential tandem catalysis.8e | ||
| Fig. 1 (a) Cavitand and guest structure; (b) minimized structure of the TCC·CyO, TCC·2AdOH complexes (lower rim groups truncated for clarity, SPARTAN 20, AMBER forcefield). | ||
In addition to applications in recognition, reactivity and sensing, more focused studies have been performed on the nature of confinement and its impact on the behavior of bound guests.5,6,9 These include molecular motion, carceroisomerism, and the thermodynamics and kinetics of coencapsulation. All these studies tend to rely on NMR spectroscopy, as it is sensitive, capable of monitoring kinetics, and the signals for bound substrate are often separated from the peaks for the receptor, simplifying analysis.
One facet of the encapsulation event that is rarely explored is the effect of binding on the relaxation rates of individual nuclei. Guest relaxation rates are often required in the process of optimizing signal for chemical exchange experiments such as GEST or NOESY/EXSY,9a,10 but studies on the effect of binding inside a defined cavity on the individual longitudinal (T1) and transverse (T2) relaxation times11 of bound protons are rarer.
Longitudinal, or spin–lattice (T1) relaxation describes the return to thermal equilibrium population states, and occurs via mechanisms whereby excited spins transfer the energy obtained from the RF pulse to the surrounding medium as heat, often via collisions, vibrations, and rotations with surrounding solvent molecules.11a–c The T1 relaxation mechanism can be expected to be influenced most strongly by encapsulation of a guest molecule inside a synthetic cavity, as the surrounding environment is highly different from bulk solvent and motion is hindered. Transverse, or spin–spin (T2) relaxation occurs via a dephasing of the spins due to inhomogeneities in the local magnetic field and is often induced by spin exchange processes with surrounding molecules11d,e The effects of encapsulation on this mechanism are less obvious, as the bulk magnetic field (and any related inhomogeneities) can still be felt by the guest once bound, and the guest is still in close contact with other atoms, allowing for spin exchange processes to continue.
We set out to understand both the global effect of binding on T1/T2 times, and whether those differences were dependent on positioning inside the host cavity. For example, when substrates are bound in TCC, the magnetic anisotropy of the cavity increases as guest resides closer to the cavitand base. This affects the chemical shift, with the relevant Δδ values of bound protons in n-decanol ranging from −0.0 ppm at the upper rim to −5.0 ppm at the base.9c The effect of this variable anisotropy on the relaxation times of bound protons is not known, however. Here, we perform a study on the variations on both longitudinal and transverse relaxation times of a variety of cyclic, neutral organic guests upon encapsulation inside the TCC host in aqueous solution and show that both the longitudinal and transverse relaxation properties of guests can be controlled by their size- and shape-fitting inside the host.
Results and discussion
For a complete discussion of the experimental techniques and acquisition parameters used for these experiments, please see the ESI.† The first task was to determine suitable guests that would allow comparison of the T1/T2 times of multiple individual protons when bound. While TCC is quite a promiscuous host, this task introduces a set of restrictions on the substrate pool. The guests must be soluble at approximately millimolar concentration in water in the absence of cavitand, they must obviously form kinetically stable inclusion complexes with the host, and the protons must be differentiable by NMR spectroscopy in both the free and bound forms to allow for determination of T1 and T2 relaxation times and their direct comparison.The molecular recognition properties of the water-soluble deep cavitand TCC (Fig. 1) have been well-studied,4,9 and the scope of suitable guests is well-known. Guest encapsulation is determined by a combination of hydrophobicity and guest size: linear alkanes can coil into a helix to maximize the cavity occupancy, and hydrocarbons from n-pentane to n-tridecane can be bound, along with a series of branched variants.9a Cyclic hydrocarbons are preorganized into structures that favorably fill the cavity, and cycloalkanes from C5–C12 bind strongly, as well as polycyclic species such as decalins, alkylcycloalkanes, pinenes and norbornanes are suitable substrates. However, while the parent hydrocarbons are good guests, they are poorly suited for our task, in that they are either sparingly soluble in free water or show minimal separation of the relevant protons in either the bound or free states. As such, we focused on alkyl ketones and alkanols: these show differentiation in chemical shift in the free state, are freely soluble in water, and generally occupy one stable configuration inside the host (as opposed to unfunctionalized hydrocarbons). Other functional groups such as halogens, thiols or carboxylic acids are possible, but can have complex structures upon binding in the host.9c
The guests chosen are shown in Fig. 1: they consist of cyclic hydrocarbons that are sufficiently water-soluble to obtain relaxation data in aqueous solution, bind strongly in the cavitand9a (Ka > 104 M−1), and show easily differentiated proton signals in both the bound and free states. These differentiated protons are shown in Fig. 2. When bound in TCC, additional differentiation in the proton signal is observed. For example, in 2-AdOH, there is overlap between the various methylene protons in water, but all the protons are fully differentiated when bound in TCC (see Fig. 3; for full spectra and peak assignments, see ESI†).
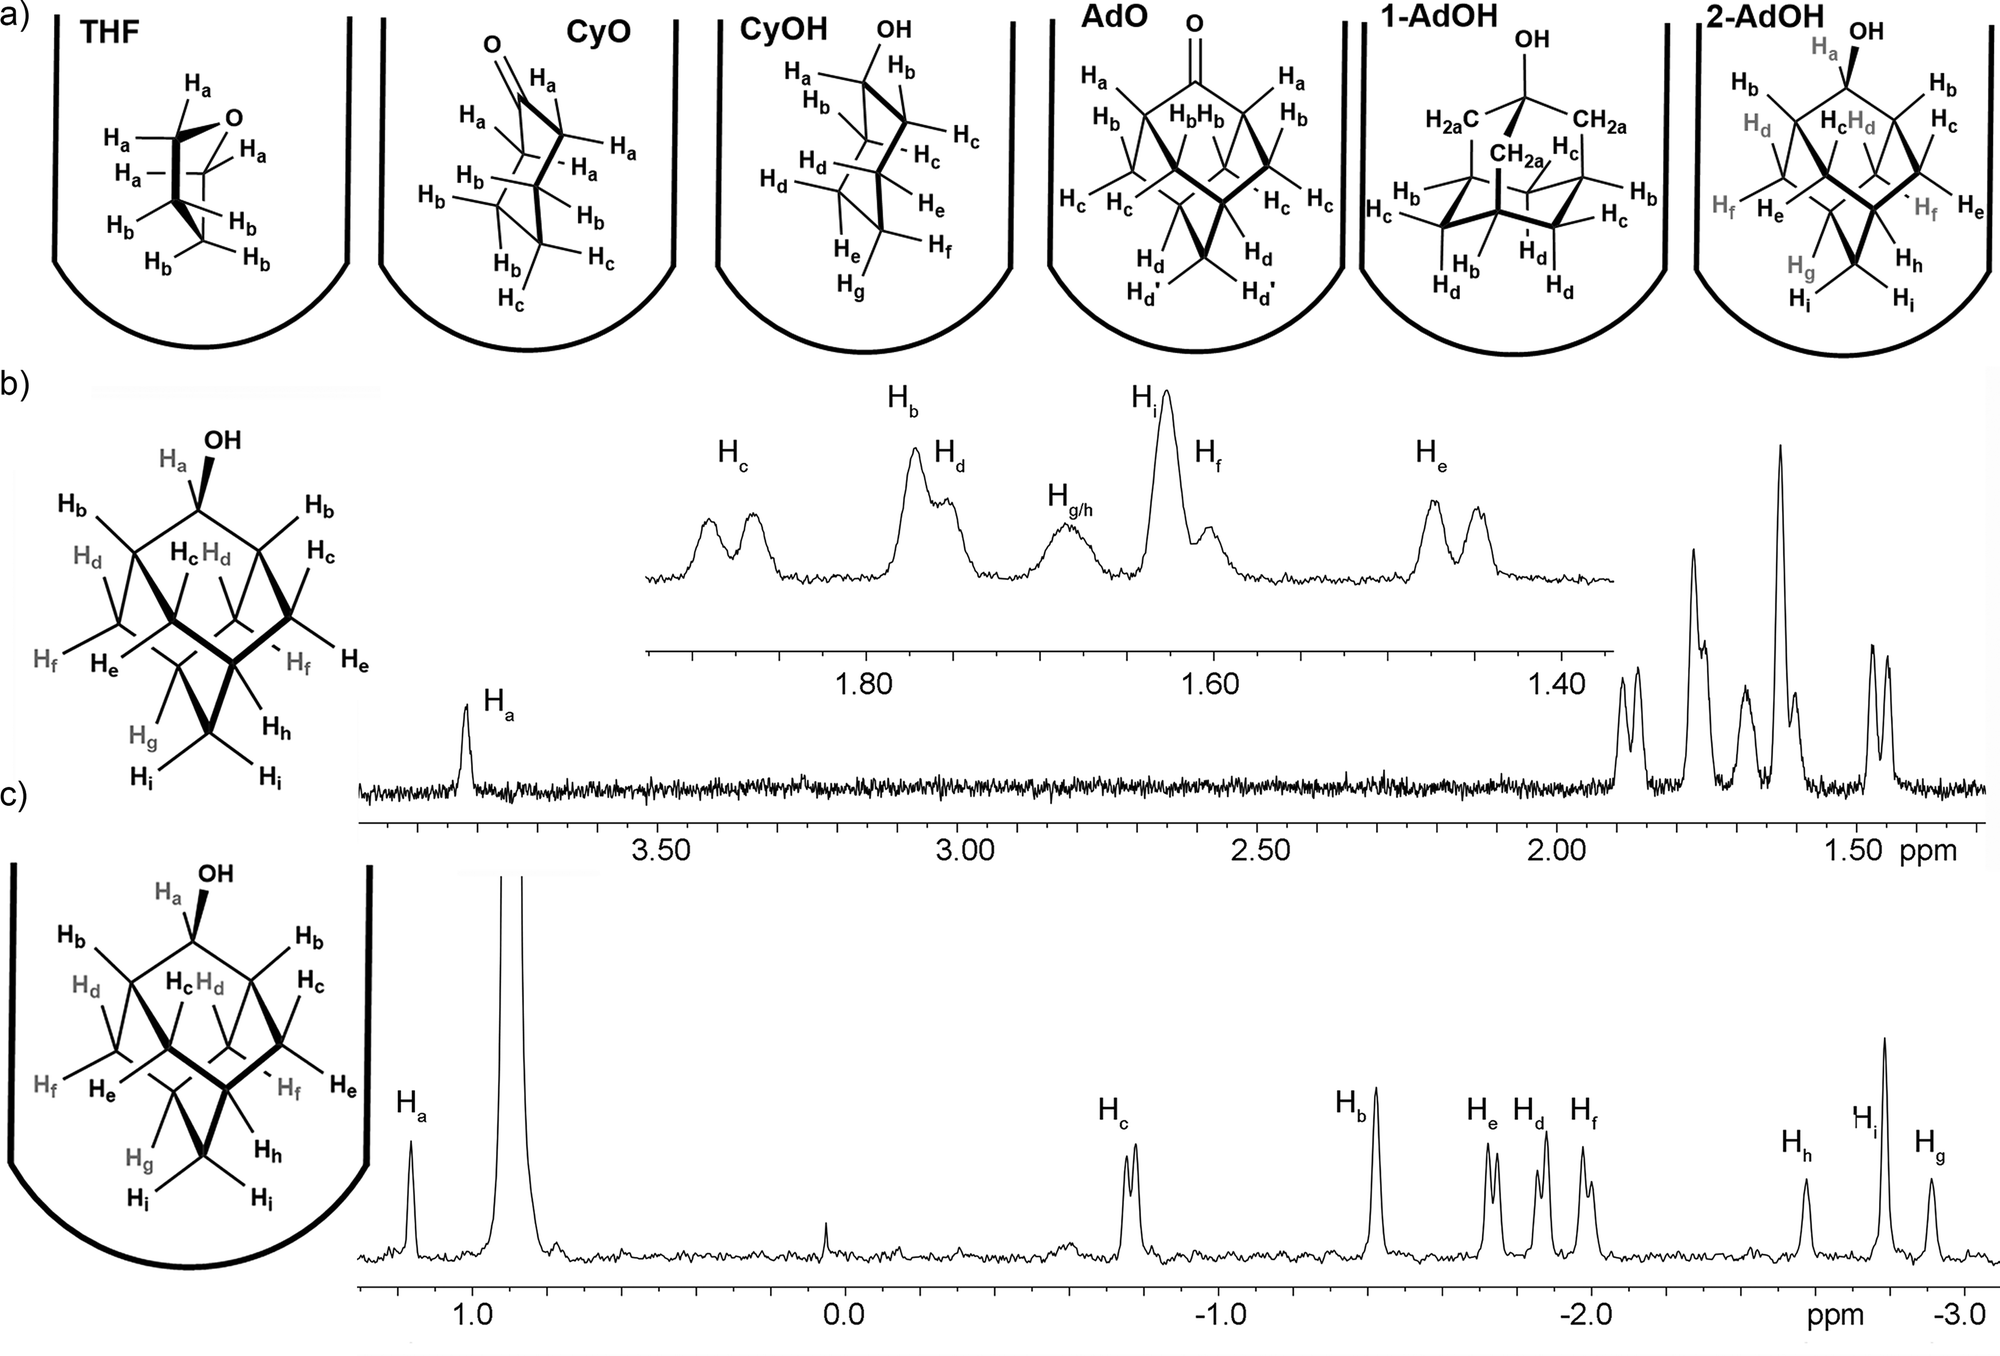 | ||
| Fig. 2 (a) Labeled structures of guests bound in TCC. 1H NMR spectra and labeled peak assignments of (b) 2-AdOH; (c) 2-AdOH·TCC (400 MHz, D2O, 298 K, [TCC] = 2 mM). | ||
 | ||
| Fig. 3 Stacked NMR spectra for the inversion recovery experiments determining T1 for AdO, (a) free in D2O and (b) bound in TCC in D2O, [TCC] = 2 mM, [AdO] = 3 mM, D2O, 500 MHz, 298 K. | ||
The six chosen guests vary in their NMR complexity and binding properties. THF is the smallest guest and shows broad peaks when bound due to rapid tumbling inside the cavity. The two cyclohexyl guests CyO and CyOH show more defined peaks, and are orientationally restricted when bound: the polar oxygens are oriented towards the bulk solvent, and a single carceroisomer is seen. The guest rotates rapidly around the vertical axis while bound, but shows no “up/down” rotation. In addition, no peaks for the axial conformer of CyOH can be seen, as only the equatorial conformer is present at any appreciable concentration in the cavity.9d The adamantane guests are interesting, as there are two orientations that they can display. The “usual” orientation of 1-substituted adamantanes in cavities such as these9a,12 is for the polar group to be pointed vertically, as illustrated for 1-AdOH in Fig. 2a. This positions the Hd protons vertically downward in the cavity, and they feel the greatest magnetic anisotropy and have the furthest upfield shift upon binding. However, for AdO and 2-AdOH, the polar group is positioned at the 2-position, which favors a different conformation while bound (illustrated in Fig. 2) that positions the terminal methylene (Hd’, Hi in AdO and 2-AdOH, respectively) at the cavitand base. Again, all the adamantyl derivatives freely rotate about the vertical axis of the cavitand while bound, but are restricted in their up/down rotation, so only one carceroisomer is seen. Finally, 2-AdOH and CyOH contain prochiral centers, so they display more 1H NMR signals for the diastereotopic protons on certain methylenes. These are clearly differentiated inside the cavitand, although there is some overlap in free solution. The spectra were assigned based on analysis of the 1H spectra, as well as incorporating some 2D NOESY and COSY analysis to confirm the assignment. For full 1D spectra containing peak assignments, see ESI.†
The longitudinal relaxation times (T1) for all six guests were determined using a one-dimensional inversion recovery experiment.13 Experiments were performed on a 11.7-T Bruker Avance III spectrometer (1H resonance: 500.13 MHz). Delay times in the experiment varied from 0 s to 3 s, depending on system and the amount of time it took for signals to turn negative. The T1 value for each discrete, separable proton in D2O both while free and while bound to TCC was determined by plotting the resulting spectral data in Mathematica and fitting it to eqn (1). The data are shown in Fig. 3 and Table 1 (for additional data, see ESI†).
| M(t) = M0 − 2M0e−t/T1 | (1) |
| Guest proton | T 1 (free), s | T 1 (bound), s | ΔT1 |
|---|---|---|---|
| a Spectra were recorded using the inversion recovery pulse sequence, [TCC] = 2 mM, [added guest] = 3 mM, D2O, 500 MHz, 298 K. Data were fit in Mathematica to extract the relaxation parameters. ΔT1 = T1 (free) − T1 (bound). | |||
| CyO | |||
| Ha | 3.04 ± 0.13 | 2.02 ± 0.16 | 1.02 ± 0.21 |
| Hb | 2.69 ± 0.21 | 1.90 ± 0.13 | 0.79 ± 0.25 |
| Hc | 2.74 ± 0.24 | 1.99 ± 0.22 | 0.75 ± 0.33 |
| AdO | |||
| Ha | 3.72 ± 0.14 | 1.34 ± 0.10 | 2.38 ± 0.17 |
| Hb | 2.74 ± 0.15 | 0.579 ± 0.026 | 2.16 ± 0.15 |
| Hc | 2.96 ± 0.10 | 0.554 ± 0.024 | 2.41 ± 0.10 |
| Hd | 2.70 ± 0.17 | 0.732 ± 0.021 | 1.97 ± 0.17 |
| CyOH | |||
| Ha | 3.02 ± 0.03 | 1.86 ± 0.09 | 1.16 ± 0.09 |
| Hb | 2.10 ± 0.04 | 1.12 ± 0.08 | 0.98 ± 0.09 |
| Hc | 2.03 ± 0.04 | 1.12 ± 0.09 | 0.91 ± 0.10 |
| Hd | 2.07 ± 0.05 | 1.04 ± 0.10 | 1.03 ± 0.11 |
| He | 2.03 ± 0.05 | 1.06 ± 0.08 | 0.97 ± 0.09 |
| Hf | 2.03 ± 0.04 | 0.973 ± 0.06 | 1.06 ± 0.07 |
| Hg | 2.10 ± 0.04 | 0.979 ± 0.10 | 1.12 ± 0.11 |
| 1-AdOH | |||
| Ha | 1.66 ± 0.07 | 1.17 ± 0.03 | 0.49 ± 0.08 |
| Hb | 2.18 ± 0.07 | 1.63 ± 0.08 | 0.55 ± 0.11 |
| Hc | 1.41 ± 0.06 | 0.962 ± 0.049 | 0.45 ± 0.08 |
| Hd | 1.44 ± 0.06 | 0.976 ± 0.053 | 0.46 ± 0.08 |
| 2-AdOH | |||
| Ha | 2.23 ± 0.71 | 0.908 ± 0.17 | 1.32 ± 0.73 |
| Hb | 1.93 ± 0.45 | 1.04 ± 0.069 | 0.89 ± 0.46 |
| Hc | 1.36 ± 0.51 | 0.488 ± 0.045 | 0.87 ± 0.51 |
| Hd | 1.79 ± 0.45 | 0.493 ± 0.037 | 1.29 ± 0.45 |
| He | 1.38 ± 0.48 | 0.471 ± 0.043 | 0.91 ± 0.48 |
| Hf | 1.60 ± 0.54 | 0.506 ± 0.036 | 1.09 ± 0.54 |
| Hg | 1.85 ± 0.59 | 1.01 ± 0.16 | 0.84 ± 0.61 |
| Hh | 1.85 ± 0.59 | 1.02 ± 0.17 | 0.83 ± 0.61 |
| Hi | 1.77 ± 0.34 | 0.572 ± 0.032 | 1.20 ± 0.34 |
| THF | |||
| Ha | 3.73 ± 0.27 | 1.52 ± 0.07 | 2.21 ± 0.28 |
| Hb | 3.66 ± 0.26 | 1.57 ± 0.05 | 2.09 ± 0.26 |
Error values were determined by plotting the residuals for each data point collected. The absolute value of the mean of the residual values was divided by the mean of the signal intensity to find a percent error for each relaxation time.
The initial, simplest observation from the T1 data in Table 1 is that the time for longitudinal relaxation is significantly shorter when bound in the cavity than it is in free solution. While there is variation in the T1 times between different protons at different positions in the same guest (for example, protons near heavy atoms such as O have a longer T1 than those that are remote), a consistent variation between bound and free protons can be seen. In each case, the observed 1H T1 when bound is ∼0.5–2 s shorter than it is for the same proton free in solution. Looking more closely, some other trends can be observed: firstly, the ΔT1 is not affected in any appreciable way by the depth of the proton in the cavitand. For example, the Ha protons in 1-AdOH, which are positioned at the upper rim of the cavitand, show exactly the same ΔT1 as the Hd protons, which are oriented vertically downwards at the base of the cavity. This trend is repeated for the other guests, too.
The most notable trend is the global difference in T1 between protons on differently sized molecules, and this can be surprisingly large. For example, ΔT1 for AdO is between 2–2.4 s, whereas for 2-AdOH, which is almost exactly the same size as AdO and should occupy the same orientation in the cavity, the ΔT1 values are between 0.8–1.3 s. These data indicate that the observed T1 values of guest bound inside the cavity are, in some cases, almost independent of the T1 values observed in free solution. The protons in 2-AdOH in water have a much shorter relaxation time (1.3–2.2 s) than those in AdO (2.7–3.7 s), but when bound in TCC, the T1 values become quite similar (0.5–1 s, with Ha in AdO being the sole outlier). This observation is not completely consistent, especially for CyO and CyOH, which have a large difference in bound T1 (ΔΔT1 ∼1 s), but it is consistent for the large adamantyl guests.
These observations suggest a theory for the changes in proton T1 upon guest binding in the cavitand. For longitudinal relaxation, the relaxation time is determined by how easily the nuclei can transfer the excited state thermal energy to the surrounding lattice as they return to their equilibrium population states. As we are comparing the relative T1s for protons in their bound and free states, any variations from molecular structure (the presence of heavy atoms, functional groups, C vs. H, etc.) should not apply. Differences between bound and free states can stem from (a) differential rotation of the molecule; (b) variations in the “solvation” shell (water vs. the aromatic walls of the cavitand); (c) effective compression of the molecule, which affects C–H vibrational modes; (d) magnetic anisotropy effects from the host; (e) protection from external dissolved oxygen in the solvent while bound.8d Not all of these differences are large, or even important, but all could contribute to changes in T1 time.
The data in Table 1 indicate that the relative size and shape of the guest controls the observed T1 values. In free D2O solution, the CH protons in the alcohols (CyOH, 1-AdOH, 2-AdOH) show significantly shorter T1 times than the ketones (CyO, AdO) or THF. This is likely due to more favorable hydrogen bonding between the OH group and water, allowing more rapid transfer of thermal energy to the surrounding solvent. To address the question of the effect of water on free guest, we determined the T1 relaxation data for 1-AdOH and 2-AdOH in other organic solvents, tetrachloroethane-d2 and DMSO-d6 (see ESI† for data). These measurements show that T1 values for these alcohols are slower in TCE (a non-hydrogen-bonding solvent) than in either water or DMSO, corroborating the theory.
When in the cavitand, the guest is shielded from water, and this effect is attenuated. Now, the energy transfer must occur between the guest and the cavitand walls, which is determined by how close the guest protons are to the host aromatic groups. Interestingly, this effect appears to be independent of the magnetic anisotropy field in the cavitand: T1 times inside the TCC cavity are not dependent on the vertical position (i.e., depth) in the cavity, as chemical shifts are, but on the relative proximity to the cavitand walls. The wider guests (AdO, 1-AdOH, 2-AdOH), generally show shorter T1 times than the smaller cyclohexanes (CyO, CyOH), and much shorter bound T1 times than the small THF. These effects are illustrated more starkly upon closer inspection of the individual protons. The comparison between the protons in AdO and 2-AdOH is most illustrative (see Fig. 4). The different protons can be separated into 3 groups – “upper” protons that may have contact with bulk water (Ha in AdO, Ha/Hb in 2-AdOH), “central” protons that interact with the cavitand walls (Hb/Hc in AdO, Hc − Hf in 2-AdOH), and “lower” protons that point to the cavity base (Hd in AdO, Hg − Hh in 2-AdOH). The observed T1 values for these almost identical protons are also almost identical. The only variation is for the lower protons, where the signal for Hd in AdO encompasses two different proton types, so the T1 is averaged. In both cases, the “central” and “lower” protons have similar T1 times, controlled by their position in the host. The fastest T1s occur for the “central” protons, oriented directly at the sidewalls, and the T1 for the “lower” protons is slightly longer. The upper protons have longer T1 values, as they are exposed to bulk solvent and show relaxations more reminiscent of bulk solution, i.e. the difference in T1 for “upper” bound protons and their free counterparts is much less than the difference between those in the depths of the cavity. This could be due to collisions with solvent or a greater exposure to external O2 in the solvent; either way, the “upper” environment is more similar to the external milieu than the “lower” interior of the cavity.
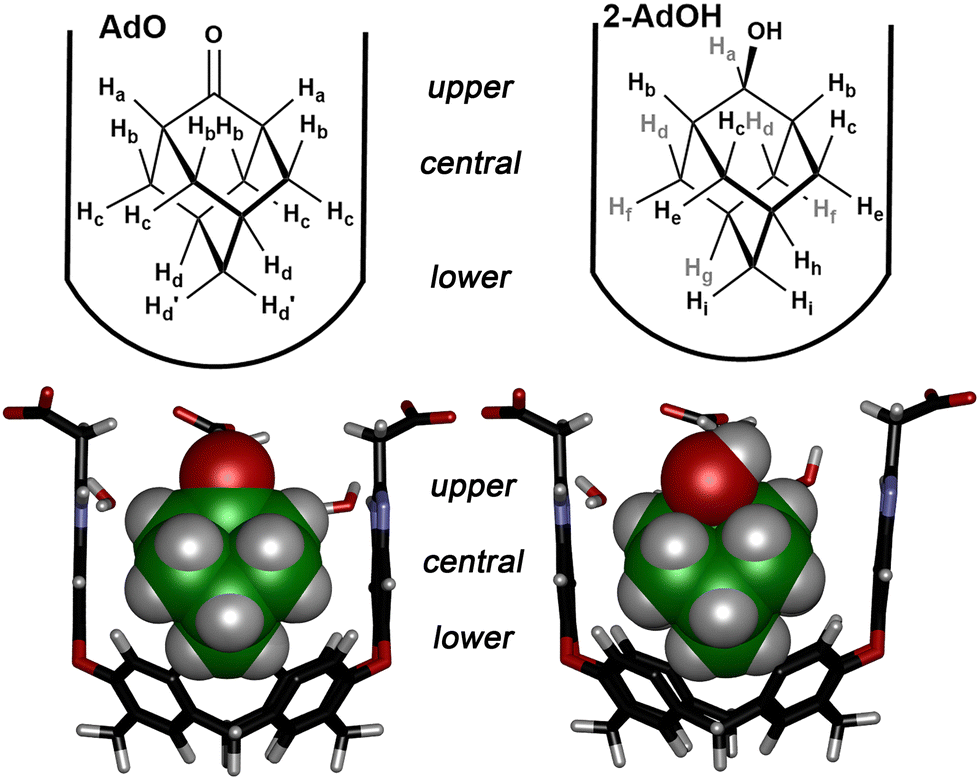 | ||
| Fig. 4 Bound host guest structures and proton positioning for AdO·TCC and 2-AdOH·TCC. Structures minimized in SPARTAN ’20, AMBER forcefield, front walls and lower rim feet removed for clarity. | ||
This effect is less obvious for the smaller, more rapidly tumbling guests such as CyO and THF. As CyO is fluxional and averages signals for the axial/equatorial protons (which are discrete in CyOH), a similar “direct comparison” analysis is not possible. However, the general concept of the cavitand providing its own solvation shell that controls T1 values is still broadly valid. Interestingly, there does not appear to be a large difference between axial and equatorial protons in bound CyOH, although the “upper” proton Ha shows a longer T1 than the others, corroborating the results seen for AdO/2-AdOH, whereby protons that are exposed to solvent show a longer T1 than those buried in the cavity.
The data in Table 1 indicate that the T1 relaxation of guests is controlled by thermal energy transfer to the host, which introduces the question of whether there are any effects of guest size on the T1 relaxation times of the host protons. The T1 times for the four different sets of protons on the cavitand (the benzimidazole CH, the two different resorcinarene aromatic CH, and the lower rim methine) were calculated in the presence of three differently sized guests (THF, CyOH and AdO, see ESI† for data). Interestingly, there is almost no change at all in the T1 times with various guests: the T1 time for the methine varies from 1.21 s (AdO) to 1.26 s (CyOH). The only change that could be seen was for the side-wall benzimidazole CH atoms, which go from 1.51 s (THF) to 1.64 s (AdO). This might be an indication that the walls are distorted somewhat by the larger guest (an observation seen previously9a), but the change is so small that this is purely speculative. The exposure of the cavitand to bulk solvent with or without guests bound may explain the lack of a change in T1 values between systems.
In addition to determining T1 times for bound guests, we also analyzed T2. Specifically, T2* (T2* = T2 + T2 (ΔB0)) was measured, so magnetic field inhomogeneity is included in the measurement, although the samples were scrupulously shimmed to limit the effects of this. The transverse relaxation times (T2) for the six guests were determined using the Hahn spin echo experiment.14 Spectra were recorded on a 11.7-T Bruker Avance III spectrometer (1H resonance: 500.13 MHz). T2 relaxation times were significantly faster than the T1 times, so delay times in the experiment varied from 0 ms to 50 ms, depending on system and the amount of time it took for signals to diminish. The T2 value for each discrete, separable proton in D2O both while free and while bound to TCC was determined by plotting the resulting spectral data in Mathematica and fitting it to eqn (2).
| M(t) = M0e−t/T2 | (2) |
Error values were determined by plotting the residuals for each data point collected. The mean of the residual values was divided by the mean of the signal intensity to find a percent error for each relaxation time. The data are shown in Fig. 5 and Table 2. The T2 times were significantly shorter than T1 times (as expected15), so the data in Table 2 is shown in msec.
 | ||
| Fig. 5 Stacked NMR spectra for the CPMG-1D spin echo experiments determining T2 for AdO, (a) free in D2O and (b) bound in TCC in D2O, [TCC] = 2 mM, [AdO] = 3 mM, D2O, 500 MHz, 298 K. | ||
| Guest proton | T 2 (free), ms | T 2 (bound), ms | ΔT2 |
|---|---|---|---|
| a Spectra were recorded using the CPMG-1D pulse sequence, [TCC] = 2 mM, [added guest] = 3 mM, D2O, 500 MHz, 298 K. Data were fit in Mathematica to extract the relaxation parameters. ΔT1 = T1 (free) − T1 (bound). | |||
| CyO | |||
| Ha | 36.9 ± 2.0 | 12.6 ± 0.7 | 24.3 ± 2.1 |
| Hb | 14.0 ± 0.5 | 8.73 ± 0.55 | 5.3 ± 0.7 |
| Hc | 29.4 ± 3.3 | 9.89 ± 0.40 | 19.5 ± 3.3 |
| AdO | |||
| Ha | 21.3 ± 0.1 | 21.6 ± 0.7 | −0.3 ± 0.7 |
| Hb | 9.90 ± 0.60 | 8.53 ± 0.14 | 1.37 ± 0.62 |
| Hc | 14.8 ± 0.5 | 9.84 ± 0.21 | 4.96 ± 0.54 |
| Hd | 24.9 ± 3.0 | 30.5 ± 0.8 | −5.6 ± 3.1 |
| CyOH | |||
| Ha | 13.8 ± 0.8 | 8.74 ± 0.64 | 5.1 ± 1.0 |
| Hb | 13.5 ± 0.5 | 9.89 ± 0.50 | 3.6 ± 0.7 |
| Hc | 11.9 ± 0.6 | 8.23 ± 0.39 | 3.7 ± 0.7 |
| Hd | 10.4 ± 0.6 | 7.02 ± 0.36 | 3.4 ± 0.7 |
| He | 13.5 ± 0.6 | 8.25 ± 0.41 | 5.3 ± 0.7 |
| Hf | 7.93 ± 0.51 | 6.26 ± 0.38 | 1.67 ± 0.64 |
| Hg | 9.89 ± 0.51 | 9.06 ± 0.56 | 0.83 ± 0.76 |
| 1-AdOH | |||
| Ha | 36.6 ± 1.3 | 28.6 ± 0.9 | 8.0 ± 1.6 |
| Hb | 18.0 ± 0.7 | 16.5 ± 1.0 | 1.5 ± 1.2 |
| Hc | 11.5 ± 0.7 | 9.01 ± 0.46 | 2.5 ± 0.8 |
| Hd | 12.1 ± 0.8 | 9.64 ± 0.40 | 2.5 ± 0.9 |
| 2-AdOH | |||
| Ha | 28.2 ± 1.7 | 18.4 ± 2.6 | 9.8 ± 3.1 |
| Hb | 15.0 ± 1.4 | 16.4 ± 1.3 | −1.4 ± 1.9 |
| Hc | 11.9 ± 0.2 | 7.15 ± 0.92 | 4.8 ± 0.9 |
| Hd | 13.1 ± 0.3 | 7.13 ± 1.05 | 6.0 ± 1.0 |
| He | 14.1 ± 0.7 | 14.5 ± 2.3 | −0.4 ± 2.4 |
| Hf | 13.4 ± 1.2 | 10.3 ± 0.7 | 3.1 ± 1.4 |
| Hg | 19.1 ± 0.9 | 14.4 ± 1.6 | 4.7 ± 1.8 |
| Hh | 19.1 ± 0.9 | 22.3 ± 5.2 | −3.2 ± 5.3 |
| Hi | 17.2 ± 1.1 | 24.6 ± 1.3 | −7.5 ± 1.7 |
| THF | |||
| Ha | 91.5 ± 10.6 | 8.45 ± 0.75 | 83.1 ± 10.6 |
| Hb | 116 ± 16 | 10.5 ± 0.7 | 106 ± 16 |
As the transverse relaxation mechanism is different from that for longitudinal relaxation, it was not immediately clear what the effect of guest encapsulation would be. The data in Table 2 do show some clear trends, however. In most cases, the T2 relaxation times of bound guest protons are shorter than their counterparts in free D2O solution. This is not completely consistent, however, and changes with the nature of guest. For example, the smallest, fastest tumbling guests THF and CyO show markedly shorter T2 times when bound than free in solution: for THF, the relaxation is almost an order of magnitude faster (∼100 ms free, 10 ms bound). In contrast, the larger guests show much smaller changes: the ΔT2 values for the protons in AdO and 2-AdOH change by only ∼20%, and some protons actually show an increase in T2 relaxation time.
Upon closer inspection, more information can be gleaned. The “upper” protons in the bound guests show a longer T2 time than the protons that are more buried inside the cavity, similar to the trend seen for T1 times. This trend is not as clear as for T1, as the data is skewed somewhat by the greater effect of heavy atoms on nearby protons and the larger differences in free T2 time. However, the general observation is relatively consistent, that “upper” protons show T2 times closer to that in free solution. In contrast, the “central” protons for each guest show T2 times that are all clustered around 10 ms (with a range of 9–10 ms). This applies to almost all the guests, no matter their width, exchange, or tumbling rate – the “central” protons in AdO, CyO, CyOH, THF and 1-AdOH are all in this range, with only 2-AdOH as the outlier (but in this case, the difference is small, with T2 ranging from 10–14 ms). The other outliers are the “lower” protons, especially in AdO and 2-AdOH, which show much longer T2 relaxation.
From this, a plausible theory can be postulated: evidently the induced magnetic field displayed by the aromatic rings in the cavitand (and the concomitant magnetic anisotropy in the cavity) is a mini-magnetic field that “smooths” the anisotropies felt by the bound guest protons and evens out T2 relaxation times. This effect is seen most strongly for protons that reside in the “central” position. The smallest effects are seen for “upper” protons, similar to the observations for T1, as these protons experience more of the bulk medium than their “central” counterparts. The guest molecule experiences a more uniform magnetic environment while bound in TCC, so the T2 relaxation times for each proton all fall into a narrower range. There are outliers, and the prevalence of external factors (such as defects in the NMR tube, any small particulate impurities in the sample, or dissolved O2) that can affect the T2 time make the data less amenable to interpretation than the T1 data. However, the general effect of encapsulation of different types of guests is again quite clear and quite substantial.
The same kind of “smoothing” can also be caused by changes in molecular motion, and this is seen mostly clearly for the fast-tumbling guests THF and CyO. In free solution, these guests show long T2 relaxation times, consistent with greater dynamics than the other, larger guests.11e,15,16 However, when bound in the cavitand, the motion of all the guests is controlled by the constricted cavity, and therefore the overall T2 times are far more uniform, and there are fewer differences between the observed times for different guests.
An important question when analyzing the T1 and T2 relaxation data is whether the results are solely for “bound” guests, or whether in/out exchange occurs on a timescale that would lead to differential contributions from the bound state. The exchange rates for bound guests in TCC are relatively constant, and dependent on guest size and overall hydrophobic surface area. Larger guests exchange more slowly than smaller ones, and the exchange rates in TCC for most of the guests shown in Fig. 1 (and other similarly sized species) have been previously determined.9a They range from k = 9.8 s−1 (CyO) to k = 1.8 s−1 (1-AdOH), corresponding to exchange ΔG‡ = 16–17 kcal mol−1 at ambient temperature (see ESI† and ref. 9a). As the exchange rate is faster than the observed T1 values, it could contribute to some “averaging” of T1 between bound and free states. The T2 relaxation is far faster than any exchange, though, so it can be expected to have minimal impact on the measurements.
However, as can be seen from Tables 1 and 2, the largest changes between bound and free states are seen in the measurements of T1, where we would expect averaging to occur (if it did). It is notable that the TCC·guest samples were made with minimal excess guest in the system, so in each case >95% of the guest in the sample resides in the cavity. In addition, there is no obvious correlation between fast and slow exchanging guests and the observed ΔT1 values – fast-exchanging CyO has a greater ΔT1 than slow-exchanging 1-AdOH, for example. Therefore, while we cannot rule out some variations in observed T1 based on chemical exchange, they do not appear to be large in this case.
Conclusions
In conclusion, we have shown that the relaxation rates of different protons in small cyclic and polycyclic guests can be significantly affected by encapsulation in a water-soluble synthetic receptor. The factors that control the changes in T1 and T2 times are quite varied, but most of the effects fall in the same general category of “sequestration of the substrate from the bulk”. The subtle positioning of different protons inside the host cavity is a strong determinant of observed T1 relaxation time: if the protons are even slightly exposed to solvent, the observed T1 is much closer to that experienced in bulk water, but if the proton is fully sequestered in the cavity, its relative proximity to the host walls becomes dominant. In contrast, T2 relaxation times are mainly controlled by the induced field generated by the cavity, although proximity to bulk solvent is also important in this case. These results are unique to this particular host: other types of receptors will affect the relaxation of bound guests in different ways, depending on access to bulk solvent when bound and the type of molecular structure that surrounds the substrate. Considering the importance of complex NMR experiments that can analyze motion and behavior of substrates in confined environments, be they enzyme-substrate or synthetic host:guest complexes, and the need for optimized T1/T2 data for greatest efficacy, we believe these results are an important datapoint for further development of complex NMR-based experiments that can interrogate molecular recognition processes in detail.Conflicts of interest
There are no conflicts to declare.Acknowledgements
The authors would like to thank the Department of Natural Sciences, Pitzer and Scripps Colleges and Claremont McKenna College for startup and student funding (B.G.C.), and the National Science Foundation (CBET-2306195 to R.J.H.) for support.References
- (a) F. Hof, S. L. Craig, C. Nuckolls and J. Rebek, Jr., Angew. Chem., Int. Ed., 2002, 41, 1488–1508 CrossRef CAS; (b) R. Pinalli, A. Pedrini and E. Dalcanale, Chem. Soc. Rev., 2018, 47, 7006–7026 RSC; (c) Z. Laughrey and B. C. Gibb, Chem. Soc. Rev., 2011, 40, 363–386 RSC.
- (a) R. J. Hooley and J. Rebek, Jr., Chem. Biol., 2009, 16, 255–264 CrossRef CAS PubMed; (b) S. van Dun, C. Ottmann, L.-G. Milroy and L. Brunsveld, J. Am. Chem. Soc., 2017, 139, 13960–13968 CrossRef CAS PubMed; (c) W. Zhong and R. J. Hooley, Acc. Chem. Res., 2022, 55, 1035–1046 CrossRef CAS PubMed; (d) E. E. Harrison, B. A. Carpenter, L. E. St. Louis, A. G. Mullins and M. L. Waters, J. Am. Chem. Soc., 2021, 143, 14845–14854 CrossRef CAS PubMed; (e) E. E. Harrison and M. L. Waters, Chem. Sci., 2023, 14, 928–936 RSC; (f) S. A. Minaker, K. D. Daze, M. C. Ma and F. Hof, J. Am. Chem. Soc., 2012, 134, 11674–11680 CrossRef CAS PubMed; (g) M. A. Beatty, J. Borges-González, N. J. Sinclair, A. T. Pye and F. Hof, J. Am. Chem. Soc., 2018, 140, 3500–3504 CrossRef CAS PubMed; (h) A. J. Selinger and F. Hof, Angew. Chem., Int. Ed., 2023, 62, e202312407 CrossRef CAS PubMed; (i) S. Liu, H. Gan, A. T. Hermann, S. W. Rick and B. C. Gibb, Nat. Chem., 2010, 2, 847–852 CrossRef CAS PubMed; (j) M. R. Sullivan and B. C. Gibb, Org. Biomol. Chem., 2015, 13, 1869–1877 RSC.
- (a) J. Rebek Jr, Acc. Chem. Res., 2009, 42, 1660–1668 CrossRef PubMed; (b) J. H. Jordan and B. C. Gibb, Chem. Soc. Rev., 2015, 44, 547–585 RSC.
- (a) S. M. Biros, E. C. Ullrich, F. Hof, L. Trembleau and J. Rebek Jr., J. Am. Chem. Soc., 2004, 126, 2870–2876 CrossRef CAS PubMed; (b) F. Hof, L. Trembleau, E. C. Ullrich and J. Rebek Jr., Angew. Chem., Int. Ed., 2003, 42, 3150–3153 CrossRef CAS PubMed.
- (a) S. Liu, H. Gan, A. T. Hermann, S. W. Rick and B. C. Gibb, Nat. Chem., 2010, 2, 847–852 CrossRef CAS PubMed; (b) M. R. Sullivan and B. C. Gibb, Org. Biomol. Chem., 2015, 13, 1869–1877 RSC; (c) S. Liu, D. H. Russell, N. F. Zinnel and B. C. Gibb, J. Am. Chem. Soc., 2013, 135, 4314–4324 CrossRef CAS PubMed; (d) C. L. Gibb and B. C. Gibb, Chem. Commun., 2007, 1635–1637 RSC.
- (a) A. Asadi, D. Ajami and J. Rebek Jr., J. Am. Chem. Soc., 2011, 133, 10682–10684 CrossRef CAS PubMed; (b) D. Ajami and J. Rebek Jr., Nat. Chem., 2009, 1, 87–90 CrossRef CAS PubMed; (c) K. D. Zhang, D. Ajami, J. V. Gavette and J. Rebek Jr., J. Am. Chem. Soc., 2014, 136, 5264–5266 CrossRef CAS PubMed; (d) S. Mosca, Y. Yu, J. V. Gavette, K. D. Zhang and J. Rebek Jr., J. Am. Chem. Soc., 2015, 137, 14582–14585 CrossRef CAS PubMed; (e) W. Jiang and J. Rebek Jr., J. Am. Chem. Soc., 2012, 134, 17498–17501 CrossRef CAS PubMed; (f) A. Scarso, L. Trembleau and J. Rebek, Jr., J. Am. Chem. Soc., 2004, 126, 13512–13518 CrossRef CAS PubMed.
- (a) R. J. Hooley, T. Iwasawa and J. Rebek Jr., J. Am. Chem. Soc., 2007, 129, 15330–15339 CrossRef CAS PubMed; (b) J.-L. Hou, D. Ajami and J. Rebek Jr., J. Am. Chem. Soc., 2008, 130, 7810–7811 CrossRef CAS PubMed; (c) M. Ziegler, J. L. Brumaghim and K. N. Raymond, Angew. Chem., Int. Ed., 2000, 39, 4119–4121 CrossRef CAS.
- (a) S. Horiuchi, T. Murase and M. Fujita, Angew. Chem., Int. Ed., 2012, 51, 12029–12031 CrossRef CAS PubMed; (b) V. M. Dong, D. Fiedler, B. Carl, R. G. Bergman and K. N. Raymond, J. Am. Chem. Soc., 2006, 128, 14464–14465 CrossRef CAS PubMed; (c) L. S. Kaanumalle, C. L. D. Gibb, B. C. Gibb and V. Ramamurthy, J. Am. Chem. Soc., 2004, 126, 14366–14367 CrossRef CAS PubMed; (d) C. J. Easley, M. Mettry, E. M. Moses, R. J. Hooley and C. J. Bardeen, J. Phys. Chem. A, 2018, 122, 6578–6584 CrossRef CAS PubMed; (e) Y. Ueda, H. Ito, D. Fujita and M. Fujita, J. Am. Chem. Soc., 2017, 139, 6090–6093 CrossRef CAS PubMed.
- (a) R. J. Hooley, H. J. Van Anda and J. Rebek, Jr., J. Am. Chem. Soc., 2007, 129, 13464–13473 CrossRef CAS PubMed; (b) R. J. Hooley, S. M. Biros and J. Rebek, Jr., Chem. Commun., 2006, 509–511 RSC; (c) R. J. Hooley, J. V. Gavette, D. Ajami and J. Rebek, Jr., Chem. Sci., 2014, 5, 4382–4387 RSC; (d) L. Perez, M. Mettry, B. G. Caulkins, L. J. Mueller and R. J. Hooley, Chem. Sci., 2018, 9, 1836–1845 RSC.
- (a) L. Avram, M. A. Iron and A. Bar-Shir, Chem. Sci., 2016, 7, 6905–6909 RSC; (b) L. Avram, A. D. Wishard, B. C. Gibb and A. Bar-Shir, Angew. Chem., Int. Ed., 2017, 56, 15314–15318 CrossRef CAS PubMed.
- (a) D. L. Ashley, E. R. Barnhart, D. G. Patterson, Jr. and R. H. Hill, Jr., Anal. Chem., 1988, 60, 15–19 CrossRef CAS PubMed; (b) E. Breitmaier, K.-H. Spohn and S. Berger, Angew. Chem., Int. Ed. Engl., 1975, 14, 144–159 CrossRef; (c) S. K. Vaish, A. Singh, A. K. Singh and N. K. Mehrotra, Ind. J. Pure. Appl. Phys., 2005, 43, 295–300 CAS; (d) R. M. Levy, M. Karplus and P. G. Wolynes, J. Am. Chem. Soc., 1981, 103, 5998–6011 CrossRef CAS; (e) U. Haeberlen, U. W. Spiess and D. Schweitzer, J. Mag. Res., 1972, 6, 39–54 CAS.
- R. J. Hooley, S. R. Shenoy and J. Rebek Jr., Org. Lett., 2008, 10, 5397–5400 CrossRef CAS PubMed.
- E. D. Becker, J. A. Ferretti, R. K. Gupta and G. H. Weiss, J. Magn. Reson., 1980, 37, 381–394 CAS.
- E. L. Hahn, Phys. Rev., 1950, 80, 580–594 CrossRef.
- T. D. W. Claridge, High-Resolution NMR Techniques in Organic Chemistry, Elsevier, 2nd edn, 2008 Search PubMed.
- B. G. Caulkins, S. A. Cervantes, J. M. Isas and A. B. Siemer, J. Phys. Chem. B, 2018, 122, 9507–9515 CrossRef CAS PubMed.
Footnote |
| † Electronic supplementary information (ESI) available: Experimental methods, data fitting and NMR spectra not shown in the main text. See DOI: https://doi.org/10.1039/d3cp06099c |
| This journal is © the Owner Societies 2024 |