 Open Access Article
A kernel-based machine learning potential and quantum vibrational state analysis of the cationic Ar hydride (Ar2H+)†
María Judit
Montes de Oca-Estévez‡
 ab,
Álvaro
Valdés
 c and
Rita
Prosmiti
 *a
*a
aInstitute of Fundamental Physics (IFF-CSIC), CSIC, Serrano 123, 28006 Madrid, Spain. E-mail: rita@iff.csic.es; Tel: +34 915616800
bAtelgraphics S.L., Mota de Cuervo 42, 28043, Madrid, Spain
cEscuela de Física, Universidad Nacional de Colombia, Sede Medellín, A. A., 3840, Medellín, Colombia
First published on 31st January 2024
Abstract
One of the most fascinating discoveries in recent years, in the cold and low pressure regions of the universe, was the detection of ArH+ and HeH+ species. The identification of such noble gas-containing molecules in space is the key to understanding noble gas chemistry. In the present work, we discuss the possibility of [Ar2H]+ existence as a potentially detectable molecule in the interstellar medium, providing new data on possible astronomical pathways and energetics of this compound. As a first step, a data-driven approach is proposed to construct a full 3D machine-learning potential energy surface (ML-PES) via the reproducing kernel Hilbert space (RKHS) method. The training and testing data sets are generated from CCSD(T)/CBS[56] computations, while a validation protocol is introduced to ensure the quality of the potential. In turn, the resulting ML-PES is employed to compute vibrational levels and molecular spectroscopic constants for the cation. In this way, the most common isotopologue in ISM, [36Ar2H]+, was characterized for the first time, while simultaneously, comparisons with previously reported values available for [40Ar2H]+ are discussed. Our present data could serve as a benchmark for future studies on this system, as well as on higher-order cationic Ar-hydrides of astrophysical interest.
The recorded presence of the simplest noble gas hydride cations, HeH+1 and ArH+,2,3 in interstellar medium (ISM) has revolutionised gas-phase ion chemistry. The closed shell structure of noble gas (Ng) atoms is responsible for these species being known to be chemically inert with a limited ability to interact with other molecular systems or atoms through extraordinarily weak van der Waals (vdW) forces. This claim is definitely true for neutral systems, however, the recent discoveries of argonium and helonium has confirmed that with the appropriate ligands, and under specific conditions of temperature and pressure, these species are capable of forming strong covalent bonds.4–9 In this way, our perception of noble gas molecules changes, expanding our knowledge about these systems and opening up new possibilities in the field of astrochemistry.
For all these reasons, it is not surprising that, in recent years, there has been a revival of interest in noble gas hydride cations [NgnHm]+ (n, m > 1) in order to employ the advances in computational quantum chemistry and experimental laboratory techniques, to help understand the chemical nature of these compounds and their evolution in the ISM. The first spectroscopic evidence for the existence of [NgnH]+ complexes dates back to 1972, when Bondybey and Pimentel10 recorded absorption bands at 905/644 and 852/607 cm−1 in the infrared spectra of inert gas-hydrogen matrix samples, corresponding to Ar–H2+/D2+ and Kr–H2+/D2+, respectively. Later studies along this line11–14 reassigned the bands to ArnH+ and ArnD+ structures without establishing the number of noble gas atoms present in the systems, and finally, Friedgen and Parnis15 through electron bombardment matrix isolation of Ng/Ng/methanol mixtures (Ng = Ar, Kr and Xe) revealed, among others features of proton-bound dimers, a peak at 903.8 cm−1 corresponding to the [Ar2H]+ complex. More recently, ArnH+ complexes have also been produced in pulsed-discharge supersonic expansions containing hydrogen and argon,16 and species with n = 3–7 have been characterized by infrared laser photodissociation spectroscopy, reporting measurements for different vibrational fundamental and combination band frequencies.
Simultaneously, [Ng2H]+ cations have been investigated theoretically, in order to understand their electronic structures and bonding.14,16–32 One of the first studies by Lundell et al.,18 analyzed the molecular properties of the proton-bound dimers using ab initio methods with both the effective core potentials and all electron basis sets. In general, the Ng2H+ (Ng = Ar, Kr, Xe) molecules were found to have a linear symmetric center D∞h geometry. Although the first calculations for the Ar2H+ predicted unequal Ar–H bonds,18 the centrosymmetric [Ar2H]+ structure was later confirmed.19 Therefore, more extensive investigations were performed on protonated rare gas homo/hetero-dimers in order to determine the spectroscopic properties and binding energies employing ab initio high level of theory methodologies.25,26
Our previous studies showed that ArH+8,9 is an inflexion point in the behaviors of the NgH+ systems. Moreover, one should also add the singularity associated with the isotopes of Ar in ISM, which makes it a very attractive objective for the investigations. The Ar atom has three stable isotopes: 36Ar, 38Ar and 40Ar. In the Earth's atmosphere, Ar constitutes 0.94% of all the elements that compose the mass of dry air, being the third most abundant element. 40Ar is the most abundant isotope with a ratio 1584 with respect to its homologues 36/38Ar (1.00/5.30).33 Notwithstanding, 36Ar is the most common isotope in the ISM (84.6%), followed by 38Ar (15.4%) and traces of 40Ar (0.025%).34
Therefore, the complex formed by the addition of a new Ar atom to the simplest argon hydride cation, is proposed as a potentially detectable candidate in the ISM. The lack of dipole moment of this protonated Ar-dimer makes it impossible to observe through rotational spectroscopy. For this reason, its presence in the universe has to be confirmed using vibrational spectroscopy, or by rotation of the excited vibrational levels. In this way, some theoretical investigations have already been carried out to determine the vibrational spectrum of this molecule, and for that, it is essential to determine an accurate global potential energy surface (PES) for the Ar2H+ system. There are few studies in which force-fields or full-PES (based on traditional fitting methods) have been generated for [Ar2H]+. Among them, the earliest PES is that constructed by Qu et al.22 from QCISD/6-311++G(3df,3pd) ab initio calculations considering up to three-body terms in the potential expansion. Subsequently, Fortenberry25 reported quartic force-fields from CCSD(T)/CBS[TQ5], core-correlation and relativistic computations, while Tan et al.28 employed a Gaussian quadrature equally-spaced grid of 3000 CCSD(T)/aug-cc-pVQZ//MP2/aug-cc-pVQZ points to build the PES. The most recent analytical 3D PES reported by Koner29 has been expressed in two-body (both short and long-range parts), and three-body terms, which have been parameterized to diatomic and triatomic CCSD(T)/aug-cc-pVQZ interaction energies, respectively, with the asymptotic behavior represented by a standard long-range expansion form for the diatomic potentials.
On the one hand, conventional fitting processes have been demonstrated that can provide high quality PESs,35–42 nevertheless, constructing such analytical representations of the PES can be a tedious and considerably time-consuming task. On the other hand, even in the case of a 3D molecular system, where high level quantum mechanical calculations are now feasible, the on-the-fly computation of the potential energy in any molecular dynamic calculations can be a computationally expensive or unaffordable task, and issues such as a balance between the computer resources available and the desired accuracy should be considered. In this sense, the development of efficient and automatic schemes has been for a long time the cornerstone in computational molecular science research. Machine learning (ML) has become a popular and promising approach43–48 due to its ability to learn patterns in data without being explicitly programmed. Thus, machine learned PESs can identify an unbiased unknown function via training with a set of known molecular structures and energies.49–52 In this way they have become valuable and powerful tools in studying various physical–chemical processes, such as the vibrational analysis of a molecule, reducing both computational cost and efforts, as they can be directly evaluated without repetition of setup steps. Currently, most ML algorithms used for the PESs construction are either kernel-based or neural network (NN)-based representations.53–58 The NN approaches are computationally efficient for multidimensional PESs, while kernel-based methods are more advantageous for small molecules, and they have become very attractive thanks to their effectiveness in describing high system nonlinear functions, even for small training sets. In particular, the RKHS approach59–62 reproduces exactly by construction all training data and at the same time captures correctly the asymptotic long-range potential interactions via appropriate kernel polynomials.63–67
Therefore, the purpose of this research is to generate a full kernel-based machine-learning potential energy surface for the [Ar2H]+ molecule, trained on high quality CCSD(T)/CBS data, which would be capable of accurate predictions of energetics and spectroscopic properties for its known isotopologues, aiming to facilitate the astrochemical detection of such noble gas compounds in new ISM regions. Here, the strategy to develop a highly accurate kernel-based ML-PES will be discussed in detail and the results obtained will be compared with those from available literature.
1 Computational methods, results and discussion
1.1 Building up kernel-based ML-PESs
Of all the different ML-approaches, we chose here the kernel-methods, which are one of the most popular options due to their successful results with small training sets. These are defined as learning algorithms based on the memory of the training data set to predict a new value as a result of a linear combination of similarity basis functions, the well-known kernel functions. There are multiple kernel functions (such as the polynomial kernel, Gaussian kernel or hyperbolic tangent kernel) whose predictive performances depend on the representation of the data. Consequently, the main goal of these ML-schemes is to accurately select the kernel function that best suits the data set.In this work, we will focus on the RKHS method proposed by Ho and Rabitz,59 which has proven to be an excellent option to generate accurate predictions of spectroscopy properties as well as in molecular dynamics applications. Furthermore, for small molecular system (species that do not exceed three atoms in their structure, such as in the case in this study) is able to reproduce smoothly all data training set in all different regions of the potential with RMSE values almost non-existent. Briefly, the full-PES form is written in matrix-form,
 | (1) |
 is the reproducing kernel function and
  represents the training data set, which are the geometries for which energies, Vi, have been determined from electronic structure calculations. The multidimensional kernel can be written as a direct product
  , with M being the dimension of the problem, and
  being the one-dimensional reproducing kernels for each one. The triatomic system under study is described by Jacobi coordinates (r,R,θ), where r is the ArH+ bond length, R is the intermolecular distance of the Ar atom from the center of mass of the diatom, and θ is the angle between the r and R vectors. In this way, eqn (1) takes the following form:
 | (2) |
 , qn,m2 and q3 being the one-dimensional kernel functions for the diatom distance-like (r), the Ar-diatom distance-like (R), and angle-like (θ) variables, respectively. In the above equation, the reduced coordinate is z = cosθ, whereas, Nr, NR and Nθ are the number of ab initio calculated points in each coordinate. The reproducing distance-like kernel functions q1 and q2 are represented by the same form,
 | (3) |
 . The n and m superscripts refer to the order of smoothness of the function and its asymptotic behavior at large distances, with n = 2, and m = 3 accounting for the R−4 leading dispersion interaction between the Ar atom and ArH+ molecular ion. B is the beta function, 2F1 is the Gauss hyper-geometric function, and Pll is the Legendre polynomials with ll = 0–18.
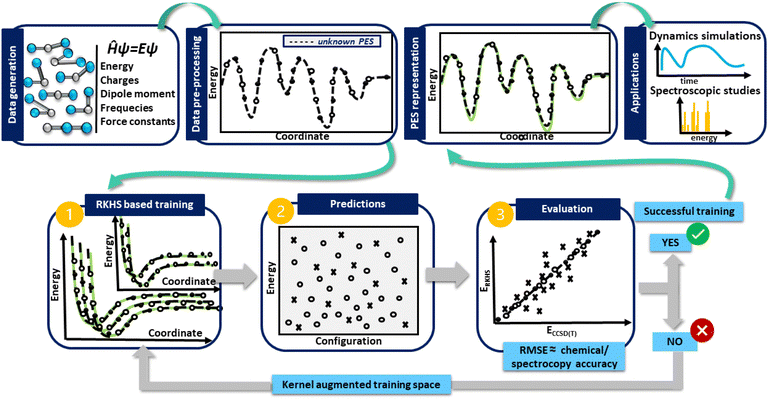
In turn, in Fig. 1 a general flowchart is displayed summarizing the main steps in constructing kernel-based ML PESs:
• Data generation: this first step is the most crucial in the construction of an accurate PES, as the sampling of the data should be representative of the entire configuration space, especially those in physically important regions, and benchmarking the performance of ab initio methods, as well as computational resources should be adequately evaluated.
• Data preprocessing: this step consists of organizing the data and removing possible errors or inconsistencies, which may be present, allowing the extraction of meaningful information.
• Data preparation: at this stage the generated data are split into two subsets for training and testing. During the training, the kernel functions interpolate the training reference/ab initio set of data, reproducing them with excellent accuracy, while in the testing, the prediction of the trained model is estimated, and its under- or over-estimation error is evaluated. If the error obtained is greater than the established limited, then the kernel space training must be increased until successful results are obtained.
• PES model evaluation and production: at this point, the test set becomes important, as its data allow the performance of the model to be estimated. As a measure of its overall accuracy, it is common to compute the root-mean-square errors (RMSE) of the test data set. Once the evaluation/testing stage is completed, the ML-PES is able to make accurate predictions and then, it is ready to be used for some production task in a variety of molecular dynamics and/or spectroscopic studies.
Next, we address in detail each of these steps followed in the present PES construction.
1.2 Data generation and preprocessing: assessing electronic structure calculations
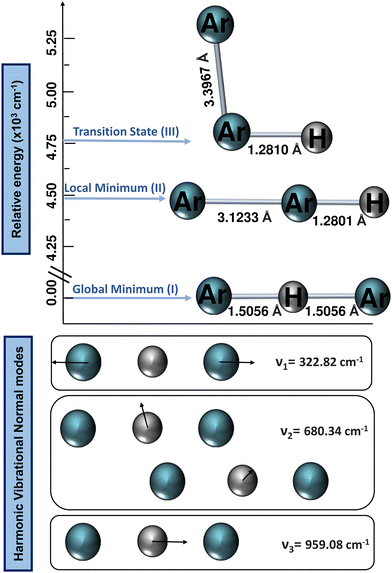
All ab initio electronic structure calculations were performed with the MOLPRO 2022 program,68 while the DENEB software package69 was employed to generate and organize all input and output data files, respectively.The harmonic vibrational frequencies for the 40Ar–H+–40Ar structure from the CCSD(T)/AV6Z computations are shown in Fig. 2, with the cation possessing four vibrational degrees of freedom: the symmetric Ar–H+ stretching (v1) at 322.82 cm−1, which is also known as the intermolecular Ar⋯Ar stretch, the degenerate proton (H+) bending (v2) at 680.34 cm−1, and the asymmetric Ar–H+ stretching (v3) at 959.08 cm−1, which is also known as the shared-proton stretching. The calculated harmonic zero-point-energy (ZPE) value is 1321.29 cm−1, with the harmonic vibrational frequencies being in line with the values reported in previous QCISD/6-311++G(3df,3pd), MP2/AVQZ, CCSD(T)/AVQZ, and CCSD(T)/AV5Z studies,22,25,26,29 as well as their corresponding intensities, with that of the shared-proton stretching mode presenting a high value of 4894 km mol−1 compared to the v2 mode of 46.3 km mol−1, indicating the presence of this v3 bright mode in the IR spectra.
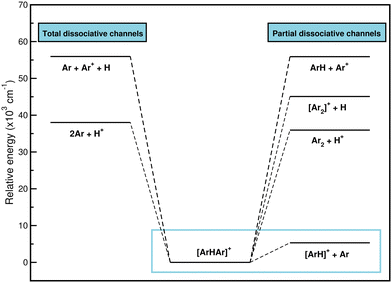
![[thin space (1/6-em)]](https://www.rsc.org/images/entities/char_2009.gif) 951 cm−1, while the CCSD(T)/AV6Z dissociation energies for the following channels are 38
951 cm−1, while the CCSD(T)/AV6Z dissociation energies for the following channels are 38![[thin space (1/6-em)]](https://www.rsc.org/images/entities/char_2009.gif) 012, 45
012, 45![[thin space (1/6-em)]](https://www.rsc.org/images/entities/char_2009.gif) 073, 55
073, 55![[thin space (1/6-em)]](https://www.rsc.org/images/entities/char_2009.gif) 900, and 55
900, and 55![[thin space (1/6-em)]](https://www.rsc.org/images/entities/char_2009.gif) 940 cm−1, respectively. Therefore, given that the most likely way for [Ar2H]+ to dissociate, and to do so by a wide margin, is to form ArH+ and an Ar atom, it seems likely that [Ar2H]+ is a precursor to the formation of ArH+. For that reason, the study of the interaction will focus on the dissociation of the system to the lowest [ArH]+ + Ar channel.
940 cm−1, respectively. Therefore, given that the most likely way for [Ar2H]+ to dissociate, and to do so by a wide margin, is to form ArH+ and an Ar atom, it seems likely that [Ar2H]+ is a precursor to the formation of ArH+. For that reason, the study of the interaction will focus on the dissociation of the system to the lowest [ArH]+ + Ar channel.
In Table 1 we list the stepwise formation energies as the Ar atoms are bound around the proton, and one can compare the presented results to those previously reported.22,25,26,29 The binding of the first Ar to H+ produces a strong bound dimer, while the interaction is much weaker when the second Ar is bound to the ArH+, as evident from the calculated first- and second-step formation energies in Table 1. The overall formation energy at T = 0 K for the [Ar2H]+ is calculated by summing the stepwise formation energies, with the contribution of the first-step dictating the overall behavior. By comparing with previously reported data, the differences found are clearly due to the different methods and basis sets employed, such as the data of ref. 22 and 26, respectively. In the case of the reported values in ref. 25 and 29 the energy differences of ≈2 kcal mol−1 come from the fact that the CCSD(T) and CCSD(T)/AV5Z calculations have been carried out without including the basis set superposition error (BSSE) correction. One can see that even when large basis sets were used the BSSE is still important, as it could lead to an overestimation of the binding in molecular systems.
| First-step | Second-step | Overall formation | |
|---|---|---|---|
| Ar(g) + H+(g) → [ArH]+(g) | [ArH]+(g) + Ar(g) → [Ar2H]+(g) | 2Ar(g) + H+(g) → [Ar2H]+(g) | |
| QCISD/6-311++G(3df,3pd)22 | −96.01 | −14.30 | −110.13 |
| MP2/AVQZ26 | −91.86 | −15.66 | −107.52 |
| CCSD(T)/AVQZ29 | −93.96 | −15.56 | −109.52 |
| CCSD(T)/AV5Z25 | −94.10 | −16.60 | −110.70 |
| CCSD(T)/AV5Z | −92.94 | −15.46 | −108.40 |
| CCSD(T)/AV6Z | −93.28 | −15.31 | −108.59 |
| CCSD(T)/CBS[56] | −93.57 | −15.14 | −108.71 |
![[thin space (1/6-em)]](https://www.rsc.org/images/entities/char_2009.gif) 340 energies were computed at a grid of the intermolecular r and R distances ranging from 0.8 to 2.3 Å and 1.8 to 8.0 Å, respectively, and for θ angles between 0–180°, using the correlation-consistent basis sets,73–75 such as AVQZ, AV5Z and AV6Z. The criterion for the selection of the AVnZ, n = Q-6, basis sets in this study is based on the analysis reported in our previous work.8 The impact of the BSSE is also evaluated, through the counterpoise correction (CP),76 as
340 energies were computed at a grid of the intermolecular r and R distances ranging from 0.8 to 2.3 Å and 1.8 to 8.0 Å, respectively, and for θ angles between 0–180°, using the correlation-consistent basis sets,73–75 such as AVQZ, AV5Z and AV6Z. The criterion for the selection of the AVnZ, n = Q-6, basis sets in this study is based on the analysis reported in our previous work.8 The impact of the BSSE is also evaluated, through the counterpoise correction (CP),76 as  , where
  and
and  are the energies of [ArH]+ and Ar using the [Ar2H]+ basis functions, while
  and
and  are the energies of [ArH]+ and Ar, respectively. We also performed extrapolation of the correlation energies utilizing the two-point single inverse power function first introduced by Schwartz77
 , with n = 5 and 6, in order to obtain the energy at the complete basis set (CBS) limit.
Fig. S1 (see the ESI†) shows representative plots of the total energy of [Ar2H]+ as a function of R and θ, while in Fig. S2 (ESI†) one can see the BSSE corrections to the energy as a function of the ab initio method, MP2, CSSD(T) and CCSD(T)-F12, and the cardinal number n of the AVnZ basis sets. In both figures the estimates of the corresponding CBS[56] extrapolation are also displayed. As expected, the CCSD(T) total energies are lower than those obtained from the MP2 calculations, the increment of the basis set produces a further lowering in the total energy and a decrease in BSSE, being the extrapolation to the CBS limit the one that reduces it almost to zero. The case of the CCSD(T)-F12 calculations should be highlighted, where the BSSE error is significantly reduced. On the basis of such evaluation tests, the CCSD(T)/CBS[56] level of theory has been chosen for the generation of the reference data sets in this study, with the reference structures sampled in a 3D (r,R,θ) grid.
1.3 Representation of the RKHS ML-PES model: training, validation and testing
In order to assess the quality of the results obtained with the ML-potential, an action protocol was introduced to validate the RKHS-based ML-PES. This consists of three clearly differentiated stages.1. Analysis of the resulting learning model potential at the same sets of points involved in the training procedure was carried out to ensure the reproducibility of the results obtained.
2. Production of new potential values outside the range of the input points (validation/testing data sets).
3. Monitoring regression diagnostics, such as a root mean square error (RMSE) threshold criterion with respect to the testing datasets should be fulfilled, otherwise more training data should be added.
![[thin space (1/6-em)]](https://www.rsc.org/images/entities/char_2009.gif) 680 CCSD(T)/CBS[56] ab initio points in the training procedure. The latter are equally distributed in a 16-points grid in the r coordinate ranging between 0.8 and 2.3 Å, a 45-points grid in the internuclear distance R from 1.8 to 8.0 Å, and a 19-points grid in the angle θ coordinate between 0 and 180°. We employed twelve sets of training data with 1200/1254, 2280, 2700/2736, 3200/3344, 5130, 6080, 7200/7296 and 13
680 CCSD(T)/CBS[56] ab initio points in the training procedure. The latter are equally distributed in a 16-points grid in the r coordinate ranging between 0.8 and 2.3 Å, a 45-points grid in the internuclear distance R from 1.8 to 8.0 Å, and a 19-points grid in the angle θ coordinate between 0 and 180°. We employed twelve sets of training data with 1200/1254, 2280, 2700/2736, 3200/3344, 5130, 6080, 7200/7296 and 13![[thin space (1/6-em)]](https://www.rsc.org/images/entities/char_2009.gif) 680 points by choosing with different step sizes corresponding to 6 or 16, 11, 20, 24 or 45, and 10 or 19 in the r, R and θ coordinates, respectively, with all of them covering the same coordinate and energy ranges. In this manner, Fig. 4 depicts histograms of these data sets, showing similar distributions of energies.
680 points by choosing with different step sizes corresponding to 6 or 16, 11, 20, 24 or 45, and 10 or 19 in the r, R and θ coordinates, respectively, with all of them covering the same coordinate and energy ranges. In this manner, Fig. 4 depicts histograms of these data sets, showing similar distributions of energies.
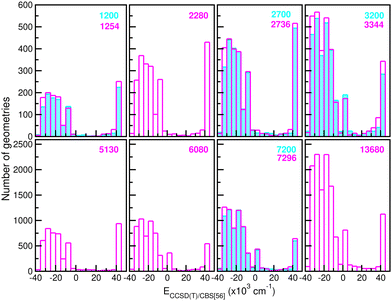 | ||
| Fig. 4 Histograms of different size (see the number given in the top right of each panel) training data sets employed in building up the RKHS ML-PES models. | ||
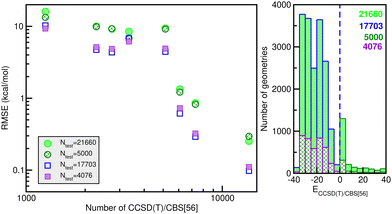
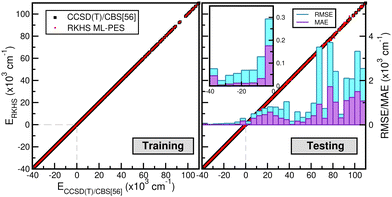
Likewise, 21![[thin space (1/6-em)]](https://www.rsc.org/images/entities/char_2009.gif) 660 additional configurations and CBS/[56] energy data were also generated (see their energy distribution in the right panel of Fig. 5), for the potential evaluation in the testing stage in order to ensure its quality, as we will discuss next.
660 additional configurations and CBS/[56] energy data were also generated (see their energy distribution in the right panel of Fig. 5), for the potential evaluation in the testing stage in order to ensure its quality, as we will discuss next.
![[thin space (1/6-em)]](https://www.rsc.org/images/entities/char_2009.gif) 660 testing sets. Thus, one can see the quality of the RKHS PES as a function of the size of the training data with 1200/1254, 2280, 2700/2736, 3200/3344, 5130, 6080, 7200/7296 and 13
660 testing sets. Thus, one can see the quality of the RKHS PES as a function of the size of the training data with 1200/1254, 2280, 2700/2736, 3200/3344, 5130, 6080, 7200/7296 and 13![[thin space (1/6-em)]](https://www.rsc.org/images/entities/char_2009.gif) 680 points, shown in Fig. 4. As the size of the dataset increases, the RMSE values are decreasing. We also observed a large sensitivity on the RMSE values with respect to the sampling in the θ coordinate. In particular, we found that the RKHS PES models trained on the 1200 (6 × 20 × 10), 2700 (6 × 45 × 10), 3200 (16 × 20 × 10) and 7200 (16 × 45 × 10) datasets show much higher RMSE values (ranging between 60–130 kcal mol−1) compared to those obtained from the 1254 (6 × 11 × 19), 2736 (6 × 24 × 19), 3344 (16 × 11 × 19) and 7296 (16 × 24 × 19) ones (in the 0.1–10 kcal mol−1 range). The calculated RMSE values for all RKHS ML-PES models with respect to the total 21
680 points, shown in Fig. 4. As the size of the dataset increases, the RMSE values are decreasing. We also observed a large sensitivity on the RMSE values with respect to the sampling in the θ coordinate. In particular, we found that the RKHS PES models trained on the 1200 (6 × 20 × 10), 2700 (6 × 45 × 10), 3200 (16 × 20 × 10) and 7200 (16 × 45 × 10) datasets show much higher RMSE values (ranging between 60–130 kcal mol−1) compared to those obtained from the 1254 (6 × 11 × 19), 2736 (6 × 24 × 19), 3344 (16 × 11 × 19) and 7296 (16 × 24 × 19) ones (in the 0.1–10 kcal mol−1 range). The calculated RMSE values for all RKHS ML-PES models with respect to the total 21![[thin space (1/6-em)]](https://www.rsc.org/images/entities/char_2009.gif) 660 test data, 17
660 test data, 17![[thin space (1/6-em)]](https://www.rsc.org/images/entities/char_2009.gif) 703 datasets with energies below the dissociation threshold, and the two corresponding 5000/4076-randomly chosen testing sets show the same behaviour.
703 datasets with energies below the dissociation threshold, and the two corresponding 5000/4076-randomly chosen testing sets show the same behaviour.
The correlation plots shown in Fig. 6 demonstrate the performance of the chosen RKHS ML-PES model compared to the 13![[thin space (1/6-em)]](https://www.rsc.org/images/entities/char_2009.gif) 680 training and 21
680 training and 21![[thin space (1/6-em)]](https://www.rsc.org/images/entities/char_2009.gif) 660 testing data, in both attractive and repulsive regions of the potential. The RMSE values are also displayed as a function of energy ranges (see the right panel of Fig. 6). One can see that the RMSE values outside the training zone are 0.098 kcal mol−1 up to dissociation energies over 17
660 testing data, in both attractive and repulsive regions of the potential. The RMSE values are also displayed as a function of energy ranges (see the right panel of Fig. 6). One can see that the RMSE values outside the training zone are 0.098 kcal mol−1 up to dissociation energies over 17![[thin space (1/6-em)]](https://www.rsc.org/images/entities/char_2009.gif) 703 configurations (see also the left panel of Fig. 5), and a total mean absolute error (MAE) lower than 0.001% over 21
703 configurations (see also the left panel of Fig. 5), and a total mean absolute error (MAE) lower than 0.001% over 21![[thin space (1/6-em)]](https://www.rsc.org/images/entities/char_2009.gif) 660 configurations and up to energies of 100 kcal mol−1 above dissociation.
660 configurations and up to energies of 100 kcal mol−1 above dissociation.
By analysing the overall quality of the RKHS ML-PES, it is observed that the number of training data required for the construction of the ML-PES is lower than or close to those used in other previous studies, such as in ref. 22 and 29. In the first PES,22 7400 ab initio energies were required in the fitting procedure with an RMSE of 0.143 kcal mol−1, while for the parameterization of the other PES,29 in total 13![[thin space (1/6-em)]](https://www.rsc.org/images/entities/char_2009.gif) 940 ab initio energies have been used, and a RMSE of 0.057 kcal mol−1 has been reported. These differences are logical, since a greater number of points allows us to obtain a priori a better approximation of the values. Nevertheless, it is observed that despite the fact that almost the same number of points has been used for the design of the PES of ref. 22 and ours here, the RMSE of 0.00012 kcal mol−1 found in the present RKHS ML-PES is significantly lower for the training set data. This is undoubtedly due to the use of a learning process based on kernel methods that significantly reduces the number of data needed to develop a high-accuracy PES, instead of an analytical potential, as demonstrated in other recently published works.
940 ab initio energies have been used, and a RMSE of 0.057 kcal mol−1 has been reported. These differences are logical, since a greater number of points allows us to obtain a priori a better approximation of the values. Nevertheless, it is observed that despite the fact that almost the same number of points has been used for the design of the PES of ref. 22 and ours here, the RMSE of 0.00012 kcal mol−1 found in the present RKHS ML-PES is significantly lower for the training set data. This is undoubtedly due to the use of a learning process based on kernel methods that significantly reduces the number of data needed to develop a high-accuracy PES, instead of an analytical potential, as demonstrated in other recently published works.
In this way, Fig. 7 displays comparisons of the present RKHS scheme in different regions of the [Ar2H+] potential as a function of the R coordinate for given θ angle values and selected r distances. The upper panels show the RKHS ML potential curves at r = 1.2801 and 1.5056 Å, corresponding to the equilibrium bond length of the ArH+ and [ArH+Ar] cations. These configurations form part of the testing data set, while the RKHS potential curves shown in the middle and lower panels of Fig. 7 correspond to configuration and energies with r values in the training range of the CCSD(T)/CBS[56] ab initio data. In this way, one can see that the RKHS ML-PES describes smoothly the ab initio data for all angular orientations of the system for all cases analyzed.
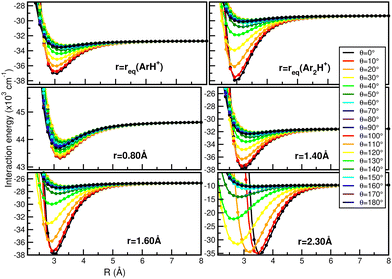 | ||
| Fig. 7 Comparison of the RKHS ML-PES energies (solid lines) with the CCSD(T)/CBS[56] reference values (circle symbols) as a function of R distance at the indicated θ and r values. | ||
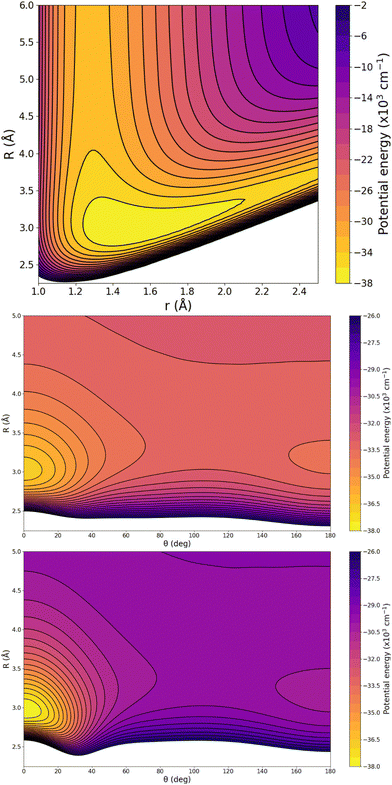
In turn, particular characteristics of the full 3D RKHS ML-potential for the [Ar2H]+ cation were also analyzed. Thus, in order to further check the smoothness of the PES, we present two-dimensional contour plots, as an excellent tool to visualize three-dimensional data in an easy and intuitive way. Therefore, Fig. 8 shows few representative contour plots of the RKHS ML-potential in the (r, R)-plane for linear configurations, and (θ, R)-plane, with r fixed at the equilibrium distances of the ArH+ and ArH+ Ar systems.
One can see that the global minimum corresponds to the linear [Ar–H–Ar]+ configuration with a well-depth equal to 38011.37 cm−1 (108.68 kcal mol−1) for the ML-PES, located at R = 2.974 Å and r = 1.5058 Å. The difference between ab initio calculations and our algorithm are 0.03 cm−1, almost negligible, indicating that the kernel-based model describes smoothly this region of the [Ar2H]+ PES. The second PES's minimum coincides with the antilinear configuration of the complex, [Ar–Ar–H]+, with R = 3.20 Å and an energy of −30![[thin space (1/6-em)]](https://www.rsc.org/images/entities/char_2009.gif) 022.97 cm−1 (−85.84 kcal mol−1). Like its predecessor, there is an excellent correlation between the values obtained with the ML-potential and the ab initio data for such asymmetric linear configurations. The potential barrier between the global and local potential minima corresponds to the T-shaped configuration at R = 3.40 Å with an energy of −29
022.97 cm−1 (−85.84 kcal mol−1). Like its predecessor, there is an excellent correlation between the values obtained with the ML-potential and the ab initio data for such asymmetric linear configurations. The potential barrier between the global and local potential minima corresponds to the T-shaped configuration at R = 3.40 Å with an energy of −29![[thin space (1/6-em)]](https://www.rsc.org/images/entities/char_2009.gif) 753.66 cm−1 (−85.07 kcal mol−1). Such double-minimum topological aspects of the Ar2H+ ML PES are shown in Fig. 8.
753.66 cm−1 (−85.07 kcal mol−1). Such double-minimum topological aspects of the Ar2H+ ML PES are shown in Fig. 8.
1.4 Bound state calculations: quantum effects on vibrations
In turn, once the quality of the RKHS ML potential is evaluated, we then employed it, by direct potential function implementation at any molecular configuration, to compute vibrational bound states, aiming to investigate the effect of the potential shape on the vibrations and facilitate spectroscopic data for different isotopic species. Bound state calculations were carried out using the DVR3D program78 by solving the nuclear time-independent Schrödinger equation with an exact kinetic energy operator. We used the Jacobi (r,R,θ) coordinates to represent the Hamiltonian matrix in a 3D discrete variable representation (DVR) grid of points. A Morse-like oscillator basis set was used for the radial r and R coordinates and Gauss-associated Legendre functions for the angular coordinate, θ. The parameters of the radial basis set were optimized to ensure convergence of the lowest twenty J = 0 energy levels, and as a result the optimal set of De, re and ωe Morse parameters were 0.021/0.0016 a.u., 3.45/6.06 a.u. and 0.012/0.00075 a.u. for the r/R grid. Given the importance of different isotopes, due to their abundance in ISM, and thus their potential detection in a variety of astrophysical environments, we decided to consider the 36Ar and 40Ar isotopologues for the spectroscopy analysis. With that purpose and taking into account that the electronic structure of the different isotopes of the [Ar2H]+ system is the same, only modifications in the kinetic energy operator involving the mass of Ar and reduced mass of the ArH+ diatom, , where mAr = 35.967545105/39.9623831225 and mH = 1.00782503207 a.u. are the nuclear/atomic masses of 36/40Ar, and H isotopes,79 respectively, were used. For the evaluation of integrals, 55/55-point Gauss-Laguerre and 60-point Gauss-Legendre quadratures between 0 and 180° were used, for radial and angular coordinates, respectively, with the range of quadrature points in r and R coordinates being 2.07–4.49 a.u., and 4.72–7.07 a.u, respectively.
In this way, the J = 0 energy levels calculated with the present Ar2H+ ML-PES are listed in Table S1 (see the ESI†) for the 36Ar/40Ar isotopes. One can see that the quantum effects on the vibrational bound states for the two isotopologues of Ar are subtle. The anharmonic ground state energies are found at 1367.0 and 1356.6 cm−1 above the global minimum of the PES corresponding to the anharmonic ZPEs of the 36Ar2H+ and 40Ar2H+, respectively. By comparing with the computed harmonic ZPE of 1321.3 cm−1 for the 40Ar2H+, one can see that there is a positive anharmonicity counting of 35.3 cm−1, that we will discuss later on each vibrational mode. The anharmonic ZPE of 1376.2 cm−1 has been previously reported on a CCSD(T)/AVQZ parameterized PES29 for 40Ar2H+, which is within 19.6 cm−1 of the present value. Moreover, the ZPE values of 1400 and 1391.3 cm−1 for 36Ar2H and 40Ar2H, respectively, were obtained from a combined CCSD(T)/AV5Z and quartic force field analysis,25 which are in accord with the present ones within 34.7 cm−1 in the 40Ar2H+ case.
In Fig. 9 the calculated bound vibrational energies are plotted together with the minimum energy path of the CCSD(T)/CBS[56] RKHS ML-PES along the θ coordinate by optimizing both r and R radial coordinates, while Fig. 10 displays radial and angular probability distribution plots for a few selected states. By analyzing the nodal structure of the probability density functions for each calculated state, one can extract the corresponding assignment, and thus states have been assigned according to the v1, v2 and v3 vibrational quantum numbers.
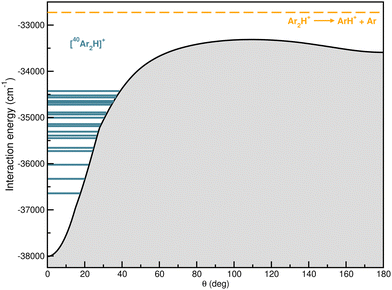 | ||
| Fig. 9 Minimum energy path for RKHS ML-PES together with the 20 lowest J = 0 vibrational states for the [40Ar2H]+ isotope. | ||
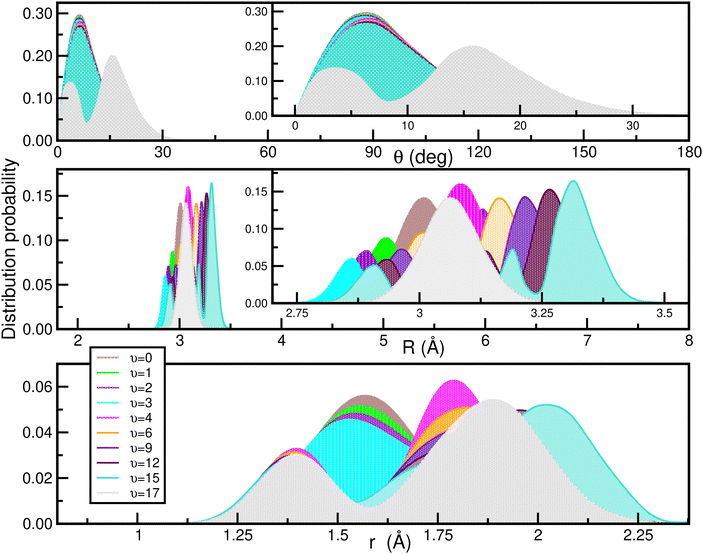 | ||
| Fig. 10 Angular (upper panel) and radial (middle and lower) density distributions of the indicated vibrational states of the [40Ar2H]+ isotope. | ||
Likewise, the vibrational bands (in cm−1) for the [40ArH]+ are collected in Table 2, and their values are compared with recent theoretical calculations,25,26,28,29 as well as experimental data from gas phase infrared photodissociation spectra (IRPD),16 and matrix infrared spectral measurements in Ar/H2 mixtures10 and doped noble-gas matrices14,15 available in the literature. One can actually see that experimental measurements are available for the fundamental asymmetric stretching, v3, frequency in gas-phase and matrix environments,10,14–16 with the gas-phase value of 989 cm−1 being higher than those of 905, 903.8 and 903 cm−1 in the Ar-matrix. Our prediction at 977.0 cm−1 is within 12 cm−1 from the gas-phase experimental value for the Ar2H+. Next, the fundamental symmetric stretching, v1, frequency for Ar2H+ is calculated at 290.7 cm−1 in close accord to previously computational reported estimates,25,28,29 while the fundamental v2 bending frequency, obtained from J = 1 DVR3D calculations, is 651.2 cm−1, within 3–20 cm−1 from the previously calculated values of 660.5, 670 and 648 cm−1 given in ref. 25, 28, and 29 (see Table 2).
| ν | ν 1,ν2,ν3 | This work | Theoryabcd | Expt.ef |
|---|---|---|---|---|
| a Ref. 29. b Ref. 28. c Ref. 26. d Ref. 25. e Ref. 16. f Ref. 10, 14 and 15. | ||||
| 1 | 1,0,0 | 290.7 | 291.8/292/—/271.4 | —/— |
| 2 | 2,0,0 | 580.7 | 579.6/—/—/— | —/— |
| — | 0,11,0 | 651.2 | 660.5/670/—/648 | —/— |
| 3 | 3,0,0 | 866.2 | 862.5/—/—/— | —/— |
| 4 | 0,0,1 | 977.0 | 994.3/986/1000/1094.7 | 989/905,903,903.8 |
| 6 | 1,0,1 | 1238.7 | 1246.8/1237/1253/— | 1237/— |
| 9 | 2,0,1 | 1492.2 | 1493.3/1484/1500/— | 1485/— |
| 12 | 3,0,1 | 1732.1 | 1732.8/1730/1750/— | 1726/— |
| 15 | 4,0,1 | 1958.8 | 1964.8/1989/—/— | 2041/— |
| 17 | 0,1,1 | 2094.6 | 2133.3/2136/—/— | 2124/— |
Also, we should point out that by comparing with the normal harmonic mode frequencies we found that they differ by 20 and 30 cm−1 approximately (see Fig. 2), suggesting that the anharmonic effects in this complex are considerable. In addition, comparisons of the predicted nν1 +ν3 combination bands (with n = 1–4) with those experimental measurements reported16 from IR photodissociation spectroscopy for the [Ar3H]+ are also shown in Table 2. We can observe that they are in reasonable accord, within an error less than 7 cm−1, except for the 4ν1 + ν3 with a difference of around 80 cm−1 (see Table 2). All these results seem to indicate that the ML-PES constructed in this work makes a realistic prediction for the [Ar2H]+ complex. Moreover, as previously suggested,16,23,80 this finding could also indicate that this system is the core for more large argon hydrides, [ArnH]+, and cations.
2 Summary and conclusions
This work was motivated by the previous knowledge that theoretical quantum chemistry treatments could provide useful spectroscopic data for the detection of new molecules in the laboratory experiments or even in the ISM. Nowadays, the use of quantum chemistry calculations in astrochemical detection has become standard for species that have not even been synthesized in the laboratory, and high-quality data is in demand. Naturally-occurring noble gas molecules are part of such compounds, and will be likely dominated by Ar. Furthermore, advances within the field of machine learning provide higher-level, more flexible and adaptive approaches compared to traditional methods for PESs construction, making it a powerful tool within theoretical chemistry.Thus, the present study focused on the quantum chemical, spectroscopic analysis of the [Ar2H]+ molecule, that was previously shown to present at least a stable minimum on its potential surface, although for such species spectroscopic data are scarce/limited or still have no available date especially those determined from fully coupled computations. The [Ar2H]+, in terms of structure, is the simplest form of a protonated cluster, and at first glance, this triatomic system is small enough for constructing a full-dimensional potential surface. Due to its high symmetry, conventional theoretical techniques could be used for its fundamental vibrational analysis, although for higher vibrational transitions significant vibrational coupling is present requiring fully coupled treatments. Therefore, here we evaluated the performance of different high-level ab initio electronic structure methods, and interactions energies from CCSD(T)/CSB[56] calculations at a broad grid of intermolecular R distances and the whole range of angular configurations are obtained. These energies were divided into training and testing data for the construction of a 3D ML-PES based on a RKHS scheme. To ensure the robustness of the ML-algorithm used, a potential validation protocol was developed, obtaining a low RMSE value with respect the ab initio energies. The RKHS ML PES was found to describe the main aspects of the underlying interactions, and was then used to perform bound state calculations for determining quantum anharmonic effects. Vibrational states were computed and vibrational bands were appropriately assigned to specific quantum excitations. The corresponding transition frequencies for both fundamentals and few overtone progressions were found to compare well with the available experimental data in the literature.
Consequently, this work treats accuracy issues in developing potential interaction ML models that can then provide useful data for the spectral characterization of such proton-bound Ng-containing complexes, and will enhance and/or assist further laboratory, modelling and interstellar studies for detecting such natural Ng molecules in the ISM.
Data availability
The data that support the findings of this study are available within the article and its ESI,† as well as from the authors upon reasonable request.Author contributions
The authors confirm contributions to the paper as follows: M. J. MOE (data curation, formal analysis, investigation, methodology, validation, writing – original draft preparation), A. V. (data curation, formal analysis, investigation, writing – review and editing), R. P. (funding acquisition, project administration, conceptualization, formal analysis, investigation, methodology, validation, writing – review and editing).Conflicts of interest
There are no conflicts to declare.Acknowledgements
We would like to thank Raúl Rodríguez-Segundo and José A. Torres for useful discussions on the DENEB software. The authors thank the “Centro de Cálculo del IFF-CSIC and SGAI-CSIC” and CESGA-Supercomputing centre for the allocation of computer time. This work has been supported by the Comunidad de Madrid grant ref: IND2018/TIC-9467, the MCIN grant no. PID2020-114654GB-I00, the Universidad Nacional de Colombia Hermes code: 57565, and the COST Actions CA18212(MD-GAS) and CA21101(COSY).Notes and references
- R. Güsten, H. Wiesemeyer, D. Neufeld, K. Menten, U. Graf, K. Jacobs, B. Klein, O. Ricken, C. Risacher and J. Stutzki, Nature, 2019, 568, 357–359 CrossRef PubMed.
- M. Barlow, B. Swinyard, P. Owen, J. Cernicharo, H. Gomez, R. Ivison, O. Krause, T. Lim, M. Matsuura, S. Miller, G. Olofsson and E. Polehampton, Science, 2013, 342, 1343–1345 CrossRef CAS PubMed.
- H. Müller, S. Muller, P. Schilke, E. Bergin, J. Black, M. Gerin, D. Lis, D. Neufeld and S. Suri, Astron. Astrophys., 2015, 582, L4 CrossRef.
- F. Pauzat and Y. Ellinger, Planet. Space Sci., 2005, 53, 1389–1399 CrossRef CAS.
- F. Pauzat and Y. Ellinger, J. Chem. Phys., 2007, 127, 014308 CrossRef CAS PubMed.
- F. Pauzat, Y. Ellinger, J. Pilmé and O. Mousis, J. Chem. Phys., 2009, 130, 174313 CrossRef CAS PubMed.
- F. Pauzat, Y. Ellinger, O. Mousis, M. Ali-Dib and O. Ozgurel, Astrophys. J., 2013, 777, 29 CrossRef.
- M. Montes de Oca-Estévez and R. Prosmiti, Front. Chem., 2021, 9, 187 Search PubMed.
- M. Montes de Oca-Estévez and R. Prosmiti, J. Mol. Graphics Modell., 2023, 124, 108562 CrossRef PubMed.
- V. E. Bondybey and G. C. Pimentel, J. Chem. Phys., 1972, 56, 3832–3836 CrossRef CAS.
- D. E. Milligan and M. E. Jacox, J. Mol. Spectrosc., 1973, 46, 460–469 CrossRef CAS.
- C. A. Wight, B. S. Ault and L. Andrews, J. Chem. Phys., 1976, 65, 1244–1249 CrossRef CAS.
- H. Kunttu, J. Seetula, M. Räsänen and V. A. Apkarian, J. Chem. Phys., 1992, 96, 5630–5635 CrossRef CAS.
- H. M. Kunttu and J. A. Seetula, Chem. Phys., 1994, 189, 273–292 CrossRef CAS.
- T. D. Fridgen and J. M. Parnis, J. Chem. Phys., 1998, 109, 2155–2161 CrossRef CAS.
- D. C. McDonald, D. T. Mauney, D. Leicht, J. H. Marks, J. A. Tan, J.-L. Kuo and M. A. Duncan, J. Chem. Phys., 2016, 145, 231101 CrossRef PubMed.
- G. Hvistendahl, O. W. Saastad and E. Uggerud, Int. J. Mass Spectrom., 1990, 98, 167–177 CrossRef CAS.
- J. Lundell and H. Kunttu, J. Phys. Chem., 1992, 96, 9774–9781 CrossRef CAS.
- J. Nieminen and E. Kauppi, Chem. Phys. Lett., 1994, 217, 31–35 CrossRef CAS.
- J. Lundell, J. Mol. Struct., 1995, 355, 291–297 CrossRef CAS.
- T. D. Fridgen and J. M. Parnis, J. Chem. Phys., 1998, 109, 2162–2168 CrossRef CAS.
- J. Y. Qu, W. Li, R. Guo and X. S. Zhao, J. Chem. Phys., 2002, 117, 2592–2598 CrossRef CAS.
- K. T. Giju, S. Roszak and J. Leszczynski, J. Chem. Phys., 2002, 117, 4803–4809 CrossRef CAS.
- S. J. Grabowski, J. M. Ugalde, D. M. Andrada and G. Frenking, Eur. J. Chem., 2016, 22, 11317–11328 CrossRef CAS PubMed.
- R. C. Fortenberry, ACS Earth Space Chem., 2017, 1, 60–69 CrossRef CAS.
- J. A. Tan and J.-L. Kuo, J. Chem. Phys., 2019, 150, 124305 CrossRef PubMed.
- R. M. García-Vázquez, M. Márquez-Mijares, J. Rubayo-Soneira and O. Denis-Alpizar, Astron. Astrophys., 2019, 631, A86 CrossRef.
- J. A. Tan and J.-L. Kuo, J. Phys. Chem. A, 2020, 124, 7726–7734 CrossRef CAS PubMed.
- D. Koner, J. Chem. Phys., 2021, 154, 054303 CrossRef CAS PubMed.
- F. Grandinetti, Front. Chem., 2020, 8, 462 CrossRef CAS PubMed.
- S. Borocci, F. Grandinetti and N. Sanna, Molecules, 2021, 26, 1305 CrossRef CAS PubMed.
- M. Montes de Oca-Estévez, B. Darna, B. García-Ruíz, R. Prosmiti, T. González-Lezana and D. Koner, ChemPhysChem, 2023, 24, e202300450 CrossRef PubMed.
- J.-Y. Lee, K. Marti, J. P. Severinghaus, K. Kawamura, H.-S. Yoo, J. B. Lee and J. S. Kim, Geochim. Cosmochim. Acta, 2006, 70, 4507–4512 CrossRef CAS.
- R. Wieler, Rev. Mineral. Geochem., 2002, 47, 21–70 CrossRef CAS.
- O. L. Polyansky, R. Prosmiti, W. Klopper and J. Tennyson, Mol. Phys., 2000, 98, 261–273 CrossRef CAS.
- R. Prosmiti, A. Buchachenko, P. Villarreal and G. Delgado-Barrio, Theor. Chem. Acc., 2001, 106, 426–433 Search PubMed.
- X. Huang, B. J. Braams, J. M. Bowman, R. E. A. Kelly, J. Tennyson, G. C. Groenenboom and A. van der Avoird, J. Chem. Phys., 2008, 128, 034312 CrossRef CAS PubMed.
- B. J. Braams and J. M. Bowman, Int. Rev. Phys. Chem., 2009, 28, 577–606 Search PubMed.
- A. Aguado, P. Barragán, R. Prosmiti, G. Delgado-Barrio, P. Villarreal and O. Roncero, J. Chem. Phys., 2010, 133, 024306 CrossRef CAS PubMed.
- P. Barragán, R. Prosmiti, Y. Wang and J. Bowman, J. Chem. Phys., 2012, 136, 224302 CrossRef PubMed.
- D. J. Arismendi-Arrieta, M. Riera, P. Bajaj, R. Prosmiti and F. Paesani, J. Phys. Chem. B, 2016, 120, 1822–1832 CrossRef CAS PubMed.
- C. E. M. Goncalves, B. R. L. Galvão, V. C. Mota, J. P. Braga and A. J. C. Varandas, J. Phys. Chem. A, 2018, 122, 4198–4207 CrossRef CAS PubMed.
- O. T. Unke, D. Koner, S. Patra, S. Käser and M. Meuwly, Mach. Learn. Sci. Technol., 2020, 1, 013001 CrossRef.
- F. Noé, A. Tkatchenko, K.-R. Müller and C. Clementi, Annu. Rev. Phys. Chem., 2020, 71, 361–390 CrossRef PubMed.
- P. O. Dral, J. Phys. Chem. Lett., 2020, 11, 2336–2347 CrossRef CAS PubMed.
- Q. Tong, P. Gao, H. Liu, Y. Xie, J. Lv, Y. Wang and J. Zhao, J. Phys. Chem. Lett., 2020, 11, 8710–8720 CrossRef CAS PubMed.
- O. T. Unke, S. Chmiela, H. E. Sauceda, M. Gastegger, I. Poltavsky, K. T. Schütt, A. Tkatchenko and K.-R. Müller, Chem. Rev., 2021, 121, 10142–10186 CrossRef CAS PubMed.
- M. Pinheiro, F. Ge, N. Ferré, P. O. Dral and M. Barbatti, Chem. Sci., 2021, 12, 14396–14413 RSC.
- J. Behler and M. Parrinello, Phys. Rev. Lett., 2007, 98, 146401 CrossRef PubMed.
- J. Behler, J. Chem. Phys., 2016, 145, 170901 CrossRef PubMed.
- S. Manzhos and T. J. Carrington, Chem. Rev., 2021, 121, 10187–10217 CrossRef CAS PubMed.
- T. Zubatiuk and O. Isayev, Acc. Chem. Res., 2021, 54, 1575–1585 CrossRef CAS PubMed.
- P. O. Dral, J. Comput. Chem., 2019, 40, 2339–2347 CrossRef CAS PubMed.
- A. S. Abbott, J. M. Turney, B. Zhang, D. G. A. Smith, D. Altarawy and H. F. I. Schaefer, J. Chem. Theory Comput., 2019, 15, 4386–4398 CrossRef CAS PubMed.
- O. T. Unke and M. Meuwly, J. Chem. Theory Comput., 2019, 15, 3678–3693 CrossRef CAS PubMed.
- S. Chmiela, H. E. Sauceda, I. Poltavsky, K.-R. Müller and A. Tkatchenko, Comput. Phys. Commun., 2019, 240, 38–45 CrossRef CAS.
- Y. Shao, M. Hellström, P. D. Mitev, L. Knijff and C. Zhang, J. Chem. Inf. Model., 2020, 60, 1184–1193 CrossRef CAS PubMed.
- X. Gao, F. Ramezanghorbani, O. Isayev, J. S. Smith and A. E. Roitberg, J. Chem. Inf. Model., 2020, 60, 3408–3415 CrossRef CAS PubMed.
- T. Ho and H. Rabitz, J. Chem. Phys., 1996, 104, 2584–2597 CrossRef CAS.
- T. Hollebeek, T.-S. Ho and H. Rabitz, J. Chem. Phys., 1997, 106, 7223–7227 CrossRef CAS.
- T. Hollebeek, T.-S. Ho and H. Rabitz, Annu. Rev. Phys. Chem., 1999, 50, 537–570 CrossRef CAS PubMed.
- T. Ho and H. Rabitz, J. Chem. Phys., 2003, 119, 6433–6442 CrossRef CAS.
- T. Ho and H. Rabitz, J. Chem. Phys., 2000, 113, 3960–3968 CrossRef CAS.
- L. Delgado-Tellez, A. Valdés, R. Prosmiti, P. Villarreal and G. Delgado-Barrio, Int. J. Quantum Chem., 2012, 112, 2971–2975 CrossRef CAS.
- A. Kalemos, A. Valdés and R. Prosmiti, J. Chem. Phys., 2012, 137, 034303 CrossRef PubMed.
- N. Alharzali, H. Berriche, P. Villarreal and R. Prosmiti, J. Phys. Chem. A, 2019, 123, 7814–7821 CrossRef CAS PubMed.
- N. Alharzali, R. Rodríguez-Segundo and R. Prosmiti, Phys. Chem. Chem. Phys., 2021, 23, 7849–7859 RSC.
- H.-J. Werner, P. Knowles, G. Knizia, F. Manby and M. Schütz, et al., MOLPRO, version 2022.2, a package of ab initio programs, 2022, see https://www.molpro.net Search PubMed.
- DENEB 1.30 beta: The Nanotechnology Software by Atelgraphics, 2020 Search PubMed.
- C. Møller and M. S. Plesset, Phys. Rev., 1934, 46, 618–622 CrossRef.
- K. Raghavachari, G. W. Trucks, J. A. Pople and M. Head-Gordon, Chem. Phys. Lett., 1989, 157, 479–483 CrossRef CAS.
- W. Györffy and H.-J. Werner, J. Chem. Phys., 2018, 148, 114104 CrossRef PubMed.
- T. H. Dunning, J. Chem. Phys., 1989, 90, 1007–1023 CrossRef CAS.
- D. E. Woon and T. H. Dunning, J. Chem. Phys., 1993, 98, 1358–1371 CrossRef CAS.
- A. K. Wilson, T. van Mourik and T. H. Dunning, J. Mol. Struct., 1996, 388, 339–349 CrossRef CAS.
- S. Boys and F. Bernardi, Mol. Phys., 1970, 19, 553–566 CrossRef CAS.
- C. Schwartz, Phys. Rev., 1962, 126, 1015–1019 CrossRef CAS.
- J. Tennyson, M. Kostin, P. Barletta, G. Harris, O. Polyansky, J. Ramanlal and N. Zobov, Comput. Phys. Commun., 2004, 163, 85–116 CrossRef.
- Atomic Weights and Isotopic Compositions with Relative Atomic Masses, 2005.
- M. Beyer, A. Lammers, E. V. Savchenko, G. Niedner-Schatteburg and V. E. Bondybey, Phys. Chem. Chem. Phys., 1999, 1, 2213–2221 RSC.
Footnotes |
| † Electronic supplementary information (ESI) available. See DOI: https://doi.org/10.1039/d3cp05865d |
| ‡ Doctoral Programme in Theoretical Chemistry and Computational Modelling, Doctoral School, Universidad Autónoma de Madrid, Spain. |
| This journal is © the Owner Societies 2024 |

