 Open Access Article
Creative Commons Attribution 3.0 Unported Licence
Size-dependent reactivity of Rh cationic clusters to reduce NO by CO in the gas phase at high temperatures†
Ken
Miyajima
 a,
Toshiaki
Nagata
 a,
Fumitaka
Mafuné
 *a,
Tomoya
Ichino
 b,
Satoshi
Maeda
 bc,
Taizo
Yoshinaga
d,
Masahide
Miura
d and
Takahiro
Hayashi
d
aDepartment of Basic Science, Graduate School of Arts and Sciences, The University of Tokyo, Komaba, Meguro-ku, Tokyo 153-8902, Japan. E-mail: mafune@cluster.c.u-tokyo.ac.jp
bInstitute for Chemical Reaction Design and Discovery (WPI-ICReDD), Hokkaido University, N21-W10, Kita-ku, Sapporo, Hokkaido 001-0021, Japan
cDepartment of Chemistry, Faculty of Science, Hokkaido University, N10-W8, Kita-ku, Sapporo, Hokkaido 060-0810, Japan
dAdvanced Material Engineering Division, Toyota Motor Corporation, 1200, Mishuku, Susono, Shizuoka 410-1193, Japan
First published on 6th April 2024
Abstract
The reactivity of the reduction of NO pre-adsorbed on Rh2–9+ clusters by CO was investigated using a combination of an alternate on–off gas injection method and thermal desorption spectrometry. The reduction of RhnNxOy+ clusters by CO was evaluated by varying the CO concentration at T = 903 K. Among the RhnNxOx+ clusters, the Rh3N2O2+ cluster exhibited the highest reduction activity, whereas the other clusters, Rh2,4–9NxOx+, showed lower reactivity. Density functional theory (DFT) calculations for Rh3+ and Rh6+ revealed that the rate-determining step for NO reduction in the presence of CO was NO bond dissociation through the kinetics analysis using the RRKM theory. The reduction of Rh3N2O2+ is kinetically preferable to that of Rh6N2O2+. The DFT results were in qualitative agreement with the experimental results.
1. Introduction
Among all precious metals, rhodium has the highest significance in reducing hazardous nitric oxide gas in automobile exhaust.1 Many studies have attempted to understand and improve the efficiency of catalytic activity involving extended Rh surfaces.2–9 Gas-phase clusters are an ideal model to evaluate chemical reactivity and compare them with theoretical calculations, as the number of atoms involved in the reactions is well defined.10–12 NO decomposition on Rhn+/− clusters has been investigated extensively.13–17 Mackenzie et al. reported NO decomposition on small charged rhodium clusters observed using a Fourier transform ion cyclotron resonance mass spectrometer.12–14 They found size-dependent trends in the reaction mechanism and efficiency of NO decomposition. For small clusters (n = 7–16), once two NO molecules are coadsorbed on a cluster, N2 is evolved, generating the corresponding oxide cluster.15 Hirabayashi and Ichihashi studied the effect of doping with a second metal (Al, V, or Co) on the NO reactivity of small Rh cluster cations.17 They examined the reactions of Rh5X+ (X = Al, V, Co, and Rh) with NO under multiple-collision conditions and observed the cluster dioxide formation and N2 release. In particular, V doping was the most effective for NO decomposition.An important step in the catalytic reaction is the rupture of the N–O bond. Indeed, the release of the N2 molecule from RhnNxOx+ requires the NO molecule to dissociate, forming two or more N atoms, which then migrate to form an N–N bond.18 The presence of the N–O bond in the NO-attached Rh metal clusters was observed using vibrational spectroscopy.19,20 When Rh metal clusters react with NO gas, the prominent products obtained are Rhn(NO)m+.18 Note that this notation does not indicate that the NO molecule retains the N–O bond after adsorption on the rhodium cluster. In the case of Rh6+ clusters, the first NO molecule is molecularly adsorbed onto an on-top site of the octahedral skeleton.19 The second NO molecule adsorbs either molecularly on another on-top site or dissociates into N and O atoms in a ratio of approximately 1![[thin space (1/6-em)]](https://www.rsc.org/images/entities/char_2009.gif) :
:![[thin space (1/6-em)]](https://www.rsc.org/images/entities/char_2009.gif) 0.4.
0.4.
In contrast to the N atoms, the O atoms, resulting from NO bond dissociation, bind much more strongly to the Rh cluster.21,22 Therefore, the oxidation of CO by the O atom is an essential step for completing the catalytic cycle. Recently, Chen et al. reported a catalytic cycle for the conversion of NO and CO into N2 and CO2, mediated by gas-phase neutral rhodium–aluminum oxide clusters.12 They observed the oxidation of CO by RhAlO0–3 and RhAl2O1–4 clusters after single-photon ionization using VUV light (118 nm, 10.5 eV). Previous studies on rhodium metal clusters have shown a size dependence of the reaction rate.15,18 Information regarding the temperature dependence of the reaction is essential for further understanding. Therefore, it is important to analyze the reactivity of clusters under high-temperature conditions using mass spectrometry.
In this study, we investigated the size dependence of the reactivity of NO reduction by CO on Rh clusters that pre-reacted with NO under multi-collision conditions. The thermal desorption of NO and/or N2 from RhnNxOy+ clusters and their CO reactivity were evaluated by alternate on–off gas injection of CO.23 The observed difference in CO reactivity between Rh3N2O2+ and Rh6N2O2+ was explained using density functional theory (DFT) calculations.
2. Methods
2.1. Experimental methods
The reduction of NO by CO on Rhn+ clusters under thermalized conditions at high temperatures was investigated using an alternate on–off CO gas injection method developed by our group in combination with thermal desorption spectrometry (TDS) (Fig. 1).23 Gas-phase clusters were prepared by laser ablation of a rhodium metal rod using a focused second harmonic (532 nm; 10 Hz) of a Nd:YAG pulse laser at a typical pulse energy of 10 mJ. The Rh metal atoms were then cooled in an NO-seeded He gas flow (He purity >99.99995%; NO concentration 0.017%) from a solenoid pulse valve (General Valve; stagnation pressure 0.65 MPa) to form RhnNxOy+. A slush bath made from ethanol and liquid nitrogen was used to trap impurities (N2O, NO2, and H2O) in the carrier gas.24 Here, the number of N atoms, x, was assumed to be the same as the number of O atoms, y, because NO molecules were adsorbed onto Rhn+. However, few O-rich clusters (y > x) were generated,18 likely because of the pre-oxidation of the Rh rod surface. The mass flow and pressure controllers maintained the NO concentration at the desired level.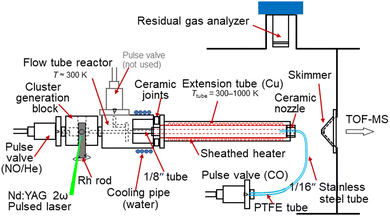 | ||
| Fig. 1 Experimental setup of the alternate on–off CO gas injection method developed by our group in combination with TDS. | ||
RhnNxOy+ clusters prepared in the carrier gas were introduced into an extension tube before expansion in a vacuum chamber. The tube was heated to 300–1000 K using a resistive heater and the temperature was monitored using type-K thermocouples. The residence time of the cluster ions and the density of the He gas in the extension tube were estimated to be approximately 100 μs and 1018 molecules cm−3, respectively. In the tube, the clusters were heated through collisions with the surrounding He gas, which was considered to have achieved thermal equilibrium.25 The reactant CO gas was injected from the nozzle through a pulse valve near the end of the extension tube at a stagnation pressure of 530 Torr to ensure that the heated clusters reacted with CO. The volume of the CO gas pulse was adjusted based on the duration of the pulse valve and the time delay, achieving both a significant mass spectral change and sufficient signal intensity. The CO gas injection was alternated by turning it on for 600 shots (corresponding to two mass spectra) and off for 900 shots (three mass spectra) while the temperature was adjusted for the TDS measurement. This asymmetric alternation of the reactant gas injection displays a clear distinction in the TDS plot. A residual gas analyzer (RGA; MKS e-Vision2) was used to monitor the volumes of NO and CO introduced into the vacuum chamber through the valves. When measuring the CO concentration dependence, the CO concentration in the mixed gas was controlled by scanning the flow rates of the CO and He gases using two mass flow controllers and removing the excess gas using a pressure controller to maintain a constant pressure.
The product ions, which were expanded in a vacuum, were accelerated by a pulsed electric field to gain a kinetic energy of 3.5 keV using a time-of-flight spectrometer for mass analysis. The ions were detected using a Hamamatsu double-microchannel plate detector after passing through a 1 m field-free flight tube. The signals were amplified using a preamplifier and digitized using an oscilloscope. Each mass spectrum was obtained by accumulating signals for 300 shots. The mass resolution was sufficiently high (m/Δm > 1000 at m/z = 1000) to distinguish the Rh, C, N, and O atoms in the mass spectra.
2.2. Computational methods
Systematic calculations were performed using the artificial force induced reaction (AFIR) method, as implemented in the GRRM program, to search for cluster structures and reaction pathways.26 The calculations were performed using the DFT method with the TURBOMOLE program package.27 For the reactant, intermediate, and product states, the local minima were searched using the single component AFIR (SC-AFIR) method with the model collision energy parameter γ = 100 kJ mol−1. The NO dissociation and CO oxidation paths were searched starting from the obtained dissociative adsorption structures using the SC-AFIR method and applying an artificial force between N and O and between O and C, respectively, with γ = 1000 kJ mol−1. All the obtained AFIR paths were re-optimized using the in-house modified locally updated plane (LUP) path optimization method.28 The highest energy points along the LUP paths (the approximate TSs), except those higher than 20 kJ mol−1 above the lowest approximate TS, were optimized to the true TSs. Path connections were confirmed using intrinsic reaction coordinate (IRC) calculations. Structure optimization and IRC calculations were performed without any geometric constraints. The DFT calculations were performed at the PBE/def2-SV(P) level using the RI-J technique.29–31 During the search calculations, the lowest spin states were targeted and identified using the Fermi option of the TURBOMOLE program. The same procedure was used in our previous work on transition metal hexamer-assisted bond activation.32For small Rh clusters, the TPSSh functional provided accurate geometries and reaction energies with respect to the experimental results.33 Therefore, the low-lying reactant, intermediate, product, and transition-state structures in the PBE results were further optimized at the TPSSh-D3/def2-SV(P) level of theory using the RI-J technique.34,35 In these calculations, the lowest spin states were manually identified based on a comparison with the calculations for a wide range of spin states. Normal mode analysis was performed on all of the optimized structures. Finally, single-point energy calculations were performed at the TPSSh-D3/def2-TZVP level of theory using the RI-JK technique (TPSSh-D3/def2-TZVP//def2-SV(P)).36 Rate constants based on the Rice–Ramsperger–Kassel–Marcus (RRKM) theory37–41 were evaluated to validate the thermalization of intermediates in the reaction pathway through comparison with the collision rate of He gas. Gibbs free energy values under the experimental conditions (903 K and 0.04 atm) were also computed.
3. Results
3.1. Mass spectra of RhnNxOy+ clusters with and without CO gas reactions
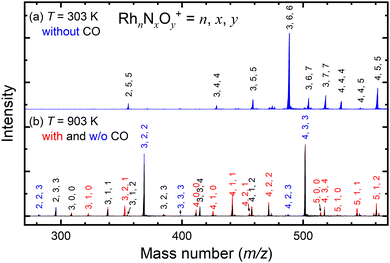
Fig. 2a shows the mass spectrum focusing on the n = 3 mass region of the nascent RhnNxOy+ cluster ions generated by the adsorption of NO on the Rh clusters at 303 K. The ion peaks assigned to Rh3N4O4+, Rh3N5O5+, Rh3N6O6+, Rh3N6O7+, and Rh3N7O7+ were observed in the spectrum. After heating the extension tube to 903 K, the ion peaks shifted to lower masses in the spectrum, which were mainly assigned to Rh3NO+, Rh3N2O2+, and Rh3N3O4+ (Fig. 2b). Mass spectra of the whole region are shown in Fig. S1–S3 (ESI†). It is speculated that the NO molecules adsorbed at 300 K were desorbed from the clusters when they were heated. Upon introduction of CO gas into the extension tube at 903 K, peaks assignable to Rh3+, Rh3N+, Rh3NO+, Rh3N2O+, and Rh3N2O2+ appeared. The intensities of Rh3NO+ and Rh3N2O2+ decreased, whereas those of Rh3N+ and, most prominently, Rh3N2O+ increased. These findings suggest that the CO molecules extract O atoms from Rh3NO+ and Rh3N2O2+ to form CO2. This pair of increased and decreased compositions observed for n = 3 in response to the removal of one oxygen atom by CO was also clear for n = 4 and weaker for n = 5 and 6 (Fig. S6, ESI†).3.2. Thermal desorption and alternate on–off gas injection of CO
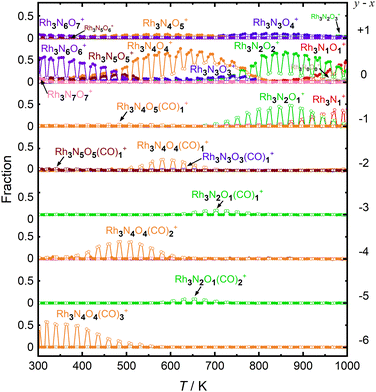
First, let us examine the reactions caused by heat by examining the data points depicted by filled circles corresponding to the reactions in the absence of CO. At 303 K, Rh3N6O6+ was dominant. A small amount of Rh3N7O7+ present at room temperature quickly disappeared upon heating. The intensity of Rh3N6O6+ gradually decreased with increasing temperature from 400 to 500 K, which was accompanied by an increase in the intensity of Rh3N4O4+ before Rh3N5O5+ gained intensity. Subsequently, the intensity of Rh3N4O4+ decreased above 650 K, and the intensity of Rh3N2O2+ increased rapidly before that of Rh3N3O3+. In addition, the intensity of Rh3N2O2+ decreased at temperatures above 850 K, whereas that of Rh3NO+ increased. The changes in the ion intensities can be explained by NO desorption from the clusters by heat. The apparent N2O2 loss can be attributed to the binding energy of NO release. Presumably, the binding energy of an NO molecule in Rh3N5O5+ is lower than that of the binding energy in Rh3N6O6+, and the binding energy of an NO molecule in Rh3N3O3+ is lower than that of the binding energy in Rh3N4O4+. When the clusters were heated to a sufficiently high temperature to allow the NO molecule in Rh3N6O6+ to be readily released from Rh3N6O6+, the less weakly bound NO molecule in Rh3N5O5+ was released simultaneously, resulting in the indistinctive appearance of the peaks for Rh3N5O5+ and Rh3N3O3+. However, the activation energies of NO desorption estimated by fitting were, as expected, lower for Rh3N5O5+ than for Rh3N6O6+ but much higher for Rh3N3O3+ than for Rh3N4O4+. The TDS curve observed in the experiment was better reproduced by adding a reaction channel that desorbs two NO molecules at a time to the model in which one NO molecule is desorbed at a time. This suggests that there may also be a pathway in which NO is desorbed as an NO dimer.42 Other pairs of compositions, such as Rh4N8O8+ and Rh4N5O5+, Rh5N8O8+ and Rh5N6O6+, and Rh6N7O7+ and Rh6N5O5+ showed desorption between intermediate compositions with low relative intensities similar to this one. In such cases, NO may also be released as a dimer, rather than as a single molecule.
At 400–600 K, the O-rich cluster ion Rh3N4O5+ appeared, although the intensity was low and decreased further at temperatures above 650 K. Rh3N3O4+ and Rh3N2O3+ appeared at 800 and 900 K, respectively. Based on these intensity changes, concomitant changes in the reactant and product cluster pairs were observed. NO molecules were sequentially released from the clusters on heating, as shown in the following reaction scheme:
| Rh3NxOx+ → Rh3Nx−1Ox−1+ + NO (x = 2–6), | (1) |
| Rh3NxOx+1+ → Rh3Nx−1Ox+ + NO (x = 3–6). | (2) |
Additionally, the data points in Fig. 3 with open circles show the intensities of the clusters when the CO gas was turned on. At 300–700 K, the intensity of Rh3N6O6+ decreased and that of Rh3N4O4(CO)3+ increased when the CO gas was on. A detailed examination of the mass spectrum revealed that when CO gas was added, a group of peaks with compositions in which NO was gradually replaced by CO, for example, from Rh5N9O9+ to Rh5N6O6(CO)3+, appeared because of the ligand exchange reaction (Fig. S1, ESI†). These changes became insignificant above 550 K. It should be noted that the mass numbers of Rh3N4O4(CO)3+ (m/z = 512.69) were approximately the same as those of Rh3N6O4(CO)2+ (m/z = 512.70), Rh3N8O4(CO)+ (m/z = 512.72), and Rh3N10O4+ (m/z = 512.73), and the species could not be identified uniquely by the current mass resolution. Nevertheless, we can assign the mass peak to CO-adsorbed species, such as Rh3N6O4(CO)2+ and Rh3N4O4(CO)3+, because the intensity of Rh3N6O6+ decreases when CO is turned on. It is difficult to discern the reason for the occurrence of the reactions by increasing the number of N atoms in the clusters, given that the reaction counterpart was CO. There is a strong possibility that O2 or NO was replaced by CO. In addition, the intensity of Rh3N4O4+ decreased and that of Rh3N4O4(CO)2+ increased when CO gas was turned on at temperatures above 400 K. Therefore, the intensity changes were speculated to be caused by the adsorption of CO molecules on Rh3N4O4+via the following reaction:
| Rh3N4O4+ + 2CO → Rh3N4O4(CO)2+. | (3) |
The adsorption of CO was observed only below 750 K, as CO desorption from the clusters accelerated above 700 K. Above 700 K, the intensity of Rh3N2O2+ decreased and the intensity of Rh3N2O+ increased when CO gas was turned on. In addition, above 850 K, when Rh3NO+ was generated by thermal desorption, the intensity of Rh3NO+ decreased and that of Rh3N+ increased when the CO gas was turned on. The loss of O atoms by reaction with CO can be explained by the reduction by CO to form CO2. For O-rich clusters, Rh3N2O3+, Rh3N3O4+, and Rh3N4O5+ also decreased when the CO gas was turned on. Hence, it can be inferred that the reduction reaction of the clusters occurred via
| Rh3NxOx+1+ + CO → Rh3NxOx+ + CO2 (x = 2, 3, 4), | (4) |
| Rh3NxOx+ + CO → Rh3NxOx−1+ + CO2 (x = 1, 2). | (5) |
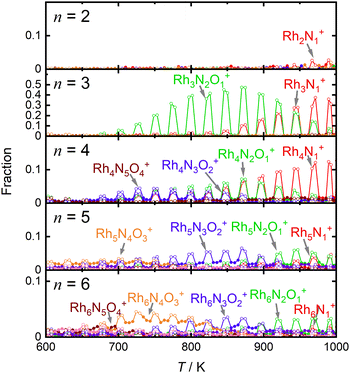
For comparison, Fig. 4 shows the selected fractions of one-O-atom-deficient clusters, RhnNxOx−1+ (n = 2–6), along with the main products of the reduction reaction by CO as a function of temperature. The reaction schemes for n = 4–6 are similar to those for n = 3, although the reactivities of the reductions by CO are much lower than those for n = 3. Thus, the reduction reactivity of CO displayed a considerable size dependence.
3.3. Concentration dependence of CO at 903 K: size dependence
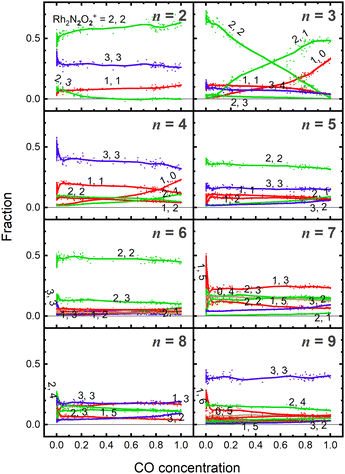
Fig. 5 shows the fraction of RhnNxOy+ clusters produced for each value of n as a function of CO concentration. The temperature of the extension tube was set at 903 K, and the concentration of the reactant, CO, was gradually varied. The fraction of Rh3N2O2+ decreased significantly with increasing CO concentration, whereas that of Rh3N2O+ and Rh3N+ increased. Rh3NO+ also decreased; however, the decrease was smaller than the increase in Rh3N+, suggesting that there was a formation path for Rh3N+ other than the direct abstraction of the O atom from Rh3NO+. Based on the fraction balance, Rh3N+ is considered to be produced from Rh3N2O2+ simultaneously via reduction by CO and desorption of NO. For n = 2, Rh2N2O3+ decreases and Rh2N2O2+ increases with increasing CO concentration; however, no other clear changes are observed.4. Discussion
4.1. Thermal desorption of NO and reduction by CO
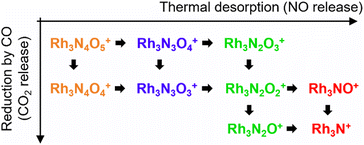
Based on the experimental results, a reaction scheme for the thermal desorption of NO and reduction of Rh3NxOy+ by CO is presented in Scheme 1. Rh3NxOx+ and one-O-atom-rich Rh3NxOx+1+, generated at low temperatures, formed Rh3N+ above 900 K in the presence of CO. The reaction schemes for n = 4 and 5 are similar to that for n = 3.For n = 7 and 8, several O-rich clusters, including Rh7NO3+, Rh7NO5+, Rh7O4+, Rh8NO3+, Rh8NO5+, and Rh8N2O4+, were produced by thermal desorption in the absence of CO, which is consistent with our previous study.18 These O-rich clusters were formed by N2 released from Rh7NxOx+ and Rh8NxOx+. We expected that these clusters would be effectively reduced by CO, forming clusters with fewer O atoms and increasing the N-rich clusters. However, the oxygen-rich clusters Rh7NO5+, Rh8NO5+, and Rh9NO6+ were rapidly depleted in the low CO concentration region, as shown in Fig. 5. The pair of decrease and increase in intensity induced by mixing CO may have induced the following oxygen release reactions:
| Rh7NO5+ + CO → Rh7NO3+ + CO + O2 | (6) |
4.2. Size and composition dependence of the reactivity of reduction by CO
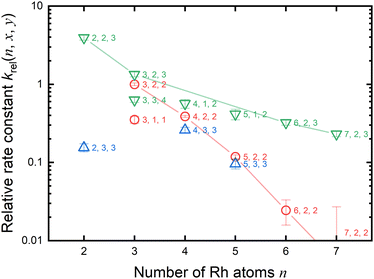
As previously mentioned, the reduction reactivity of CO is size dependent. The fractions of the clusters for n = 6–9 varied slightly as the CO concentration increased, indicating that they were less reactive for reduction by CO. To understand the size and composition dependence of reactivity, the relative rate constant krel(n, x, y) of the reduction reaction of RhnNxOy+ was calculated by assuming a pseudo-first-order reaction between CO at T = 903 K.In this experiment, because cluster ions were not mass-selected, the intensities of multiple clusters changed concurrently because of the reaction with CO. The rate constants for the selected clusters were estimated by analyzing the concentration dependence, as shown in Fig. 5 and summarized in Fig. 6. Generally, the rate constants for oxygen-rich clusters, RhnNxOx+1+, are larger than those for the corresponding RhnNxOx+ clusters. In particular, Rh2N2O3+, which contains excess oxygen, exhibited the highest reaction rate observed in this study. This cluster is considered to be reduced by the following reaction:
| Rh2N2O3+ + CO → Rh2N2O2+ + CO2 | (7) |
4.3. Quantum chemical calculation of reaction paths
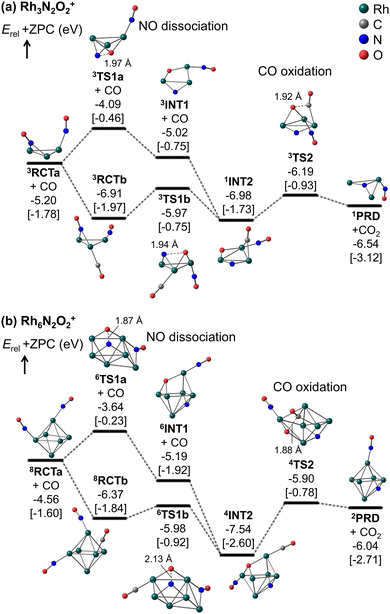
Fig. 5 and 6 show that the cluster with Rh3N2O2+ exhibited the highest reduction activity, whereas the clusters with Rh6–9NxOx+ exhibited lower reactivity. To investigate the observed size dependency, we performed theoretical calculations on the reactivity of n = 3 and n = 6 clusters. Using DFT in combination with a systematic pathway search method, we calculated the geometrical structures and energy barriers of the reactions of Rh3N2O2+ and Rh6N2O2+ with CO.Fig. 7 shows the zero-point corrected energy profiles and structural changes in the NO dissociation and CO oxidation steps involved in the reduction of Rh3N2O2+ and Rh6N2O2+ by CO. The complete energy profile, including adsorbate migration and Rh cluster shape changes, is shown in Fig. S7 (ESI†) for n = 3 and Fig. S8 (ESI†) for n = 6. For the reactions of n = 3 and n = 6, two reaction mechanisms are proposed based on the difference in the order of dissociation of the NO molecules and adsorption of CO: (1) two NO molecules, which adsorb molecularly on Rh3+ or Rh6+ (RCTa), dissociate (INT1), followed by CO adsorption (INT2). (2) It is also possible that NO dissociation occurred after the co-adsorption of the two NOs and CO (RCTb). In both cases, a single O-deficient cluster (PRD) is generated by CO2 formation and desorption.
Bare Rh3+ and Rh6+ clusters exhibit triangular and octahedral geometries, respectively. As shown in Fig. 7a, the Rh3 cluster retains its triangular geometry throughout RCT, INT, PRD, and TS. In contrast, the Rh6 cluster retained its octahedral geometry at RCT, INT, and PRD, while forming different geometries at TS1a/b and TS2. In particular, the Rh6 structures at TS1a/b and TS2 correspond to metastable isomers, namely capped square pyramid and boat structures, respectively, which have been considered in spectroscopic and DFT studies for the gas-phase Rh6+ cluster.43 It is worth noting that the octahedral structures at TS1a/b and TS2 are less stable than the lowest energy TS structures by 0.46, 1.00, and 0.31 eV, respectively (Fig. S9, ESI†). A previous study on transition metal hexamer-assisted bond activation highlighted the importance of metastable cluster structures in assisting bond activation.32 The active sites for NO dissociation and CO2 formation were identified at the hollow site for n = 3 and the 4-fold hollow site for n = 6. In particular, the active sites for NO dissociation at n = 6 are similar to those on the Rh(100) surface.7,44
For n = 3, the NO bond dissociation step with/without CO adsorption is endothermic by 0.07/0.18 eV with an activation energy of 0.94/1.11 eV. The CO oxidation step is also endothermic by 0.34 eV with an activation energy of 0.79 eV. For n = 6, the NO dissociation step with/without CO adsorption is exothermic by −1.17/−0.63 eV with an activation energy of 0.39/0.92 eV, while the CO oxidation step is endothermic by 1.50 eV with an activation energy of 1.64 eV. It should be noted that for n = 6, the actual activation energy for NO dissociation with CO adsorption is 0.85 eV (Fig. S8, ESI†), and this may be attributed to the presence of another high barrier that causes a shape change of the Rh6 moiety before NO dissociation. However, this value is still smaller than the activation energy of 1.64 eV for CO oxidation. In short, NO dissociation and CO oxidation are endothermic/exothermic and endothermic/endothermic, respectively, for n = 3/6. The RRKM rate constants for the NO dissociation and CO oxidation steps, with the total energy of the reactants (electronic energy plus zero-point energy) as the total energy, are estimated to be 4.7 × 10¹⁰ and 7.5 × 10¹¹ s−1 for n = 3, and 1.6 × 10⁹ and 5.0 × 10⁹ s−1 for n = 6, revealing that the reduction for n = 3 is kinetically preferable to that for n = 6. Furthermore, NO bond dissociation was identified as the rate-determining step for both sizes. Comparing to the collision rate of He (around 109 s−1), the structural changes of intermediates could proceed with higher frequency than the collision with He. It is, thus, considered that the clusters might not reach thermal equilibrium in the extension tube. The Rh3,6(NO)2(CO)+ clusters could generate CO2 with the larger excess energy during the residence time of approximately 100 μs. A simple kinetic analysis of the reaction profiles presented in Fig. S7 and S8 in the ESI,† based on the rate constant matrix construction method,45 shows that the ratio of krel(n, x, y) is (3, 2, 2)![[thin space (1/6-em)]](https://www.rsc.org/images/entities/char_2009.gif) :
:![[thin space (1/6-em)]](https://www.rsc.org/images/entities/char_2009.gif) (6, 2, 2) = 1
(6, 2, 2) = 1![[thin space (1/6-em)]](https://www.rsc.org/images/entities/char_2009.gif) :
:![[thin space (1/6-em)]](https://www.rsc.org/images/entities/char_2009.gif) 0.03. Thus, our DFT results are in qualitative agreement with the experimental results for the rate constant ratio, as shown in Fig. 6.
0.03. Thus, our DFT results are in qualitative agreement with the experimental results for the rate constant ratio, as shown in Fig. 6.
According to Fig. 7, the N–Rh6–O moiety in INT1 and INT2 for n = 6 represents the lowest-energy dissociatively adsorbed structures, which are identified by both spectroscopic and DFT methods.19 In these structures, the N and O atoms are adsorbed at different hollow sites in the octahedral Rh6 motif. Conversely, in the N–Rh3–O moiety, the N and O atoms were adsorbed on different edge sites of the triangular Rh3 motif because of the presence of only a single hollow site for adsorption, and were not sufficiently stabilized. The site-specific binding energies of the N and O atoms were strongly correlated with the relative stabilities of the dissociatively adsorbed states.21 The stabilization energy caused by dissociative adsorption increased with the binding energies of the N and O atoms. In addition, Fig. 7 shows that as NO dissociation becomes more exothermic, the NO dissociation barrier decreases, and the CO oxidation barrier increases. Thus, the relative stability of the dissociatively adsorbed states would be involved in the difference in the reactivity between Rh3N2O2+ and Rh6N2O2+.
In particular, for n = 6, the order (109 s−1) of RRKM rate constants for the NO dissociation and CO oxidation steps could be comparable to the collision frequency of He gas. These collision rates may be influenced by the CO concentration in the tube. Therefore, the kinetics of n = 6 should be carefully investigated with both rate constants based on the RRKM theory and transition state theory. If the collision frequency decreases slightly because of the higher CO concentration, the cluster ions might not achieve thermal equilibrium, leading to the active Rh6(NO)2(CO)+ species generate CO2, as mentioned above. On the other hand, if the collision frequency increases slightly under a lower CO concentration, the cluster ions might be thermalized. From the free energy evaluation, shown in Fig. 7b, the CO oxidation from 4INT2 (1.82 eV and 1.31 × 10³ s−1) is identified as a rate-determining step, revealing that the intermediate cannot get over the barrier within the residence time. These discussions might relate with the observed fraction change of Rh6N2O1+ in Fig. 5.
5. Conclusions
The size-dependent reactivities of rhodium oxynitride clusters, RhnNxOy+ (n = 2–9), and carbon monoxide were studied by gas-phase thermal desorption spectrometry using the alternate on–off gas injection method. The loss of O atoms from the reaction with CO can be explained by the reduction by CO, which resulted in the formation of CO2. The rate constants for the RhnNxOx+ cluster and CO were approximately zero at n = 2, were highest at n = 3, and decreased with n. DFT calculations of the geometrical structures and energy barriers for the reactions of Rh3N2O2+ and Rh6N2O2+ with CO revealed that NO bond dissociation is identified to be a rate-determining step through the evaluation of RRKM rate constants. From comparing the order of the rate constants, the reduction for n = 3 is kinetically preferable to that for n = 6. In addition, the DFT results were in qualitative agreement with the experimental results for the relative rate constant.Author contributions
K. M.: conceptualization, methodology, investigation, software, visualization, writing – original draft and writing – review & editing; T. N.: writing – review & editing; F. M.: conceptualization, writing – review & editing, project administration and funding acquisition; T. I.: investigation, visualization, writing – original draft and writing – review & editing; S. M.: project administration and funding acquisition; T. Y.: project administration and funding acquisition; M. M.: writing – review & editing; T. H.: writing – review & editing.Conflicts of interest
There are no conflicts to declare.Acknowledgements
The authors would like to thank Dr. Satoshi Kudoh for quantum calculations on the Rh3NxOy+ and Rh6NxOy+ clusters in the early stages of this work.References
- H. Hirata, Recent research progress in automotive exhaust gas purification catalyst, Catal. Surv. Asia, 2014, 18, 128–133 CrossRef CAS.
- D. G. Castner, B. A. Sexton and G. A. Somorjai, LEED and thermal desorption studies of small molecules (H2, O2, CO, CO2, NO, C2H4, C2H2 and C) chemisorbed on the rhodium (111) and (100) surfaces, Surf. Sci., 1978, 71(3), 519–540 CrossRef CAS.
- C.-T. Kao, G. S. Blackman, M. A. Van Hove, G. A. Somorjai and C.-M. Chan, The surface structure and chemical reactivity of Rh(111)-(2 × 2)-3NO by HREELS and dynamical LEED analysis, Surf. Sci., 1989, 224, 77–96 CrossRef CAS.
- J. S. Villarrubia and W. Ho, Nitric oxide adsorption, decomposition, and desorption on Rh(100), J. Chem. Phys., 1987, 87, 750–764 CrossRef CAS.
- A. G. Makeev and M. M. Slinko, Mathematic modelling of the peculiarities of NO decomposition on Rh(111), Surf. Sci., 1996, 359, L467–L472 CrossRef CAS.
- F. Zaera and C. S. Gopinath, Role of adsorbed nitrogen in the catalytic reduction of NO on rhodium surfaces, J. Chem. Phys., 1999, 111, 8088–8097 CrossRef CAS.
- D. Loffreda, F. Delbecq, D. Simon and P. Sautet, Breaking the NO bond on Rh, Pd, and Pd3Mn alloy (100) surfaces: A quantum chemical comparison of reaction paths, J. Chem. Phys., 2001, 115, 8101–8111 CrossRef CAS.
- T. Hirai, M. Okoshi, A. Ishikawa and H. Nakai, Temperature- and pressure-dependent adsorption configuration of NO molecules on Rh(111) surface: A theoretical study, Surf. Sci., 2019, 686, 58–62 CrossRef CAS.
- A. Ishikawa and Y. Tateyama, First-principles microkinetic analysis of NO + CO reactions on Rh(111) surface toward understanding NOx reduction pathways, J. Phys. Chem. C, 2018, 122, 17378–17388 CrossRef CAS.
- S. M. Lang and T. M. Bernhardt, Gas phase metal cluster model systems for heterogeneous catalysis, Phys. Chem. Chem. Phys., 2012, 14, 9255–9269 RSC.
- Y. X. Zhao, X. G. Zhao, Y. Yang, M. Ruan and S. G. He, Rhodium chemistry: A gas phase cluster study, J. Chem. Phys., 2021, 154, 180901 CrossRef CAS PubMed.
- J.-J. Chen, X.-N. Li, L.-H. Mou, Q.-Y. Liu and S.-G. He, Catalytic Conversion of NO and CO into N2 and CO2 by Rhodium–aluminum oxides in the gas phase, J. Mater. Chem. A, 2021, 10, 6031–6037 RSC.
- Y. Tawaraya, S. Kudoh, K. Miyajima and F. Mafuné, Thermal desorption and reaction of NO adsorbed on rhodium cluster ions studied by thermal desorption spectroscopy, J. Phys. Chem. A, 2015, 119, 8461–8468 CrossRef CAS PubMed.
- M. S. Ford, M. L. Anderson, M. P. Barrow, D. P. Woodruff, T. Drewello, P. J. Derrick and S. R. Mackenzie, Reactions of nitric oxide on Rh6+ clusters: Abundant chemistry and evidence of structural isomers, Phys. Chem. Chem. Phys., 2005, 7, 975–980 RSC.
- M. L. Anderson, M. S. Ford, P. J. Derrick, T. Drewello, D. P. Woodruff and S. R. Mackenzie, Nitric oxide decomposition on small rhodium clusters, Rhn+/−, J. Phys. Chem. A, 2006, 110, 10992–11000 CrossRef CAS PubMed.
- D. Harding, S. R. Mackenzie and T. R. Walsh, Structural isomers and reactivity for Rh6 and Rh6+, J. Phys. Chem. B, 2006, 110, 18272–18277 CrossRef CAS.
- S. Hirabayashi and M. Ichihashi, Effects of second-metal (Al, V, Co) doping on the NO reactivity of small rhodium cluster cations, J. Phys. Chem. A, 2017, 121, 2545–2551 CrossRef CAS PubMed.
- T. Nagata, K. Kawada, X. Chen, M. Yamaguchi, K. Miyajima and F. Mafuné, Decomposition of nitric oxide by rhodium cluster cations at high temperatures, Phys. Chem. Chem. Phys., 2021, 23, 26721 RSC.
- T. Nagata, S. Kudoh, K. Miyajima, J. M. Bakker and F. Mafuné, Adsorption of multiple NO molecules on Rhn+ (n = 6, 7) investigated by infrared multiple photon dissociation spectroscopy, J. Phys. Chem. C, 2018, 122, 22884–22891 CrossRef CAS.
- T. Nagata, K. Koyama, S. Kudoh, K. Miyajima, J. M. Bakker and F. Mafuné, Adsorption forms of NO on Rhn+ (n = 6–16) revealed by infrared multiple photon dissociation spectroscopy, J. Phys. Chem. C, 2017, 121, 27417–27426 CrossRef CAS.
- M. Yamaguchi, S. Kudoh, K. Miyajima, O. V. Lushchikova, J. M. Bakker and F. Mafuné, Tuning the dissociative action of cationic Rh clusters toward NO by substituting a single Ta atom, J. Phys. Chem. C, 2019, 123, 3476–3481 CrossRef CAS.
- M. Yamaguchi, Y. Zhang, S. Kudoh, K. Koyama, O. V. Lushchikova, J. M. Bakker and F. Mafuné, Oxophilicity as a descriptor for NO cleavage efficiency over group IX metal clusters, J. Phys. Chem. Lett., 2020, 11, 4408–4412 CrossRef CAS PubMed.
- X. Chen, K. Miyajima and F. Mafuné, Newly-developed alternate on–off gas injection method for investigation of reduction of gas-phase cobalt oxide clusters by CO at high temperature, Chem. Phys. Lett., 2022, 792, 139418 CrossRef CAS.
- R. E. Rondeau, Slush Baths, J. Chem. Eng. Data, 2002, 11, 124–124 CrossRef.
- T. Nagata, K. Miyajima and F. Mafuné, Stable stoichiometry of gas-phase cerium oxide cluster ions and their reactions with CO, J. Phys. Chem. A, 2015, 119, 1813–1819 CrossRef CAS PubMed.
- S. Maeda, Y. Harabuchi, M. Takagi, K. Saita, K. Suzuki, T. Ichino, Y. Sumiya, K. Sugiyama and Y. Ono, Implementation and performance of the artificial force induced reaction method in the GRRM17 Program, J. Comput. Chem., 2018, 39, 233–250 CrossRef CAS PubMed.
- R. Ahlrichs, M. K. Armbruster, R. A. Bachorz, H. Bahmann, A. Baldes, M. Bär, H.–P. Baron, R. Bauernschmitt, F. A. Bischoff, S. Böcker, A. M. Burow, N. Crawford, P. Deglmann, F. D. Sala, M. Diedenhofen, M. Ehrig, K. Eichkorn, S. Elliott, Y. J. Franzke, D. Friese, F. Furche, T. Gimon, A. Glöβ, N. Graf, L. Grajciar, F. Haase, M. Häser, C. Hättig, A. Hellweg, B. Helmich, S. Höfener, C. Holzer, H. Horn, C. Huber, W. Hujo, U. Huniar, M. Kattannek, S. Klawohn, W. Klopper, A. Köhn, C. Kölmel, M. Kollwitz, K. Krause, M. Kühn, R. Łazarski, T. M. Maier, F. Mack, K. May, N. Middendorf, P. Nava, C. Ochsenfeld, H. Öhm, M. Pabst, H. Patzelt, P. Pollak, D. Rappoport, K. Reiter, O. Rubner, A. Schäfer, G. Schmitz, U. Schneider, T. Schwabe, M. Sierka, D. P. Tew, O. Treutler, B. Unterreiner, M. von Arnim, F. Weigend, P. Weis, H. Weiss, N. Winter, TURBOMOLEV7.3 2018, a Development of University of Karlsruhe and Forschungszentrum Karlsruhe GmbH, 1989–2007, TURBOMOLE GmbH, 2007 Search PubMed.
- C. Choi and R. Elber, Reaction path study of helix formation in tetrapeptides: Effect of side chains, J. Chem. Phys., 1991, 94, 751–760 CrossRef CAS.
- J. P. Perdew, K. Burke and M. Ernzerhof, Generalized gradient approximation made simple, Phys. Rev. Lett., 1996, 77, 3865–3868 CrossRef CAS PubMed.
- F. Weigend and R. Ahlrichs, Balanced basis sets of split valence, triple zeta valence and quadruple zeta valence quality for H to Rn: Design and assessment of accuracy, Phys. Chem. Chem. Phys., 2005, 7, 3297–3305 RSC.
- K. Eichkorn, O. Treutler, H. Öhm, M. Häser and R. Ahlrichs, Auxiliary basis sets to approximate Coulomb potentials, Chem. Phys. Lett., 1995, 240, 283–290 CrossRef CAS.
- T. Ichino, M. Takagi and S. Maeda, A systematic study on bond activation energies of NO, N2, and O2 on hexamers of eight transition metals, ChemCatChem, 2019, 11, 1346–1353 CrossRef CAS.
- S. M. Hamilton, W. S. Hopkins, D. J. Harding, T. R. Walsh, M. Haertelt, C. Kerpal, P. Gruene, G. Meijer, A. Fielicke and S. R. Mackenzie, Infrared-induced reactivity of N2O on small gas-phase rhodium clusters, J. Phys. Chem. A, 2011, 115, 2489–2497 CrossRef CAS PubMed.
- V. N. Staroverov, G. E. Scuseria, J. Tao and J. P. Perdew, Comparative assessment of a new nonempirical density functional: Molecules and hydrogen-bonded complexes, J. Chem. Phys., 2003, 119, 12129–12137 CrossRef CAS.
- S. Grimme, J. Antony, S. Ehrlich and H. Krieg, A consistent and accurate ab initio parametrization of density functional dispersion correction (DFT-D) for the 94 elements H-Pu, J. Chem. Phys., 2010, 132, 154104 CrossRef PubMed.
- F. Weigend, A fully direct RI-HF algorithm: Implementation, optimised auxiliary basis sets, demonstration of accuracy and efficiency, Phys. Chem. Chem. Phys., 2002, 4, 4285–4291 RSC.
- O. K. Rice and H. C. Ramsperger, Theories of unimolecular gas reactions at low pressures. II, J. Am. Chem. Soc., 1928, 50, 617–620 CrossRef CAS.
- L. S. Kassel, Studies in homogeneous gas reactions II Introduction of quantum theory, J. Phys. Chem., 1928, 32, 1065–1079 CrossRef CAS.
- R. A. Marcus and O. K. Rice, Session on free radicals The kinetics of the recombination of methyl radical and iodine atoms, J. Phys. Colloid Chem., 1951, 55, 894–908 CrossRef CAS.
- R. A. Marcus, Unimolecular dissociations and free radical recombination reactions, J. Phys. Chem., 1952, 20, 359–364 CrossRef CAS.
- G. Z. Whitten and B. S. Rabinovitch, Accurate and facile approximation for vibrational energy level sums, J. Chem. Phys., 1963, 38, 2466–2473 CrossRef CAS.
- G. Meizyte, P. A. J. Pearcy, P. D. Watson, E. I. Brewer, A. E. Green, M. Doll, O. A. Duda and S. R. Mackenzie, An infrared study of gas-phase metal nitrosyl ion–molecule complexes, J. Phys. Chem. A, 2022, 126, 9414–9422 CrossRef CAS PubMed.
- D. J. Harding, P. Gruene, M. Haertelt, G. Meijer, A. Fielicke, S. M. Hamilton, W. S. Hopkins, S. R. Mackenzie, S. P. Neville and T. R. Walsh, Probing the structures of gas-phase rhodium cluster cations by far-infrared spectroscopy, J. Chem. Phys., 2010, 133, 214304 CrossRef CAS PubMed.
- K. Tian, X.-Y. Tu and S.-S. Dai, NO dissociation pathways on Rh(1 0 0), (1 1 0), and (1 1 1) surfaces: A comparative density functional theory study, Surf. Sci., 2007, 601, 3186–3195 CrossRef CAS.
- Y. Sumiya, Y. Nagahata, T. Komatsuzaki, T. Taketsugu and S. Maeda, Kinetic analysis for the multistep profiles of organic reactions: Significance of the conformational entropy on the rate constants of the Claisen rearrangement, J. Phys. Chem. A, 2015, 119, 11641–11649 CrossRef CAS PubMed.
Footnote |
| † Electronic supplementary information (ESI) available: Mass spectra of Rh2–10NxOy+ at 303 K, 663 K, and 903 K; signal intensity of Rh2–7NxOy+ cluster ions after heating in an extension tube at 903 K; TDS plots for n = 3 with alternate on–off gas injection of CO; TDS plots for Rh2–5NxOy+; entire free energy profiles for the reduction of Rh3N2O2+ and Rh6N2O2+ by CO; octahedral structures at transition states for NO dissociation and CO oxidation; optimized structures and energies. See DOI: https://doi.org/10.1039/d3cp05862j |
| This journal is © the Owner Societies 2024 |

