
 Open Access Article
 This Open Access Article is licensed under a
 Creative Commons Attribution 3.0 Unported Licence
Beyond the electrical double layer model: ion-dependent effects in nanoscale solvent organization
Amanda J.
Souna†
a,
Mohammad H.
Motevaselian†
b,
Jake W.
Polster
 c,
Jason D.
Tran
a,
Zuzanna S.
Siwy
cde,
Narayana R.
Aluru
bfg and
John T.
Fourkas
*ahi
c,
Jason D.
Tran
a,
Zuzanna S.
Siwy
cde,
Narayana R.
Aluru
bfg and
John T.
Fourkas
*ahi
aDepartment of Chemistry & Biochemistry, University of Maryland, College Park, MD 20742, USA
bDepartment of Mechanical Science and Engineering, University of Illinois at Urbana-Champaign, Urbana, Illinois 61820, USA. E-mail: fourkas@umd.edu
cDepartment of Chemistry, University of California Irvine, Irvine, CA 92697, USA
dDepartment of Physics and Astronomy, University of California Irvine, Irvine, CA 92697, USA
eDepartment of Biomedical Engineering, University of California Irvine, Irvine, CA 92697, USA
fWalker Department of Mechanical Engineering, The University of Texas at Austin, Austin, TX 78712, USA
gOden Institute for Computational Engineering and Sciences, The University of Texas at Austin, Austin, TX 78712, USA
hInstitute for Physical Sciences and Technology, University of Maryland, College Park, MD 20742, USA
iMaryland Quantum Materials Center, University of Maryland, College Park, MD 20742, USA
First published on 31st January 2024
Abstract
The nanoscale organization of electrolyte solutions at interfaces is often described well by the electrical double-layer model. However, a recent study has shown that this model breaks down in solutions of LiClO4 in acetonitrile at a silica interface, because the interface imposes a strong structuring in the solvent that in turn determines the preferred locations of cations and anions. As a surprising consequence of this organisation, the effective surface potential changes from negative at low electrolyte concentration to positive at high electrolyte concentration. Here we combine previous ion-current measurements with vibrational sum-frequency-generation spectroscopy experiments and molecular dynamics simulations to explore how the localization of ions at the acetonitrile–silica interface depends on the sizes of the anions and cations. We observe a strong, synergistic effect of the cation and anion identities that can prompt a large difference in the ability of ions to partition to the silica surface, and thereby influence the effective surface potential. Our results have implications for a wide range of applications that involve electrolyte solutions in polar aprotic solvents at nanoscale interfaces.
Introduction
Electrolyte solutions play a key role in many nanoscale phenomena, including self-assembly1,2 and colloidal stability,3,4 and are used to modulate nanoscale interactions in many applications, such as batteries,5,6 supercapacitors,7–10 nanofluidic transport,11–15 and separations.16–22 The electrical double-layer (EDL) model23,24 is commonly used to describe the nanoscale behaviour of electrolyte solutions near interfaces, and in particular how the electrical potential depends on the distance from a surface and on the electrolyte concentration. The broad use of this model speaks to great success in describing the properties of interfacial electrolyte solutions, even though ions are treated as point charges and the solvent is treated as a homogeneous continuum.25,26 This approach works especially well in aqueous solutions, although there are known to be relatively small deviations that depend, for instance, on the diameters of the ions involved.27,28We have recently shown that the EDL model fails to describe the structure of interfacial electrolyte solutions in the polar, aprotic solvent acetonitrile (MeCN) at a silica interface.29 Proximity to this interface causes MeCN to take on a structure that resembles a supported lipid bilayer, and that repeats, with decreasing fidelity, for more than 2 nm away from the surface.30–32 We showed that the thermodynamic stability of this organization is high enough that the structure of the interfacial liquid is essentially unaffected by the presence of lithium perchlorate, even at a concentration of 1 M.29 Furthermore, the organization of the solvent dictates the favoured positions of the lithium cations and perchlorate anions. We found that at low concentrations of lithium perchlorate the surface potential is negative, but that at higher concentrations the surface potential becomes positive.29
There is evidence that interfacial organization of a solvent causing the breakdown of the EDL model is not unique to the MeCN–silica interface. For instance, positive effective surface charges have been observed on surfaces that feature silanol or carboxylic acid groups in electrolyte solutions in the polar aprotic solvents propylene carbonate33,34 (PC) and acetone.33 Furthermore, simulations have revealed that PC takes on a lipid-bilayer-like (LBL) structure at a positively charged graphite electrode,35 suggesting that the same organization would be found at interfaces that can donate hydrogen bonds to this liquid. If this behaviour is typical for polar aprotic solvents at interfaces, then there are major consequences for applications that rely upon electrolyte solutions in these media in nanoscale environments.
Because the thicknesses of solvent bilayers at an interface, and particularly the thickness of the surface bilayer, establish a fixed distance scale, it might be expected that the dimensions of the ions will have a considerably greater influence on the interfacial behaviour in solvents that undergo LBL organization at an interface than for systems that are described well by the EDL model. To develop a deeper understanding of this phenomenon, here we explore the influence of the cation and anion diameter on the distribution of ions and effective surface potential at the MeCN–silica interface. We combine previously reported ion-current measurements29 with vibrational sum-frequency-generation (VSFG) spectroscopy and molecular dynamics (MD) simulations to explore solutions of LiBF4, LiPF6, and NaClO4 in MeCN at the silica interface, and contrast these results to our previous findings for LiClO4 solutions in MeCN at this interface.29 In all cases we find that the LBL organization of MeCN is maintained, and determines the concentration-dependent behaviour of the system. However, the sizes of the ions36,37 (Table 1) play a key, synergistic role in controlling the dependence of the effective surface potential on the electrolyte concentration.
![[thin space (1/6-em)]](https://www.rsc.org/images/entities/char_2009.gif) Ref. 36.
Ref. 36.Experimental
Ion-current measurements
The ion-current measurements were made in a glove box, using a 400-nm-inner-diameter glass pipette that was filled with an electrolyte solution and that was submerged in an electrolyte solution of a different concentration, as described previously.29 One electrode was inside the pipette and one was in the external solution. Current–voltage (I–V) data were measured from −2 V to 2 V.Vibrational sum-frequency-generation spectroscopy
VSFG spectra of the MeCN symmetric methyl stretch (in the spectral region from 2925 cm−1 to 2975 cm−1) were obtained under SSP polarization conditions using a spectrometer with a counter-propagating geometry. The spectrometer38 and the data collection procedures39 are described in detail elsewhere.HPLC grade MeCN (Fisher Scientific) was used for all of the spectroscopic experiments. The solvent was distilled over CaH2 in an argon atmosphere, and then was stored over molecular sieves in a glove box under argon for at least 24 h. The LiPF6 was ≥99.99% battery grade (Sigma Aldrich). The LiBF4 was 98% purity, and anhydrous (ACROS Organics). The NaClO4 was 98.0% ACS grade (Sigma Aldrich). The salts were dried under vacuum for at least 24 h, the LiBF4 at 120 °C, and the other salts at 100 °C. All solutions were prepared in a glove box under an argon atmosphere, using glassware that had been dried in a 165 °C oven overnight. The electrolyte solutions studied had concentrations that ranged from 1 nanomole per litre of solvent up to 1 mole per litre of solvent (1.27 molal) for LiPF6, up to 2 moles per litre of solvent for NaClO4 (2.54 molal), and up to 3 moles per litre of solvent for LiBF4 (3.81 molal). Based on Karl Fischer titration (899 Coulometer, Metrohm), the water content of the neat solvent was between 25 and 50 ppm and the water content of the electrolyte solutions was between 80 and 200 ppm.
The cuvettes used to hold the VSFG samples were composed of IR quartz (Firefly). Each cuvette was rinsed sequentially with acetone, methanol, and then water. After drying in an oven, the cuvettes were cleaned for 3 min in an oxygen plasma, and then were kept in an oven overnight. The hot cuvettes were placed directly in the glove box. Once the cuvettes had cooled, they were filled with the neat solvent or an electrolyte solution, and then were capped tightly.
Molecular dynamics simulations
All MD simulations were performed in GROMACS40 using a 1-fs time step. We used the 6-site, all-atom, flexible model of MeCN developed by Nikitin and Lyubartsev,41 which has been found to reproduce the structural and dynamic properties of the liquid, both in the bulk41,42 and at the liquid–silica interface.31,43,44 For all of the salts, we used the OPLS-AA forcefield parameters.45,46Initial bulk configurations in each system were equilibrated in the NVT ensemble via a process involving simulating at T = 533 K for 1 ns, cooling from 533 to 298 K for 1 ns, and then equilibrating at 298 K for 3 ns. Production runs of 10 ns were performed in the NPT ensemble at 1 atm and 298 K. The Nosé–Hoover thermostat47 and the Parrinello–Rahman barostat48 were used to keep the temperature and pressure constant, respectively, with respective time constants of 0.2 ps and 1 ps.
The simulation box employed periodic boundary conditions in all directions. The cutoff radius for short-range interactions was 1.2 nm. Energy- and pressure-tail corrections49 were applied to the Lenard-Jones potential. The particle-mesh Ewald summation50 was used for the long-range electrostatic interactions, with a cutoff radius of 1.2 nm and a fast Fourier transform grid spacing of 0.12 nm. The Ewald3dc model was used to account for the slab geometry by excluding long-range electrostatic contributions from periodic images in the z-direction.51
As in our previous work,29 for the interfacial simulations the liquid was held between two parallel planes separated by z = 15.24 nm, one comprising a hydroxylated silica substrate based on the work of Lee and Rossky,52 and the other comprising a “graphene” sheet in which the atoms were treated as hard spheres. The liquid, the ions, and the hydrogen atoms of the silanol groups were all allowed to move in the simulations, but the other atoms were held fixed. Periodic boundary conditions were used in all directions, with a vacuum space of 45 nm between the sides of the silica substrate and the graphene that were not in contact with the liquid. The numbers of molecules and pairs of ions were adjusted to ensure that the average density of the system was within 2% of the corresponding bulk density.
In each case, four 40-ns simulations were performed using different initial positions and velocities. Configurations were saved every 0.1 ps to calculate the average properties presented here. The first 5 ns of each simulation was not included in our analyses.
Results and discussion
Ion-current anisotropy
In our experiments, the concentration inside the pipette, [Cin], was smaller than the concentration in the external reservoir, [Cout]. Under circumstances in which there is an effective surface charge on the pipette, the ions of the opposite charge govern the direction of electroosmotic flow (EOF). When there is a positive effective surface potential, EOF will therefore be driven by anions. When the reservoir voltage is positive relative to that in the pipette, the less concentrated solution will be drawn out of the pipette, whereas when the reservoir voltage is negative relative to that in the pipette, the more concentrated solution will be drawn into the pipette. Based on the fact that [Cout]>[Cin], in this situation |I(V)| < |I(−V)|. In contrast, when the effective surface potential is negative, cations will drive EOF, and so |I(V)| > |I(−V)|. We characterize the asymmetry in the I–V curves using the ion-current anisotropy,29 which is given by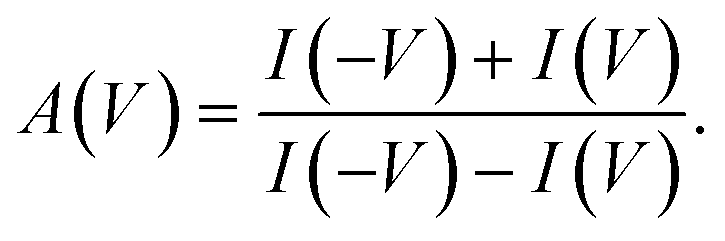 | (1) |
Fig. 1 summarizes the A(2V) values for solutions of LiClO4, LiBF4, LiPF6, and NaClO4 at different concentrations in MeCN, as reported previously.29 In all cases the effective surface potential is negative at low electrolyte concentrations, and crosses zero at higher concentrations. For all electrolytes, the effective surface potential becomes positive at even greater electrolyte concentrations, before decreasing.
 | ||
| Fig. 1 Ion-current anisotropy values, A(2V), for the four electrolytes studied here in MeCN at the silica interface. The sets of concentrations are given as [Cin]/[Cout]. The error bars represent one standard deviation. Measurements for 50 mM/500 mM were made for LiBF4 only, and measurements for 250 mM/1.25 M were made for LiBF4 and NaClO4 only. These data are taken from ref. 29. | ||
Lithium perchlorate
We begin with a brief summary of our previous results for LiClO4 solutions in MeCN at the silica interface.29 In neat MeCN, the cyano groups in the second sublayer of the surface bilayer create a negative effective surface potential. The strong VSFG signal for the symmetric methyl stretch under SSP polarization conditions in this largely centrosymmetric system arises because the methyl groups in the molecules in the two different sublayers have different transition frequencies due to inductive effects from cyano groups accepting hydrogen bonds in molecules in the first sublayer, as we have discussed in detail previously.31 The signal for the asymmetric methyl stretch under SSP polarization conditions is more than two orders of magnitude smaller than that for the symmetric methyl stretch, so the width, shift, and intensity of the symmetric stretch peak are a sensitive probe of the organization at the interface.At LiClO4 concentrations of ∼3 × 10⁻⁶ M and less (which we denote Region I for this salt), the VSFG signal increases as compared to that of the neat liquid, but the peak does not shift or broaden. These observations suggest that the lithium ions partition to the outside of the surface bilayer to some extent, which leads to a few percent increase in the VSFG signal due to slight reorganization of the molecules in the second sublayer.
At LiClO4 concentrations between ∼3 × 10⁻⁶ M and ∼3 × 10⁻⁴ M (Region II), the VSFG signal begins to drop, although the spectra still do not shift or broaden. The effective surface potential goes to zero at the high end of this concentration range, suggesting that the lithium ions on the outside of the surface bilayer have compensated the negative charges on the cyano groups in the second sublayer. Only at this point does it become thermodynamically favourable for lithium ions to partition to the silica surface, and for the perchlorate anions thereby to enter the surface bilayer. This partitioning to the silica surface is manifested in Region III (from ∼3 × 10⁻⁴ M to ∼3 × 10⁻² M) by the effective surface potential becoming positive, the VSFG intensity decreasing further, and the spectra beginning to shift and broaden. The shift and broadening arise from the presence of anions in the interior of the bilayer, driving a Stark shift and decreasing the difference in the methyl transition frequencies between the two sublayers. At concentrations above ∼3 × 10⁻² M (Region IV), the spectra continue to shift and lose intensity, whereas the width reaches a peak and then decreases once all of the methyl groups in the interior of the first bilayer are in the vicinity of anions. There is an accompanying decrease in the effective surface potential.
MD simulations of a 1 M LiClO4 solution in MeCN at a silica interface supported this picture. The organization imposed in the liquid by the silica interface is almost unchanged by the presence of the concentrated electrolyte, as evidenced by comparisons of the density profile, the orientational profile, and the electrical potential as a function of distance from the interface with those for the neat liquid. Furthermore, the organization of the liquid dictates the positions of the ions, with prominent Li+ density peaks at the silica surface and at the outside of the surface bilayer, and an even larger anion density peak in the middle of the first bilayer. There is additional structuring in the ion-density peaks associated with the lower-fidelity bilayers observed at greater distances from the silica surface.
Although it is expensive computationally to perform simulations at electrolyte concentrations much smaller than 1 M, much less over the broad range of concentrations we studied experimentally, the information from simulations of the neat liquid and the 1 M solution at the silica interface is invaluable from multiple perspectives. First, these simulations support the model of concentration-dependent behaviour in this system that was proposed based on our VSFG experiments. Second, the simulations show unequivocally that the EDL model does not describe this system at such a high electrolyte concentration, and presumably does not describe the system at any electrolyte concentration. Third, the simulations not only support the idea that the liquid organization creates preferred regions for cations and anions, but also reveals where those locations are. Finally, as discussed above, the simulations demonstrate that the density, charge density, electric field, and electrical potential are virtually unchanged between the neat liquid and a 1 M solution of LiClO4 in MeCN.
A number of publications in recent years have probed how EDL effects influence VSFG spectra, particularly in aqueous solutions.53–55 The assumption in all of these studies is that the electric field decreases exponentially with distance from the interface according to the Debye length, meaning that any χ(3) contribution to the VSFG spectrum must also depend on concentration. Our simulation results indicate that the electric field is virtually unaffected by the presence of 1 M LiClO4, which suggests that any contribution of the third-order susceptibility, χ(3), to the VSFG spectrum has little to no dependence on the concentration of this electrolyte. Furthermore, the fact that the electric field actually exhibits oscillatory behaviour with distance from the interface in this system suggests that χ(3) effects are likely to be unimportant.
These experiments and simulations paint a picture that is inconsistent with the EDL model. The LBL organization of MeCN at the silica interface is remarkably thermodynamically stable, and has been shown to persist even at elevated temperature56 and in the presence of a large mole fraction of water.57 The persistence of this organization in the presence of electrolytes, up to high concentrations, suggests that a new paradigm is needed to understand the nanoscale organization of ions at interfaces between polar surfaces and polar aprotic solvents. To address this problem, we next consider anions and cations of different sizes.
Lithium tetrafluoroborate
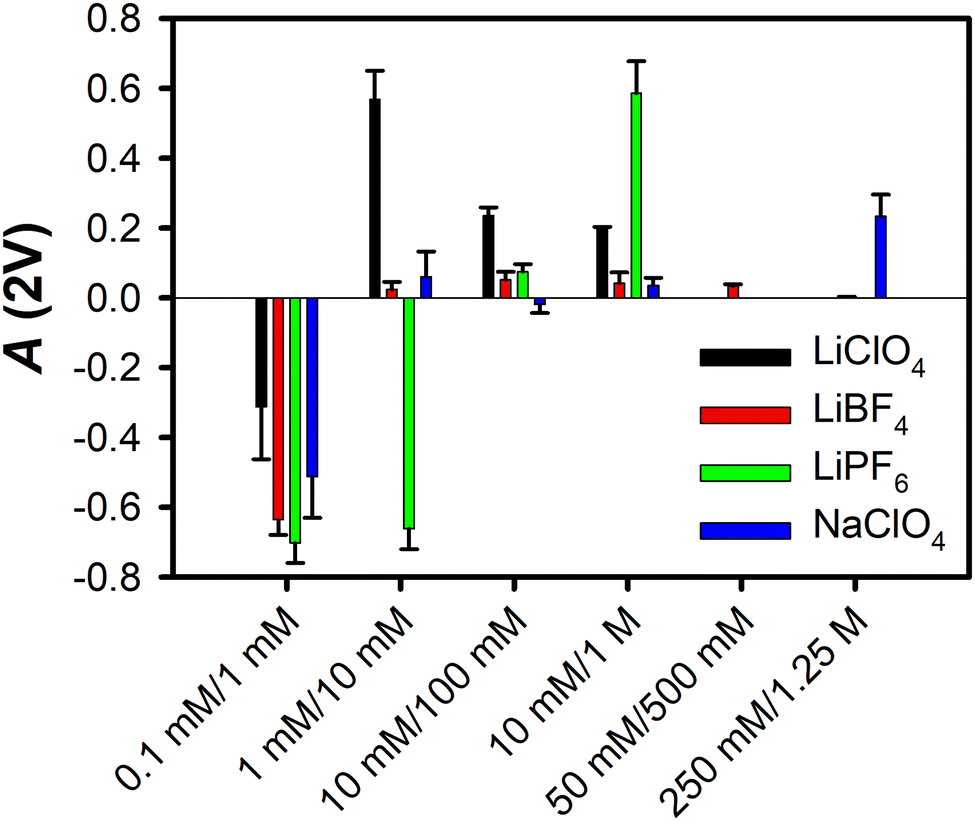
The tetrafluoroborate anion is only slightly smaller than the perchlorate anion (Table 1), and so it may be marginally more favourable to insert the former anion into the surface bilayer of the liquid. As shown in Fig. 1, the effective surface potential at the MeCN–silica interface is negative at low concentrations of LiBF4, and becomes only weakly positive as the concentration is increased, in contrast to the behaviour of solutions of LiClO4.Fig. 2a and b show the VSFG spectra and normalized VSFG spectra, respectively, for neat MeCN and for different concentrations of LiBF4 in MeCN at the silica interface. The spectral changes as a function of concentration are summarized in Fig. 2c, d and e for the intensity relative to that of the neat liquid, the spectral shift relative to that of the neat liquid, and the full width at half maximum (FWHM), respectively. Region I, in which there is a slight increase in the VSFG intensity without any appreciable shift or change in the FWHM, extends up to a concentration of approximately 3 × 10⁻⁶ M, as was the case for solutions of LiClO4.29 Region II, in which the VSFG intensity drops without any peak shift or broadening, ranges between ∼3 × 10⁻⁶ M and ∼3 × 10⁻⁴ M, also akin to the case for solutions of LiClO4.29 Region III, in which the VSFG spectrum begins to shift and broaden and the intensity continues to decrease, spans from ∼3 × 10⁻⁴ M and ∼3 × 10⁻¹ M, an order of magnitude greater range than for Region III in solutions of LiClO4.29 In Region IV, at concentrations of ∼3 × 10⁻¹ M and higher, the VSFG spectrum continues to become weaker and to shift, but there is no further broadening. In contrast to high-concentration LiClO4 solutions, the FWHM does not decrease with increasing concentration, at least up to the highest concentration tested, 3 M. The maximum shift observed is smaller in LiBF4 solutions than in LiClO4 solutions.29
 | ||
| Fig. 2 Symmetric methyl stretch VSFG data under SSP polarization conditions and MD simulations for different concentrations of LiBF4 in MeCN at the silica interface. (a) Absolute spectra and (b) normalized spectra. (c) Intensities relative to that of the neat liquid, (d) spectral shift relative to the neat liquid, and (e) full-width at half maximum, all as a function of electrolyte concentration. The dashed lines indicate the value for the neat liquid, and the grey regions indicate the uncertainty in this value. Error bars are one standard deviation, based on multiple measurements. Profiles derived from MD simulations for (f) the density of MeCN and the ions, (g) the cosine of the average orientational angle of MeCN (where θ = 0 indicates a cyano group that points towards the silica), and (h) the electric potential, all as a function of the distance of the methyl transition dipole from the silica surface. The grey regions indicate the approximate extent of the surface bilayer. | ||
These observations are consistent with the idea that the cation dominates the behaviour of solutions of both LiClO4 and LiBF4 in Regions I and II. The somewhat smaller size of the tetrafluoroborate anion as compared to the perchlorate anion may play some role in the effective surface potential never becoming significantly positive in LiBF4 solutions in MeCN. A potentially more significant contributor to this phenomenon is that LiBF4 tends to ion pair in MeCN at concentrations in the mM range.58 These effects together likely account for the differences in the ion-current and VSFG data between LiClO4 solutions and LiBF4 solutions in Regions III and IV. Ion pairs in the hydrophobic region of the surface bilayer would generate a smaller Stark shift than anions alone, and would potentially minimize any excess of cations partitioned to the surface bilayer at high electrolyte concentrations.
Our MD simulations support these conclusions. Fig. 2f shows the density profiles of neat MeCN and MeCN in the presence of 1 M LiBF4. The density profiles of the ions are shown as well. As was the case for LiClO4, neither the density profile nor the orientational profile (Fig. 2g) shows any substantial effect from the presence of 1 M LiBF4. In LiClO4, the lithium ions inside the bilayer partition to the silica surface, and the anions are closer to the centre of the bilayer, although there is some asymmetry due to the acceptance of hydrogen bonds from surface silanol groups.29 The anion density inside the bilayer is higher than the cation density, but a second cation peak at the exterior of the surface bilayer causes the total effective surface potential to be positive.29 Due to the size of tetrafluoroborate and to ion pairing, the BF4− ions in the surface bilayer can get closer to the silica surface than can ClO4− ions, and so the BF4− density peak is at almost the same position as that for the Li+ ions. The anion peak inside the bilayer is considerably higher than the cation peak, and is also substantially higher than the corresponding anion peak in 1 M LiClO4,29 whereas the cation peaks are of similar heights. The total density of anions within the bilayer in 1 M LiBF4 is higher than in 1 M LiClO4,29 whereas the total density of cations in the bilayer is lower. At this concentration, there are also fewer cations at the outside of the surface bilayer in 1 M LiBF4 than in 1 M LiClO4.29 These factors collectively account for the vanishingly small positive surface potential in 1 M LiBF4 as compared to 1 M LiClO4. There is more structure in the ion-density profiles beyond ∼6 Å from the surface in 1 M LiBF4 than for 1 M LiClO4, but the strong similarity in the profiles for the lithium and tetrafluoroborate density profiles is likely indicative of ion pairing. Finally, as shown in Fig. 2h, the presence of 1 M LiBF4 causes little change in the electrical potential profile as compared to that of the neat liquid at the same interface.
Lithium hexafluorophosphate
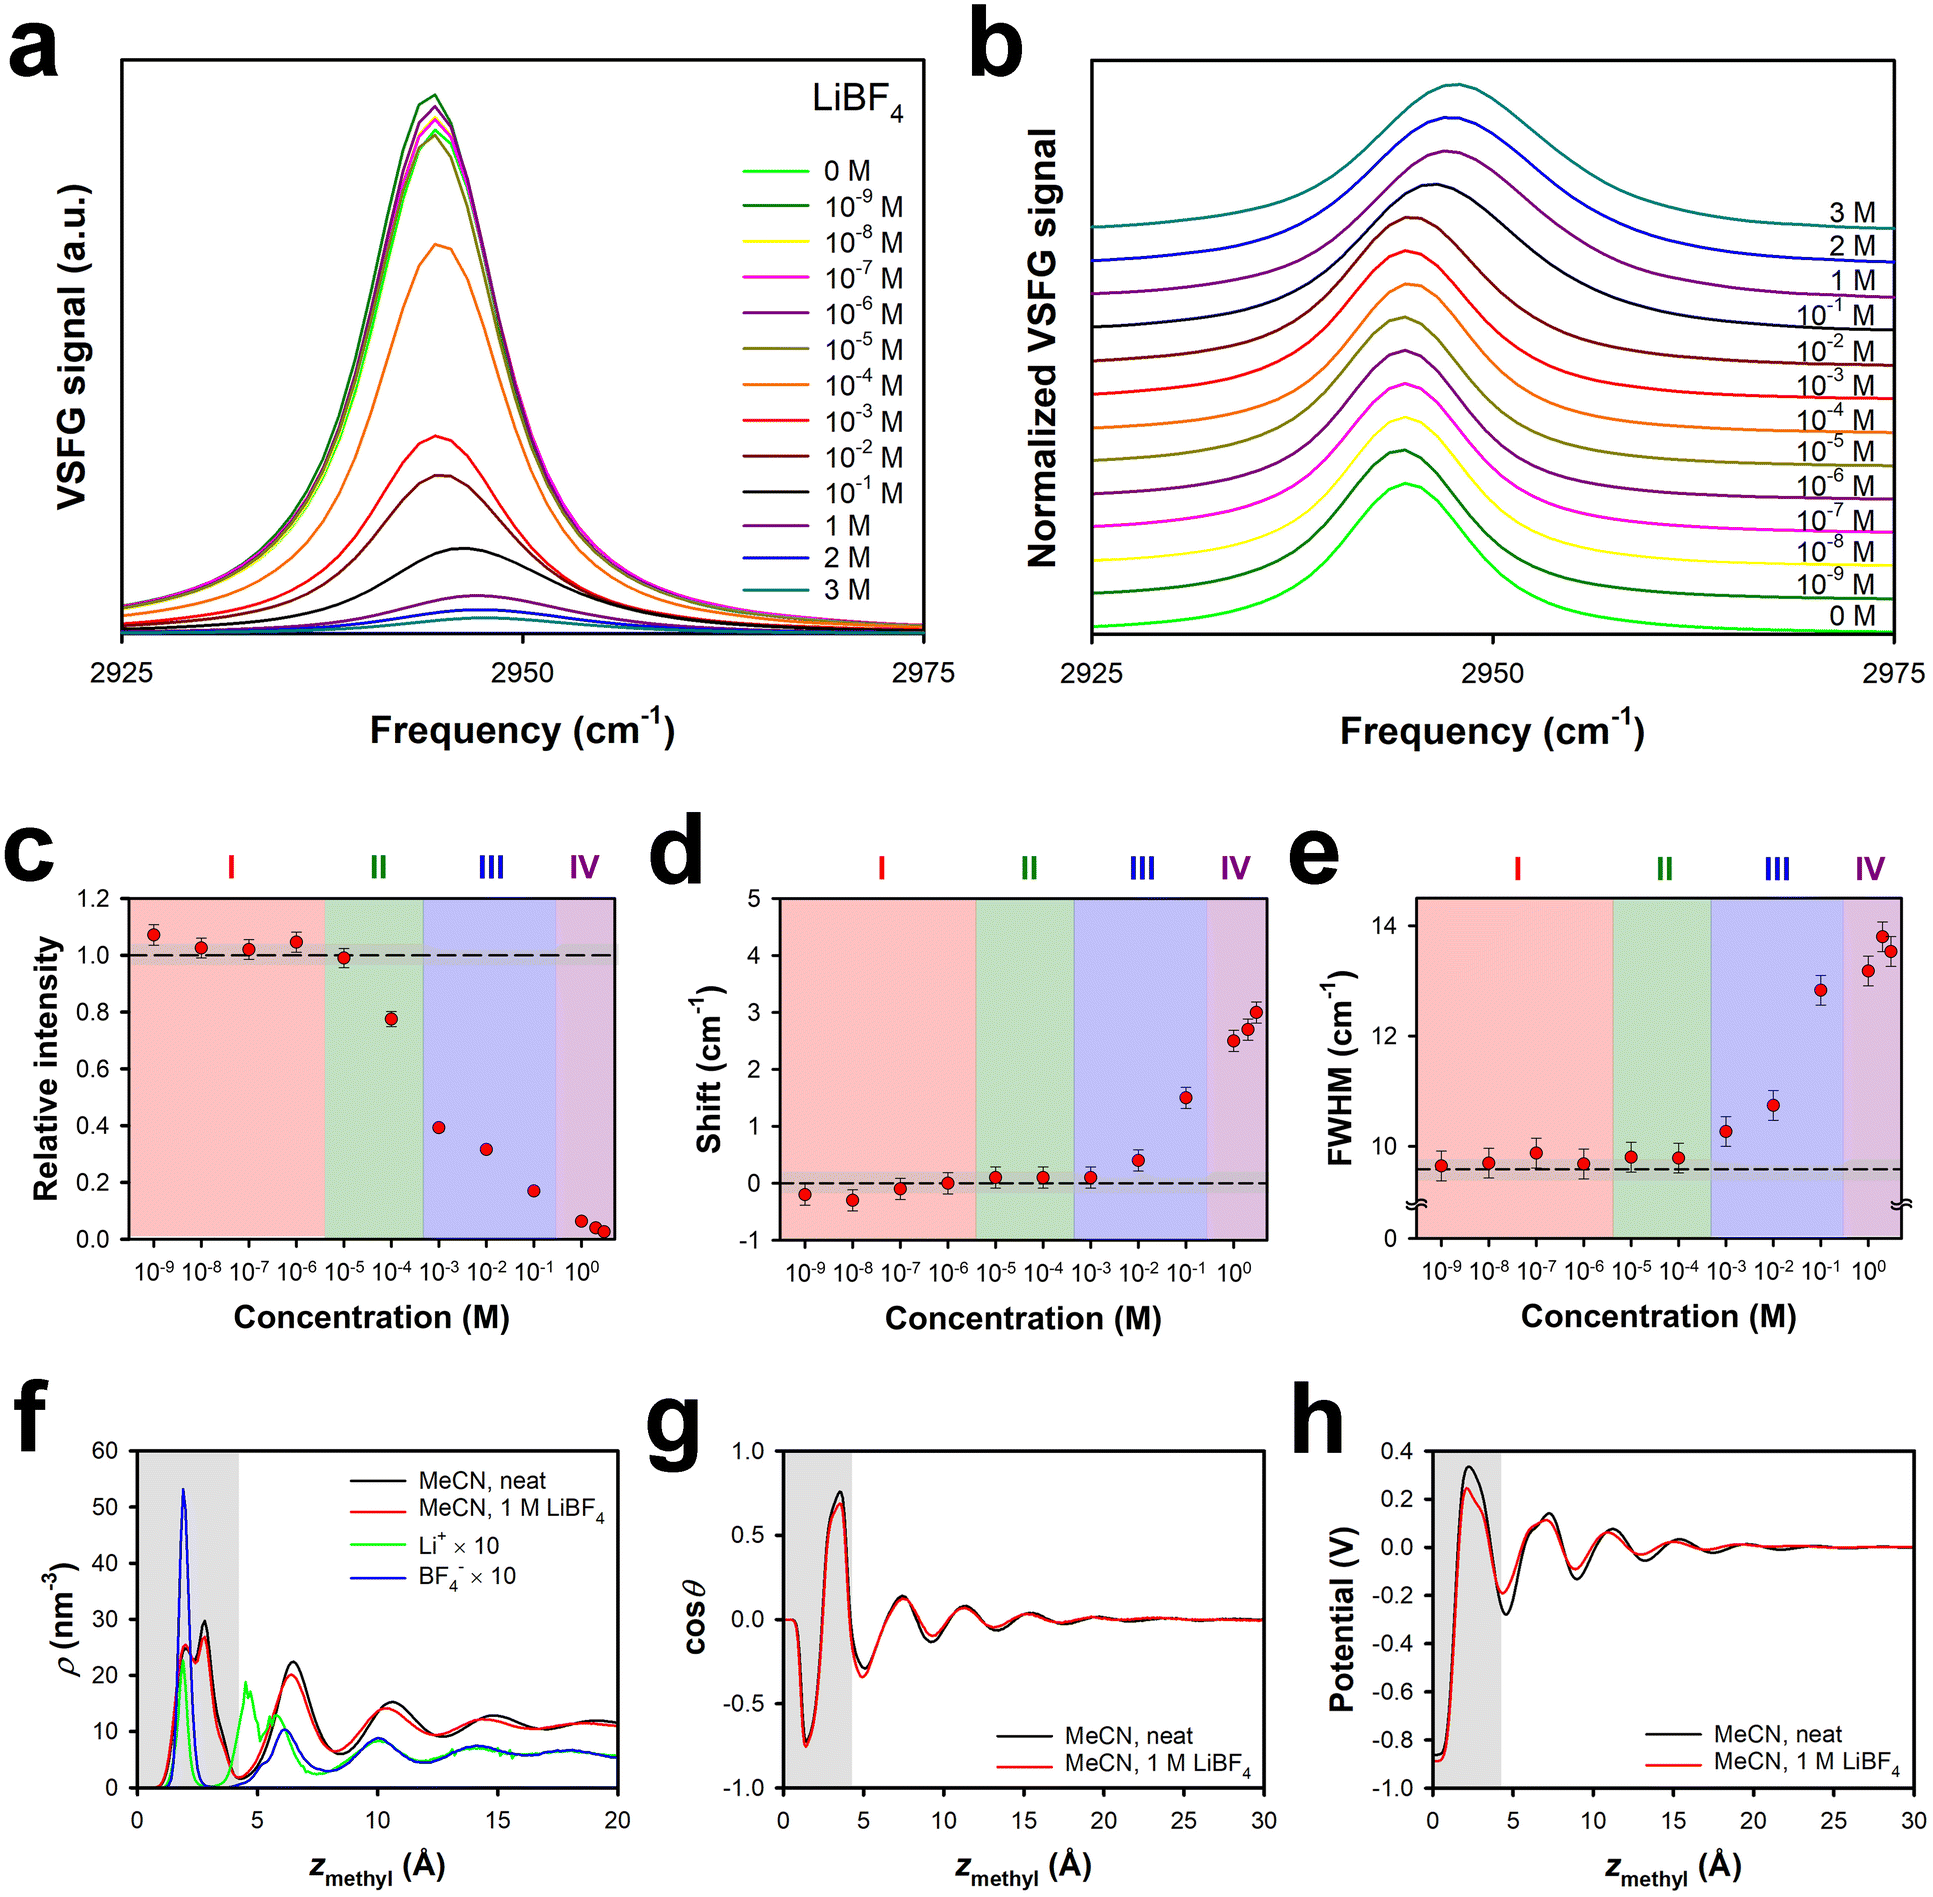
As shown in Fig. 1, LiPF6 in MeCN exhibits a negative effective surface potential at the silica interface at up to an order of magnitude higher concentration than for LiClO4. At high enough concentrations, however, the effective surface potential for LiPF6 solutions becomes positive, with a larger value of A(2 V) than for any of the other electrolytes studied here. These results suggest that the fact that the hexafluorophosphate anion is considerably larger than the others studied here (Table 1) increases the energetic penalty for this ion to enter the surface bilayer, such that this process occurs at a higher concentration.The VSFG spectra for solutions of this electrolyte, which are shown in Fig. 3a, and normalized in Fig. 3b, support this picture, as can be seen from spectral parameters in Fig. 3c, d and e. In Region I the intensity is slightly higher than, or similar to, that for the neat liquid, but there is no spectral shift or broadening. This region extends up to ∼3 × 10⁻⁵ M for LiPF6, an order of magnitude higher than for LiClO4 and LiBF4. Region II, in which the intensity begins to decrease but there is still no shift or broadening, extends from ∼3 × 10⁻⁵ M to ∼3 × 10⁻³ M, which is again an order of magnitude higher than for LiClO4 and LiBF4. Region III, in which a spectral shift and broadening first become apparent, is also shifted upwards by an order of magnitude in concentration as compared to in LiClO4 and LiBF4 solutions, extending from ∼3 × 10⁻³ M to ∼3 × 10⁻¹ M. In Region IV, at concentrations of ∼3 × 10⁻¹ M up, the shift becomes as large as that for LiClO4, and the FWHM begins to increase substantially.
 | ||
| Fig. 3 Symmetric methyl stretch VSFG data under SSP polarization conditions and MD simulations for different concentrations of LiPF6 in MeCN at the silica interface. (a) Absolute spectra and (b) normalized spectra. (c) Intensities relative to that of the neat liquid, (d) spectral shift relative to the neat liquid, and (e) full-width at half maximum, all as a function of electrolyte concentration. The dashed lines indicate the value for the neat liquid, and the grey regions indicate the uncertainty in this value. Error bars are one standard deviation, based on multiple measurements. Profiles derived from MD simulations for (f) the density of MeCN and the ions, (g) the cosine of the average orientational angle of MeCN (where θ = 0 indicates a cyano group that points towards the silica), and (h) the electric potential, all as a function of the distance of the methyl transition dipole from the silica surface. The grey regions indicate the approximate extent of the surface bilayer. | ||
This picture is again supported by our MD simulations. Shown in Fig. 3f are density profiles for neat MeCN and 1 M LiPF6 in MeCN at the silica interface, along with the density profiles of the ions; note that the vertical scale is smaller than in Fig. 2f. Once again, the presence of 1 M electrolyte has a negligible effect on the MeCN density profile. Remarkably, the ion-density profiles inside the surface bilayer are roughly an order of magnitude smaller than for 1 M LiClO4 or 1 M LiBF4. The ratio of anions to cations within the bilayer is 1.08 in 1 M LiPF6, as compared to 2.42 in LiClO4 and 1.77 in LiBF4. These observations all indicate that the thermodynamic penalty for introducing the hexafluorophosphate anion into the surface bilayer has a dominant effect on the partitioning of the electrolyte into this bilayer. There is a substantial cation density peak outside of the first bilayer, which accounts for the positive surface potential. There is a sizeable anion peak in the second bilayer, and the cation and anion densities track one another more closely in moving farther from the interface. As shown in Fig. 3g and h, the orientational profile and electrical potential profiles are again virtually unchanged from those in the neat liquid at this interface.
Sodium perchlorate
It is also of interest to explore the role that the cation plays in the effective surface potential. Electrolytes that are highly soluble in polar aprotic solvents tend to have small cations (typically Li+) and large anions.59 Nevertheless, sodium salts, such as sodium perchlorate, can also have substantial solubilities. Our previously-reported ion-current data indicated that the effective surface potential is negative at low concentrations of NaClO4 in MeCN, is near zero for a broad range of intermediate concentrations, and then becomes moderately positive at high concentrations.29 These results are suggestive of a substantial energetic penalty for Na+ entering the surface bilayer as compared to Li+.VSFG spectra for NaClO4 in MeCN at the silica interface are shown in Fig. 4a, and normalized spectra are shown in Fig. 4b. Based on the spectral parameters in Fig. 4c, d and e, the different Regions are shifted to roughly an order of magnitude higher concentration than in LiClO4 and LiBF4, in analogy to the results for LiPF6. The maximum spectral shift and FWHM are comparable to those in LiClO4, but in the range of concentrations studied, the FWHM of the spectra does not decrease. These results are consistent with the idea that the size of the Na+ ion (Table 1) prevents this species from entering the surface bilayer until the ion attains a higher concentration than the concentration at which Li+ can enter the surface bilayer.
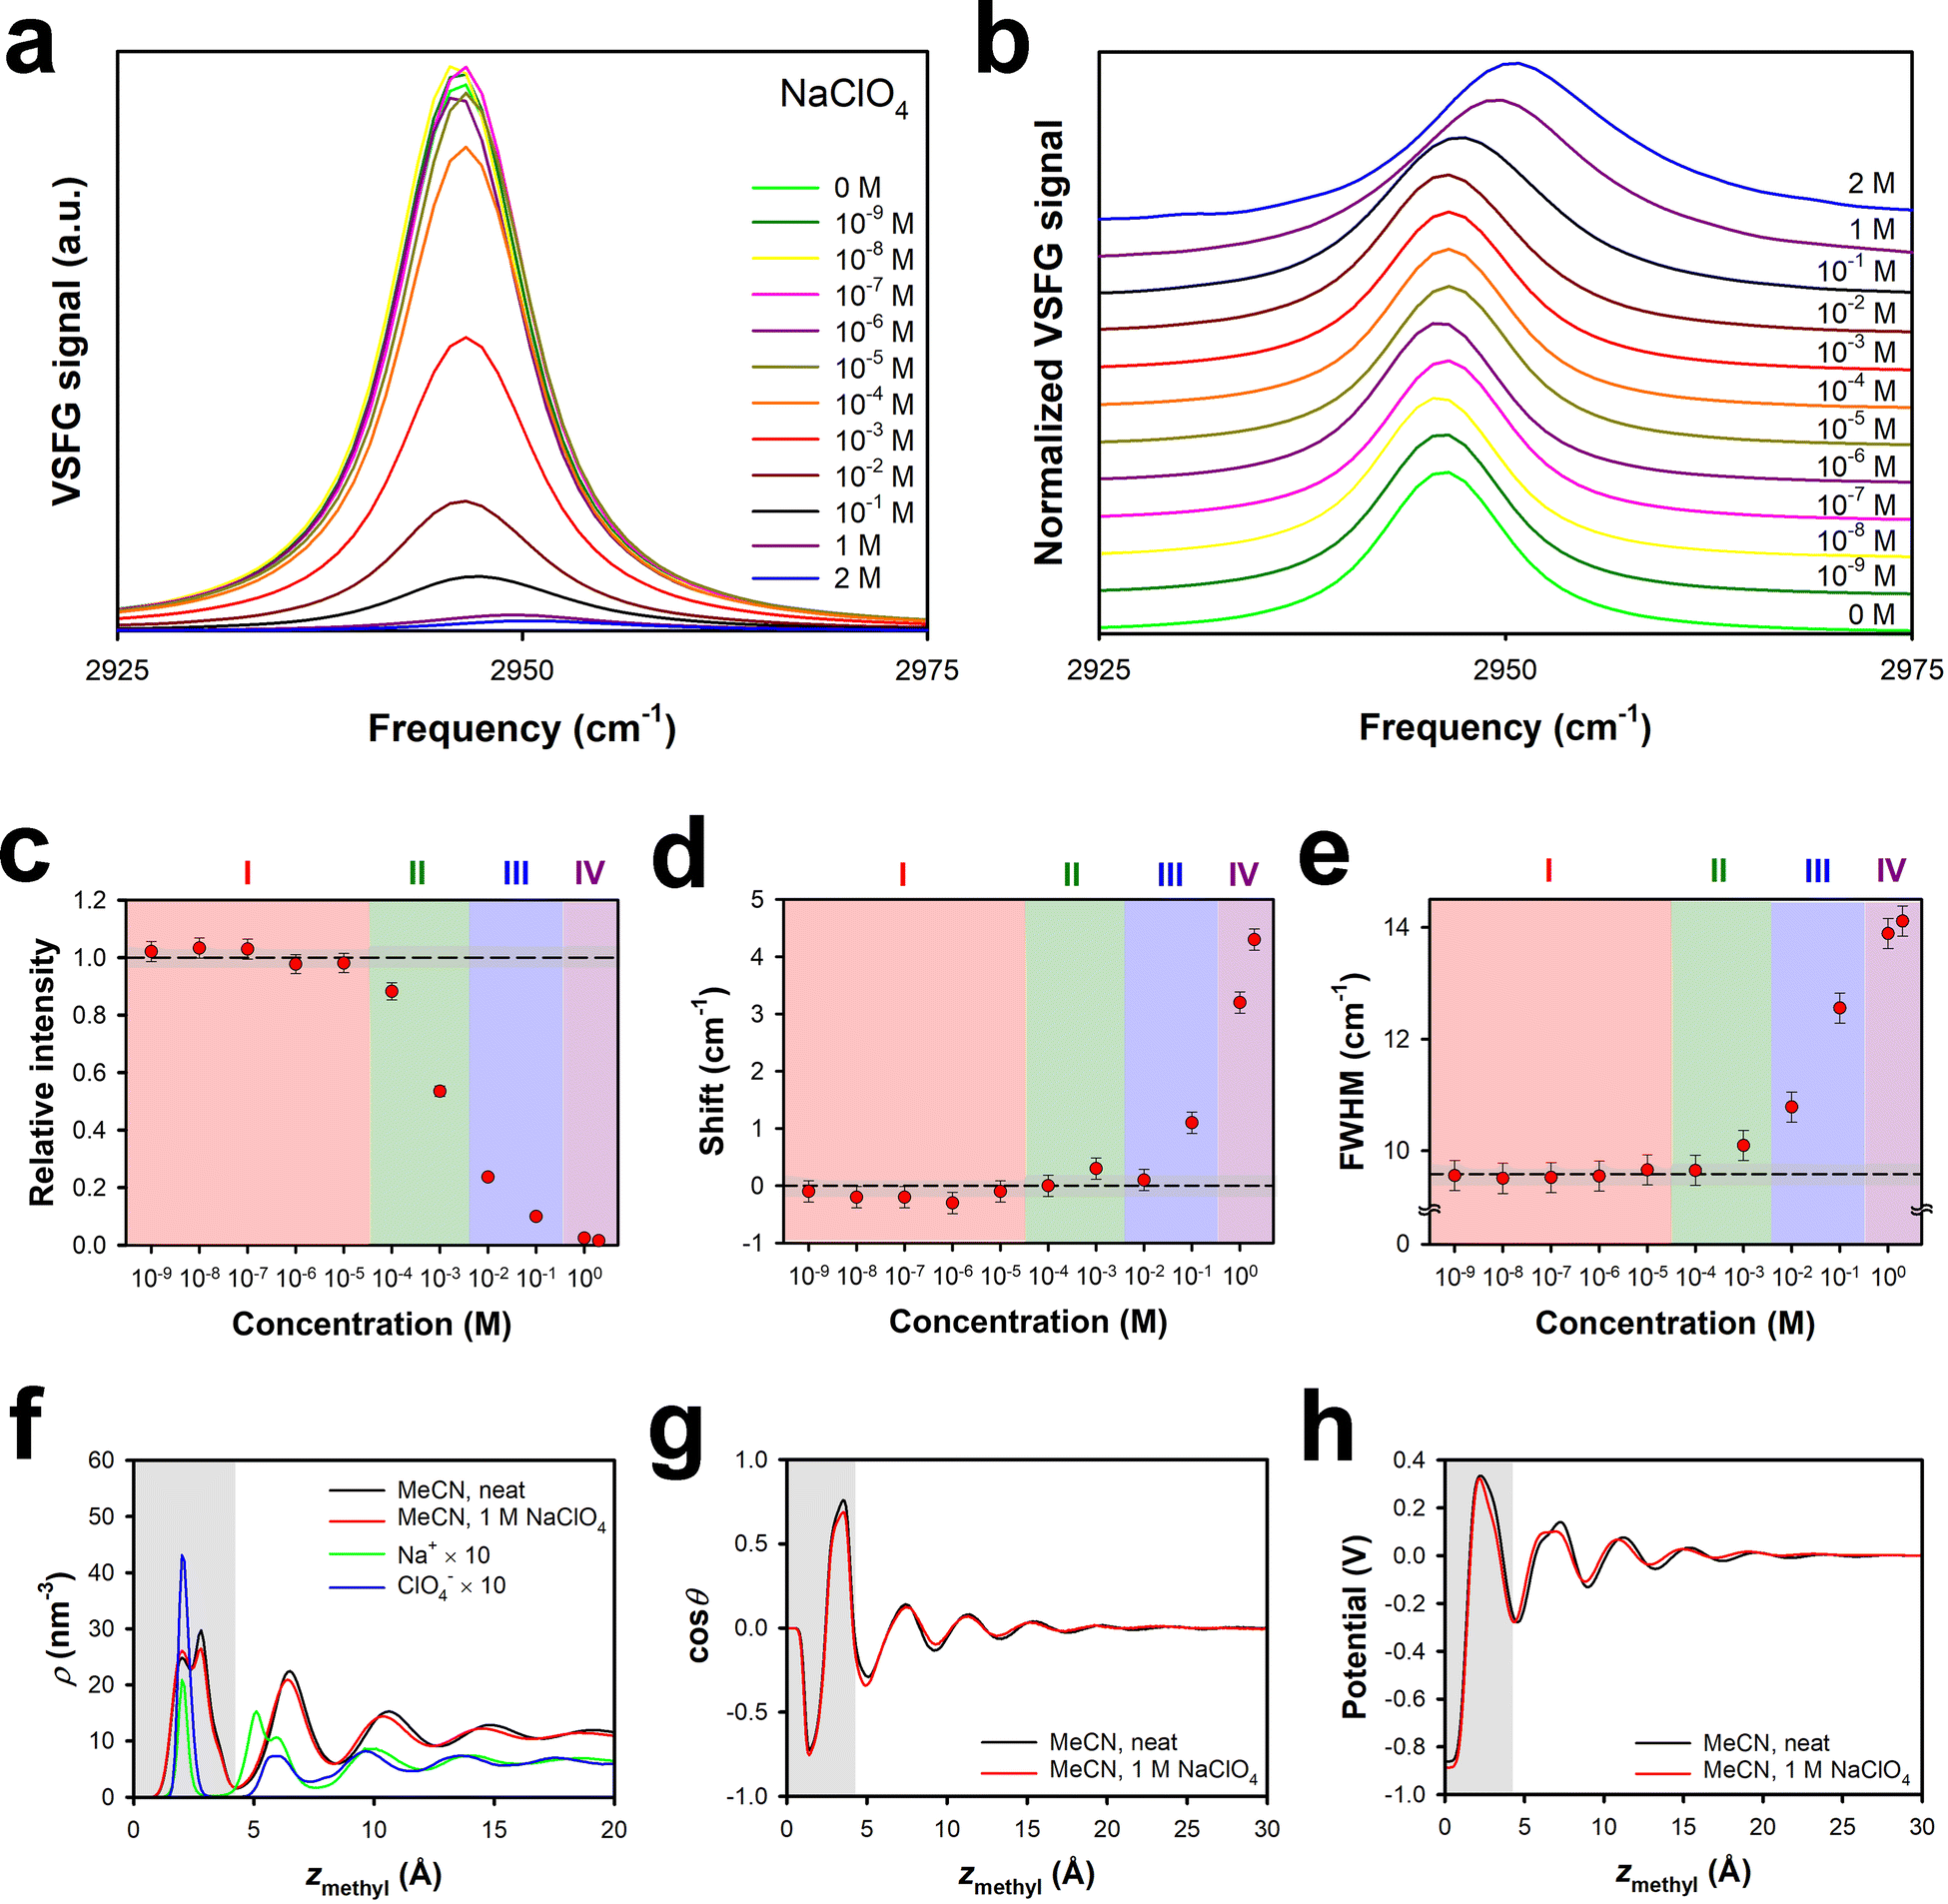 | ||
| Fig. 4 Symmetric methyl stretch VSFG data under SSP polarization conditions and MD simulations for different concentrations of NaClO4 in MeCN at the silica interface. (a) Absolute spectra and (b) normalized spectra. (c) Intensities relative to that of the neat liquid, (d) spectral shift relative to the neat liquid, and (e) full-width at half maximum, all as a function of electrolyte concentration. The dashed lines indicate the value for the neat liquid, and the grey regions indicate the uncertainty in this value. Error bars are one standard deviation, based on multiple measurements. Profiles derived from MD simulations for (f) the density of MeCN and the ions, (g) the cosine of the average orientational angle of MeCN (where θ = 0 indicates a cyano group that points towards the silica), and (h) the electric potential, all as a function of the distance of the methyl transition dipole from the silica surface. The grey regions indicate the approximate extent of the surface bilayer. | ||
This picture is supported by our MD simulations of 1 M NaClO4 in MeCN at the silica interface. As shown in Fig. 4f, the density profile of MeCN is again virtually unaffected by the presence of 1 M NaClO4. The cation density within the bilayer is less than that in 1 M LiClO4,29 but the anion density is comparable. There is also a substantial cation density peak outside of the surface bilayer, which accounts for the positive effective surface potential. At larger distances from the interface, the cation and anion densities are highly correlated, but also oscillate along with the solvent density, which is suggestive of ion pairing. Fig. 4g and h illustrate that the MeCN orientational profile and the electrical potential profile are affected only weakly by the presence of 1 M NaClO4.
Conclusions
Our results demonstrate that the LBL organization imposed on MeCN by a silica surface persists in the presence of all of the electrolytes studied here, even at high concentrations. Furthermore, in contrast to the predictions of the EDL model, the nanoscale organization of the solvent determines the favourable locations for cations and anions, and the sizes and identities of the ions in turn play a large role in determining the concentration dependence of the ion partitioning. The favoured positions of the ions further depend on the identities of cation and the anion collectively. For instance, in the series of lithium salts studied here, the size of the anion has a strong influence on the partitioning of lithium ions into the surface bilayer. In the perchlorate salts, the identity of the cation has a smaller, but still notable, effect on the partitioning of the anion into the surface bilayer. Additionally, recent experiments suggest that in acetonitrile solutions of an electrolyte that contains bulky cations and anions, the silica interface becomes positively charged at an electrolyte concentration of ∼0.2 mM.60 Interestingly, the positive potential was observed to peak at an intermediate concentration.60Our MD simulations indicate that at 1 M concentration, more anions partition into the surface bilayer than do cations for all of the electrolytes studied here, except in the case of LiPF6, for which the amounts of anions and cations inside the surface bilayer are essentially identical. Thus, the combination of the anions within the surface bilayer, the cations on the outside of this bilayer, and the organization of the solvent determines the effective surface potential. The thermodynamically stable surface bilayer effectively takes on the role of the stationary layer from the EDL model.24 The first bilayer is effectively locked in place by hydrogen bonds to molecules in its first sublayer, so the second bilayer is where EOF can occur. Accordingly, at high enough electrolyte concentration, the experimental effective surface potential is positive (or zero) for each of these electrolytes at the MeCN–silica interface, the charge carrier for EOF is the anions in this regime. The density of anions in the second bilayer could therefore serve as a proxy for the magnitude of the effective surface potential for EOF. We indeed observe in our simulations that this density is smallest in the 1 M LiBF4 solution, which has an experimental effective surface potential that is near zero at high concentration, and is largest for the 1 M LiPF6 solution, which has the greatest value of A(2 V) at high concentration.
Our findings suggest that a new model is needed to understand the organization of electrolyte solutions in polar aprotic solvents near polar interfaces. The phenomena observed here could have important implications for a range of applications of such solutions at nanoscale interfaces. For example, LiPF6 is often used as the electrolyte in lithium-ion batteries. Although there are practical reasons for using this salt, our results suggest that a salt with a smaller anion may be preferable in some solvents. Indeed, previous work on lithium–sulphur batteries has shown that LiClO4 has superior discharge cycling behaviour as compared to LiPF6,61 but from a practical standpoint the perchlorate anion is too strong of an oxidant to be used safely. Of course, the details of the organization of the surface bilayer are also highly dependent on the solvent, and solvents that form a thicker surface bilayer may well enable a higher concentration of ions in LiPF6 to partition into this bilayer.
Another example of an application in which the phenomena explored here could have a substantial impact is on ion-selective flow through nanopores. Because the surface bilayer is, in essence, immobile, the effective diameter of a nanopore can be tuned by using appropriate solvents with different surface bilayer thicknesses. Furthermore, simulations have shown that the multiple-LBL organization in MeCN is enhanced in pores.32 A similar phenomenon may occur for other polar aprotic liquids. Stronger organization promotes a correspondingly stronger localization of ions, which could lead to ion-dependent flow properties, which is a prerequisite for ion selectivity.
More work is needed to establish the generality of the phenomenon of interfaces organizing polar aprotic solvents in a manner that determines the favourable locations of ions. It will be important to determine the required characteristics of the interface and of the solvent to drive this behaviour, how the nature of the solvent influences the thickness of the surface bilayer, and what guiding principles determine the positions of ions in specific electrolytes. Answering these questions will require a combination of experiments, simulations, and theory, but could lead to the development of a predictive model for the nanoscale properties of electrolyte solutions in polar aprotic solvents at interfaces.
Author contributions
A. J. S. and J. D. T. performed all of the VSFG experiments. A. J. S. performed the analysis of the VSFG data. M. H. M. performed all of the MD simulations and analysis. J. W. P. performed all of the ion-current measurements and analysis, which were reported previously.29 Z. S. S., N. R. A., and J. T. F. conceptualized and supervised the work, and acquired the funding. All authors contributed to the writing, review, and editing of the paper.Abbreviations
| A(V) | Ion-current anisotropy |
| χ (3) | Third-order susceptibility |
| [Cin] | Electrolyte concentration inside of the pipette |
| [Cout] | Electrolyte concentration outside of the pipette |
| EDL | Electrical double-layer |
| EOF | Electroosmotic flow |
| I | Current |
| LBL | Lipid-bilayer-like |
| PC | Propylene carbonate |
| V | Voltage |
Conflicts of interest
There are no conflicts to declare.Acknowledgements
This work was supported as part of the Center for Enhanced Nanofluidic Transport 2, an Energy Frontier Research Center funded by the U.S. Department of Energy, Office of Science, Basic Energy Sciences at the University of Maryland, the University of Illinois Urbana-Champaign, and the University of California at Irvine under award DE-SC0019112. We thank Shahriar Keshvari for his assistance preparing the TOC graphic.Notes and references
- E. Leontidis, Curr. Opin. Colloid Interface Sci., 2002, 7, 81–91 CrossRef CAS.
- J. B. Edel, A. A. Kornyshev, A. R. Kucernak and M. Urbakh, Chem. Soc. Rev., 2016, 45, 1581–1596 RSC.
- G. Trefalt, I. Szilagyi, G. Téllez and M. Borkovec, Langmuir, 2017, 33, 1695–1704 CrossRef CAS PubMed.
- J. Lyklema, Curr. Opin. Colloid Interface Sci., 2013, 18, 116–128 CrossRef CAS.
- S. S. Zhang, J. Power Sources, 2006, 162, 1379–1394 CrossRef CAS.
- D. Aurbach, Y. Talyosef, B. Markovsky, E. Markevich, E. Zinigrad, L. Asraf, J. S. Gnanaraj and H.-J. Kim, Electrochim. Acta, 2004, 50, 247–254 CrossRef CAS.
- T. S. Bhat, P. S. Patil and R. B. Rakhi, J. Energy Storage, 2022, 50, 104222 CrossRef.
- C. Zhong, Y. Deng, W. Hu, J. Qiao, L. Zhang and J. Zhang, Chem. Soc. Rev., 2015, 44, 7484–7539 RSC.
- F. Bu, W. Zhou, Y. Xu, Y. Du, C. Guan and W. Huang, npj Flex. Electron., 2020, 4, 31 CrossRef.
- Poonam, K. Sharma, A. Arora and S. K. Tripathi, J. Energy Storage, 2019, 21, 801–825 CrossRef.
- R. B. Schoch, J. Han and P. Renaud, Rev. Mod. Phys., 2008, 80, 839–883 CrossRef CAS.
- I. Vlassiouk, S. Smirnov and Z. Siwy, Nano Lett., 2008, 8, 1978–1985 CrossRef CAS.
- H. S. White and A. Bund, Langmuir, 2008, 24, 2212–2218 CrossRef CAS PubMed.
- J. Cervera, B. Schiedt and P. Ramirez, Europhys. Lett., 2005, 71, 35–41 CrossRef CAS.
- Z. S. Siwy and S. Howorka, Chem. Soc. Rev., 2010, 39, 1115–1132 RSC.
- A. Bhattacharya and P. Ghosh, Rev. Chem. Eng., 2004, 20, 111–173 CAS.
- M. Fillet, A.-C. Servais and J. Crommen, Electrophoresis, 2003, 24, 1499–1507 CrossRef CAS.
- S. Faucher, N. Aluru, M. Z. Bazant, D. Blankschtein, A. H. Brozena, J. Cumings, J. Pedro de Souza, M. Elimelech, R. Epsztein, J. T. Fourkas, A. G. Rajan, H. J. Kulik, A. Levy, A. Majumdar, C. Martin, M. McEldrew, R. P. Misra, A. Noy, T. A. Pham, M. Reed, E. Schwegler, Z. Siwy, Y. Wang and M. Strano, J. Phys. Chem. C, 2019, 123, 21309–21326 CrossRef CAS.
- N. R. Aluru, F. Aydin, M. Z. Bazant, D. Blankschtein, A. H. Brozena, J. P. de Souza, M. Elimelech, S. Faucher, J. T. Fourkas, V. B. Koman, M. Kuehne, H. J. Kulik, H.-K. Li, Y. Li, Z. Li, A. Majumdar, J. Martis, R. P. Misra, A. Noy, T. A. Pham, H. Qu, A. Rayabharam, M. A. Reed, C. L. Ritt, E. Schwegler, Z. Siwy, M. S. Strano, Y. Wang, Y.-C. Yao, C. Zhan and Z. Zhang, Chem. Rev., 2023, 123, 2737–2831 CrossRef CAS PubMed.
- R. W. Baker, Membrane Technology and Applications, John Wiley & Sons, Inc., Hoboken, NJ, 3rd edn, 2012 Search PubMed.
- T. Sata, Ion Exchange Membranes: Preparation, Characterization, Modification and Application, The Royal Society of Chemistry, Cambridge, UK, 2004 Search PubMed.
- A. Mehta and A. L. Zydney, J. Membr. Sci., 2005, 249, 245–249 CrossRef CAS.
- J. N. Israelachvili, in Intermolecular and Surface Forces (Third Edition), ed. J. N. Israelachvili, Academic Press, San Diego, 2011, pp. 291–340 Search PubMed.
- J. Wu, Chem. Rev., 2022, 122, 10821–10859 CrossRef CAS.
- M. A. Habib, in Modern Aspects of Electrochemistry, ed. J. O. M. Bockris and B. E. Conway, Plenum Press, New York, 1977, vol. 12, pp. 131–182 Search PubMed.
- S. Trasatti, J. Chem. Soc., Faraday Trans., 1974, 70, 1752–1768 RSC.
- K. Bohinc, V. Kralj-Iglič and A. Iglič, Electrochim. Acta, 2001, 46, 3033–3040 CrossRef CAS.
- M. McEldrew, Z. A. H. Goodwin, A. A. Kornyshev and M. Z. Bazant, J. Phys. Chem. Lett., 2018, 9, 5840–5846 CrossRef CAS PubMed.
- J. W. Polster, A. J. Souna, M. H. Motevaselian, R. A. Lucas, J. D. Tran, Z. S. Siwy, N. R. Aluru and J. T. Fourkas, Nat. Sci., 2022, 2, e20210099 CrossRef CAS.
- B. J. Berne, J. T. Fourkas, R. A. Walker and J. D. Weeks, Acc. Chem. Res., 2016, 49, 1605–1613 CrossRef CAS PubMed.
- F. Ding, Z. Hu, Q. Zhong, K. Manfred, R. R. Gattass, M. R. Brindza, J. T. Fourkas, R. A. Walker and J. D. Weeks, J. Phys. Chem. C, 2010, 114, 17651–17659 CrossRef CAS.
- C. M. Morales and W. H. Thompson, J. Phys. Chem. A, 2009, 113, 1922–1933 CrossRef CAS PubMed.
- R. A. Lucas, C.-Y. Lin and Z. S. Siwy, J. Phys. Chem. B, 2019, 123, 6123–6131 CrossRef CAS PubMed.
- T. Plett, W. Q. Shi, Y. H. Zeng, W. Mann, I. Vlassiouk, L. A. Baker and Z. S. Siwy, Nanoscale, 2015, 7, 19080–19091 RSC.
- L. Yang, B. H. Fishbine, A. Migliori and L. R. Pratt, J. Chem. Phys., 2010, 132, 044701 CrossRef.
- R. D. Shannon, Acta Crystallogr., Sect. A: Cryst. Phys., Diffr., Theor. Gen. Crystallogr., 1976, 32, 751–767 CrossRef.
- Y. Marcus, J. Phys. Chem. B, 2014, 118, 2172–2175 CrossRef CAS.
- F. Ding, Q. Zhong, M. R. Brindza, J. T. Fourkas and R. A. Walker, Opt. Express, 2009, 17, 14665–14675 CrossRef CAS PubMed.
- A. J. Souna, J. S. Bender and J. T. Fourkas, Appl. Opt., 2017, 56, 3875–3878 CrossRef CAS PubMed.
- M. J. Abraham, T. Murtola, R. Schulz, S. Páll, J. C. Smith, B. Hess and E. Lindahl, SoftwareX, 2015, 1–2, 19–25 CrossRef.
- A. M. Nikitin and A. P. Lyubartsev, J. Comput. Chem., 2007, 28, 2020–2026 CrossRef CAS.
- S. R. Cohen, M. Plazanet, S. Rols, D. J. Voneshen, J. T. Fourkas and B. Coasne, J. Mol. Liq., 2022, 348, 118423 CrossRef CAS.
- Z. Hu and J. D. Weeks, J. Phys. Chem. C, 2010, 114, 10202–10211 CrossRef CAS.
- A. J. Souna, S. R. Cohen, C. A. Rivera, K. Manfred, B. Coasne and J. T. Fourkas, J. Mol. Liq., 2023, 375, 121315 CrossRef CAS.
- B. Doherty, X. Zhong, S. Gathiaka, B. Li and O. Acevedo, J. Chem. Theory Comput., 2017, 13, 6131–6145 CrossRef CAS.
- S. V. Sambasivarao and O. Acevedo, J. Chem. Theory Comput., 2009, 5, 1038–1050 CrossRef CAS.
- S. Nosé, J. Chem. Phys., 1984, 81, 511–519 CrossRef.
- M. Parrinello and A. Rahman, J. Appl. Phys., 1981, 52, 7182–7190 CrossRef CAS.
- A. A. Chialvo and P. T. Cummings, Adv. Chem. Phys., 1999, 109, 115–205 CrossRef CAS.
- U. Essmann, L. Perera, M. L. Berkowitz, T. Darden, H. Lee and L. G. Pedersen, J. Chem. Phys., 1995, 103, 8577–8593 CrossRef CAS.
- I.-C. Yeh and M. L. Berkowitz, J. Chem. Phys., 1999, 111, 3155–3162 CrossRef CAS.
- S. H. Lee and P. J. Rossky, J. Chem. Phys., 1994, 100, 3334–3345 CrossRef CAS.
- E. Ma, P. E. Ohno, J. Kim, Y. Liu, E. H. Lozier, T. F. Miller, H.-F. Wang and F. M. Geiger, J. Phys. Chem. Lett., 2021, 12, 5649–5659 CrossRef CAS.
- P. E. Ohno, H.-F. Wang and F. M. Geiger, Nat. Commun., 2017, 8, 1032 CrossRef PubMed.
- G. Gonella, C. Lütgebaucks, A. G. F. de Beer and S. Roke, J. Phys. Chem. C, 2016, 120, 9165–9173 CrossRef CAS.
- A. J. Souna, T. L. Clark and J. T. Fourkas, J. Phys. Chem. C, 2017, 121, 26432–26437 CrossRef CAS.
- C. A. Rivera, J. S. Bender, K. Manfred and J. T. Fourkas, J. Phys. Chem. A, 2013, 117, 12060–12066 CrossRef CAS PubMed.
- D. M. Seo, O. Borodin, D. Balogh, M. O'Connell, Q. Ly, S.-D. Han, S. Passerini and W. A. Henderson, J. Electrochem. Soc., 2013, 160, A1061–A1070 CrossRef CAS.
- N. Xin, Y. Sun, M. He, C. J. Radke and J. M. Prausnitz, Fluid Phase Equilib., 2018, 461, 1–7 CrossRef CAS.
- E. B. Farrell, D. Duleba and R. P. Johnson, J. Phys. Chem. B, 2022, 126, 5689–5694 CrossRef CAS PubMed.
- J. Gao, M. A. Lowe, Y. Kiya and H. D. Abruña, J. Phys. Chem. C, 2011, 115, 25132–25137 CrossRef CAS.
Footnote |
| † These authors contributed equally to this work, and are listed in the order in which their contributions appear in the manuscript. |
| This journal is © the Owner Societies 2024 |