
 Open Access Article
 This Open Access Article is licensed under a Creative Commons Attribution-Non Commercial 3.0 Unported Licence
Melting of a single ice microparticle on exposure to focused near-IR laser beam to yield a supercooled water droplet†
Shuichi
Hashimoto
 *a and
Takayuki
Uwada
b
*a and
Takayuki
Uwada
b
aAdvanced Engineering Course, NIT Gunma College, 580 Toriba-machi, Maebashi, Guma 371-8530, Japan. E-mail: hashichem@gunma-ct.ac.jp
bDepartment of Chemistry, Josai University, 1-1 Keyakidai, Sakado, Saitama 350-0295, Japan. E-mail: uwada@josai.ac.jp
First published on 18th December 2023
Abstract
We observed for the first time that a single ice microparticle supported on a substrate melted photothermally to form a supercooled water droplet on exposure to tightly focused illumination with a 1064-nm laser beam that generated a point heat source. In situ Raman micro-spectroscopy clearly showed the formation of liquid water at the expense of ice. The observation of this melting is only possible when the experiment is performed with micrometer-sized ice particles. A previous attempt to melt millimeter-sized ice through photothermal heating of gold nanoaggregates fell short of expectations because only vapor formation, rather than liquid water formation, has been postulated. Our observation is significant because thermal confinement in a microscale compartment using a water–air interface as a heat-insulated wall can achieve particle temperatures above the melting point of water, whereas, in an unlimited space of ice, heat transfer from the heating center to the surroundings causes steep temperature decays, resulting in limited temperature increase.
Introduction
Photothermal heating phenomena through light-to-heat conversion at nano- and microscales have attracted considerable attention because there are many potential applications,1 including photothermal cancer therapy and drug delivery.2,3 The concept central to photothermal responses is temporal and spatial propagation of heat generated at a pinpoint location, referred to as heat transfer or heat dissipation.4,5 The heat transferred to the surroundings is the origin of various intriguing phenomena associated with photothermal effects, including temperature shaping,6 temperature confinement,7 and optothermofluidic motions8 (e.g. convections and thermo-diffusions).Photothermal heating-induced small-scale phase transitions have been pursued for the medium adjacent to plasmonic nanoparticles. Notably, the liquid-to-gas phase transition, or boiling of water within several nanometers away from gold nanoparticles (Au NPs), has been elucidated thanks to the feasible detection of nano- and microbubbles through optical scattering imaging and spectroscopy. Both time-dependent and steady-state observations have been made9–15 and the elaborate dynamics of bubbles have been investigated: from early generation (fs–ps) to final collapse (ns–μs);10,11 unusual bathtub-shape Au NP size-dependent laser energy thresholds;11,13 and the onset of bubble generation at spinodal temperature (∼500 K) in superheated water, but not at normal boiling temperature (373 K).15 In contrast, less attention has been paid to the photothermally-induced melting of ice, the solid-to-liquid phase transition of water. In attempting to investigate photothermal ice melting, a major obstacle is the lack of a suitable method to detect the phase change sensitively particularly at small volumes. Additionally, to study the melting transition of water, temperature control is required for optical microscopy, although photothermal bubbles have been studied at ambient temperature.
Nevertheless, as early as 2006, Richardson and coworkers published a seminal paper describing their attempt to melt ice through photothermal heating of gold nanoaggregates (Au NAs).16,17 However they provided insufficient evidence of liquid water formation as a result of using laser beam illumination on millimeter-sized ice contained in a 3-mm ∅ × 3-mm-depth well. On continuous irradiation with a 532-nm laser, a Raman signal indicative of ice was merely weakened but was not replaced by a new signal indicating the presence of liquid water. They ascribed their observation to the heating-induced sublimation of the ice.
A question arises as to why the sublimation of ice occurs without first melting to the liquid state. Their experimental result is here interpreted differently by proposing that bulk ice acts as a heat sink of infinite volume that immediately quenches heat at interfaces with Au NAs and transfers it to the surrounding area. The greater thermal conductivity of ice (2.2 W m−1 K−1) than that of liquid water (0.6 W m−1 K−1) may facilitate this process. This heat transfer may suppress the melting of ice in the close vicinity of the heating spot. However, if an ice particle of finite volume is used instead of bulk ice, heat transfer may be affected. To investigate this hypothesis, a modeling calculation was performed using the FEM software package COMSOL Multiphysics (https://www.comsol.jp). Fig. 1a shows a geometrical model of the COMSOL calculation. The model consists of a spherical ice particle (d = 2, 10, 20 μm), surrounded by air, within which a 100-nm diameter Au NP was embedded at the center. For comparison, the calculation was also performed with the bulk ice of volume 125![[thin space (1/6-em)]](https://www.rsc.org/images/entities/char_2009.gif) 000 μm3 (50 μm × 50 μm × 50 μm).
000 μm3 (50 μm × 50 μm × 50 μm).
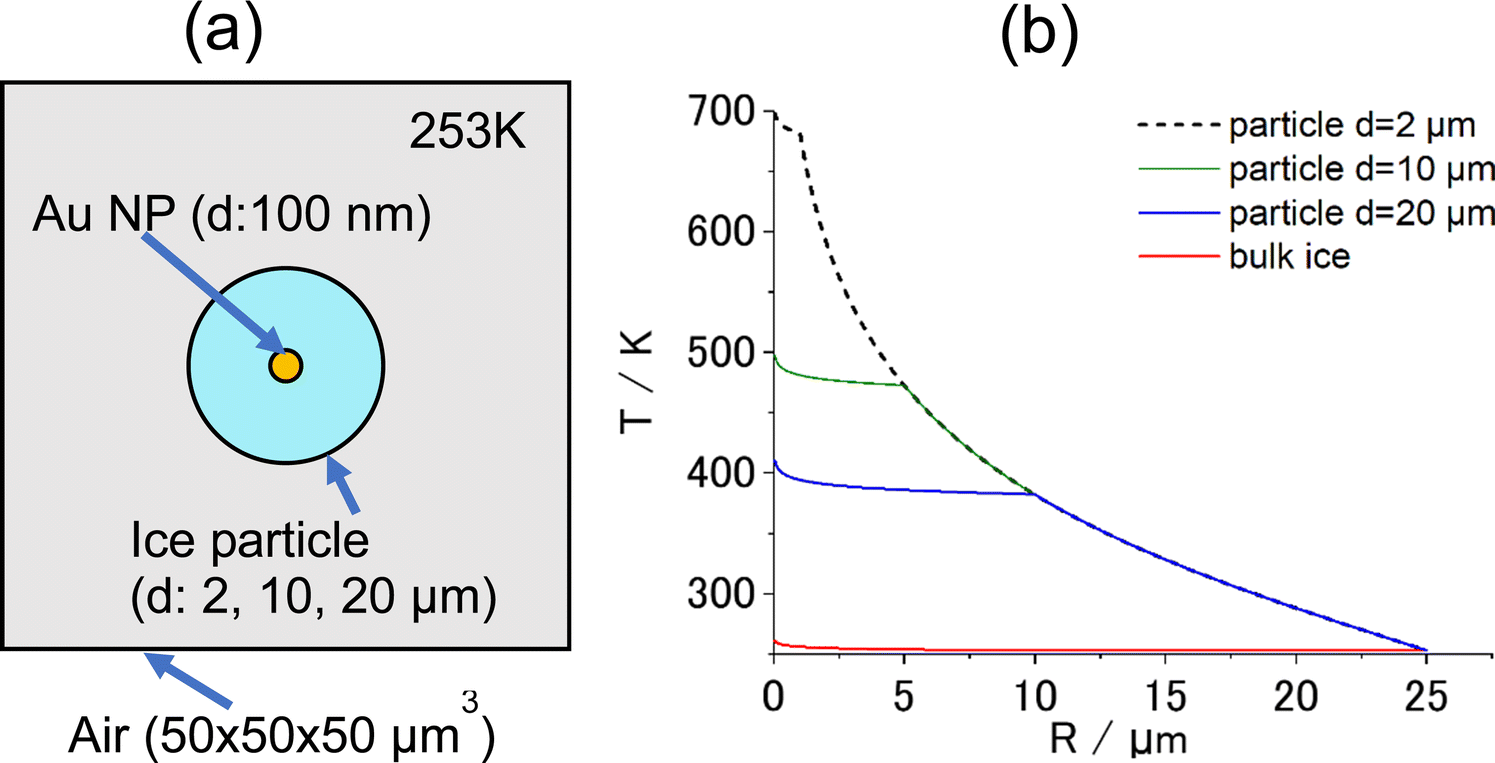 | ||
| Fig. 1 (a) COMSOL calculation geometry. The calculation cell consisted of a cubic air space of volume 50 μm × 50 μm × 50 μm at the center of which were placed spherical ice particles of various radii, including a 100-nm diameter Au NP at the center. The temperature of the cell was set to 253 K (−20 °C). A focused illumination (FWHM of the laser spot: 1.0 μm) with a 532-nm laser beam was performed with a power of 1.0 mW. The latent heat of fusion for ice at 0 °C was considered in the calculation. (b) Curves of calculated temperature, T, vs. distance from the center, R. Temperature discontinuities were observed at the boundary of the water droplet with air. | ||
When the central Au NP is optically heated, radial heat transfer immediately follows from the Au NP to water and then to the air. The resulting steady-state radial temperature distribution is shown in Fig. 1b, from which a number of deductions can be made. Firstly, COMSOL predicts that temperature confinement can be achieved in a droplet levitated in air because of a sudden drop in thermal conductivity at the interface between water (0.6 W m−1 K−1) and air (0.02 W m−1 K−1). Contrastingly, in bulk ice, temperature decayed out at small distances within less than a micrometer from the center. Secondly, smaller-diameter droplets maintain a higher temperature. This suggests that, if the photothermal heating experiment is performed for a Au NP contained a micro-sized ice at temperatures below the freezing temperature, there is a good chance of observing photothermal ice melting under this condition in contrast to bulk ice.
Based on the predictions obtained from the above COMSOL calculation, a microparticle-based photothermal experiment was performed. To mimic the NP-light interaction to generate a point heat source, focused illumination with a NIR laser was employed to generate a microscale heating spot.
Experimental section
The single-particle Raman spectra were measured using the experimental configuration illustrated in Scheme 1. Wavelength resolution was 0.5 nm on a spectrophotometer consisting of a SP-2300i polychromator (Acton Research, MA) with a grating of 300 grooves mm−1 blazed at 500 nm and a CCD camera (DU401-BR-DD; Andor Technology, Belfast, UK; operated at −60 °C), measured through a pinhole (view area: 10-μm diameter). Wavelength calibration of the spectrograph was performed using Ne lines as a reference. A focused 532-nm DPSS laser (GL523T3; Laser Century, Shanghai, China) was used for excitation (3.5 mW) when recording the Raman spectra. The particles were heated by illumination with the focused beam of a 1064-nm CW laser (MIL-H-1064-3W; CNI, Changchun, China) through a microscope objective (60×, NA = 0.70) on an inverted microscope (IX-71; Olympus, Tokyo, Japan). The two laser beams were introduced collinearly using a dual-band dichroic mirror (Edmund Optics Japan, Tokyo). In situ Raman spectra were collected for 100–200 s using 10–20 multiple exposures of 10 s each. The time-dependent spectral evolution was represented by overlaying the spectral signal at every 10 s.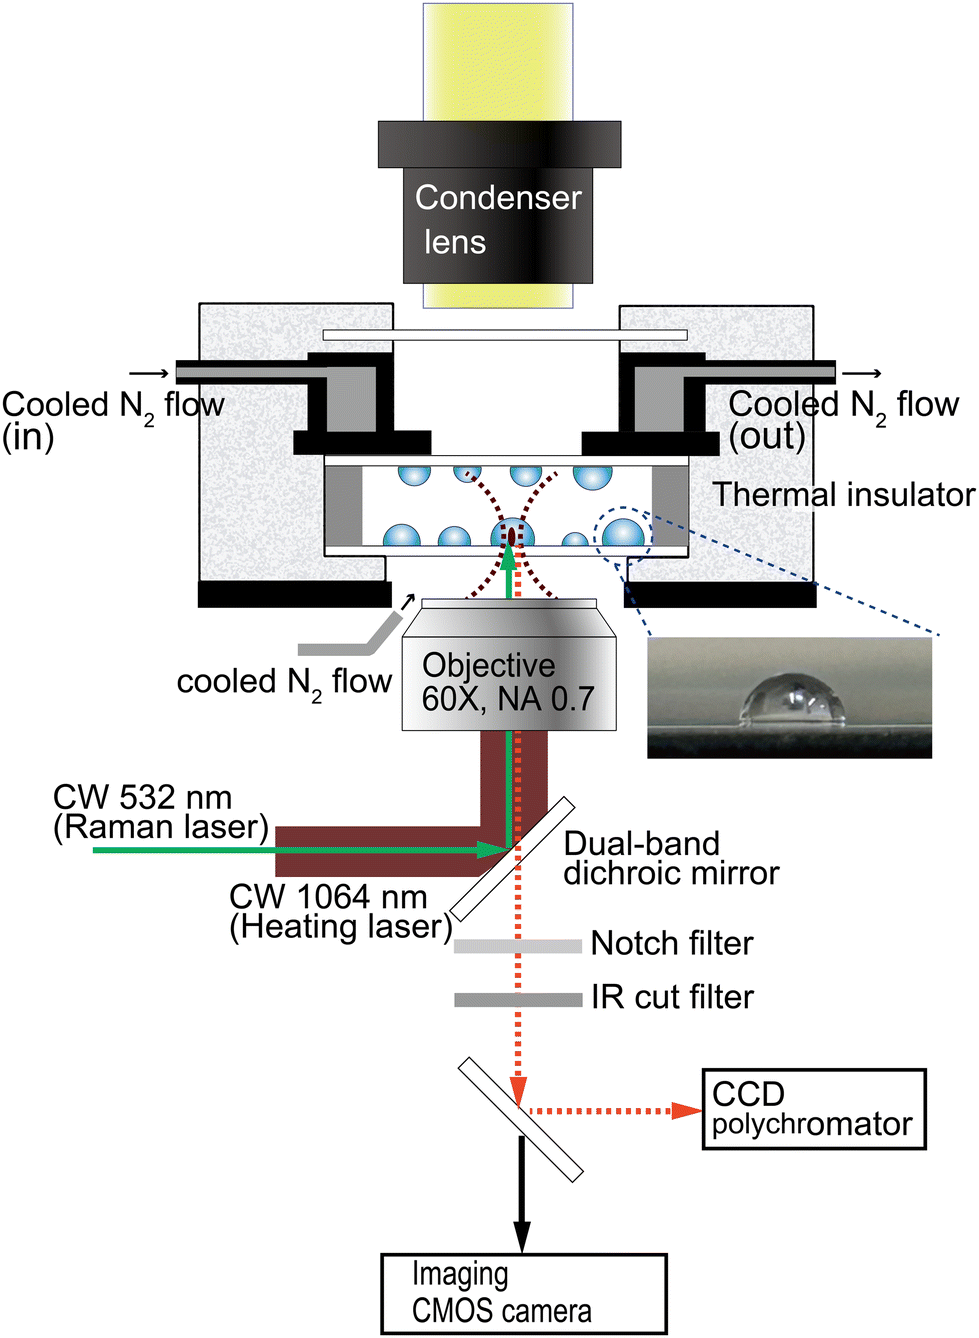 | ||
| Scheme 1 Experimental configuration. | ||
Water droplets were generated from distilled water or 0.1 M aqueous CaCl2 solution using a nebulizer (NESCOSONIC UN-511; Alfresa Farma, Osaka, Japan) and deposited on a 0.17-mm-thick borosilicate cover glass (Matsunami Glass, Osaka, Japan). Hydrophobized glass surfaces were prepared by immersion in a solution of 5% dimethyldichlorosilane (TCI, Tokyo, Japan) in toluene for 30 min and washing copiously with methanol. The lateral view of a hemispherical droplet on the hydrophobized glass surface is shown in the inset of Scheme 1. The droplet-covered surfaces of two cover glasses were opposed using a 0.2-mm-thick silicone spacer, thus containing the droplets within a closed chamber.
Custom-installed dual N2-gas flow lines were used to cool the sample chamber and to minimize fogging. A dry nitrogen stream, cooled by being first passed through a liquid nitrogen container, was introduced into a cooling chamber covered with a polystyrene foam thermal insulator. The sample chamber was attached to the bottom of the cooling chamber. The N2-gas flow for defogging was applied to the space between the sample bottom and the objective. For temperature monitoring, two T-type thermocouples were taped to the sample chamber, one on each side. The cooling rate was 0.3–0.4 °C min−1.
Results and discussion
Ice-microparticle formation from water droplets
Ice microparticles (MPs) were prepared from water droplets supported on a cover glass in a closed chamber, as depicted in Scheme 1. Fig. 2 shows sequential images of cooling for droplets prepared densely on the substrate. In Fig. 2a, all droplets in the field of view are liquid. Comparison of Fig. 2a and b (identical imaging area) reveals that many ice particles had just formed in Fig. 2b at −5 °C. The ice particles can be identified by small bumps and dips on the surface. For such densely prepared droplets as in Fig. 2, the onset of freezing occurred abruptly at temperatures ranging approximately between −2 and −7 °C depending on the sample. Fig. 2c shows that, with time, ice MPs undergo size growth as well as forming interconnected structures. This observation suggests that in ice formation, moisture evaporated from droplets in the chamber plays a crucial role. As shown in Fig. 2d, further growth occurred with time and some particles grew significantly larger in volume than that of original droplets at the expense of other particles. That is, the Ostwald ripening phenomena occurred.18 Such dynamic growth events are exemplified in ESI,† S1. In our closed chamber, ice nucleation and growth of densely-packed droplets occurs in equilibrium with air that is supersaturated with respect to ice. Heterogeneous nucleation processes such as deposition nucleation (water vapor deposition), freezing nucleation (ice formation in supercooled droplet induced by outer ice nucleus) and ice-bridging (ice bridge growth from a frozen droplet to neighboring liquid droplets) have been characterized previously.19,20 As described above, we observed phenomena similar to the previous investigations.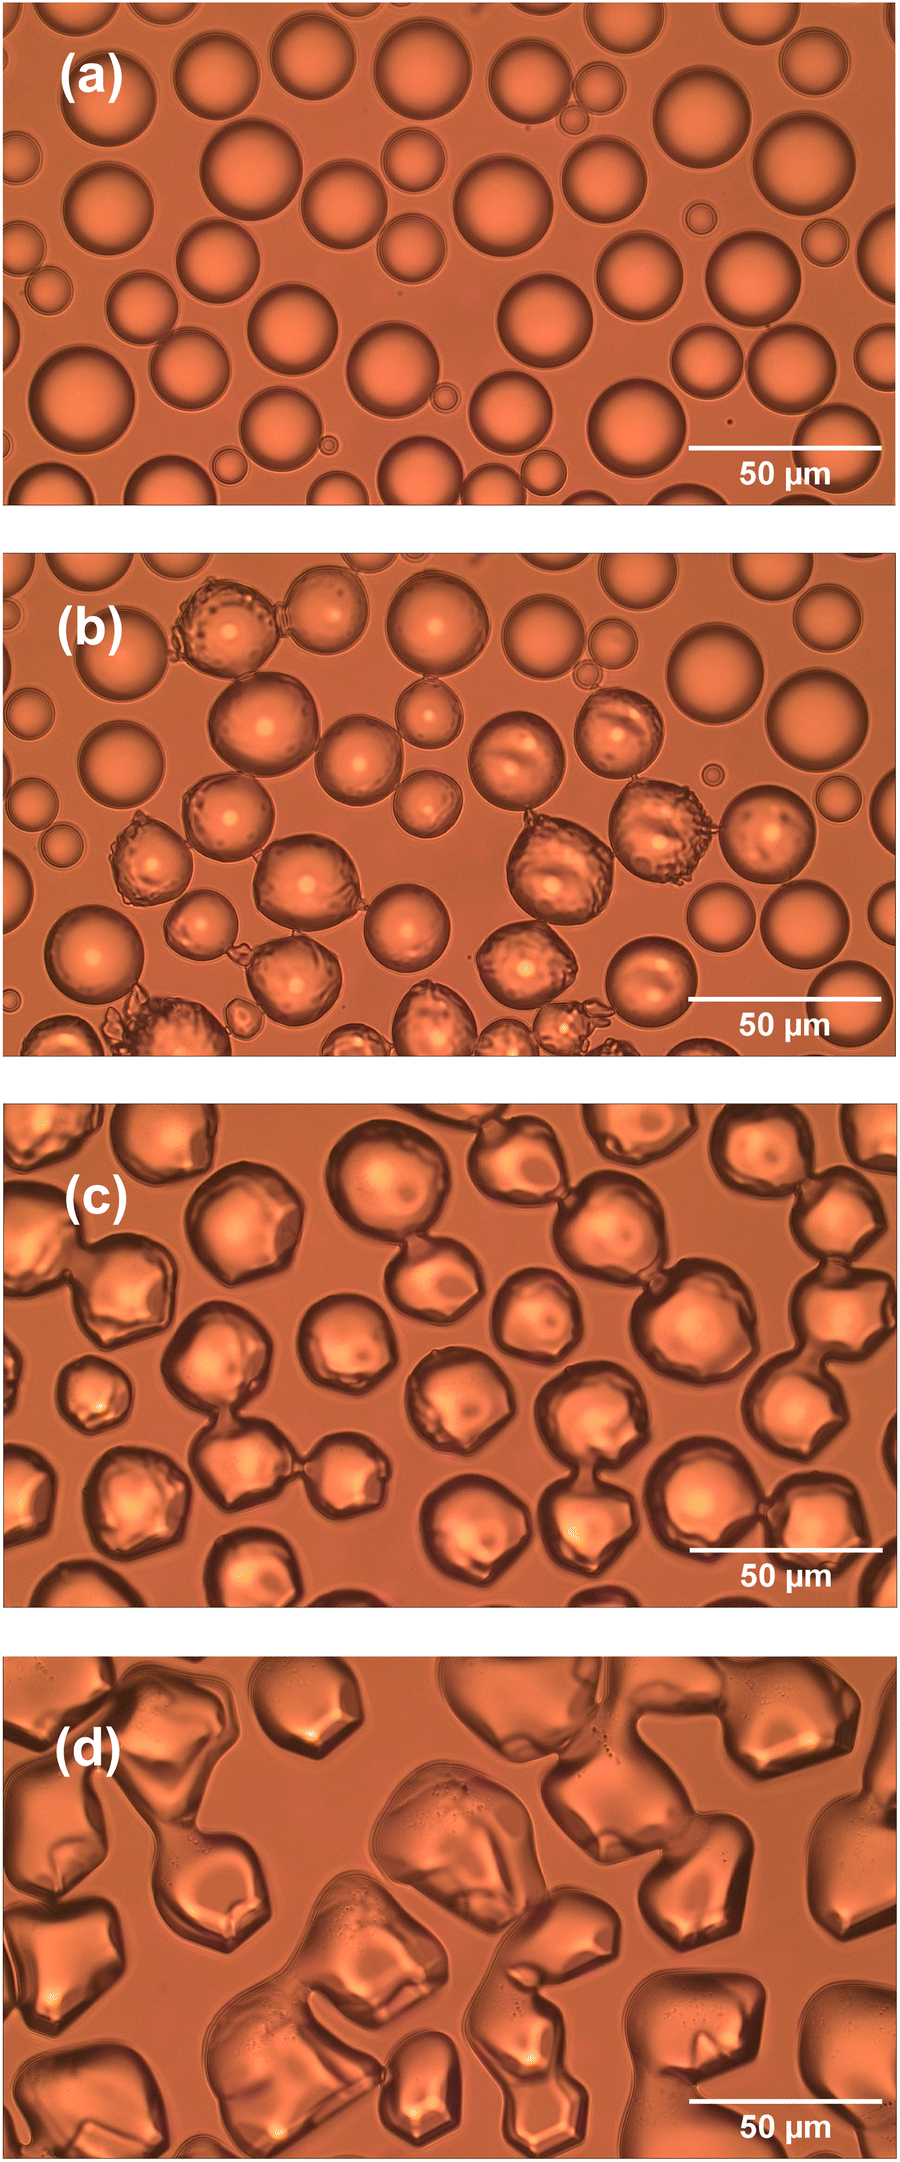 | ||
| Fig. 2 Sequential images of droplet cooling. (a) Liquid water droplets at −5 °C. (b) Onset of crystallization at −5 °C in the same area as in (a). (c) Growth and interconnection of ice microparticles occurred as time progressed (−8 °C after 6 min). (d) Further growth of ice particles with time (−10 °C after 20 min). | ||
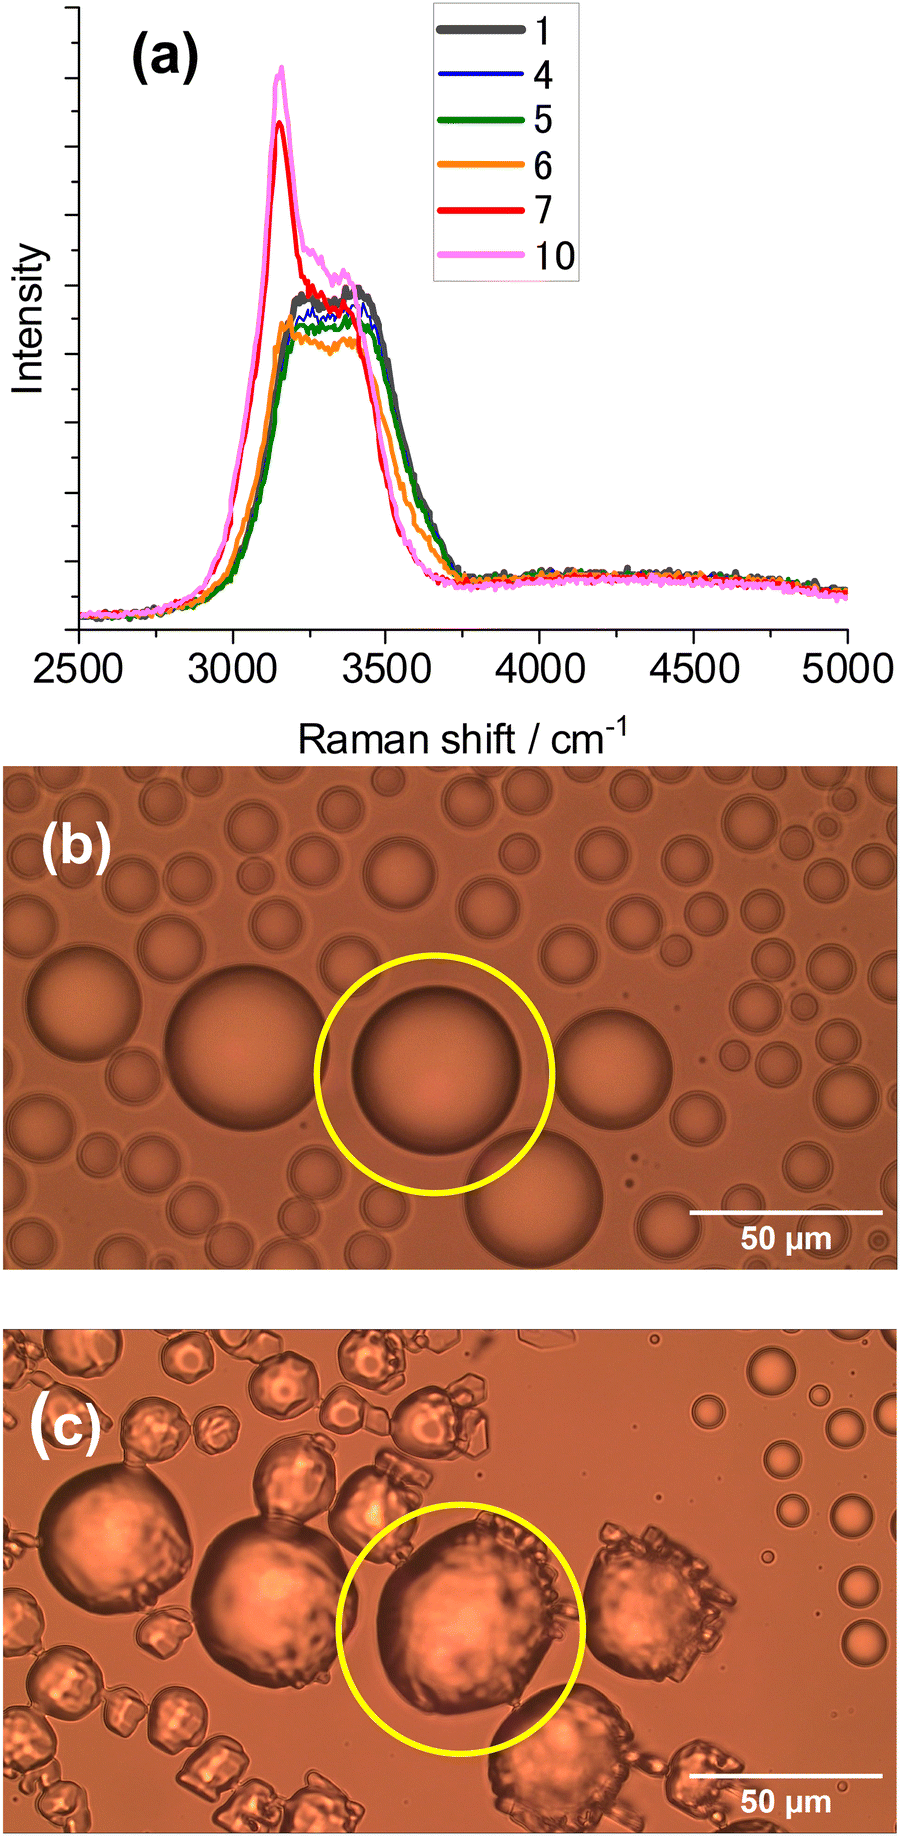
It has been shown previously that supercooled water MPs on solid surfaces crystallize at temperatures close to the homogeneous nucleation temperature of −38 °C, which is considered to be the ultimate limit of supercooling.21–26 For instance, Li and coworkers have shown, by observing the opacity of each droplet, that the onset of ice nucleation occurred at −39 °C for droplets of 14.5–66.7 μm supported on silicon wafers.21 Using video microscopy, Murray and coworkers observed the onset of ice formation at −36 °C for 10–40 μm droplets deposited on hydrophobic (CH3)2Cl2Si-coated glass.22 Although approximately 10 °C higher, Mael and coworkers obtained the onset of nucleation at −26.5 ± 0.9 °C, as observed by Raman microscopy, for water droplets on hydrophobically-coated quartz discs.23 As shown in Fig. 3, when the density of droplets was decreased, the supercooled droplets survived at temperatures as low as −25 °C. Fig. 3 shows particle image and Raman spectra for scattered droplets at temperatures of −5, −10, and −25 °C. The Raman spectra of these droplet had the characteristics of the liquid phase (details below),27–29 surviving in this state down to at least −30 °C. This result is analogous to observations by others.23 However, scattered droplets are difficult to handle because they suffer gradual size reduction and finally disappear, possibly because of evaporation into the chamber atmosphere that may not be supersaturated. Thus, ice particles were prepared from densely-packed droplets.
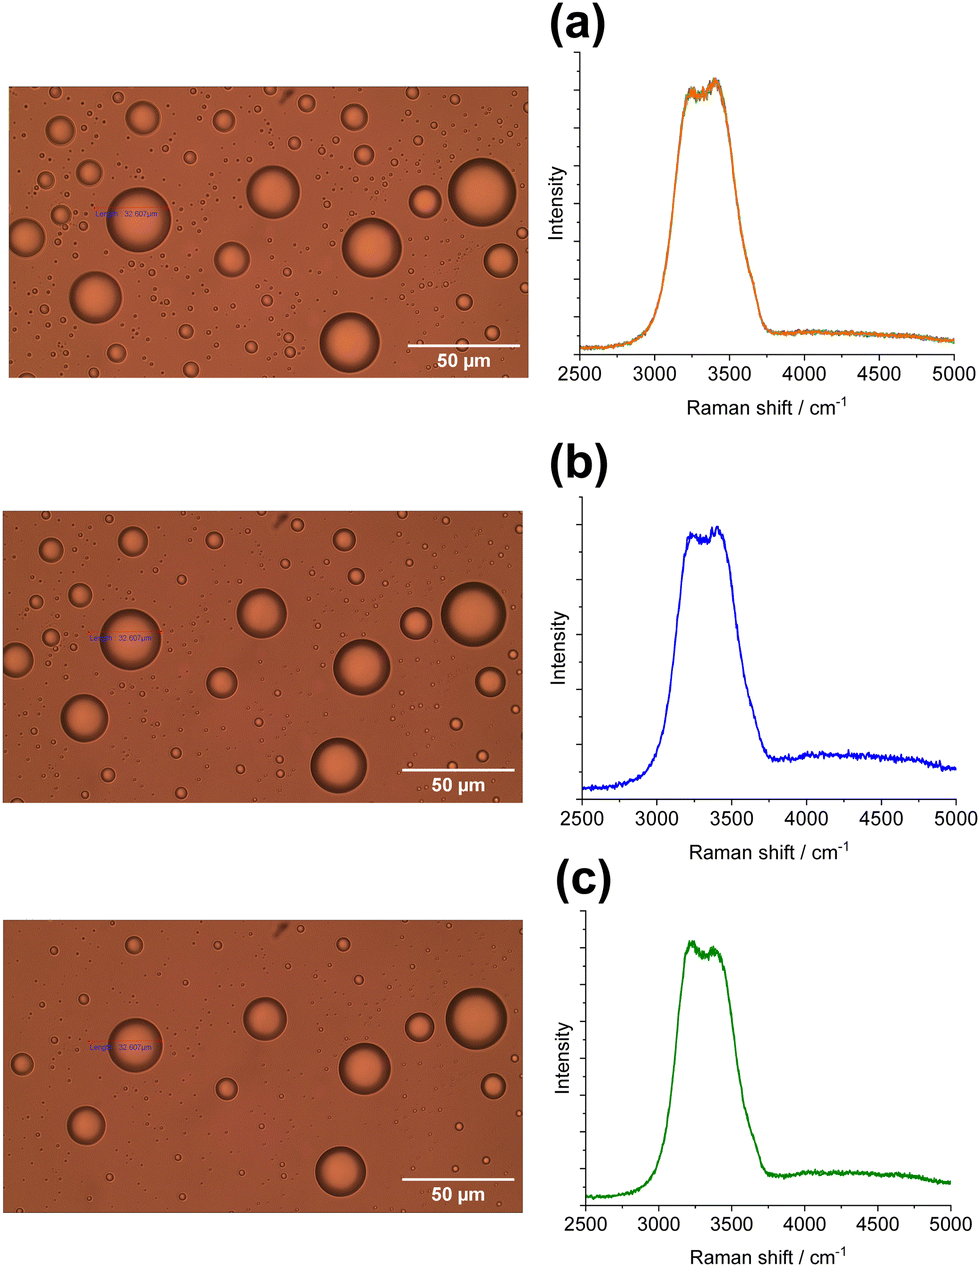 | ||
| Fig. 3 Images (left) and Raman spectra (right) of supercooled microdroplets scattered on substrates at three different temperatures: (a) −5 °C, (b) −10 °C, (c) −25 °C. Raman spectra were ascribed to those of liquid water, showing that droplets failed to crystallize even at −25 °C. | ||
It was possible to observe the progress of freezing from liquid water, by Raman spectroscopy at −10 °C, as shown in Fig. 4a. Fig. 4b shows the particle image of a liquid droplet before the measurement, and Fig. 4c shows the same particle after crystallization. The Raman spectra of water in the OH-stretching region provide insight into the phase information. Ice spectra exhibit a pronounced peak at 3140 – 3160 cm−1 with a less-pronounced contribution from the 3200 to 3600 cm−1 region; whereas liquid water shows a broad band with a maximum at 3400 cm−1 and a shoulder at 3200–3250 cm−1 at ambient temperatures.23,27,30,31 The contribution of the shoulder intensity is temperature-dependent and increased with lowering of the temperature. For supercooled water, the contribution of the region at 3200 cm−1 markedly increased relative to the peak at 3400 cm−1, compared with that at ambient temperature (see ESI,† S2), and formed another peak (Fig. 3 right). This observation was consistent with previous findings for liquid water.27–31 In Fig. 4a, the ice peak at 3160 cm−1 suddenly appeared at 70–80 s while the liquid spectrum was observed at 50–60 s, suggesting that freezing of a liquid droplet was completed in 10 to 20 s. The next step is to experiment with laser illumination.
 | ||
| Fig. 4 (a) Real-time observation for single particle Raman spectral evolution of a droplet freezing at −10 °C. (b) and (c) Images of a supercooled droplet before the Raman spectroscopic measurement (b) and image of ice particles (c) after the measurement. Raman spectral measurements were performed for the particle encircled. The spectral numbers represent the bin numbers of the spectral accumulation (1, 0–10 s; 4, 30–40 s; 5, 40–50 s; 6, 50–60 s; 7, 60–70 s; 10, 90–100 s). | ||
Laser-induced melting of single ice microparticles
Because of a weak light absorption by water molecules at 1064 nm (absorption coefficient α = 14.2 m−1),32 we could observe melting of ice MPs only by illuminating a focused light using an objective of numerical aperture: 0.7. This is because, for the same laser power (W), tightly focusing a Gaussian laser beam increases the laser power density (W cm−2) by a factor of 600 when using an objective with a numerical aperture of 0.7 compared with using that with a numerical aperture of 0.3. Further, evaluation of the absorbed laser energy by water molecules in the laser focal volume enabled the estimation of temperature increase by calculation. In our experiment, only a single ice particle was subjected to focused laser illumination. As a result, no melting/vaporization was observed for ice particles around the particle of interest. For precaution, each measurement was performed for an isolated ice particle for focused (∼1 μm ∅) laser illumination.Fig. 5 shows in situ Raman spectra during laser illumination (Fig. 5a), along with particle images before and after exposure (Fig. 5b and c), and finally the Raman spectrum of the residual particle (Fig. 5d). Simultaneously, the intensity ratio of 3360 cm−1 to 3160 cm−1, I3360/I3160, from each spectrum in Fig. 5a was plotted in Fig. 5e as a function of bin starting time, BST. This ratio serves as a good measure for ice melting because, if and when melting occurs, the liquid peak is expected to increase at the expense of the ice peak. Inspection of Fig. 5a reveals that initially the contribution of the ice peak (3140–3170 cm−1) is dominant but later is replaced by the signal of liquid water (BST 110, 120). Comparison of the images in Fig. 5b and c indicates that particle volume was markedly reduced, and transformed into a sphere of diameter ∼1 μm. As the Raman spectrum 5 min after illumination (Fig. 5d) is that of liquid, it is reasonable to assume that a supercooled liquid droplet is formed. The Raman spectrum of the liquid water stayed unchanged over a prolonged period. This result is consistent with the survival of supercooled droplets at temperatures above −25 to −30 °C (see Fig. 3).
 | ||
| Fig. 5 (a) Raman spectral evolution on exposure to laser illumination (1064 nm, 30 mW) of a single ice particle at −15 °C. Raman spectra were acquired every 10 s. (b) and (c) Particle images before (b) and after (c) illumination. (d) Raman spectrum of the droplet in (c) when left for 5 min after illumination. (e) Spectral shape changes represented by I3360/I3160vs. starting bin time. In a, the number for each spectrum is the bin starting time (BST). Also, a spectrum corresponding to a number −10 (dotted line) represents the spectrum before laser illumination, the intensity of which was adjusted to fit into the figure. In a, broad background signals between 3000 and 5000 cm−1 are ascribed to luminescence from the glass substrate. | ||
Now follows a close inspection of the spectral shape changes with exposure time (Fig. 5e). Initial laser illumination produced a slight but distinct increase in the value of I3360/I3160 (see the difference between BST −10 and 0). As this increase resulted from laser-heating, the Raman change suggests that the ice particle underwent partial or incomplete melting. During illumination, the ratio stayed nearly constant until 80–90 s, after which a distinct increase was observed. Then, the ice peak disappeared and the Raman spectrum originated entirely from liquid (BST 110, 120). During illumination, the particle size was markedly reduced presumably because of vaporization that may deprive the particle of thermal energy. Thus, regardless of initial ice particle size, the laser heating primarily causes vaporization of ice together with partial melting and finally complete melting occurs.
The vaporization rate depended on the chamber temperature as well as the laser intensity and exposure time. For instance, when the temperature was −6 °C, a liquid droplet formed and disappeared quickly because of a high vaporization rate. By contrast, when the temperature was below −20 °C, a size-reduced ice particle was left because of a low rate of vaporization. At temperatures between −10 and −15 °C, the liquid droplet formed did not disappear in most cases. The vaporization rate is much more pronounced for partially melted droplets formed from ice particles subjected to laser illumination. Such an observation is shown in Fig. 6. From the Raman spectra in Fig. 6e, it is assumed that the particle in Fig. 6b has partially melted (BST 0.68) and that the particle in Fig. 6d is a liquid droplet. An appreciable size reduction was observed after 6 min at −14 °C (from Fig. 6b to Fig. 6d) because of vaporization. Images in Fig. 6b–d captured the transition from partial to complete melting.
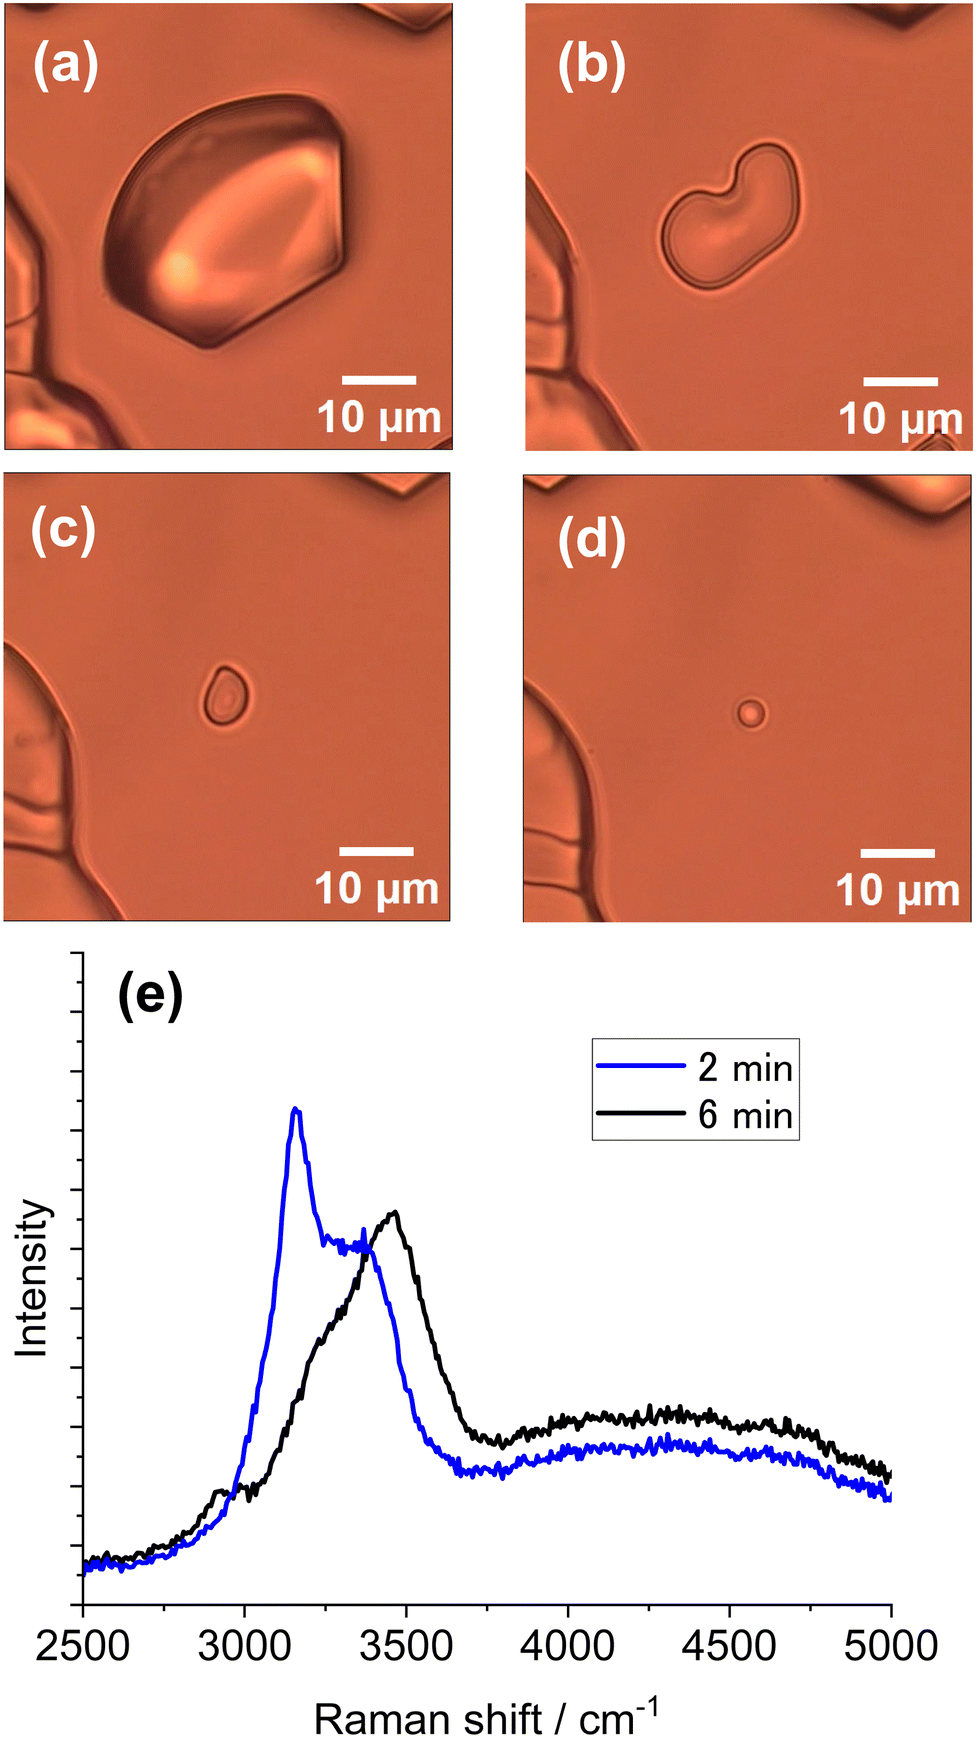 | ||
| Fig. 6 Observation of vaporization from a laser-induced melting particle and related Raman spectra. (a) Ice particle before laser illumination. (b) Partially melted ice particle after 60 s of laser illumination of the ice particle in (a). (c) Particle image 2 min after image (b). (d) Droplet image 6 min after (b). (e) Raman spectra acquired from the particle in (b) (blue line, BST 0.68) and (d) (black line). In situ Raman spectra (1064 nm, 50 mW) after image in a and before image in (b) was given in ESI,† S3. The environmental temperature was −14 °C. | ||
To minimize the vaporization of droplets, the vapor pressure of water was reduced by adding salt. Fig. 7a shows clearly the gradual spectral alteration from the ice spectrum before illumination (EST −10), then to ice-dominant spectra (BST 0,10,20), and finally to liquid spectra (BST 70, 80, 90). In 0.1 M CaCl2, the melting of ice particles proceeded as the exposure time increased (Fig. 7d), because of a much reduced vaporization rate. The resultant liquid droplet diameter was ∼10 μm (Fig. 7c), much greater than that found after illumination of pure water (Fig. 5c). By adding a salt, the heating-time dependent increase in the extent of melting was clearly observed.
 | ||
| Fig. 7 (a) Raman spectral changes every 10 s for a single ice particle containing 0.1 M CaCl2 during 1064-nm laser illumination (50 mW) at −12 °C. The spectrum corresponding to −10 (dotted line) is that before laser illumination commenced. (b) and (c) Particle images before (b) and after (c) illumination. (d) I3360/I3160vs. BST for the spectra in (a). | ||
COMSOL calculations
Laser light at 1064-nm is absorbed by OH-vibrational overtones, which results in heat generation in water at the focus.33 The absorption coefficient (α) of liquid water has been reported as 14.2 m−1.32 and the same value applies to ice.34 Using the heat transfer equation,5,35 we calculated temperature distribution at various points inside the sample chamber resulting from the focused laser illumination followed by heat transfer (Fig. 8). Considering the latent heat of fusion for ice at 0 °C, temperatures were calculated based on illumination with laser light at 50 mW output (details of the COMSOL calculation are provided in ESI,† S4).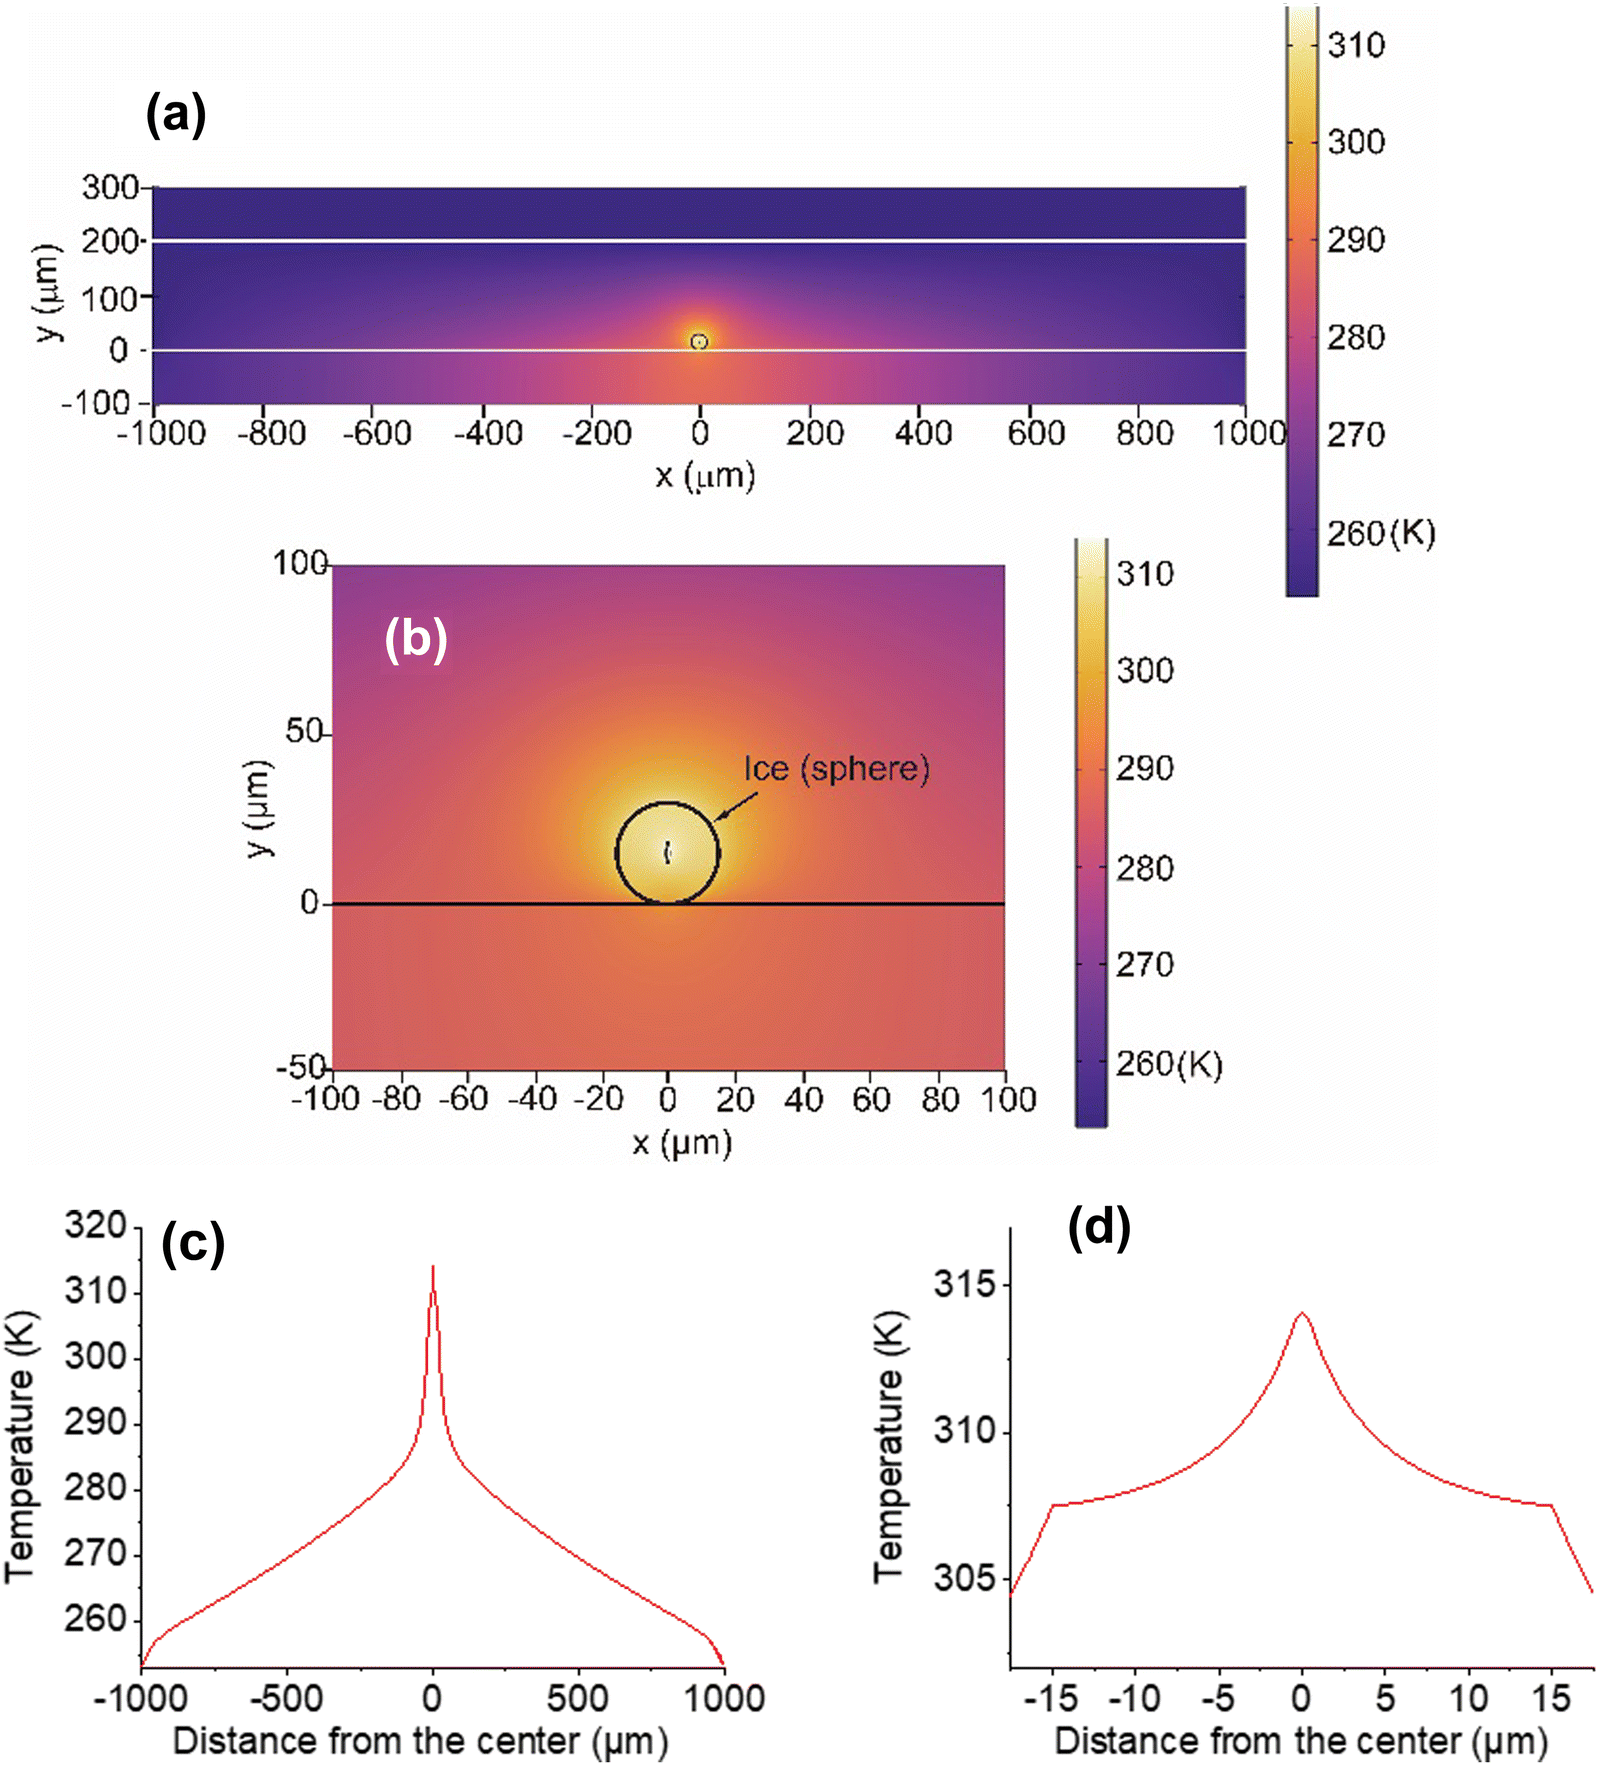 | ||
| Fig. 8 Temperature distribution in a sample chamber (formed by the space between two glass substrates separated by a 200 μm spacer) during illumination with a 1064-nm laser (50 mW). (a) Ice particle of diam. = 30 μm supported on a substrate. (b) Expanded image of (a). (c) 1D temperature distribution on the equator in the horizontal direction. (d) Horizontal expansion from the graph in (c). The chamber wall temperature was fixed at −20 °C (253 K). | ||
The COMSOL calculation suggests that heat transfer occurs from the particle center at the laser focus to the outer areas in the chamber (Fig. 8a and b). One-dimensional temperature decay is clearly shown in Fig. 8c and an expanded view inside the particle (Fig. 8d) shows that the decay has a discontinuity at the water/air boundary. This boundary suppresses heat dissipation, enabling a temperature increase of the ice particle above the freezing point. From the temperature confinement point of view, using a substrate for supporting the particles is disadvantageous, because this substrate cannot prevent heat dissipation from ice to the glass surface. Most importantly, if bulk ice is used instead of MPs, such temperature confinement cannot be achieved (ESI,† S5).
There are some additional points that were not incorporated in the calculation. In COMSOL, a whole spherical particle shape was used as a model. In reality, ice particles of various shapes were generated from the original hemispherical droplets. Heat transfer to the substrate is more efficient with a hemispherical particle (ESI,† S5), but the calculation suggests that this hemisphere can result in raising the temperature above the freezing point. Although exact conditions at the contact area between ice particles and the substrate are uncertain, ice-substrate contact will influence the effectiveness of heat transfer to the substrate. Also, calculations did not take account of the observed gradual shrinking of the particles due to vaporization during illumination. Additionally, a laser spot spheroid of size 1 μm × 5 μm was estimated from consideration of a spatial resolution at the laser focus (ESI,† S4). However, because the laser light intensity changes continuously, there is uncertainty in determining the exact focal spot size. Despite these defects, the validity of the basic concept of temperature confinement in an ice particle is expected to result in a reasonable approximation by the COMSOL calculation based on the heat transfer model. Although our calculated temperatures well explain the present observation of ice melting, temperature measurements are needed for ice particles during laser illumination to show the validity of temperatures obtained by simulation.
Sketch of melting by laser illumination
The laser-heating-induced melting of single ice MPs was observed but the underlying mechanism is not straightforward. Notably, when heated, ice particles of 20–30 μm tend to undergo surface vaporization that strongly retards particle melting (Fig. 5). This vaporization leads to size reduction which enables more efficient heating. When the size is < 10 μm, complete melting was observed by Raman spectroscopy, which is supported by the round-shaped particle images. Adding CaCl2 to droplets was found to result in marked suppression of ice vaporization (compare Fig. 5 and 7), the effect of which enabled observation of the transformation of the ice to supercooled liquid. Here we summarize the present observation of laser-induced ice transformations depending on both laser power and particle diameter in Table 1.| Laser power | Phenomena | Remark on Tp (ESI, S8) |
|---|---|---|
| ≥ 100 mW | Fast and complete vaporization (ESI, S7) | T p ≫ mp (ice) |
| 30∼50 mW | Vaporization, supercooled droplet formation (Fig. 5, 6, 7) | T p > mp (ice) |
| 10–20 mW | Slow vaporization, no ice melting (ESI, S6) | T p < mp (ice) |
Our main observation was supercooled water formation (Fig. 5, 6, 7), along with vaporization that caused appreciable size reduction. Moreover, by reducing the laser intensity, we could only observe slow vaporization without melting (ESI,† S6). At the same time, by increasing the laser intensity, we observed very fast and complete vaporization with no time for melting (ESI,† S7). Therefore, both vaporization without melting and melting accompanied by vaporization can be explained by the laser intensity effect for ice particles of similar diameter (ESI,† S8). If the particle volume is much bigger, for instance, by a factor of 106 (10 μm diameter vs. 1 mm diameter), particle heating can be extremely inefficient as can be expected from Fig. 1(b). This may explain why Richardson and coworkers failed to detect a liquid Raman peak16,17 because, in their study, water contained in a 3-mm ∅ × 3-mm-depth well was frozen by cooling at −20 °C (ESI,† S9). Note that their laser intensity might be weak because they used a moderately focused laser beam with an objective with a numerical aperture: 0.25–0.3.
Thermodynamically, the supercooled liquid-to-ice transition is described by a metastable to stable state conversion with an activation barrier.36 From classical nucleation theory, ice clusters nucleate in liquid water and crystallization results when the clusters grow to a critical size to overcome the activation barrier at constant temperature and pressure.37 In contrast, ice melts by illumination under non-equilibrium conditions and a steady-state temperature gradient will be formed, as simulated by COMSOL in Fig. 8. The temperatures inside the particle were estimated to be above the equilibrium freezing temperature. Melting proceeded only when particles became small and were hampered by vaporization. The morphology of partially or incompletely melted particles is assumed to involve a liquid-core/ice-shell structure according to the temperature profile simulated with COMSOL (Fig. 8d). Hence, a free-energy curve for stable ice to metastable liquid may not be the reverse of crystallization. Further discussion is beyond the scope of this study.
In the present study, real-time Raman observation of crystallization from liquid water (Fig. 4) was achieved at a constant temperature. A Raman excitation laser (3.5 mW, α = 0.0447 m−1) at 532 nm38 was introduced only for observation, not as a stimulus for crystallization. Strikingly, Yoshikawa and coworkers have observed that ice crystallization in supercooled water can be stimulated by a femtosecond laser.39 An effective multiphoton excitation at the laser focus generates shockwaves and bubbles, which can act as an impulse for inducing ice crystal nucleation. Femtosecond laser impulses allowed the transition from a metastable to a stable crystalline state by overcoming the activation barrier. Importantly, the present study provided observation of the ice-to-liquid transition induced by thermal heating through CW laser illumination, which is in contrast to the observation of liquid-to-ice transition using femtosecond laser irradiation.39 This ice-to-liquid transition is possible because supercooled water can exist at temperatures above −38 °C.
The preliminary goal of the present study was to achieve the melting of ice MPs by heating with a focused laser illumination. However, the primary objective is to melt ice MPs incorporating a Au NP (Au NP/ice MP) using the photothermal effect of Au NP, which may enable much higher temperatures. To this end, ice MPs incorporating a Au NP are required. At the present time we have not yet succeeded in preparing AuNP/ice MP. Furthermore, using levitated ice MPs is challenging but preferred in photothermal heating experiments because this would provide the idealized thermal isolation illustrated in Fig. 1a.
Conclusion
In the past decade, photothermal heating using plasmonic nanoparticles/nanostructures or, simply, thermoplasmonics has been successful in confining and shaping a heating spot at nanoscale. However, at larger scales, heat transfer must be regulated because otherwise temperature decays cannot be controlled, and heat generated can be wasted without being used efficiently. In this study, it was demonstrated that introducing a heat-insulating interface is markedly effective in interfering with temperature decays and thus managing the heat transfer. Photothermal-heating-induced melting of ice microparticles was observed to result in supercooled water droplets at temperatures below the equilibrium freezing temperature of water. Note, however, that a previous study on the melting of millimeter-sized ice using plasmonic photothermal heating did not work as expected because of heat dissipation. The method of heat confinement in terms of compartmentalization reported here needs further refinement. Using a substrate to support ice microparticles can be an obstacle to suppressing heat transfer. A better method might be to levitate ice particles using optical trapping. Further research is under way.Author contributions
S. H. performed optical measurements and analyzed the data. T. U. performed the simulation. S. H. conceived and designed the experiment. S. H. wrote the manuscript with a contribution from T. U. All authors have approved the final version of the manuscript.Conflicts of interest
The authors declare no competing financial interests.Acknowledgements
Financial support from JSPS KAKENHI (Grant No. 22K04884, and No. 23K04541) is gratefully acknowledged.References
- G. Baffou, F. Cichos and R. Quidant, Nat. Mat., 2020, 19, 946–958 CrossRef CAS PubMed.
- M. R. K. Ali, Y. Wu and M. A. El-Sayed, J. Phys. Chem. C, 2019, 123, 15375–15393 CrossRef CAS.
- M. Sharifi, F. Attar, A. A. Saboury, K. Akhtari, N. Hooshmand, A. Hasan, M. A. El-Sayed and M. Falahati, J. Controlled Release, 2019, 311–312, 170–198 CrossRef CAS PubMed.
- S. Hashimoto, D. Werner and T. Uwada, J. Photochem. Photobiol., C, 2012, 13, 28–54 CrossRef CAS.
- A. O. Govorov and H. H. Richardson, Nano Today, 2007, 2, 30–38 CrossRef.
- C. Molinaro, M. Bénéfice, A. Gorlas, V. Da Cunha, H. M. L. Robert, R. Catchpole, L. Gallais, P. Forterre and G. Baffou, Nat. Commun., 2022, 13, 5342 CrossRef CAS PubMed.
- W. Sheng, S. He, W. Seare and A. Almutairi, J. Biomed. Opt., 2017, 22, 080901 CrossRef PubMed.
- Z. Chen, J. Li and Y. Zheng, Chem. Rev., 2022, 122, 3122–3179 CrossRef CAS PubMed.
- C. Boutopoulos, A. Hatef, M. Fortin-Deschênesa and M. Meunier, Nanoscale, 2015, 7, 11758–11765 RSC.
- A. Siems, S. A. L. Weber and A. Plech, New J. Phys., 2011, 13, 043018 CrossRef.
- T. Katayama, K. Setoura, D. Werner, H. Miyasaka and S. Hashimoto, Langmuir, 2014, 30, 9504–9513 CrossRef CAS PubMed.
- L. Hou, M. Yorulmaz, N. R. Verhart and M. Orrit, New J. Phys., 2015, 17, 013050 CrossRef CAS.
- K. Metwally, S. Mensah and G. Baffou, J. Phys. Chem. C, 2015, 119, 28586–28596 CrossRef CAS.
- Y. Wang, M. E. Zaytsev, H. L. The, J. C. T. Eijkel, H. J. W. Zandvliet, X. Zhang and D. Lohse, ACS Nano, 2017, 11, 2045–2051 CrossRef CAS PubMed.
- G. Baffou, J. Polleux, H. Ringeault and S. Monneret, J. Phys. Chem. C, 2014, 118, 4890–4898 CrossRef CAS.
- H. H. Richardson, Z. N. Hickman, A. O. Govorov, A. C. Thomas, W. Zhang and M. E. Kordesch, Nano Lett., 2006, 6, 783–788 CrossRef CAS PubMed.
- H. H. Richardson, A. C. Thomas, M. T. Carlson, M. E. Kordesch and A. O. Govorov, J. Electron. Mater., 2007, 36, 1587–1593 CrossRef CAS.
- C. Solans, P. Izquierdo, J. Nolla, N. Azemar and M. J. Garcia-Celma, Curr. Opin. Colloid Interface Sci., 2005, 10, 102–110 CrossRef CAS.
- G. Vali1, P. J. DeMott, O. Möhler and T. F. Whale, Atmos. Chem. Phys., 2015, 15, 10263–10270 CrossRef.
- J. B. Boreyko and C. P. Collier, ACS Nano, 2013, 7, 1618–1627 CrossRef CAS PubMed.
- K. Li, S. Xu, W. Shi, M. He, H. Li, S. Li, X. Zhou, J. Wang and Y. Song, Langmuir, 2012, 28, 10749–10754 CrossRef CAS PubMed.
- B. J. Murray, S. L. Broadley, T. W. Wilson, S. J. Bull, R. H. Wills, H. K. Christenson and E. J. Murray, Phys. Chem. Chem. Phys., 2010, 12, 10380–10387 RSC.
- L. E. Mael, H. L. Busse and V. H. Grassian, Anal. Chem., 2019, 91, 11138–11145 CrossRef CAS PubMed.
- T. Inada, H. Tomita and T. Koyama, Interfacial J. Refrig., 2014, 40, 294–301 CrossRef.
- J. Atkinson, B. Murray and D. O’Sullivan, J. Phys. Chem. A, 2016, 120, 6513–6520 CrossRef CAS PubMed.
- K. K. Tanaka and Y. Kimura, Phys. Chem. Chem. Phys., 2019, 21, 2410–2418 RSC.
- L. E. Mael, G. Peiker, H. L. Busse and V. H. Grassian, J. Phys. Chem. A, 2021, 125, 10742–10749 CrossRef CAS PubMed.
- S. Ishizaka, T. Wada and N. Kitamura, Chem. Phys. Lett., 2011, 506, 117–121 CrossRef CAS.
- C. Q. Sun, X. Zhang, X. Fu, W. Zheng, J.-I. Kuo, Y. Zhou, Z. Shen and J. Zhou, J. Phys. Chem. Lett., 2013, 4, 3238–3244 CrossRef CAS PubMed.
- I. Duričković, R. Claverie, P. Bourson, M. Marchetti, J.-M. Chassot and M. D. Fontana, J. Raman Spectrosc., 2011, 42, 1408–1412 CrossRef.
- X. Xue, Z. Z. He and J. Liu, J. Raman Spectrosc., 2013, 44, 1045–1048 CrossRef CAS.
- J. G. Erwin, F. G. Peterman and C. F. Schmidt, Biophys. J., 2003, 84, 1308–1316 CrossRef PubMed.
- S. Ishizaka, J. Ma, T. Fujiwara, K. Yamauchi and N. Kitamura, Anal. Sci., 2016, 32, 425–430 CrossRef PubMed.
- S. G. Warren, Philos. Trans. R. Soc., A, 2019, 377, 20180161 CrossRef CAS PubMed.
- G. Baffou, R. Quidant and F. J. García de Abajo, ACS Nano, 2010, 4, 709–716 CrossRef CAS PubMed.
- A. F. Henegham, P. W. Wilson, G. Wang and A. D. J. Haymet, J. Chem. Phys., 2001, 115, 7599–7609 CrossRef.
- N. Maeda, Molecules, 2021, 26, 392 CrossRef CAS PubMed.
- R. M. Pope and E. S. Fry, Appl. Opt., 1997, 36, 8710–8723 CrossRef CAS PubMed.
- H. Takahashi, T. Kono, K. Sawada, S. Kumano, Y. Tsuri, M. Maruyama, M. Yoshimura, D. Takahashi, Y. Kawamura, M. Uemura, S. Nakabayashi, Y. Mori, Y. Hosokawa and H. Yoshikawa, J. Phys. Chem. Lett., 2023, 14, 4394–4402 CrossRef CAS PubMed.
Footnote |
| † Electronic supplementary information (ESI) available. See DOI: https://doi.org/10.1039/d3cp05306g |
| This journal is © the Owner Societies 2024 |