
 Open Access Article
 This Open Access Article is licensed under a Creative Commons Attribution-Non Commercial 3.0 Unported Licence
Understanding the effects of targeted modifications on the 1![[thin space (1/6-em)]](https://www.rsc.org/images/entities/h2_char_2009.gif) :2 Choline And GEranate structure†
:2 Choline And GEranate structure†
Ana
Dobre‡
 a,
Spyridon
Koutsoukos‡
ab,
Frederik
Philippi
a,
Daniel
Rauber
c,
Christopher W. M.
Kay
cd,
Oriele
Palumbo
e,
Maxie M.
Roessler
ab and
Tom
Welton
*a
a,
Spyridon
Koutsoukos‡
ab,
Frederik
Philippi
a,
Daniel
Rauber
c,
Christopher W. M.
Kay
cd,
Oriele
Palumbo
e,
Maxie M.
Roessler
ab and
Tom
Welton
*a
aDepartment of Chemistry, Molecular Sciences Research Hub, Imperial College London, White City Campus, London W12 0BZ, UK. E-mail: t.welton@imperial.ac.uk
bCentre for Pulse EPR Spectroscopy (PEPR), Imperial College London, White City Campus, London, W12 0BZ, UK
cDepartment of Chemistry, Saarland University, Campus B2.2, Saarbrücken, Germany
dLondon Centre for Nanotechnology, University College London, 17–19 Gordon Street, London WC1H 0AH, UK
eConsiglio Nazionale delle Ricerche, Istituto dei Sistemi Complessi, Piazzale Aldo Moro 5, 00185 Rome, Italy
First published on 23rd February 2024
Abstract
1![[thin space (1/6-em)]](https://www.rsc.org/images/entities/char_2009.gif) :2 Choline-and-geranate (CAGE) is an ionic liquid (IL) widely studied for its biomedical applications. However, both its industrial-scale preparation and its long-term storage are problematic so finding more suitable candidates which retain its advantageous properties is crucial. As a first step towards this we have conducted a targeted modification study to understand the effects of specific functional groups on the properties of CAGE. 1:2 Choline-and-octanoate and 1:2 butyltrimethylammonium-and-octanoate were synthesised and their thermal and rheological properties examined in comparison to those of CAGE. Using differential scanning calorimetry and polarising microscopy, the model compound was found to be an isotropic liquid, while the analogues were room-temperature liquid-crystals which transition to isotropic liquids upon heating. Dynamic mechanical analysis showed that the thermal behaviour of the studied systems was even more complex, with the ILs also undergoing a thermally-activated relaxation process. Furthermore, we have used electron paramagnetic resonance (EPR) spectroscopy, along with a variety of spin probes with different functional groups, in order to understand the chemical environment experienced by solutes in each system. The EPR spectra indicate that the radicals experience two distinct environments (polar and nonpolar) in the liquid-crystalline phase, but only one average environment in the isotropic phase. The liquid-crystalline phase experiments also showed that the relative populations of the two domains depend on the nature of the solutes, with polar or strongly hydrogen-bonding solutes preferring the polar domain. For charged solutes, the EPR spectra showed line-broadening, suggesting that their ionic nature leads to complex, unresolved interactions.
:2 Choline-and-geranate (CAGE) is an ionic liquid (IL) widely studied for its biomedical applications. However, both its industrial-scale preparation and its long-term storage are problematic so finding more suitable candidates which retain its advantageous properties is crucial. As a first step towards this we have conducted a targeted modification study to understand the effects of specific functional groups on the properties of CAGE. 1:2 Choline-and-octanoate and 1:2 butyltrimethylammonium-and-octanoate were synthesised and their thermal and rheological properties examined in comparison to those of CAGE. Using differential scanning calorimetry and polarising microscopy, the model compound was found to be an isotropic liquid, while the analogues were room-temperature liquid-crystals which transition to isotropic liquids upon heating. Dynamic mechanical analysis showed that the thermal behaviour of the studied systems was even more complex, with the ILs also undergoing a thermally-activated relaxation process. Furthermore, we have used electron paramagnetic resonance (EPR) spectroscopy, along with a variety of spin probes with different functional groups, in order to understand the chemical environment experienced by solutes in each system. The EPR spectra indicate that the radicals experience two distinct environments (polar and nonpolar) in the liquid-crystalline phase, but only one average environment in the isotropic phase. The liquid-crystalline phase experiments also showed that the relative populations of the two domains depend on the nature of the solutes, with polar or strongly hydrogen-bonding solutes preferring the polar domain. For charged solutes, the EPR spectra showed line-broadening, suggesting that their ionic nature leads to complex, unresolved interactions.
Introduction
Ionic liquids (ILs) have gained considerable interest in recent years as potentially more sustainable alternatives to traditional solvents. The term ‘ionic liquid’ generally refers to a liquid that is made up entirely of ions,1 although the study of IL mixtures (with solvents or organic molecules) is also prevalent within the field of ILs.2 ILs exhibit some characteristic properties, such as high viscosities and negligible vapour pressures.3–5 Additionally, some ILs have been shown to have antiseptic, antibacterial or cytotoxic effects and studies have explored the effects of various structural parameters on their toxicity.6 These investigations have shown a positive correlation between IL toxicity and certain features, such as increased alkyl chain length and hydrophobicity.6,7A particularly useful aspect of ILs is that they are considered to be ‘designer solvents’, meaning that their physical and chemical properties can be tuned to suit specific needs, simply by modifying the structure of their constituent species.8,9 Thus quantitative structure–property relationship studies are an essential approach for the study of ILs.10
An area of increasing interest for the use of ILs is in the pharmaceutical industry, particularly within drug formulation and delivery.11,12 The main challenge in this field is that some drugs have poor bioavailabilities, meaning only a small quantity of the administered dose is absorbed by the body.13 This amount depends on the structure of the drug molecule, as well as on the route of administration. Injection provides excellent bioavailability13 but can be painful and impractical. Oral and topical formulations, on the other hand, are much more convenient, but often also have reduced bioavailability, as the drug molecule must pass biological barriers to enter the bloodstream. For oral formulations, this barrier can be the intestinal mucosa, while for topical ones it is the skin stratum corneum.14 One way that ILs are used to aid oral and transdermal drug delivery is as membrane penetration enhancers. IL microemulsions15,16 and acid–amine mixtures17 have been reported in the literature as transdermal delivery systems, and the insertion of IL cations into biological membranes has been studied using computational modelling.18
Choline and geranate (CAGE) is an IL that has shown promise as a transdermal delivery agent. It was first reported in 2014 by Zakrewsky et al. who investigated its ability to permeate the skin, as well as its antimicrobial activity.19 Systems containing choline and geranate in various ratios have been studied and 1:2 CAGE (1 cholinium cation and 2 geranate anions which share a proton) has been shown to be most effective in aiding transdermal penetration.21 This ratio also results in a low-melting, free-flowing IL which is desirable for use in pharmaceutical formulations. The potential applications of CAGE as a drug delivery agent have been extensively researched. These include the enhancement of topical and oral delivery of insulin22–24 and other proteins, as well as the use of CAGE in a clinical setting for the treatment of rosacea.25 At the centre of all these studies is the interaction of CAGE with the skin barrier and its ability to permeate the stratum corneum. Mechanisms including lipid extraction24 and membrane insertion26 have been proposed, but an in-depth understanding is still missing.
Because of its advantageous properties and interesting behaviour, there are several experimental and theoretical studies on CAGE,27,28 which explore its physical properties, as well as the contribution of specific structural characteristics to these properties.20,29 While all these studies provide valuable insight into the CAGE system, they also bring to light some limitations of this IL that may prevent it from being used on a large scale. Geranic acid is commercially available by all major chemical distributors as a mixture of isomers (geranic acid: E-isomer and nerolic acid: Z-isomer); the isomer separation requires a lengthy and solvent-intensive purification process with consequent repeated recrystallisations. Moreover, CAGE itself is heat-sensitive and hygroscopic, making it difficult to store for extended time periods. Thus, in order to identify better alternatives for use in transdermal delivery systems it is crucial to improve our understanding of structure–property relationships in CAGE.
This work aims to provide a better understanding of the role that the constituent species of CAGE play in the structuring and properties of the IL. Two CAGE-like systems (analogues) were synthesised, with some specific structural modifications on both the acid/anion and cation species. Both systems were synthesised with the same 1:2 composition used for CAGE. The thermal behaviours of these systems have been studied using differential scanning calorimetry (DSC) and dynamic mechanical analysis (DMA), accompanied by polarising microscopy to investigate the existence of liquid crystalline behaviour. Additionally, electron paramagnetic resonance (EPR) spectroscopy was used to probe the local chemical environment of the studied ILs, with several functionalised stable radicals employed as model solutes. This technique allows us to identify whether the chemical environment has the same effect on any or all solutes, or whether the nature of the solute itself (e.g. polarity, hydrophilicity, hydrogen bonding ability, etc.) promotes specific interactions in the system.
Materials and methods
Synthetic procedures
All choline-based ILs were synthesised via partial neutralisation of the appropriate acid with commercially available choline bicarbonate.30 CAGE was synthesised using a modified literature procedure.31 The syntheses of all ILs and of the non-commercially available spin probes are described in detail in the ESI† (Section A).All ILs were dried in vacuo for several days before their use. For EPR and DSC measurements, samples were loaded and hermetically sealed in a glovebox. Coulometric Karl–Fischer titration showed a water content of 0.3% w/w for CAGE, 0.07% w/w for CAOC and 0.4% w/w for BTMAAOC.
Differential scanning calorimetry (DSC) measurements
Thermal transition points were measured on a DSC 1 STARe (Mettler Toledo, Gießen Germany), equipped with a liquid nitrogen cooling system. Samples were weighed and hermetically sealed in Al-crucibles inside a glove box. Samples were heated to 100 °C with a heating rate of 5 °C min−1 and then cooled to −120 °C with a rate of 5 °C min−1. This thermal cycle was repeated three times. First-order transitions are given as the maximum of the peak, while the glass transition temperatures are determined using the midpoint method.Dynamic mechanical analysis (DMA) measurements
DMA spectra were recorded under a nitrogen atmosphere on a PerkinElmer DMA 8000 instrument with liquid nitrogen cooling. For each measurement, a fresh stainless-steel plate (30.0 mm × 14.0 mm × 0.5 mm, PerkinElmer) was cleaned with ethanol, dried in an oven, and folded in half along the crease line to provide a pocket for the measurement. The sample was then loaded into the cavity of the pocket. The pocket was placed in the instrument in a three-point bending configuration. The storage modulus (M′) and loss tangent (tanδ = M′′/M′), a measure of the elastic energy dissipation, were recorded at variable frequencies with a scanning temperature of 4 K min−1. The temperature range for each sample was selected based on DSC thermograms. It should be noted here that the stress applied by this method is not a pure shear stress; instead, the mechanical modulus presently measured is a combination of both the shear and the bulk modulus.32–35
Polarising microscopy
Images were taken using a QICAM fast-1394 CCD camera (QImaging, Canada) connected to a Nikon Eclipse E600 polarisation microscope, fitted with 4× and 10× objective lenses. Images were captured using a custom-made LabVIEW program and analysed using ImageJ software.36Rheology measurements
Viscosity was measured under inert dry nitrogen conditions (to avoid moisture uptake of the samples) using a MCR 301 rheometer (Anton Paar, Graz, Austria) with cone-plate geometry. The measuring probe was a CP50-1 cone with a gap size of 0.101 mm.Among the studied samples there are two distinct phases with different rheological behaviour. The first phase shows viscoelastic behaviour and was characterised by oscillation measurements in the linear elastic region. The second phase is isotropic, typical for room-temperature ILs,37 and the viscosity data were fitted to the Vogel–Fulcher–Tammann (VFT) equation (eqn (S1), ESI†). The VFT dependence (also relevant to the DMA fitting which will be discussed later) is largely used for ionic liquids, which in most cases show significant deviation from Arrhenius behaviour in their dynamic properties around or below room temperature. The studied viscosity range was 25 to 105 °C, with a 5 °C step. For each temperature 30 points were measured with shear rates ranging from 50 to 150 s−1. For the isotropic temperature region, the samples showed Newtonian flow behaviour and therefore the viscosity values for different shear rates at a particular temperature were averaged.
Electron paramagnetic resonance (EPR) spectroscopy
To make the spin probe-IL solutions, 20 mM stock solutions of the radicals in ethanol were prepared. The required amount of the stock solution was mixed with the IL and the ethanol was removed in vacuo. This resulted in a final 1 mM solution of the radical in the IL. These solutions were dried and degassed before loading in 1.6 mm O.D. round end borosilicate glass capillaries (Kimble) in a glovebox under an inert nitrogen atmosphere. The capillaries were sealed with a Hirschmann™ haematocrit wax seal. All prepared samples were measured within 24 h.All samples were stored in the freezer (−20 °C) and showed no indications of the radical reacting (e.g. adduct signals or reduced EPR intensity).
All X-band measurements were performed on a Bruker Magnettech ESR5000 benchtop continuous wave (CW) X-band spectrometer, equipped with variable temperature control unit. Unless specified otherwise measurement conditions for CW X-band spectra are 1 mW microwave power, 0.5 mT modulation amplitude, 1 minute acquisition time, 1 scan. The acquisition temperature is shown in figure legends. Variable microwave power measurements were performed to ensure that measurements were performed under non-saturating conditions. The EPR spectra were simulated using EasySpin38 (version 5.2.35) with MATLAB 2020a.
It should be noted that unlike the DSC and DMA measurements, which were performed under dynamic heating with a constant rate, the EPR samples were heated to a specific temperature which was then maintained for a non-negligible amount of time. This difference in the heating modes can result in the observed transition temperatures shifting slightly, depending on the conditions and the thermal history of the sample.
Results and discussion
The systems discussed in this work were chosen using a targeted modification approach, in order to probe the effect of different structural features on the properties of the system.39 The structures of CAGE and the two analogues, choline and octanoate (CAOC) and butyltrimethylammonium and octanoate (BTMAAOC), are shown in Fig. 1.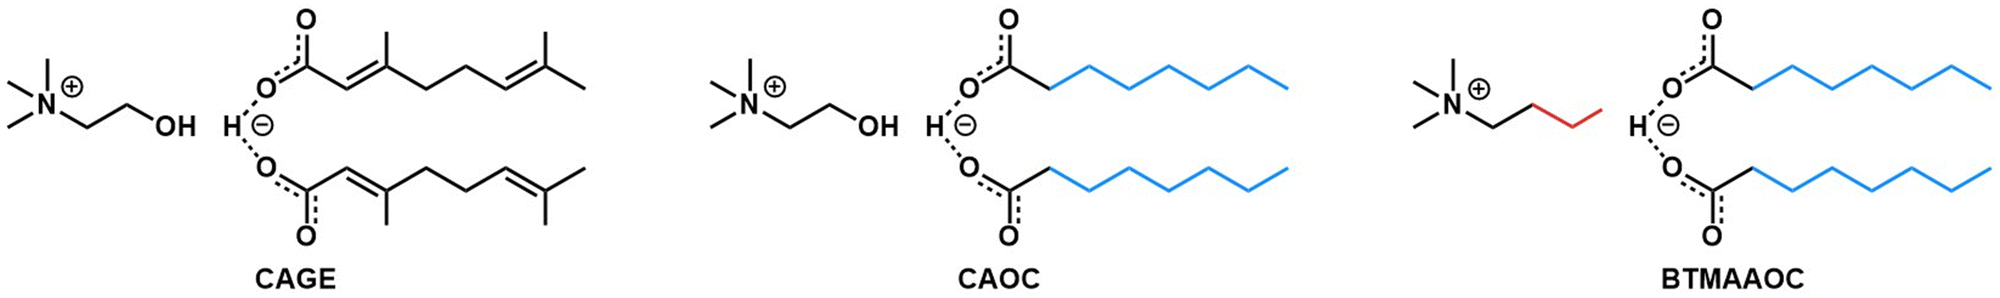 | ||
| Fig. 1 Structures of CAGE (left), CAOC (middle) and BTMAAOC (right). The colours highlight the structural differences between each analogue and CAGE. | ||
CAGE is the most structurally complex of the three systems: the hydroxyl group confers hydrogen bonding ability to the cation, while the acid and anion have unsaturated, branched chains. Meanwhile, the two analogues have been synthesised using octanoic acid – a linear, saturated species – in order to remove the stereochemical influence of the branching groups and unsaturated bonds. CAOC retains the cation hydroxyl group, while in BTMAAOC the hydrogen bonding ability of the cation has been restricted by replacing the hydroxyl group with an alkyl chain.
Thermal transition analysis
The thermal transitions of the systems were analysed using DSC in order to explore the phases that our ILs demonstrate at different temperatures. The DSC measurements were performed in triplicate (three consecutive heating/cooling cycles) to show reproducibility. The enthalpy of fusion (ΔHfus) and the enthalpy of the liquid crystalline – isotropic phase transition (ΔHl–l), as well as the associated entropies, were calculated from the DSC curves and are given in Section B of the ESI.† It should be noted that the DSC measurements were run under dynamic heating/cooling of the sample, with a scan rate of 5 °C min−1.The heating/cooling curves for neat CAGE are shown in Fig. 2 (top). CAGE shows relatively simple behaviour, with a melting transition Tm at −10 °C on heating and a crystallisation transition Tc at −14 °C on cooling. It also shows a reversible glass transition Tg at −83 °C. The melting and crystallisation peaks are not intense, suggesting that the degree of crystallinity in CAGE is low. As seen by polarising microscopy (Fig. S8, ESI†) CAGE is not birefringent at room temperature, so it is considered an isotropic liquid with some degree of nano-heterogeneity resulting from the ionic and amphiphilic natures of its constituents.40
 | ||
| Fig. 2 Thermal behaviour of CAGE. Top: DSC traces, with a heating/cooling rate of 5 °C min−1. Middle: DMA data of CAGE, measured at 1 Hz frequency upon cooling (open symbols) and heating (filled symbols) with a rate of 4 °C min−1. Bottom: Tanδ data measured for CAGE on cooling at f = 1, 5 and 10 Hz. Lines are guides for the eye. Peak A corresponds to the glass transition. Peak B is associated with a thermally-activated relaxation process. The feature labeled C, also shown in the inset, is associated with the liquid crystal to isotropic phase transition. | ||
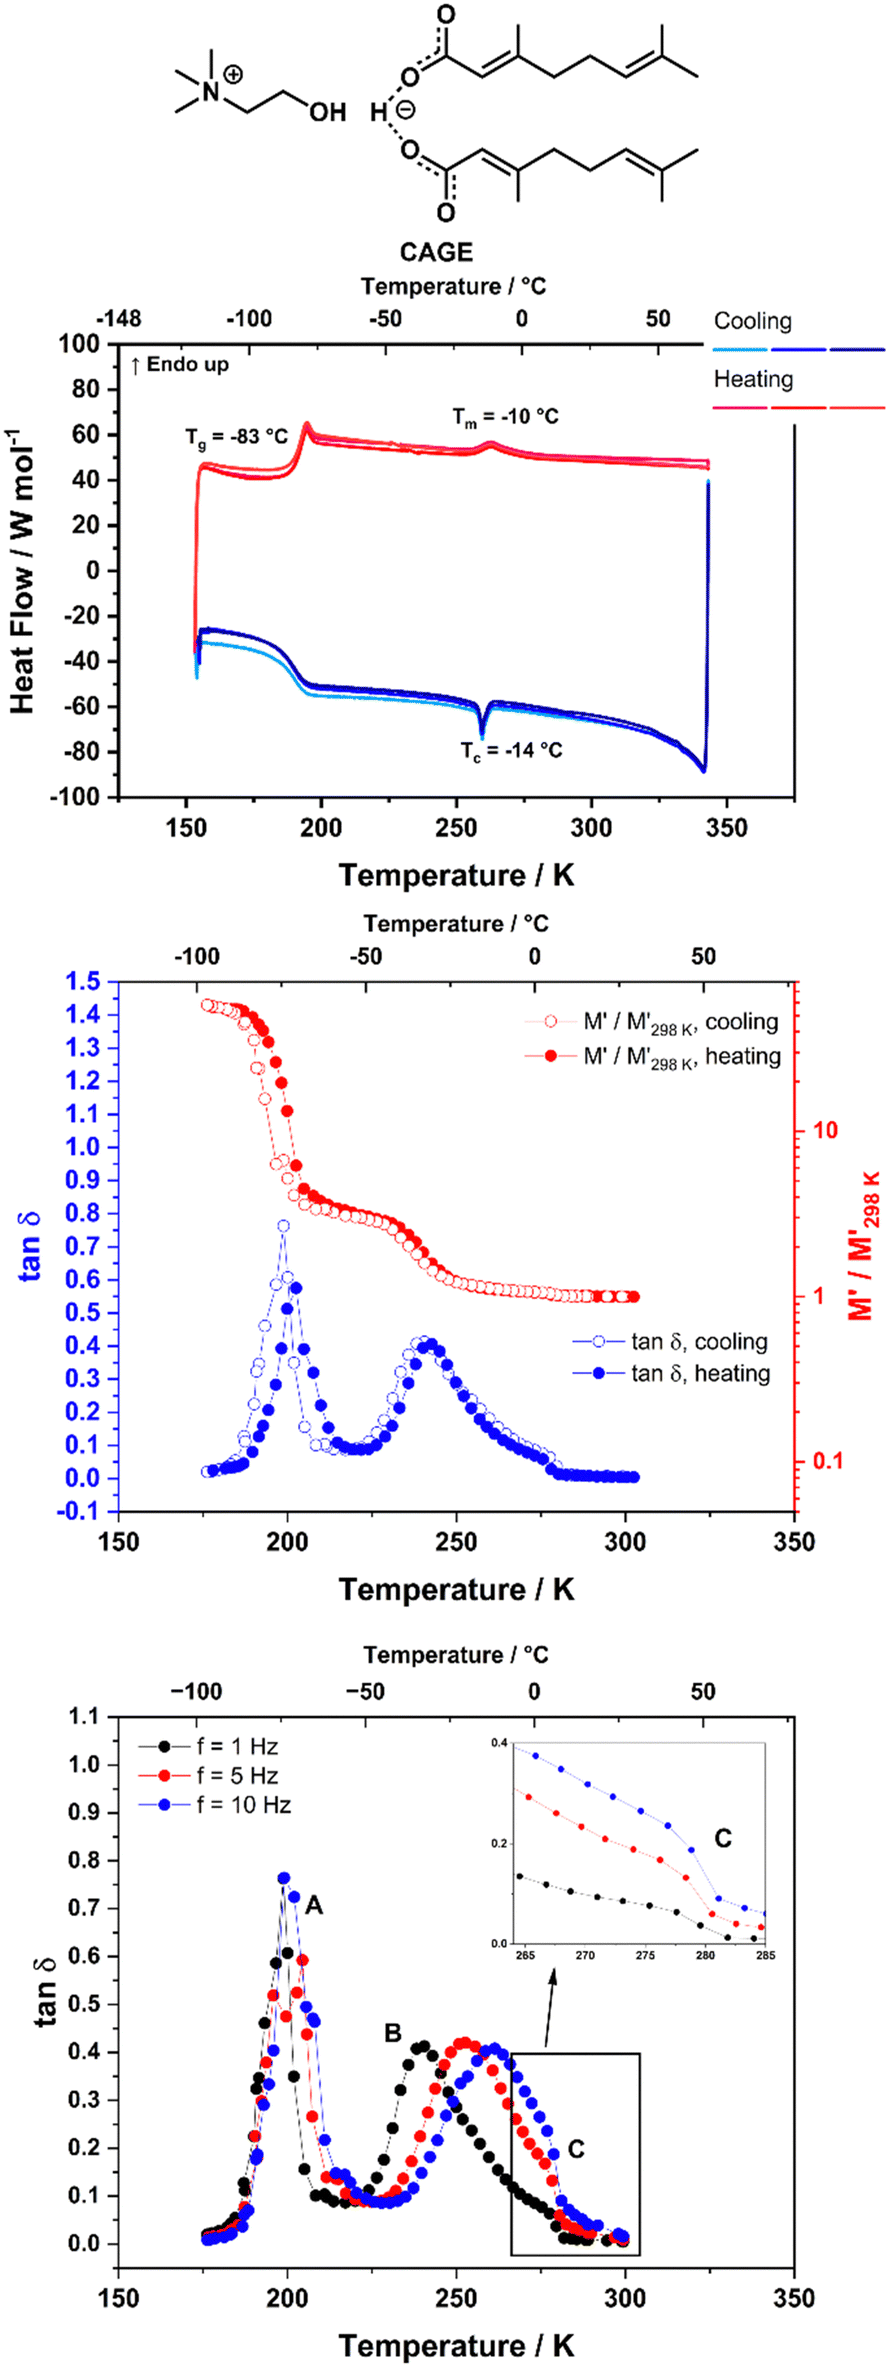
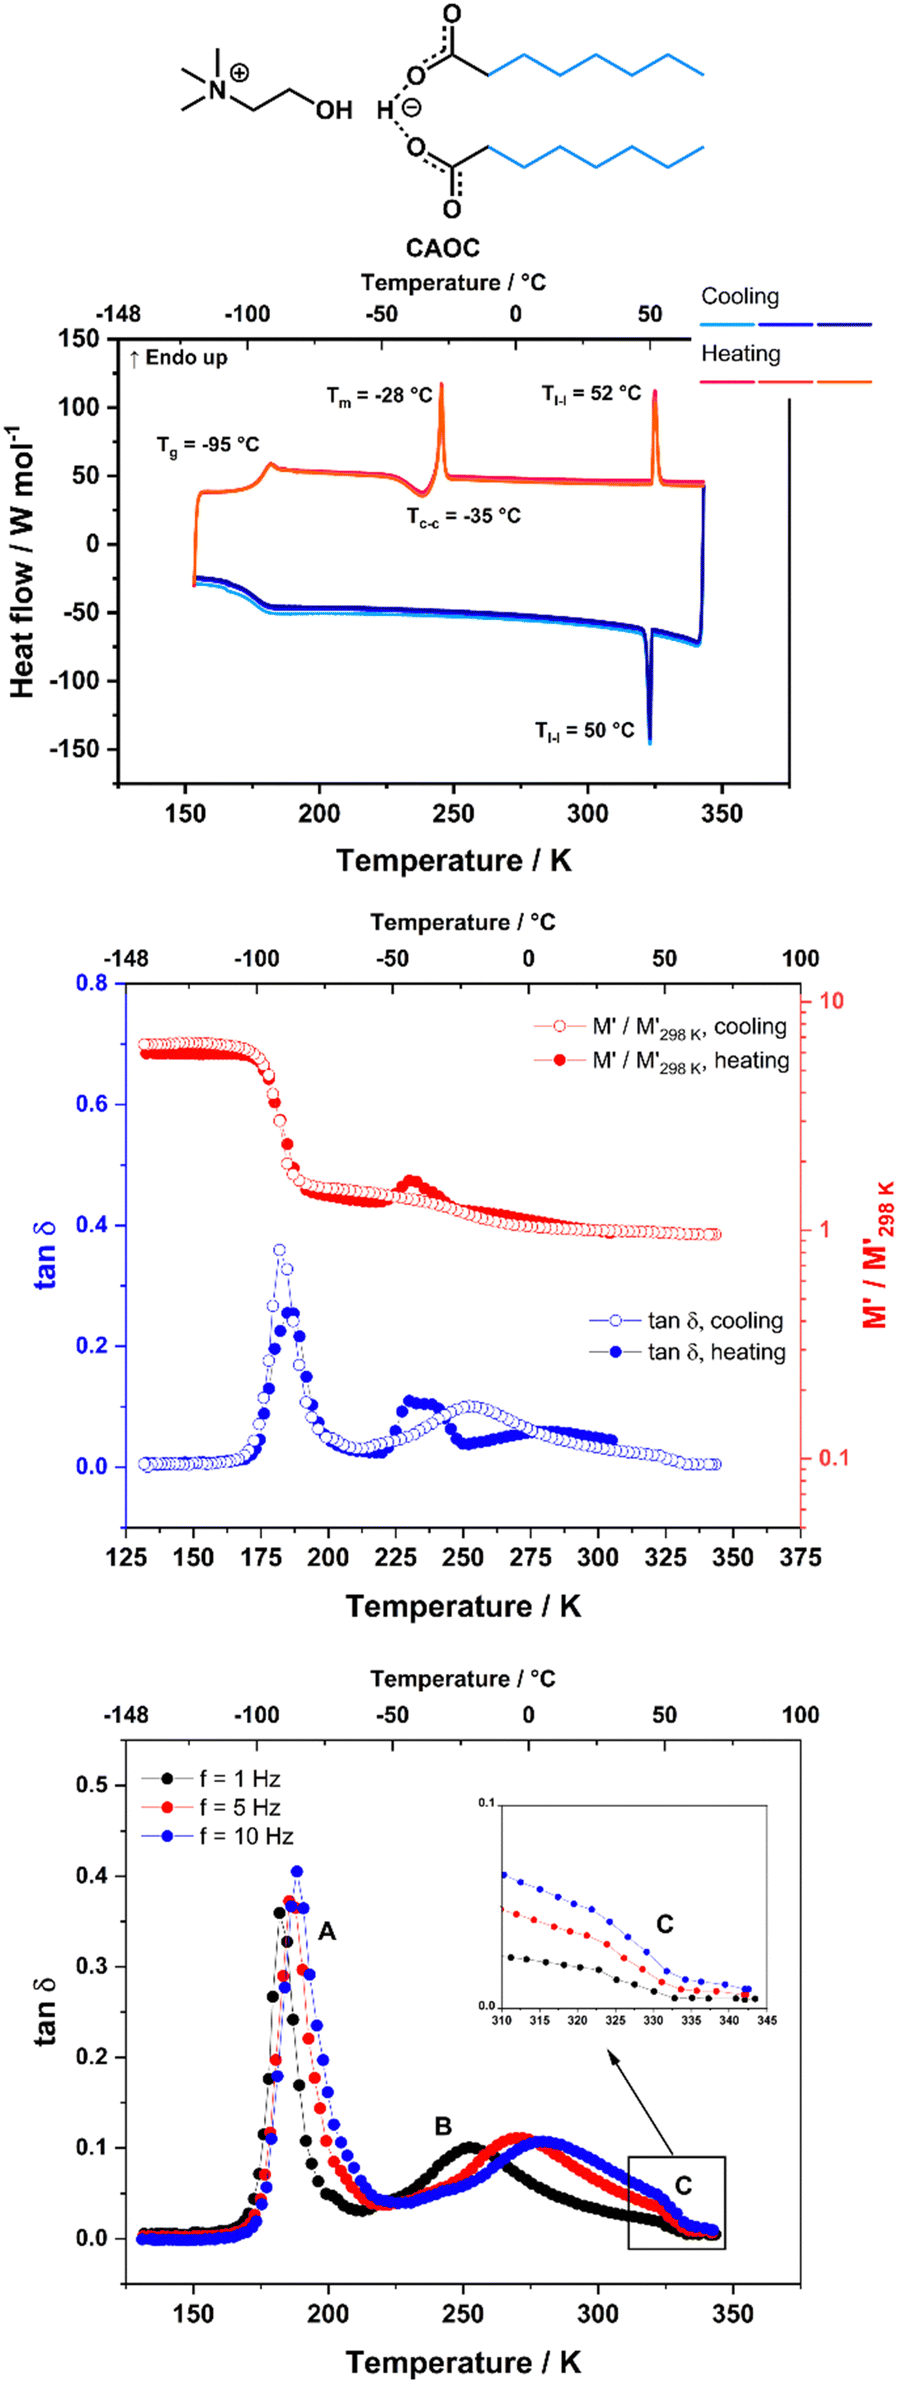
CAOC and BTMAAOC show more complex thermal behaviours than CAGE. Their DSC traces (Fig. 3 and 4, top) show the same set of transitions, but at different temperatures. The two analogues show glass transitions at approximately −95 °C and for both systems only cold crystallisations are observed (at approx. −35 °C). This means that the samples do not crystallise upon cooling, but rather upon heating of the supercooled liquid.41 The cold crystallisation is rapidly followed by melting (at −28 °C for CAOC and −20 °C for BTMAAOC) to a liquid phase. Based on polarised-light microscopy images (Fig. 5 and 6) and the EPR measurements that are discussed below, it can be concluded that this phase is in fact liquid-crystalline. These differences between the structuring of CAGE and that of the octanoic acid analogues can largely be explained by the differences in the carboxylic acid structures. The branching methyl groups and double bonds present in geranic acid increase steric hindrance, preventing good alignment of its chains, resulting in a system with an isotropic liquid structure. On the other hand, the octanoic acid chains lack this structural complexity and can pack more efficiently, thus allowing for the formation of highly-ordered liquid crystalline phases. The last transition observed in the DSC (Tl–l) is a transition from the liquid crystalline phase to an isotropic liquid. CAOC, which contains a hydroxyl group on the cation, shows a larger liquid-crystalline window (Tl–l = 52 °C) than BTMAAOC (Tl–l = 17 °C), suggesting that the increased hydrogen bonding, arising from the presence of the –OH group, helps to further stabilise the liquid crystal structure. In agreement with this hypothesis, BTMAAOC was observed to have a more pronounced hygroscopic character compared to CAOC, likely since additional water does not face competition for the hydrogen bond acceptor sites of the anion. Further comparing CAOC and BTMAAOC, the latter undergoes the liquid crystal to isotropic phase transition at a lower temperature but shows higher ΔHfus and ΔHl–l values compared to CAOC (ESI,† Section B). The larger enthalpy value of BTMAAOC suggests a larger energy difference between the liquid crystal and isotropic phases, while the lower transition temperature indicates that the transition requires a lower activation energy in BTMAAOC compared to CAOC. A potential explanation for this is, once again, related to the difference between the two cations. The BTMAAOC cation contains a non-polar alkyl side-chain, which, in the highly-ordered liquid crystal phase, is forced to exist in the polar domain; in the isotropic phase, however, this side chain can penetrate into the more energetically favourable nonpolar domains. CAOC, on the other hand, contains a cation with a hydroxyl group, which prefers to be located in the polar domain at all times. Finally, both CAOC and BTMAAOC have higher ΔHfus than CAGE.
 | ||
| Fig. 3 Thermal behaviour of CAOC. Top: DSC traces, with a heating/cooling rate of 5 °C min−1. Middle: DMA data of CAOC, measured at 1 Hz frequency upon cooling (open symbols) and heating (filled symbols) with a rate of 4 °C min−1. Bottom: Tanδ data measured for CAOC on cooling at f = 1, 5 and 10 Hz. Lines are guides for the eye. Peak A corresponds to the glass transition. Peak B is associated with a thermally-activated relaxation process. The feature labeled C, also shown in the inset, is associated with the liquid crystal to isotropic phase transition. | ||
 | ||
| Fig. 4 Thermal behaviour of BTMAAOC. Top: DSC traces, with a heating/cooling rate of 5 °C min−1. Middle: DMA data of BTMAAOC, measured at 1 Hz frequency upon cooling (open symbols) and heating (filled symbols) with a rate of 4 °C min−1. Bottom: Tanδ data measured for BTMAAOC on cooling at f = 1, 5 and 10 Hz. Lines are guides for the eye. Peak A corresponds to the glass transition. Peak B is associated with a thermally-activated relaxation process. The feature labeled C, also shown in the inset, is associated with the liquid crystal to isotropic phase transition. This is not as evident here as it is for CAGE and CAOC due to its overlap with peak B. | ||
 | ||
| Fig. 5 Polarised-light microscope images of CAOC at 15 °C, showing birefringence and a Maltese cross pattern (red circle) indicative of a lamellar liquid crystalline phase. The images are taken at different points of the same sample slide with 4× magnification (left) and 10× magnification (right). | ||
 | ||
| Fig. 6 Polarised-light microscope images of BTMAAOC at 5–10 °C, showing birefringence and a Maltese cross pattern (red circle) indicative of a lamellar liquid-crystalline phase. The images are taken at different points of the same sample slide with 4× magnification. | ||
Fig. 5 and 6 show polarised-light microscopy images of CAOC and BTMAAOC, respectively; the images were taken at or slightly below room temperature (approximately 10–15 °C). This technique is used to determine whether a sample is birefringent (optically anisotropic), meaning that it refracts light in two different directions.42,43 Most types of liquid crystals (LCs) are birefringent, with the exception of cubic LCs, which are optically isotropic.44 On a polarised-light microscope, birefringence appears as light and dark areas, arising from the interference of the refracted light rays; optically isotropic samples would show an entirely dark image.45 As can be seen from Fig. 5 and 6 both CAOC and BTMAAOC are birefringent, while CAGE (Fig. S8, ESI†) is optically isotropic. CAOC and BTMAAOC also show a Maltese cross pattern, often observed for lamellar systems, such as banded spherulites in polymers,46 and in the lipid structures of human skin.47 Based on the DSC results and the polarised-light images, from now on we will refer to the region before the liquid crystal to isotropic phase transition as the ‘liquid-crystalline phase’ and to the region above the transition as the ‘isotropic phase’.
Rheology characterisation
Characterising the rheological profile of complex systems provides useful information about their structuring and their behaviour under stress and can be of utmost importance for future applications (such as drug delivery applications). In order to characterise the rheological behaviour of CAGE and its analogues, oscillatory and dynamic viscosity measurements were performed. As discussed in the previous sections, CAGE transitions from solid to an isotropic liquid without an intermediate liquid-crystalline phase. As a result, dynamic viscosity measurements could be performed over the whole studied temperature range (298 to 378 K). For CAOC and BTMAAOC, dynamic viscosity could only be performed for the isotropic phases, in the temperature ranges 328 to 378 K for CAOC and 318 to 378 K for BTMAAOC. The data was fitted (Fig. 7) according to the Vogel–Fulcher–Tammann (VFT) equation (eqn (S1), ESI†) and the fit parameters are given in the ESI,† Section C. In their isotropic phases, CAGE and CAOC were found to have similar viscosities, while isotropic BTMAAOC shows a consistently lower viscosity compared to both CAGE and CAOC. This indicates that, in the isotropic phase, the reduction of hydrogen bonding leads to a more fluid system, while the branching and unsaturation of the acid chain have virtually no effect on the systems’ viscosity. | ||
| Fig. 7 Dynamic viscosity data for CAGE, CAOC and BTMAAOC (in the isotropic phase) fitted to the Vogel–Fulcher–Tammann (VFT) equation. | ||
For the liquid-crystalline phases of CAOC and BTMAAOC, dynamic viscosity measurements are not applicable, as these systems show a viscoelastic behaviour, with both a viscous and an elastic contribution. In these cases, the aim of rheology characterisation is to investigate the viscoelastic behaviour of the complex fluids under different stresses. Steady-shear oscillation measurements were performed in order to measure the complex viscosity (η*), the storage (E′) and loss (E′′) moduli, and the loss tangent (tanδ) of CAOC and BTMAAOC. Data and graphs are shown in the ESI,† Section C. The storage modulus E′ is related to the elastic or solid behaviour of the material (the ability to store energy), while the loss modulus E′′ is related to viscous or liquid behaviour (the ability to dissipate energy). The loss tangent (tanδ = E′′/E′) provides a way to disentangle the elastic and viscous contributions to viscoelastic behaviour.
For both CAOC and BTMAAOC, the viscosity shows a significant decrease upon heating to 55 °C and 40 °C respectively (Fig. S1 and S2, ESI†). This can be attributed to the samples undergoing a phase transition from a highly viscous liquid crystal to a more fluid isotropic liquid. For CAOC, this agrees with the DSC data (Tl–l = 52 °C). In the case of BTMAAOC, however, this temperature is higher than that indicated by the DSC data (Tl–l = 17 °C) but it is in agreement with the transition temperature measured by DMA (which will be discussed in the next section). It is possible that this discrepancy is a result of the thermal history of the sample.
In their liquid-crystalline state, both CAOC (Fig. S1, ESI†) and BTMAAOC (Fig. S2, ESI†) show shear-thinning behaviour (a decrease in viscosity with increasing frequency), which is typical for viscoelastic materials.48 To better understand the properties of the liquid-crystalline samples, it is important to separate the elastic and viscous contributions. The storage modulus (E′) and loss modulus (E′′), as well as the loss tangent (tanδ), are shown in the ESI,† in Fig. S3 and S4 respectively. Based on the previously discussed viscosity data, and the fact that the samples have a significant storage modulus value (E′), the ILs are thought to be in their liquid-crystalline state at all temperatures shown in these figures.
CAOC and BTMAAOC show a viscoelastic solid behaviour at all temperatures; this is expected as the system primarily consists of molecules connected through networks of ionic or hydrogen bonds.49 The values of the moduli (E′ > E′′ with no crossover) and of tanδ (<0.4 at all temperatures and frequencies, in agreement with the DMA data) indicate that CAOC and BTMAAOC show primarily elastic (solid-like) behaviour (for ideal elastic behaviour tanδ = 0). Comparing the liquid-crystalline phase of the two ILs, it is clear that CAOC has a stronger elastic contribution (higher E′ and lower tanδ) than BTMAAOC. The complex viscosity of BTMAAOC is also consistently lower than that of CAOC, with the maximum viscosity measured for CAOC (692 kPa s at 30 °C and an angular frequency of 0.01 rad s−1) being more than double that of BTMAAOC (312 kPa s at 30 °C and an angular frequency of 0.01 rad s−1). As was found for the thermal behaviour (see above), this can be explained by the interactions that occur in the two ILs: the hydroxyl group in CAOC allows for increased hydrogen bonding, creating a more ‘tightly’ bound system with stronger interactions compared to BTMAAOC. Above the phase transition temperatures, E′ approaches zero, leading tanδ to infinity, which is characteristic of an ideal viscous (liquid-like) behaviour and confirms that this phase is macroscopically isotropic.
DMA measurements
Dynamic mechanical analysis (DMA) is a technique used to study the thermomechanical properties of different kinds of systems.32,33,50–52 In particular, it has been successfully used for ILs32–35,52 since it allows the measurement of their mechanical modulus and its variation during phase transitions, in both the liquid and the solid states.Here, DMA is used to measure the storage modulus (M′) and the loss tangent (tanδ) of the ILs at different temperatures and frequencies. The storage modulus measured by DMA is denoted by M′ in order to distinguish it from the storage modulus measured by oscillating rheometry (denoted by E′). This is because the two are not directly comparable, as in DMA the applied stress is not a pure shear stress. Moreover, in DMA the measured value contains a contribution from the material pocket and so comparing the actual modulus value between the two techniques is not possible. Both techniques are valuable as they provide complementary information about the behaviour of the sample with changing temperature (DMA) and shear rate (oscillating rheometry).
Fig. 2 (middle) shows the DMA data (storage modulus M′ and tanδ) for CAGE, measured at f = 1 Hz on cooling and heating. The tanδ data measured on cooling at three different frequencies (1, 5 and 10 Hz) are also shown in Fig. 2 (bottom). Around 190 K (−80 °C) the relative change in M′ shows a significant increase (on cooling) and decrease (on heating), while the tanδ shows an intense, narrow peak, that does not shift with frequency (Fig. 2, bottom, peak A). These features are indicative of a glass transition and agree with the transition temperature measured by DSC (Tg = −83 °C, 190 K). The tanδ also shows a peak around 245 K (−28 °C) which will be discussed later in this section. This peak has a small shoulder feature around 273 K (0 °C) which appears at roughly the same temperature independent of the measurement frequency (Fig. 2, bottom, inset) and is likely to correspond to the phase transition observed in the DSC at approximately −10 °C. DMA data for CAOC measured on cooling and subsequent heating at f = 1 Hz are shown in Fig. 3 (middle). The tanδ data measured on cooling at f = 1, 5 and 10 Hz are also shown in Fig. 3 (bottom). As expected, the glass transition gives rise to intense peaks in the tanδ and to a sharp increase in the relative variation of M′ in both the cooling and heating cycles. The features observed on heating at approximately 230 K (−45 °C) in both tanδ (as a peak) and M′ (as an increase suddenly followed by a decrease at higher temperature) appear only upon heating and so they are likely to be associated with the cold crystallisation event observed by DSC. Finally, in the cooling cycle, tanδ also shows a large peak around 260 K (−33 °C) which will be discussed later in this section. This peak presents a small shoulder at 325 K (52 °C) which does not shift with frequency (Fig. 3 bottom, inset) and is most likely associated with the liquid crystal to isotropic phase transition.
For BTMAAOC, Fig. 3 shows the DMA data measured on cooling and subsequent heating at f = 1 Hz (middle) as well as the tanδ data measured on cooling at f = 1, 5 and 10 Hz (bottom). As expected, the glass transition gives rise to intense, narrow tanδ peaks and to a significant relative change in the M′ modulus. These features are observed on both heating and cooling of the sample. The cold crystallisation transition also results in a peak in tanδ measured on heating at approx. 245 K (−28 °C) accompanied by a variation in the M′ curve, although it should be noted that these peaks are less intense than those observed for CAOC. Finally, the features observed on heating at 310 K (37 °C) in both the relative M′ (a slight decrease) and tanδ (an abrupt decrease) are most likely due to the liquid crystal to isotropic phase transition, although the temperature difference between the DMA and DSC measurements is significant (20 °C). Once again, this could be due to the thermal history of the sample affecting its behaviour. It must be noted here that a similar, less intense, variation is observed in the cooling run. This appears as a step on the high-temperature side of the broad peak measured in the tanδ curve around 280 K.
In addition to the peaks discussed so far, the tanδ curves for all three ILs also show broad peaks that shift with frequency. These peaks occur upon cooling for all three ILs, as well as upon heating for CAGE. The tanδ data measured on cooling at three different frequencies (1, 5 and 10 Hz) are shown for CAGE (Fig. 2, bottom), CAOC (Fig. 3, bottom) and BTMAAOC (Fig. 4, bottom). For each IL, this broad peak (labelled in the figures as peak B) shifts to higher temperatures as the frequency of the oscillation increases, which indicates that the process occurring is a thermally activated relaxation, rather than a phase transition. This has been reported in the literature for ionic liquids.32,33,51
The observed relaxation can be described using a simplified two-state model, where the rate-limiting ‘elementary reaction’ is the thermally activated transition between two states. Such a state may be a well-defined minimum energy configuration or a collection of minimum energy configurations separated by small energy barriers. Within this model, the relaxing units can move between two configurations with a relaxation rate τ−1 by means of thermal activation. In a standard anelastic solid, the elastic energy dissipation presents a maximum when the Debye relaxation condition, ωτ = 1, is satisfied. For a single relaxation time τ, tanδ is given by:
 | (1) |
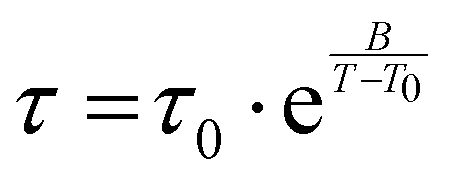 | (2) |
Section D of the ESI† shows the fits of the tanδ data corresponding to the relaxation processes, measured on cooling, for each of the three samples. The values of the best fit parameters are reported in the ESI,† Table S4. It is worth noting that the values obtained for the B and T0 parameters are comparable to those obtained from fitting the dynamic viscosity data. This suggests that in the present case the two techniques provide consistent results about the diffusive process dominating the viscous flow, even though they measure a different quantity in different conditions. In particular, the viscosity measurements of CAOC and BTMAAOC that were fitted to the VFT equation were carried out in the isotropic phase, while the relaxation peaks in the DMA data are detected in the liquid-crystalline phase of the same ILs. In this framework it is interesting that the parameters of the observed dynamics do not drastically change between the two phases.
The values obtained for the α parameter suggest the occurrence of interaction between the relaxing units,32 while the values obtained for τ0 are indicative of a diffusive process as already reported for some ionic liquids where the structural relaxation is not dominated by anion flexibility.35 Moreover, the obtained energy values are quite small, ranging between 8 and 13 kJ mol−1 (ESI,† Table S4), suggesting that the mechanism which dominates the observed dynamics is likely of an intermolecular nature.35 Comparing the activation energies calculated for CAGE (in its isotropic liquid phase) and CAOC and BTMAAOC (both in their liquid crystalline phase), these increase in the order CAGE < BTMAAOC < CAOC. As found for the thermal and viscosity data this indicates the occurrence of stronger interactions for CAOC compared to BTMAOC, likely due to the increased hydrogen bonding expected from the hydroxyl group in CAOC. CAGE has the lowest calculated activation energy, and therefore the weakest interactions of the three ILs, which is consistent with the rest of the data.
Probing solute microenvironments using EPR spectroscopy
To further understand the structural differences between the isotropic and liquid crystalline phases of the ILS, spin probes with different functional groups (Fig. 8) were dissolved in the ILs and their EPR spectra were measured at various temperatures, above and below the liquid crystal to isotropic phase transition. The magnetic parameters used for the simulation of the EPR spectra are summarised in Tables S5–S7 of the ESI.† The four charged TEMPO-derivatives were synthesised such that the counterion is the same as either the cation or the anion present in the IL they are intended to probe. This means that the negatively-charged [TEMPO-COO] derivatives have either a cholinium [Ch] counterion (when used to probe CAGE and CAOC) or a butyltrimethylammonium [BTMA] counterion (when used to probe BTMAAOC). Positively-charged [TEMPO-TMA] derivatives have either a geranate [Ge] counterion (when used with CAGE) or an octanoate [Oc] one (when used with CAOC and BTMAAOC).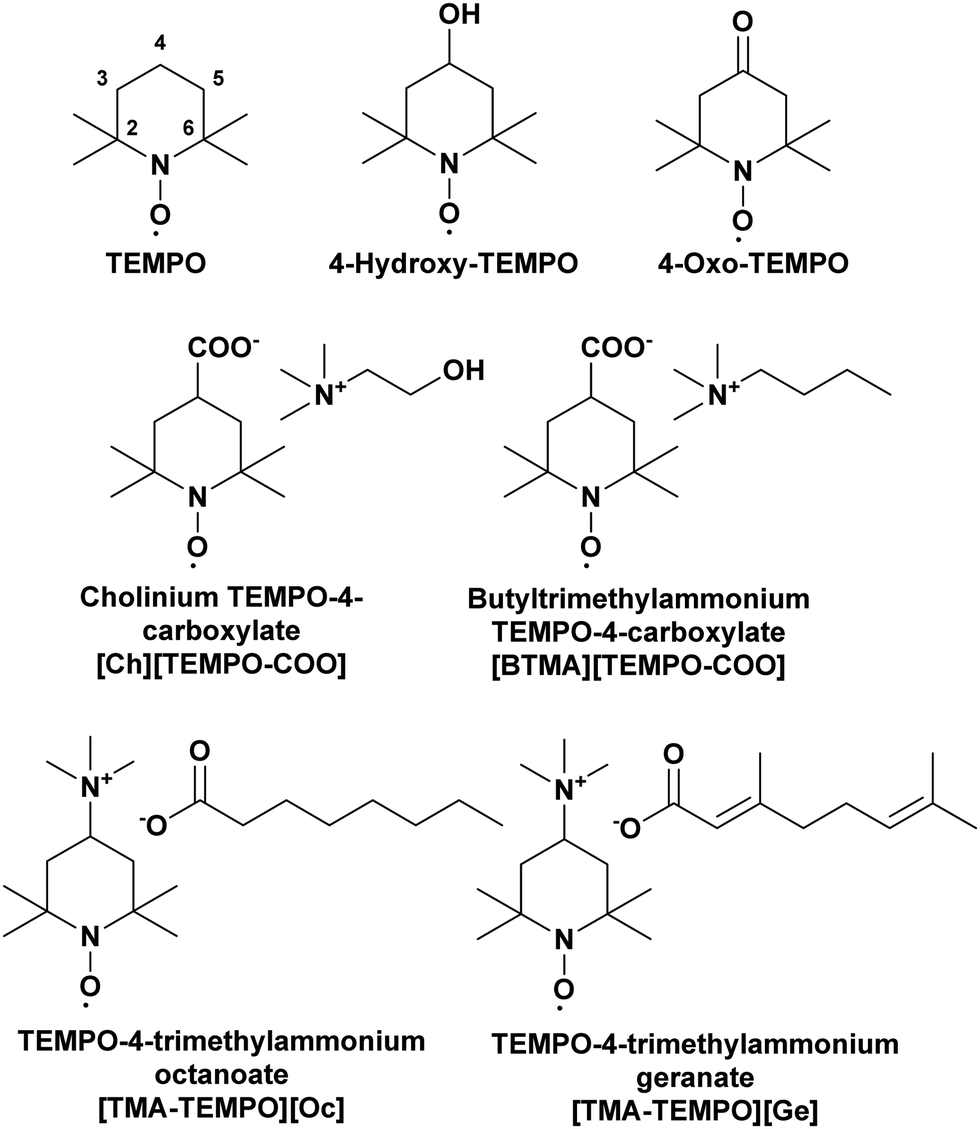 | ||
| Fig. 8 Structures of the spin probes studied in this work. | ||
The parameters determined from the simulations that are of interest for our analyses are the hyperfine interaction (A-values), the rotational correlation times (τc) and the radical partition ratios between the polar and non-polar environments. The hyperfine interaction provides information about delocalisation of the electron spin on the spin probe to nearby nuclei,53 which then can be translated to map the strength of interactions between the radical and its environment. A polar environment (such as the charged heads of our ILs) favours the stabilisation of a zwitterionic structure of the probes, causing an increase of the electron density at the nitrogen atom;54 as a result, Aiso ((Axx + Ayy + Azz)/3) will increase. The rotational correlation time is used to characterise the rotational diffusion of a spin probe (τc = (6Dr)−1, where Dr is the rotational diffusion rate). For CW X-band EPR the detectable mobility is τc < 1 μs, as above that the spectrum is perceived as a solid-state.54 Although our ILs are macroscopically homogeneous, τc can be used to characterise the local microviscosity and to determine and compare the mobility of the spin probe in the polar and the non-polar environments, since it is known that the locally experienced viscosity in ionic liquids changes depending on the solute's preference for the charged or non-polar nanodomain.55
As discussed in the previous section, CAGE does not have a liquid crystalline phase, instead simply transitioning from solid to isotropic liquid. The X-band CW EPR spectra of the TEMPO radical in CAGE are shown in Fig. 9. The solid-state spectrum, recorded at −130 °C, shows a deviation from the single-species solid-state spectrum (as indicated by the shoulder in the middle negative peak), which can be explained by the existence of two distinct radical populations; TEMPO experiences two distinct domains in the IL: a polar domain and a non-polar one. Here, the non-polar population appears dominant (ca. 70%), which is to be expected for the TEMPO radical, as it is more lipophilic and not charged. The contribution of each of the populations to the observed spectrum is shown in Fig. S9 (ESI†). It is important to note that determining accurate percentages for the observed populations is not possible by CW X-band EPR alone; the population ratios presented here should be seen as a general trend to understand partitioning and dynamics in ILs and ionic liquid crystals. At 20 °C, CAGE behaves as a macroscopically isotropic liquid, with no indications of long-range structuring. At both 20 °C and 60 °C, the simulation parameters for the EPR spectra of TEMPO in CAGE match those attributed to the non-polar domain on the solid-state spectrum very closely. This suggests that the isotropic phase in CAGE is dominated by the long alkyl chains of the acid and anion species and is more similar to the non-polar domain than the polar domain. Short-range polar and non-polar domain segregation is expected to be present, as has been observed in long-chained ionic liquids,56 but the exchange between environments is fast and undetectable by room-temperature CW-EPR; therefore, the spectrum indicates a radical that experiences an average of both polar and non-polar environments. The only notable difference between the two temperatures is in the correlation time (τc = 450 and 65 ps respectively), which results from a reduction in viscosity as the temperature is increased. The calculated g- and A-values are the same for both spectra, suggesting that there is no change in the IL-radical interactions.
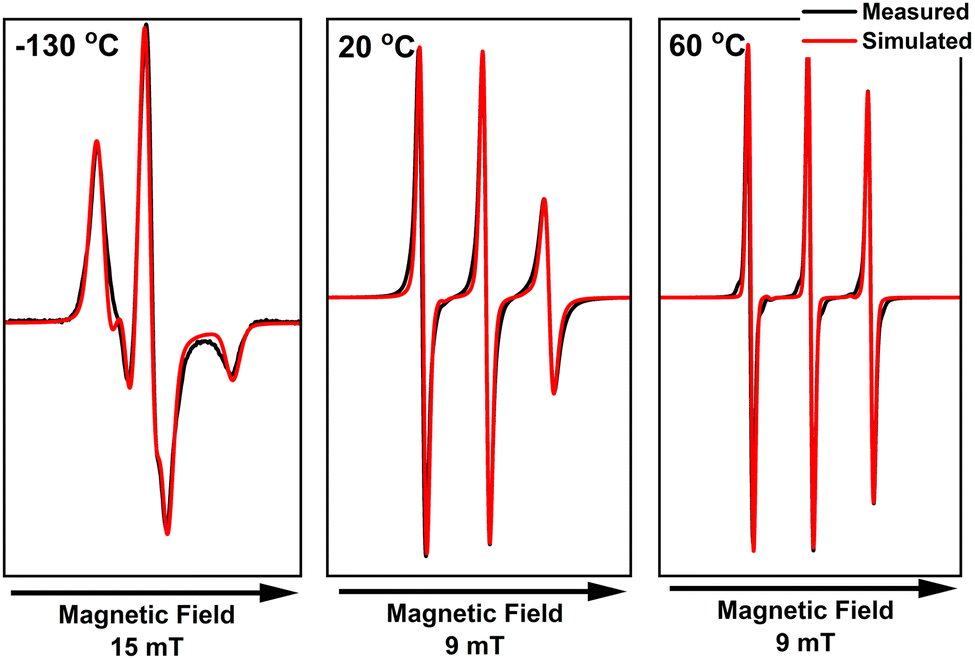 | ||
| Fig. 9 Measured (black) and simulated (red) X-band CW EPR spectra of 1 mM TEMPO in CAGE. The measurements were performed at 9.454 GHz with 100 kHz modulation frequency and 1 mW microwave power. | ||
In all recorded spectra where the linewidth is narrow enough (e.g. the liquid-state spectra in Fig. 9), we can observe satellites at the base of each EPR signal, arising from the coupling of the unpaired electron with 13C nuclei CAGE (see Fig. S10, ESI† for simulations that include 13C). Their inclusion in the simulations significantly increased the computing time but did not change the key parameters extracted from the simulations (g and A values), and they are therefore not included in subsequent simulations.
In order to have a thorough comparison between CAGE and the new ILs, the spectra of 4-hydroxy-TEMPO, 4-oxo-TEMPO, [TMA-TEMPO][Ge] and [Ch][TEMPO-COO] in CAGE were also recorded (ESI,† Fig. S11–S14). The uncharged analogues (4-hydroxy-TEMPO and 4-oxo-TEMPO) showed very similar behaviour to TEMPO, with slightly different g- and A-values (see ESI,† Fig. S11 and S12), which could be attributed to the different interactions between the probe and CAGE, due to the functionalisation of the 4-position of the ring. The most significant difference among the uncharged radicals is the correlation time, as all functionalised analogues appear to have more hindered mobility compared to TEMPO (for 4-hydroxy-TEMPO τc = 2.2 ns at 20 °C and 400 ps at 60 °C, for 4-oxo-TEMPO τc = 1.6 ns at 20 °C and 360 ps at 60 °C). This observation demonstrates that, even when considering molecules with only minor size differences, the solute–solvent interactions (–OH can act as a hydrogen bond donor and acceptor, C![[double bond, length as m-dash]](https://www.rsc.org/images/entities/char_e001.gif) O is a hydrogen bond acceptor) are crucial for the diffusivity of the solute in the IL.
O is a hydrogen bond acceptor) are crucial for the diffusivity of the solute in the IL.
Introducing the charged TEMPO analogues into the system revealed a different behaviour in CAGE. The EPR spectra of both charged radicals show two contributions which arise due to the probes experiencing two distinct chemical environments; this is evident from the difference in the positive and negative peak intensity and the splitting visible in the high-field peaks (see also Fig. S13 and S14, ESI†). For comparison, [Ch][TEMPO-COO] and [TMA-TEMPO][Oc] were also measured in ethanol and in 1-octyl-3-methylimidazolium bis(trifluoromethylsulfonyl)imide ([C8C1im][NTf2]) (see ESI,† Fig. S15), but only a single spectrum was observed. Since the existence of two species is not an inherent property of the synthesised probes and this is also not a general ‘ionic liquid effect’, this observation beautifully showcases our initial statement that the chemical environment inside an ionic liquid is heterogeneous and different solutes can experience different interactions.
The two charged TEMPO analogues, TEMPO itself, and the two functionalised TEMPO derivatives were dissolved in the ILs (CAOC and BTMAAOC) and their EPR spectra recorded. The structures of the functionalised radicals are shown in Fig. 8. CAOC will be discussed first (Fig. 10), as it deviates less from the structure of CAGE, compared to BTMAAOC. For CAOC, the spectra were simulated with the assumption that the non-polar domain, and therefore the non-polar part of the radical population, are larger than their polar counterparts. The liquid crystalline spectrum was used to determine the Aiso values for each population. This spectrum showed splitting in the high-field peak, indicating that the two radical populations (polar and non-polar) give rise to two distinct, partially overlapping sets of peaks. The polar population was found to have higher A-values and lower g-values than the non-polar population. Transitioning from the solid to the liquid crystalline to the isotropic state, the g-values show a small homogeneous shift each time (+0.0003), suggesting that the interactions between the system and the radical change with each phase transition. The simulation-derived polar and nonpolar radical partition ratios and the correlation times are included in Fig. 10. All simulation parameters are summarised in the ESI,† Table S6.
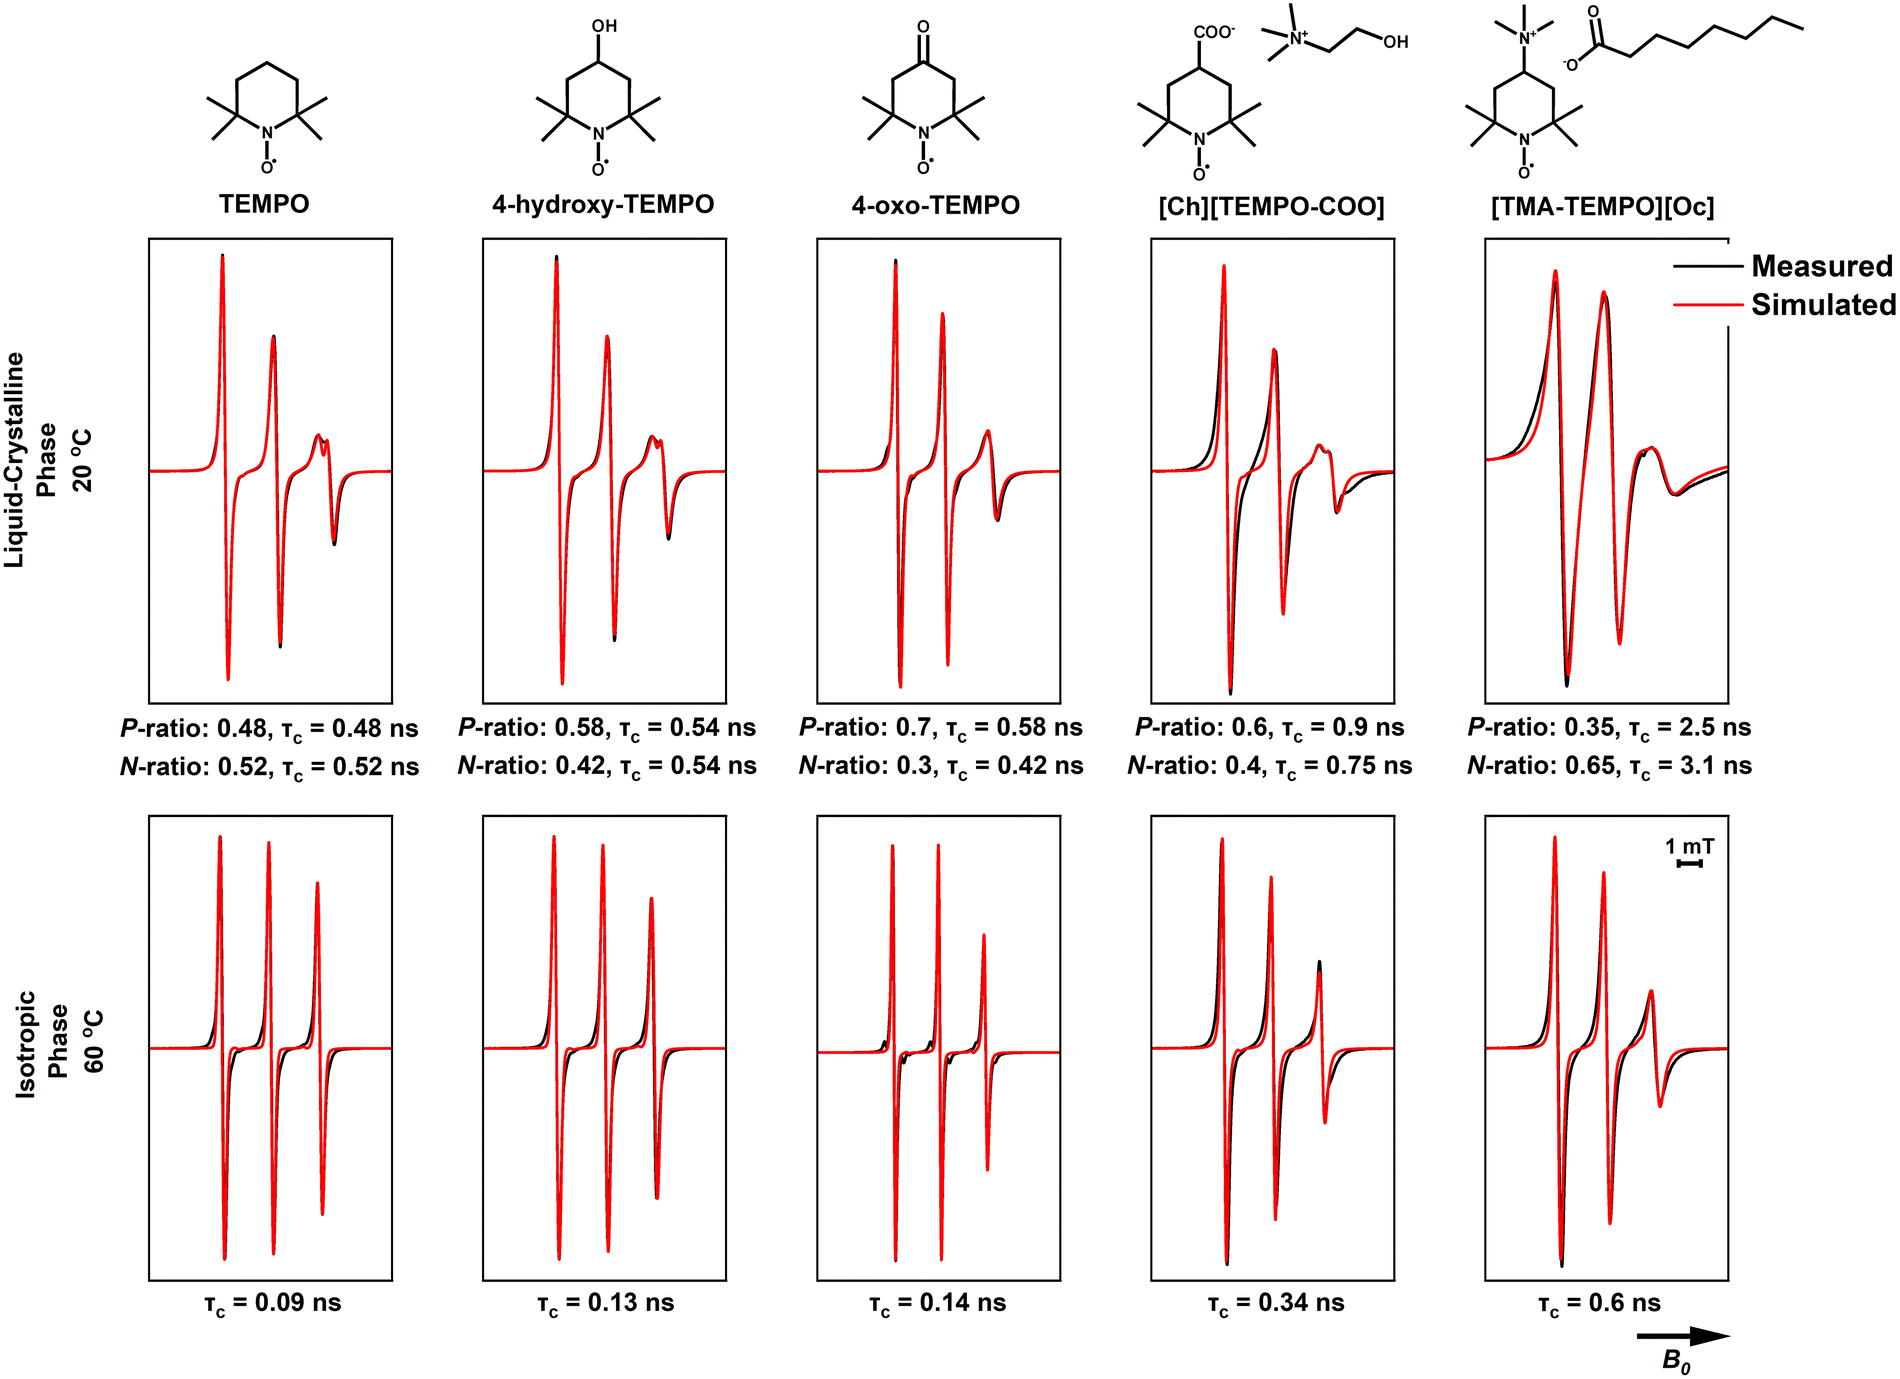 | ||
| Fig. 10 Measured (black) and simulated (red) X-band CW EPR spectra of 1 mM of the studied spin probes in CAOC. The measurements were performed at 100 kHz mod. frequency and 1 mW microwave power. P is the population of the polar domain and N the population of the non-polar domain. These same simulation values (see ESI,† Table S5) were used in fitting each set of spectra; the isotropic phase was simulated using only the non-polar population parameters. | ||
Although their spectra appear very similar, 4-hydroxy-TEMPO has a larger polar-domain population in the solid phase (40% versus 32%, ESI,† Table S6) compared to TEMPO and diffuses more slowly (τc = 0.13 ns versus τc = 0.09 ns) in the isotropic phase. This is explained by the presence of the hydroxyl group, which increases the polarity of the radical and allows it to form hydrogen bonds with the polar domain of the solvent, hindering its rotational mobility.
4-Oxo-TEMPO shows a different behaviour in CAOC. It has reduced ring flexibility due to the stiff carbonyl group in the 4-position and adopts a twisted ring conformation, while TEMPO-derivatives with a single bond substituent in the 4-position adopt a chair conformation.57 4-Oxo-TEMPO has also been shown to have narrower linewidths than TEMPO, as a result of the reduced isotropic spin density of the 12 hydrogen atoms in the α-position of the ring (causing a reduced broadening due to unresolved hyperfine interactions), due to the unique electronic configuration of the double-bonded substituent.58 Unlike TEMPO and 4-hydroxy-TEMPO, which favour the non-polar domain, the majority of the 4-oxo-TEMPO population (70%) is found in the polar domain. Additionally, the Az of this population increases when transitioning from the solid state to the liquid-crystalline one, suggesting that the interaction between the radical and its environment becomes stronger upon this transition. This is likely to be due to hydrogen bonding between both the nitroxide and ketone groups of the radical (both hydrogen bond acceptors) and the IL hydroxyl group (on the cholinium ion) and the proton associated with the acid/carboxylate complex. Finally, 4-oxo-TEMPO shows a broadening of the high-field peak in the liquid-crystalline phase, rather than a splitting, suggesting that the g-values of the two populations deviate less than in the previous cases; this could be an indication that 4-oxo-TEMPO being only a weak hydrogen bond acceptor, is affected less by the polarity changes between the two environments.
[TEMPO-COO]− is a negatively charged radical, used here as its cholinium salt, [Ch][TEMPO-COO]. The radical showed broadening in both the liquid crystalline and isotropic phases, which could be due to hyperfine interactions between the radical and nearby atoms. In order to understand the nature of these interactions, single-crystal X-ray crystallography was performed on [Ch][TEMPO-COO]. The obtained crystal structure can be found in the ESI† (Fig. S17) and shows that the carboxylate group of the radical is stabilised by hydrogen bonding interactions with the hydroxyl group of the cholinium cation. If this orientation is also preferred in the isotropic phase, with the nitroxide radical close to the charged trimethylammonium moiety of the cholinium, their interaction could be the cause of the observed broadening. Despite the inherently ionic nature of [Ch][TEMPO-COO], we can still observe two distinct populations in the frozen and liquid-crystalline spectra, with the polar population being the dominant (60% polar population).
The final radical, [TMA-TEMPO]+, is a charged, cationic radical, used as its octanoate salt, [TMA-TEMPO][Oc]. Like [TEMPO-COO]−, [TMA-TEMPO][Oc] also showed line-broadening; in this case, the salt did not produce crystals, and without a crystal structure the interactions responsible for the broadening could not be identified. One unusual observation for this charged radical is that the dominant population appears to be the non-polar one (65% non-polar population); the increased correlation times could explain this behaviour, as the radical shows restricted mobility due to being ‘trapped’ in an environment with unfavoured interactions. The broadened linewidth of the spectrum at 20 °C does not allow for more information to be extracted with confidence, however our current hypothesis (which is also discussed below) is that although it seems counterintuitive, the partition of the charged radical to the non-polar domain is preferred in order to maintain local electrical neutrality. It is also possible that [TMA-TEMPO]+ acts as a ‘bridge’ between the polar and non-polar domains, with the charged head and the uncharged nitroxide orienting towards the polar and the non-polar domains respectively.
The simulations for TEMPO in BTMAAOC used the same g- and A-values as for CAOC, with a small, homogeneous shift to the g-vector (+0.0002).59 Similar to CAOC, in BTMAAOC the rotation of TEMPO appears less restricted than that of 4-hydroxy-TEMPO (Fig. 11), both in the liquid crystalline (for the polar populations, τc = 0.45 ns for TEMPO versus τc = 1.3 for 4-hydroxy-TEMPO) and isotropic phases (τc = 0.04 ns for TEMPO versus 0.29 ns for 4-hydroxy-TEMPO). However, while CAOC has larger bulk viscosity, 4-hydroxy-TEMPO shows greater rotational hindrance in BTMAAOC. This difference can be attributed to hydrogen bonding between 4-hydroxy-TEMPO and the IL; TEMPO, which has a lower hydrogen bonding capacity than 4-hydroxy-TEMPO, does not appear as rotationally restricted and the spectral difference between the two ILs is less profound. In CAOC, the hydroxyl groups of the cholinium cations provide an abundance of hydrogen bond donors to the system; the absence of these in BTMAAOC leaves the hydrogen bond acceptor sites in the IL available to the 4-hydroxy-TEMPO, which it takes advantage of.
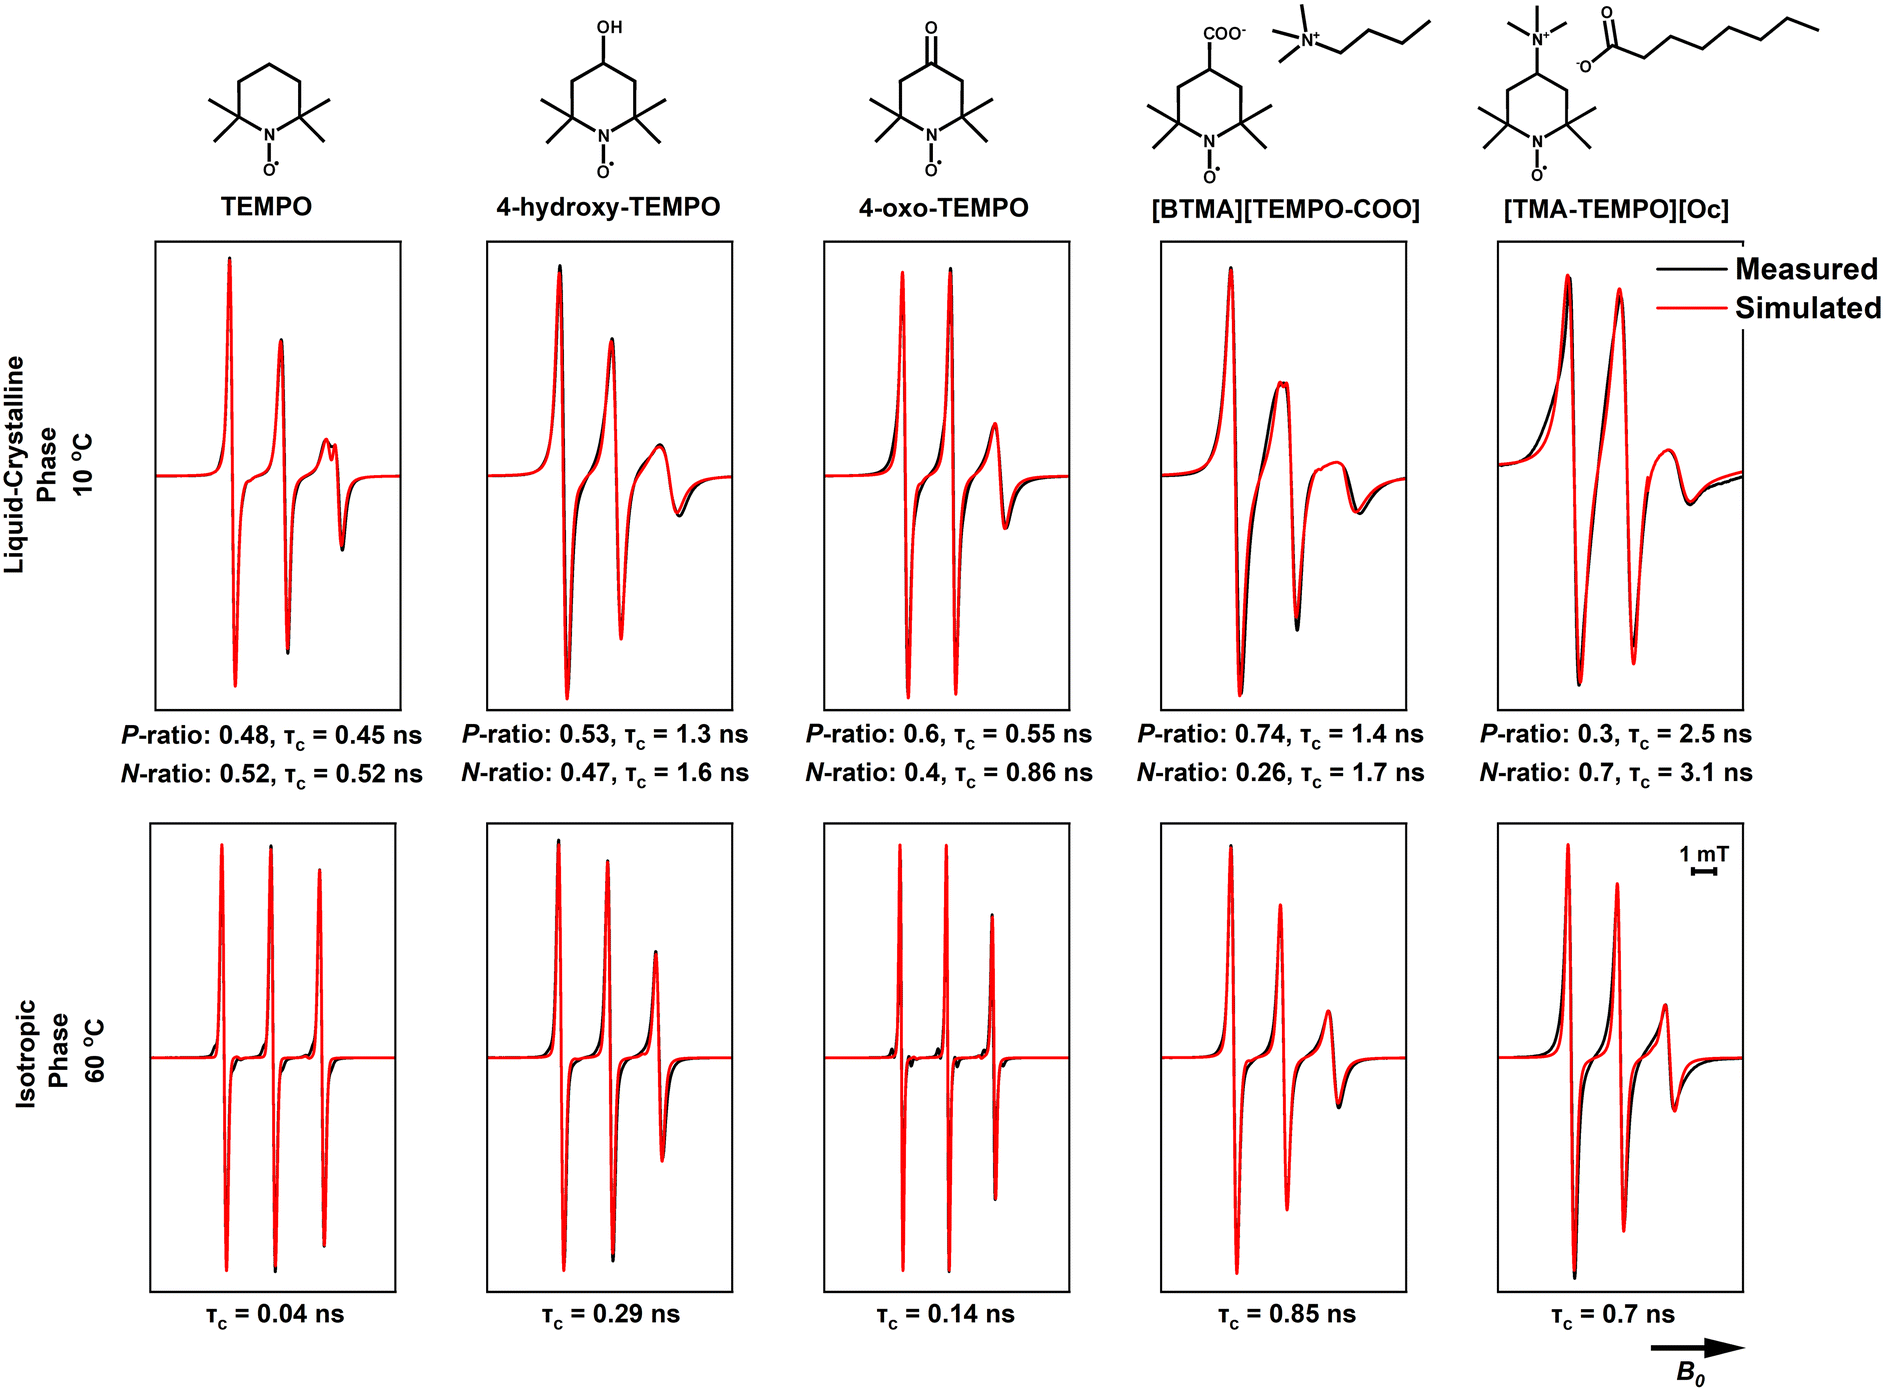 | ||
| Fig. 11 Measured (black) and simulated (red) X-band CW EPR spectra of 1 mM of the studied spin probes in BTMAAOC. The measurements were performed at 100 kHz mod. frequency and 1 mW microwave power. P is the population of the polar domain and N the population of the non-polar domain. | ||
4-Oxo-TEMPO in BTMAAOC (Fig. 11) has similar behaviour as in CAOC, with only minor differences in the correlation times and hyperfine interactions (see ESI,† Tables S6 and S7). This behaviour is reasonable, as this spin probe is a hydrogen bond acceptor and the majority of its interactions are related to the strongest hydrogen bond donor in the system, which in both cases is the proton associated with the acid/carboxylate complex. The only significant difference between the two ILs is that the non-polar population of 4-oxo-TEMPO has a higher correlation time in BTMAAOC compared to CAOC (τc = 0.86 ns compared to τc = 0.42 ns). This could indicate an increase in the local viscosity of the non-polar domain of the IL, the origin of which is not clear at this point.
[BTMA][TEMPO-COO] and [TMA-TEMPO][Oc] again show broadened linewidths compared to the non-charged probes, verifying that introducing a charged solute into the system gives rise to additional (unresolved) interactions. In order to better understand this, one has to think in terms of solute mobility and diffusion through viscous systems. A small, non-charged solute (such as TEMPO) diffuses through the viscous media with no significant obstacles, however a charged solute (such as [TMA-TEMPO]+ and [TEMPO-COO]−) needs to maintain local neutrality. It has been shown that charge ordering in ILs results in the formation of cages of oppositely charged solvent ions around the solute.60,61 The long-range diffusion of the solute comes as a result of ‘jumping’ between cages; this jump has a higher activation energy when the solvent ions are bulky (such as in the case of our ILs). This theory agrees with the slow rotations observed for [TMA-TEMPO]+. The radical is forced to form neutral clusters (e.g., ion pairs) in the non-polar domain of the liquid crystal; these clusters are considerably bulkier than the small-molecule neutral probes, so they exhibit slower rotation and diffusion than the uncharged radicals.
In summary, our EPR investigations show that the functional groups attached to the spin probes play a key role in the dynamics and partitioning of the solutes between polar and non-polar domains in the ILs. Above its melting point, CAGE shows a macroscopically isotropic behaviour in the liquid state, but EPR of charged solutes reveals these to be in an equilibrium between two distinct chemical environments while uncharged solutes show single populations that are primarily affected by hydrogen bonding and electrostatic interactions. This arises because the exchange of the charged solutes between the two domains is slow, while the exchange of the neutral solutes between these two domains is fast compared to the EPR timescale. In the solid state all solutes show two populations, split between the two domains. The results for CAOC and BTMAAOC appear quite different compared to CAGE; in the liquid-crystalline phase all solutes partition between the two chemical environments (with different degrees of partitioning depending on their chemical interactions/polarity), while in the isotropic phase at higher temperatures, no partitioning was observed for any solute. As summarised in Fig. 12, for both CAOC and BTMAAOC, in the liquid crystalline phase, the spin probes with stronger hydrogen bonding groups (4-hydroxy-TEMPO, 4-oxo-TEMPO and [TEMPO-COO]−) show a partition preference towards the polar domain, while [TMA-TEMPO]+ shows a preference towards the non-polar domain. Moreover, the charged spin probes show more restricted rotations in the ILs compared to the non-charged probes, indicating that electrostatic interactions are key for tuning the diffusion of the solute.
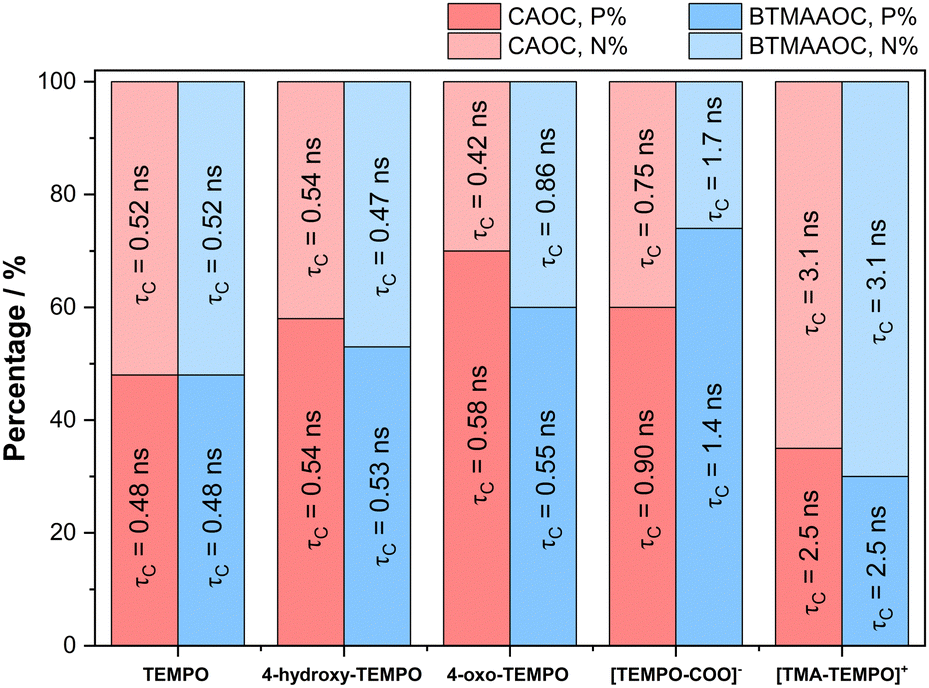 | ||
| Fig. 12 Bar chart comparing the P and N populations and the correlation times of the studied spin probes in CAOC and BTMAAOC. P is the population of the polar domain and N the population of the non-polar domain. | ||
Conclusions
Even though 1:2 CAGE is considered a promising candidate in several medicinal applications, there are important problems that prevent it from being widely used: its synthesis is expensive and time-consuming, the IL tends to be thermally unstable and the molecular characteristics that give it its advantageous properties are not well-understood. In this work we investigated and compared the properties of 1:2 CAGE and of two other ILs (CAOC and BTMAAOC) that have similar structures, but don’t show the same drawbacks when it comes to synthesis and storage. Both of these ILs were successfully synthesised in adequate purities without the need for repeated recrystallisation to achieve a pure sample.
While CAGE is synthesised using geranic acid, CAOC and BTMAAOC were synthesised using octanoic acid, which lacks the branching and unsaturation that are present in the chain of geranic acid. This change in structure resulted in ILs with a liquid crystalline phase (as verified by both DSC and polarising microscopy). We have identified that hydrogen bonding is a key component in the stabilisation of this liquid crystalline phase, as BTMAAOC (which lacks the hydroxyl group in the ammonium cation) has a less thermally persistent liquid crystalline phase than CAOC.
The rheological and thermal characteristics of the ILs were characterised using dynamic and oscillating rheology and DMA. Dynamic rheology measurements, performed on the isotropic phases of the ILs, showed that transitioning from CAGE to CAOC did not significantly affect the viscosity of the liquid, but reducing the hydrogen bonding capacity of the IL (transitioning from CAOC to BTMAAOC) resulted in a more fluid system. According to the oscillating rheology measurements (also verified by DMA) the liquid-crystalline phase of CAOC and BTMAAOC has a strongly elastic behaviour (tanδ < 0.4), while at temperatures higher than that of the liquid crystal to isotropic phase transition the resulting phases have an isotropic viscous behaviour (tanδ tends to infinity).
The DMA measurements were also used to investigate thermally activated relaxation processes occurring in all three ILs. The activation energies for these processes were calculated from the tanδ data measured by DMA on cooling and were found to be in agreement with the activation energies calculated from the VFT fit of dynamic viscosity data. Despite the fact that DMA data was recorded in the liquid-crystalline phase and dynamic viscosity data was recorded in the isotropic phase of the ILs, in both cases CAOC showed a larger activation energy value compared to BTMAAOC, further supporting the hypothesis that increased hydrogen bonding leads to stronger interactions in the IL.
Drug stabilisation and delivery has been of great interest for CAGE and its analogues, so understanding the solute–solvent interactions in those systems is of utmost importance. Therefore, we used EPR spectroscopy as a tool to understand the chemical environment and gain insight on these interactions. Our studies showed that the chemical environment experienced by a solute is dependent on both the IL and the solute itself. The correlation time and the A and g-values show that the type and strength of interactions are significantly different from solute to solute.
In the case of CAOC and BTMAAOC several radical solutes, both charged and neutral, were investigated using EPR. When measuring the liquid-crystalline phase of the ILs, the spectra showed splitting of the high-field peak, suggesting that the radicals experience two different domains; the splitting disappears once the system is heated past the liquid crystal to isotropic transition temperature. Uncharged solutes also showed different behaviours depending on their functionalisation and the nature of the IL. While TEMPO showed similar correlation times in both CAOC and BTMAOC, 4-hydroxy-TEMPO showed a larger correlation time, indicative of more restricted rotation, in BTMAAOC. Since the only difference between the two probes is the hydroxyl group present in 4-hydroxy-TEMPO, we attribute the increase in correlation time to hydrogen-bonding interactions taking place between the IL and the radical. Like the previously discussed physical measurements, this suggests that hydrogen bonding interactions are desired in order to stabilise the liquid crystal. Finally, charged solutes showed line-broadening, suggesting that additional interactions occur between the radical and the IL, likely stemming from the need to maintain local neutrality around the charged solute.
All these observations are expected to affect the reactivity of specific solutes (in cases such as catalysis or kinetics investigations) or even the permeability of membranes or the delivery rates of molecules bearing such functional groups. The ILs appear to be significantly structured, and the two environments have different interaction profiles. The preference of the solute towards the polar or non-polar environment will significantly affect both its chemical (e.g. reactivity) and physical (e.g. diffusion) properties. Gaining a deeper understanding on how different functional groups promote specific interactions can help ‘match’ a solute to its task-specific solvent and achieve optimum outcomes in every desired process.
Author contributions
Conceptualisation A. D., S. K., T. W.; supervision T. W.; investigation A. D., S. K., F. P., D. R., O. P.; methodology A. D., S. K., F. P., D. R., O. P.; writing – original draft preparation A. D., S. K., O. P.; writing – review & editing A. D., S. K., F. P., D. R., O. P., M. M. R., C. W. M. K., T. W.Conflicts of interest
There are no conflicts to declare.Acknowledgements
A. D.'s funding was supported by GlaxoSmithKline Biologicals SA and the Engineering and Physical Sciences Research Council (EPSRC). The authors thank Dr Nicholas J. Brooks and his group for helping with the polarising microscopy measurements, Dr Andrew White for X-ray crystallography measurements and Dr Maryam Seif Eddine for helping with the analysis of the EPR spectra. NMR spectra were recorded at the NMR facility of the Department of Chemistry at Imperial College London. The EPR measurements were performed at the Centre for Pulse EPR (PEPR) at Imperial College London, supported by the EPSRC grant EP/T031425/1 to M. M. R. This work has received funding from the Joint Bilateral Agreement CNR/Royal Society (UK) – Biennial Programme 2022–2023 – project number 0082091-2021 and from the Leverhulme Trust – Research Grant reference RPG-2021-383.Notes and references
- J. P. Hallett and T. Welton, Chem. Rev., 2011, 111, 3508–3576 CrossRef CAS.
- A. P. Abbott, D. Boothby, G. Capper, D. L. Davies and R. K. Rasheed, J. Am. Chem. Soc., 2004, 126, 9142–9147 CrossRef CAS.
- T. Welton, Biophys. Rev., 2018, 10, 691–706 CrossRef CAS PubMed.
- A. Berthod, M. J. Ruiz-Ángel and S. Carda-Broch, J. Chromatogr. A, 2018, 1559, 2–16 CrossRef CAS PubMed.
- Q. Zaib, M. J. Eckelman, Y. Yang and D. Kyung, Green Chem., 2022, 24, 7924–7930, 10.1039/D2GC01752K.
- C. W. Cho, T. P. T. Pham, Y. Zhao, S. Stolte and Y. S. Yun, Sci. Total Environ., 2021, 786, 147309 CrossRef CAS PubMed.
- D. Skarpalezos, A. Tzani, E. Avraam, C. Politidis, A. Kyritsis and A. Detsi, J. Mol. Liq., 2021, 344, 117754 CrossRef CAS.
- B. A. D. Neto, A. A. M. Lapis and R. Y. Souza, ed. S. Zhang, Springer, Singapore, Singapore, 2019, pp. 1–11.
- M. Freemantle, Chem. Eng. News, 1998, 76, 32–37 CrossRef.
- S. Koutsoukos, F. Philippi, F. Malaret and T. Welton, Chem. Sci., 2021, 12, 6820–6843 RSC.
- J. L. Shamshina, P. S. Barber and R. D. Rogers, Expert Opin. Drug Delivery, 2013, 10, 1367–1381 CrossRef CAS PubMed.
- C. Agatemor, K. N. Ibsen, E. E. L. Tanner and S. Mitragotri, Bioeng. Transl. Med., 2018, 3, 7–25 CrossRef PubMed.
- P. Hinderliter and S. A. Saghir, in Encyclopedia of Toxicology, ed. P. Wexler, Academic Press, Oxford, 3rd edn, 2014, pp. 849–855 Search PubMed.
- K. Higaki, C. Amnuaikit and T. Kimura, Am. J. Drug Delivery, 2003, 1, 187–214 CrossRef.
- M. Moniruzzaman, Y. Tahara, M. Tamura, N. Kamiya and M. Goto, Chem. Commun., 2010, 46, 1452–1454 RSC.
- C. Wang, J. Zhu, D. Zhang, Y. Yang, L. Zheng, Y. Qu, X. Yang and X. Cui, Int. J. Pharm., 2018, 535, 120–131 CrossRef CAS PubMed.
- K. Kubota, A. Shibata and T. Yamaguchi, Eur. J. Pharm. Sci., 2016, 86, 75–83 CrossRef CAS PubMed.
- G. S. Lim, S. Jaenicke and M. Klähn, Phys. Chem. Chem. Phys., 2015, 17, 29171–29183 RSC.
- M. Zakrewsky, K. S. Lovejoy, T. L. Kern, T. E. Miller, V. Le, A. Nagy, A. M. Goumas, R. S. Iyer, R. E. DelSesto, A. T. Koppisch, D. T. Fox and S. Mitragotri, Proc. Natl. Acad. Sci. U. S. A., 2014, 111, 13313–13318 CrossRef CAS PubMed.
- E. E. L. Tanner, A. M. Curreri, J. P. R. Balkaran, N. C. Selig-Wober, A. B. Yang, C. Kendig, M. P. Fluhr, N. Kim and S. Mitragotri, Adv. Mater., 2019, 31, 1–10 CrossRef PubMed.
- A. Banerjee, K. Ibsen, T. Brown, R. Chen, C. Agatemor and S. Mitragotri, Proc. Natl. Acad. Sci. U. S. A., 2018, 115, 7296–7301 CrossRef CAS PubMed.
- E. E. L. Tanner, K. N. Ibsen and S. Mitragotri, J. Controlled Release, 2018, 286, 137–144 CrossRef CAS PubMed.
- A. Banerjee, K. Ibsen, Y. Iwao, M. Zakrewsky and S. Mitragotri, Adv. Healthcare Mater., 2017, 6, 1–11 Search PubMed.
- J. Ko, A. Mandal, S. Dhawan, M. Shevachman, S. Mitragotri and N. Joshi, Bioeng. Transl. Med., 2021, 6, e10191 CrossRef CAS PubMed.
- J. R. Greene, K. L. Merrett, A. J. Heyert, L. F. Simmons, C. M. Migliori, K. C. Vogt, R. S. Castro, P. D. Phillips, J. L. Baker, G. E. Lindberg, D. T. Fox, R. E. del Sesto and A. T. Koppisch, PLoS One, 2019, 14, 1–22 CrossRef PubMed.
- J. Takeda, Y. Iwao, M. Karashima, K. Yamamoto and Y. Ikeda, ACS Biomater. Sci. Eng., 2021, 7, 595–604 CrossRef CAS PubMed.
- E. E. L. Tanner, K. M. Piston, H. Ma, K. N. Ibsen, S. Nangia and S. Mitragotri, ACS Biomater. Sci. Eng., 2019, 5, 3645–3653 CrossRef CAS PubMed.
- S. K. Mann, M. K. Devgan, W. T. Franks, S. Huband, C. L. Chan, J. Griffith, D. Pugh, N. J. Brooks, T. Welton, T. N. Pham, L. L. McQueen, J. R. Lewandowski and S. P. Brown, J. Phys. Chem. B, 2020, 124, 4975–4988 CrossRef CAS PubMed.
- E. E. L. Tanner, A. M. Curreri, J. P. R. Balkaran, N. C. Selig-Wober, A. B. Yang, C. Kendig, M. P. Fluhr, N. Kim and S. Mitragotri, Adv. Mater., 2019, 31, 1–10 CrossRef PubMed.
- S. Koutsoukos, J. Becker, A. Dobre, Z. Fan, F. Othman, F. Philippi, G. J. Smith and T. Welton, Nat. Rev. Methods Primers, 2022, 2, 49 CrossRef CAS.
- M. Zakrewsky, K. S. Lovejoy, T. L. Kern, T. E. Miller, V. Le, A. Nagy, A. M. Goumas, R. S. Iyer, R. E. DelSesto, A. T. Koppisch, D. T. Fox and S. Mitragotri, Proc. Natl. Acad. Sci. U. S. A., 2014, 111, 13313–13318 CrossRef CAS PubMed.
- O. Palumbo, F. Trequattrini, F. M. Vitucci and A. Paolone, J. Phys. Chem. B, 2015, 119, 12905–12911 CrossRef CAS PubMed.
- O. Palumbo, F. Trequattrini, G. B. Appetecchi, L. Conte and A. Paolone, J. Mol. Liq., 2017, 243, 9–13 CrossRef CAS.
- O. Palumbo, A. Paolone, D. Rauber, C. W. M. Kay, F. Philippi and T. Welton, J. Alloys Compd., 2022, 919, 165860 CrossRef CAS.
- F. Philippi, D. Rauber, O. Palumbo, K. Goloviznina, J. Mcdaniel, D. Pugh, S. Suarez, C. C. Fraenza, A. Padua, C. W. M. Kay and T. Welton, Chem. Sci., 2022, 9176–9190 RSC.
- C. A. Schneider, W. S. Rasband and K. W. Eliceiri, Nat. Methods, 2012, 9, 671–675 CrossRef CAS PubMed.
- S. Koutsoukos, F. Philippi, D. Rauber, D. Pugh, C. W. M. Kay and T. Welton, Phys. Chem. Chem. Phys., 2022, 24, 6453–6468 RSC.
- S. Stoll and A. Schweiger, J. Magn. Reson., 2006, 178, 42–55 CrossRef CAS PubMed.
- F. Philippi and T. Welton, Phys. Chem. Chem. Phys., 2021, 23, 6993–7021 RSC.
- R. Stefanovic, M. Ludwig, G. B. Webber, R. Atkin and A. J. Page, Phys. Chem. Chem. Phys., 2017, 19, 3297–3306 RSC.
- A. I. M. C. Lobo Ferreira, A. S. M. C. Rodrigues, M. Villas, E. Tojo, L. P. N. Rebelo and L. M. N. B. F. Santos, ACS Sustainable Chem. Eng., 2019, 7, 2989–2997 CrossRef CAS.
- S.-T. Wu, U. Efron and L. D. Hess, Appl. Opt., 1984, 23, 3911 CrossRef CAS PubMed.
- T. Akahane, T. Tako and S. Masubuchi, Int. J. Opt., 1979, 26, 943–950 CAS.
- D. Yang, B. Armitage and S. R. Marder, Angew. Chem., Int. Ed., 2004, 43, 4402–4409 CrossRef CAS PubMed.
- S. Jewell, Liq. Cryst. Today, 2009, 18, 59–60 CrossRef.
- N. Murazawa, S. Juodkazis and H. Misawa, in Optical Trapping and Optical Micromanipulation III, ed. K. Dholakia and G. C. Spalding, 2006, vol. 6326, p. 632630 Search PubMed.
- I. Kayali, T. Suhery, S. E. Friberg, F. A. Simion and L. D. Rhein, J. Pharm. Sci., 1991, 80, 428–431 CrossRef CAS PubMed.
- H. A. Barnes, Powder Technol., 1996, 86, 313 CrossRef CAS.
- H. A. Barnes, J. F. Hutton and K. Walters, An introduction to rheology, Elsevier, Amsterdam, 1989, vol. 3 Search PubMed.
- O. Palumbo, R. Cantelli, A. Paolone, C. M. Jensen and S. S. Srinivasan, J. Alloys Compd., 2005, 748–751 CrossRef CAS.
- O. Palumbo, F. Trequattrini, F. M. Vitucci, M. A. Navarra, S. Panero and A. Paolone, Adv. Condens. Matter Phys., 2015, 2015, 176067 Search PubMed.
- W. F. Marashdeh, J. Longun and J. O. Iroh, Mechanics of Solid Polymers, Elsevier Inc., 2015, pp. 19–114 Search PubMed.
- M. M. Roessler and E. Salvadori, Chem. Soc. Rev., 2018, 47, 2534–2553 RSC.
- D. Kurzbach, M. J. N. Junk and D. Hinderberger, Macromol. Rapid Commun., 2013, 34, 119–134 CrossRef CAS PubMed.
- J. C. Araque and C. J. Margulis, J. Chem. Phys., 2018, 149, 144503 CrossRef PubMed.
- S. Koutsoukos, J. Avila, N. J. Brooks, M. Costa Gomes and T. Welton, Phys. Chem. Chem. Phys., 2023, 25, 6316–6325 RSC.
- P. Knowles, Biochem. Soc. Trans., 1976, 4, 941–942 CrossRef.
- J. Hunold, J. Eisermann, M. Brehm and D. Hinderberger, J. Phys. Chem. B, 2020, 124, 8601–8609 CrossRef CAS PubMed.
- A. Kh Vorob’ev and N. A. Chumakova, Russ. Chem. Bull., 2005, 54, 195–200 CrossRef.
- J. C. Araque, S. K. Yadav, M. Shadeck, M. Maroncelli and C. J. Margulis, J. Phys. Chem. B, 2015, 119, 7015–7029 CrossRef CAS PubMed.
- J. C. Araque and C. J. Margulis, J. Chem. Phys., 2018, 149, 144503 CrossRef PubMed.
Footnotes |
| † Electronic supplementary information (ESI) available: Synthesis details, thermal transition data, viscosity raw data and fitting parameters, dynamic mechanical analysis raw data and fitting, polarising microscopy images of CAGE, EPR measurements of different radicals in CAGE, EPR measurements of TEMPO in CAOC, crystal structure of [Ch][TEMPO-COO] radical salt, EPR spectra simulation parameters. CCDC 2283380. For ESI and crystallographic data in CIF or other electronic format see DOI: https://doi.org/10.1039/d3cp05271k |
| ‡ These authors contributed equally. |
| This journal is © the Owner Societies 2024 |