 Open Access Article
Dissociative electron attachment to carbon tetrachloride probed by velocity map imaging†
Anirban
Paul
 a,
Dhananjay
Nandi
 ab,
Daniel S.
Slaughter
 c,
Juraj
Fedor
 d and
Pamir
Nag
 *d
*d
aIndian Institute of Science Education and Research Kolkata, Mohanpur 741246, India
bCenter for Atomic, Molecular and Optical Sciences & Technologies, Joint Initiative of IIT Tirupati & IISER Tirupati, Yerpedu, 517619, Andhra Pradesh, India
cChemical Sciences Division, Lawrence Berkeley National Laboratory, Berkeley, CA 94720, USA
dJ. Heyrovský Institute of Physical Chemistry, Czech Academy of Sciences, 182 23, Dolejškova 2155/3, Prague, Czech Republic. E-mail: pamir.nag@jh-inst.cas.cz
First published on 9th January 2024
Abstract
Bond-breaking in CCl4via dissociative electron attachment (DEA) has been studied using a velocity map imaging (VMI) spectrometer. A number of effects related to the dissociation dynamics have been revealed. The near-zero eV s-wave electron attachment, which leads to the production of Cl− anions, is accompanied by a very efficient intramolecular vibrational redistribution. This is manifested by a small fraction of the excess energy being released in the form of the fragments' translation energy. A similar effect is observed for higher-lying electronic resonances with one exception: the resonance centered around 6.2 eV leads to the production of fast Cl2− fragments and their angular distribution is forward peaking. This behavior could not be explained with a single-electronic-state model in the axial recoil approximation and is most probably caused by bending dynamics initiated by a Jahn–Teller distortion of the transient anion. The CCl2− fragment has a reverse backward-peaking angular distribution, suggesting the presence of a long-distance electron hopping mechanism between the fragments.
1 Introduction
Carbon tetrachloride (CCl4) is a colorless, dense, highly toxic, volatile, nonflammable liquid with a characteristic odor. It is a tetrahedral molecule with four equivalent C–Cl bonds. Its electronic structure can be described by four bonding molecular orbitals (MOs) resulting from the overlap of the valence orbitals on C and Cl. CCl4 is commonly used as a non-polar solvent.1 It had been also used in dry cleaning and as a degreasing agent. CCl4 is also extensively used in the synthesis of refrigerants and propellants, and as a processing agent in numerous large-scale industrial processes. In addition, CCl4 is commonly used as a chlorine source in dry etching plasma processes. But due to its ozone depletion potential, carbon tetrachloride was included in the Montreal Protocol in 1987, and a prohibition on its use was agreed upon for developed countries by 1996. Currently, large-scale use of CCl4 is prohibited in most of the countries around the world.2 In recent years, CCl4 has been almost completely replaced for these applications by tetrachloroethylene (C2Cl4), as it is much more stable and less toxic.CCl4 belongs to one of the most frequently studied molecules with respect to electron collisions and electron attachment reactions in particular.3–14 The motivation for this interest arises both due to applications in plasma processing and due to fundamental aspects of electron attachment to this gas. The fundamental interest concerns primarily the low-energy behaviour: the production of Cl− from CCl4 is exothermic and reaches a very high cross-section approaching the de Broglie limit.15 An in-depth overview of beam and swarm electron-collision data with CCl4 has been recently provided by Ragesh Kumar et al.; only the results directly relevant to the present work will be listed here.14 The first detection of Cl− upon electron collisions with CCl4 was by Baker and Tate.16
Reese et al. reported the formation of Cl−, Cl2− and CCl3− ions via dissociative electron attachment (DEA).3 Craggs et al. reported Cl− formation via DEA and dipolar dissociation between 0- to 70-eV.4 Later, two overlapping resonances were observed in the Cl− ion yield.5–8 The first dominant contribution is at around 0 eV while the second one is close to 0.8 eV. Hickam and Berg found a distinct reduction in the intensity of the lower energy peak when the gas temperature was increased from about 353 K to about 523 K while the higher energy peak was practically unaffected by the gas temperature.8 Spence and Schulz found a slight increase in the yield of the second peak at a higher temperature (1060 K).9 On the other hand, Matejcik et al. found that the intensity of both Cl− peaks are independent of temperature in the range between 300–550 K, and concluded that the previous observations may have been influenced by thermal decomposition of CCl4, leading to HCl formation and thus increasing Cl− production at 0.8 eV.10 Scheunemann et al. obtained the negative ion yield of different fragment ions produced from the DEA to CCl4.11 The authors observed three peaks at around 0, 0.8, and 6-eV for Cl− ion production while two peaks at around 0.8- and 6-eV in the ion yield curve of Cl2−, CCl2−, and CCl3−. Illenberger measured the kinetic energy of the CCl2− ions produced due to DEA to CCl4 and found that the ions are produced with higher kinetic energy around the higher energy resonance peak.12 Li et al. detected the neutral ion fragments produced near zero eV using a delayed higher-energy electron pulse to ionize the neutrals.13 Most recently Carime and Kopyra studied the low energy electron collisions with CCl4 thin films deposited onto a cold gold substrate.17
We are not aware of any velocity map imaging (VMI) study of DEA to CCl4. The reason is probably technical: in DEA-VMI instruments, it is generally difficult to attain incident electron beams with energies below some 3 eV. At the same time, interesting dynamical effects, for which the VMI technique is ideally suited, can be expected at low energies in CCl4. Collision experiments of CCl4 with Rydberg atoms, suggest that in spite of the very short lifetime of the CCl4− transient anion (units to tens of picoseconds), only a small fraction of the excess energy of reaction appears as translational energy of fragments upon the dissociation.18,19
In the present article, we performed DEA to CCl4 using a DEA-VMI setup where an electron beam with incident energies below 1 eV can be attained.20,21 We show that a similar effect to that which appears in collisions with Rydberg atoms – efficient intramolecular vibrational redistribution in the transient anion – is operative also in the DEA. Additionally, it does not appear only at threshold, but at several higher-lying resonances and also for fragments other than Cl−. Somewhat surprisingly, additional interesting effects are revealed in the Cl2− fragment. Production of this fragment a priori requires bending and structural rearrangement of the temporary negative ion. Velocity map imaging is an ideal tool to probe such dynamical effects.
2 Instrumentation
A velocity map imaging (VMI) spectrometer combined with a trochoidal electron monochromator was used to measure the time sliced velocity map images and the ion yield curve of the mass fragments.20,22 The VMI setup is based on a trochoidal electron spectrometer originally built and operated at the University of Fribourg, Switzerland and then transferred to Prague.23,24 The setup has undergone several modifications with time and details of the VMI spectrometer used for the current study can be found in an earlier report.20 The setup is also used for several recent studies.20,21,25,26 In brief, a pulsed electron beam with 40-kHz repetition rate and of 200-ns width was produced using a trochoidal electron monochromator. The electron beam interacts perpendicularly with an effusive molecular beam in a field free condition at the interaction region of the VMI spectrometer. The produced anions are pulsed extracted from the interaction region by applying an extraction pulse around 100-ns after the electron beam pulse and then recorded using a time-and-position sensitive detector with 40-mm active diameter. The detector consists of a pair of microchannel plates (MCPs) in chevron configuration and an LC delay-line hexanode placed outside of the vacuum chamber.27The angular distributions of the anionic fragments were obtained from the central time sliced images whereas, the half-‘Newton sphere’ was used to measure the kinetic energy distribution.20 The setup is also capable of measuring ion yield spectra. The mass resolution is lower due to the VMI requirements, but it can still resolve the central part of the Newton spheres of two adjacent masses with a 2 Da mass difference around the 82 Da mass. The incident electron beam energy was calibrated using the 4.4 eV resonance peak of O−/CO2, and the beam resolution was around 450 meV during the current study (in the VMI configuration, a standardly much better resolution of the trochoidal monochromator is deteriorated, probably due to open non-shielded design of the collision region and by pulsing the high voltages.) The base pressure of the vacuum chamber in the absence of the molecular beam was around ∼10−8 mbar whereas, during the experiment in the presence of the effusive molecular beam, the pressure was between around 2–4 × 10⁻⁶ mbar. The kinetic energy distribution calibration of the ion fragments was performed by measuring the 8.2 eV DEA peak of O−/CO2 and cross-checked with the 2.3 eV DEA peak of O−/N2 O.
The CCl4 sample was commercially purchased from Sigma-Aldrich with 99.9% stated purity. During the experiment, the sample was kept in a heat bath at a constant temperature of around 25 °C. A few cycles of freeze–thaw and pump were performed before the experiment to remove any solvated gas from the liquid phase sample.
3 Results and discussions
3.1 Fragmentation pattern and energy dependence
The mass spectra of the negative ion fragments produced in DEA to CCl4 for 1.1 and 6.0 eV incident electron energies are shown in Fig. 1. Four anionic fragments, Cl−, Cl2−, CCl2− and CCl3−, can be seen in Fig. 1. The two isotopes of chlorine, 35Cl and 37Cl, are naturally present with a roughly 3![[thin space (1/6-em)]](https://www.rsc.org/images/entities/char_2009.gif) :
:![[thin space (1/6-em)]](https://www.rsc.org/images/entities/char_2009.gif) 1 ratio, and the combination of these two masses of Cl makes the mass spectra a bit complicated. Three different masses are expected to be observed for each of Cl2− (masses 70, 72 and 74 Da) and CCl2− (masses 82, 84 and 86 Da) anionic species, whereas four mass peaks (117, 119, 121 and 123 Da) can ideally be observed for CCl3− anions. It should be noted that the Newton spheres of fragments have to be expanded in the imaging setup which leads to the broadening of the time of flight peaks. The peaks are thus not fully separated, especially around the higher mass range (the mass resolution of the Cl2− group reflects the higher kinetic energy release at higher incident electron energy). Nevertheless, it was possible to record the central slices of the velocity map images for each of the anionic species.
1 ratio, and the combination of these two masses of Cl makes the mass spectra a bit complicated. Three different masses are expected to be observed for each of Cl2− (masses 70, 72 and 74 Da) and CCl2− (masses 82, 84 and 86 Da) anionic species, whereas four mass peaks (117, 119, 121 and 123 Da) can ideally be observed for CCl3− anions. It should be noted that the Newton spheres of fragments have to be expanded in the imaging setup which leads to the broadening of the time of flight peaks. The peaks are thus not fully separated, especially around the higher mass range (the mass resolution of the Cl2− group reflects the higher kinetic energy release at higher incident electron energy). Nevertheless, it was possible to record the central slices of the velocity map images for each of the anionic species.
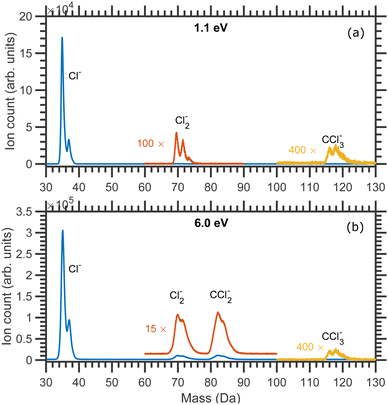 | ||
| Fig. 1 Mass spectra of the fragment anions produced due to the DEA to CCl4 measured at (a) 1.1 eV and (b) 6.0 eV constant incident electron energies. | ||
In Fig. 2(a) we show the Cl− ion yield, in Fig. 2(b)–(d) we show the Cl2−, CCl2− and CCl3− ion yields respectively. All isotopes were included in the ion yield evaluation (integration over the overlapping mass peaks was performed at each electron energy). In general, the ion yield curves are in good agreement with the previous studies.5–8,12–14
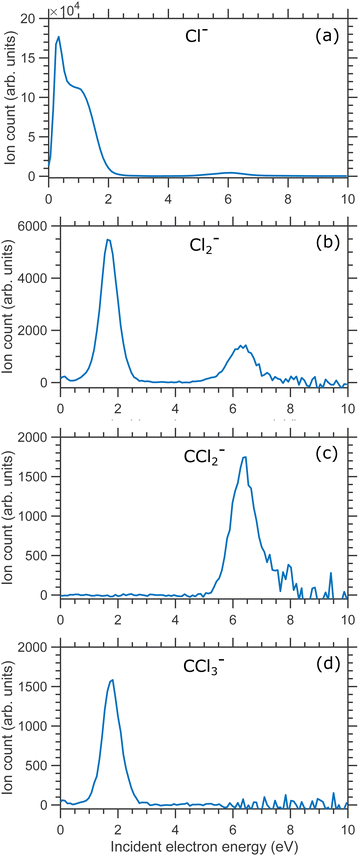 | ||
| Fig. 2 Ion yields curves of (a) Cl−, (b) Cl2− ion (c) CCl2− and (d) CCl3− anionic fragments produced due to DEA to CCl4 molecule. | ||
Olthoff et al. assigned the 0.1 and 0.8 eV resonances to A1 and T2 resonant symmetries, respectively.7 Both are shape resonances with the extra electron added to the a1 orbital (HOMO) for the A1 resonance. In contrast, the extra electron is added to the t2 orbital for the T2 resonance. The authors also performed continuum MS-Xα calculations to obtain explicit scattering cross section for CCl4. Their calculations support the assignments of those resonances. The authors also found that the cross-section shows a weak maximum at about 6 eV. They argued that this does not arise due to the resonant effect. Instead, it is due to the competition between the increasing cross-sections in some channels and decreasing cross-sections in others. Theoretical calculation by Tossell and Davenport and, later by Curik et al. found a broad resonance at about 9 eV having E-symmetry.28,29 Schwinger multichannel calculations with the static-exchange approximation by Moreira et al. found this feature at about 8 eV.30 The total scattering cross-section studies of CCl4 also exhibit a broad peak with a maximum at about 7.5 eV. In a recent study, Ragesh et al. measured the relative cross-sections of the production of different fragment anions from DEA to CCl4, SiCl4 and GeCl4. The authors argued that this might be an 2E shape resonance or a core excited resonance.14
The details of the energy dependence for each fragment anion are discussed in the following sections.
3.2 Production of Cl− ions
| ETh = D − A + E* | (1) |
| Ch. no. | Final dissociation products | Threshold energy (eV) |
|---|---|---|
| (a) | CCl3 + Cl− | −0.61 |
| (b) | CCl3* + Cl− | 1.9231 |
| (c) | CCl2 + Cl + Cl− | 3.09 |
| (d) | CCl + Cl2 + Cl− | 4.09 |
| (e) | CCl + Cl + Cl + Cl− | 6.49 |
In Table 1 channels (a) and (b) are the two two-body dissociation channels. In Ch. (a) the neutral CCl3 fragments form in the ground electronic state, while in Ch. (b) the neutral CCl3 fragments are in electronically excited states. The first electronic excited state of CCl3 is 2.53 eV, therefore the threshold energy for Ch. (b) = (3.0 − 3.61 + 2.53) eV = 1.92 eV.31 Ch. (c) and (d) are three-body dissociation channels whereas, Ch. (e) is a many-body dissociation channel.
The three-body dissociation of CCl4− TNI can occur in two different ways (i) symmetric and (ii) sequential dissociation. In the symmetric three-body bond dissociation process, two C–Cl bonds break symmetrically or simultaneously. While, in a sequential three-body dissociation process, one C–Cl bond breaks to produce CCl3− ion in the first step, and in the second step, the CCl3− ion further dissociates to produce CCl2 and Cl−. The threshold energies for both dissociation processes are the same.
Channels (d) and (e) are three- and four-body dissociation processes where the Cl− production is accompanied by several neutral co-fragments. They can also proceed either symmetrically or sequentially.
The threshold calculations help us to quickly rule out the possibilities of the many-body dissociation channels [channel (c), (d), and (e)] and also the second two-body dissociation channel [channel (b)] in the 0 and 0.8 eV resonance. Therefore the only possible dissociation channel involved in the low energy resonances is the two-body dissociation channel [Ch. (a)].
The velocity map images (VMI) taken at 0.1, 0.2 and 0.5 eV incident electron energies are shown in Fig. 3(a)–(c), respectively. The images have a form of a central “blob” which is typical for statistical emission of fragment ions.25,37 The images do not have a perfectly circular symmetry. We have observed such effect in our setup in the past for a number of target molecules in which slow fragments are emitted21,25 and it is present also in most of images presented later in this paper. Due to presence of the magnetic field the ‘Newton sphere’ moves along the perpendicular direction of the electron beam and creates an asymmetry in the ion counts along the upper and lower half of the VMI with respect to the electron beam direction. Due to cylindrical symmetry ideally the upper half (between the 0° to 180°) and lower half (between 180° to 360°) of the VMI images should have equal counts, which is not in the present case due to the magnetic field. Nevertheless, only the ion counts along the upper- and lower-part changes not the overall angular distribution as we showed earlier.20,21,25,26 We ascribe the asymmetry to the effect of the magnetic field (presence of which is necessary for the operation of the trochoidal electron monochromator) on the fragments' Newton sphere.
The kinetic energy distributions of Cl− ions obtained from the entire half-‘Newton sphere’ are plotted in Fig. 4. The distributions are rather broad and almost unchanged with respect to the change in the incident electron energy.
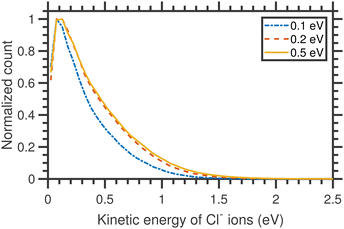 | ||
| Fig. 4 Kinetic energy distributions of Cl− ions arising from the DEA to CCl4 for three different incident electron energies, as shown in the figure, around the A1 resonance. | ||
From the momentum and energy conservation, the maximum kinetic energy of the Cl− ions produced from the two-body dissociation channel for different incident electron energies can be calculated using the expression mentioned below:
Assuming the threshold energy of −0.61 eV, at the incident energy of 0.1 eV the hypothetical maximum kinetic energy of Cl− ions is 0.55 eV. The measured KED has a tail extending beyond this value, which we ascribe to the energy spread of the incident electron beam.20 Nonetheless, the KEDs reveal two important observations: (i) they peak at low Cl− kinetic energies (near 0 eV) and (ii) they do not change with incident energy. Clearly, the CCl3 co-fragment is vibrationally excited. This observation goes well in line with the experiments on electron transfer to CCl4 in collisions with Rydberg atoms, where only a small fraction of excess energy is released in the kinetic energy.38 Since the lifetime of the CCl4−* transient anion is very short (estimates vary from 7 to 30 ps, this points out to a high efficiency and short timescale for the intramolecular vibrational redistribution (IVR)).19 IVR leads to the fast that Cl− fragments are emitted thermally.
The VMI images of Cl− ion fragments taken at 0.9, 1.1, and 1.3 eV incident electron energies are shown in Fig. 5. The kinetic energy distributions, obtained from the corresponding half-‘Newton sphere’ are shown in Fig. 6. The 0.94 eV resonant state which is formed in this energy region has a 2T2 symmetry.6,7,14,29,35,39 In spite of the very different initial state, the resulting KEDs are very much similar than those originating from the 2A1 near-zero electron attachment: they peak at very low Cl− energies and show basically no change upon increase of the incident electron energy.
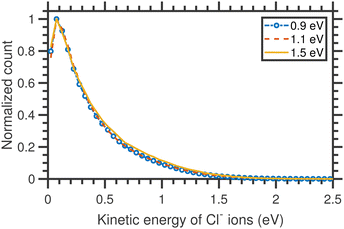 | ||
| Fig. 6 Kinetic energy distributions of Cl− ions arising from the DEA to CCl4 different incident electron energies around the T2 resonance. | ||
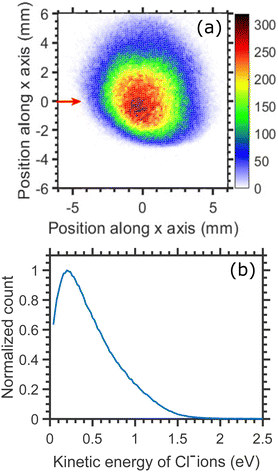
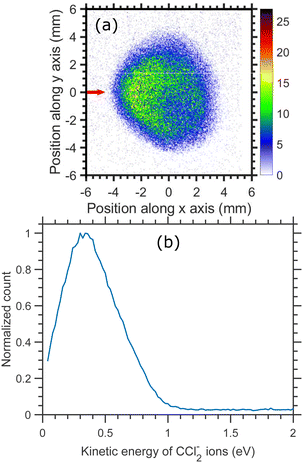
Cl− ion yield (Fig. 2(a)) shows one more resonance peaking around 6 eV. At this energy, the many-body dissociation channels [channels (b), and (d)] become accessible. The VMI image of Cl− ions produced from the DEA to CCl4 at 6.0 eV incident electron energy is shown in Fig. 7(a) and the corresponding KED is shown in Fig. 7(b). The KED extends to higher kinetic energies when compared to low incident energy distributions, but has a similar character with slow Cl− ions dominating the distribution.
3.3 Production of Cl2− ions
The thermodynamic thresholds for different dissociation channels leading to Cl2− are listed in Table 4. The VMIs of Cl2− ions taken at 1.1 and 6.0 eV incident electron energy are shown in Fig. 8(a) and (b) respectively. The VMI taken at 1.1 eV incident electron energy shows only a blob at the center of the image. On the other hand, the VMI taken at 6.0 eV incident electron energy shows two distinct structures. In addition to a central blob, a distinct outer ring signifies that Cl2− ions are also released with higher kinetic energies. The kinetic energy distribution of Cl2− ions produced due to DEA at 6.0 eV incident electron energy is shown in Fig. 9. The distribution shows two bands peaking at around 0.15 and 0.75 eV. From the energy conservation, we can conclude that the fast outer-ring ions (higher energy band in kinetic energy distribution) are produced from Ch. (a), having a 1.4 eV threshold. The low-energy ions might be produced from any of the channels (a), (b), or (c) with the energy partitioning such that only a small fraction goes to the Cl2− kinetic energy.| Ch. no. | DEA channels | Threshold (eV) |
|---|---|---|
| (a) | CCl2 + Cl2− | 1.40 |
| (b) | CCl2* + Cl2− | 3.6540 |
| (c) | CCl + Cl + Cl2− | 4.80 |
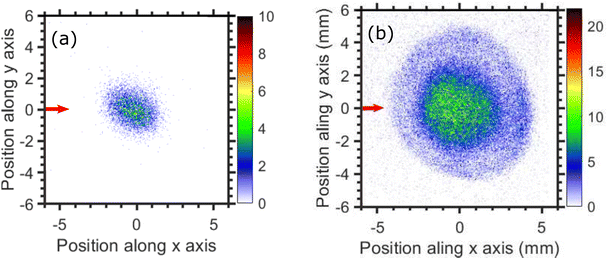 | ||
| Fig. 8 Velocity map images of Cl2− ions (central time slice) taken for (a) 1.1, and (b) 6.0 eV incident electron energies. The red arrow indicates the incident electron beam direction. | ||
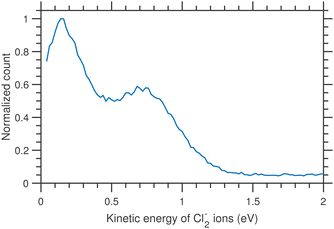 | ||
| Fig. 9 Kinetic energy distributions of Cl2− ions arising from the DEA to CCl4 for 6.0 eV incident electron energy. | ||
The expected kinetic energy of the Cl2− ions produced from different channels can be calculated as
 | (2) |
 . Considering Ch. (b) and (c), this becomes 1.27 and 0.65 eV, respectively. This indicates that the dissociation producing fast Cl2− is still accompanied by a high internal energy content of the fragments.
The angular distribution of the Cl2− anions produced due to 6.0 eV incident electrons and having kinetic energy ≥0.6 eV is extracted from the time-sliced image and is plotted in Fig. 11.
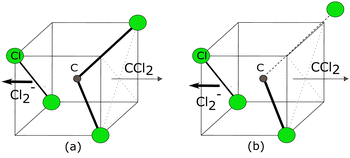
The angular distribution shows a higher yield of Cl2− ions in the backward (180°–360°) direction than in the forward (0°–180°) directions. Such puzzling forward-backward asymmetries have been observed in other highly-symmetric molecules20–22 and in this case it could be a signature of the dynamics of electron attachment and the dissociating CCl4− anion, and a breakdown of the axial recoil approximation (Fig. 10).
The theory of angular distributions of DEA fragments was developed by O'Malley and Taylor for diatomic molecules and later modified for polyatomic targets by Azria et al.41,42 This theory has several important assumptions: (i) a single resonant state is involved, (ii) the coupling is due to a pure electronic matrix element and (iii) the dissociation axis does not rotate before or during the dissociation (axial recoil approximation). If this is fulfilled, the angular distribution of fragments is determined by a symmetry of the neutral electronic state, symmetry of the transient anion and the partial wave component of the attached electron.
We have performed a detailed analysis of the Cl2− angular distribution using this theoretical approach which is presented in the ESI.† The analysis assumes a direct dissociation, such as shown in Fig. 10(a). This DEA band has been previously assigned to originate from the 2E shape resonance.14Fig. 11 compares the experimental angular distribution of the fast Cl2− with the results of the model assuming the E-symmetry of the resonant state. The blue curve which denotes the “best fit” of the model is clearly in disagreement with the experimental data. The model predicts that most of the Cl2− ions should be ejected perpendicularly to the electron beam directions, while the experiment shows a propensity for forward ejection.
Clearly, the assumptions of the model are not met. In a way, this is not surprising: upon the addition of an electron, the CCl4 system becomes Jahn–Teller active which means it will undergo a geometry distortion. This distortion accompanies the dissociation and thus alters the resulting angular distribution. We have recently shown for a range of unsaturated chlorohydrocarbons that similar geometry distortion can have very strong effects on the resulting VMI images, including the appearance of the forward-backward asymmetry, such as is observed in the present case.21
However, the assignment of this DEA band to the 2E shape resonance is not the only possibility. The Vacuum Ultraviolet (VUV) absorption spectra of CCl4 suggest the presence of n → σ* (2t1 → 7a1) excited state at around 6.5 eV.43,44 Therefore, the 6 eV resonance might be a core-excited resonance. The electronic configuration of the resonance would be (core) 2t15 7a12 with T1 symmetry. In the ESI† we show that the T1 resonance symmetry can lead to the forward-backward asymmetry, however, high partial wave components (f and g waves) of the incoming electron would have to dominate the attachment process. Also, in such case, the resulting angular distribution would show pronounced maxima and minima which are not seen in the experiment. These could be in principle smeared out by TNI rotation (also shown in the ESI†), however, the resulting angular distributions still do not fully correspond to the experimental data. In ESI† we also show the exploratory angular distributions for the A1 TNI symmetry and for the combination of various symmetries of resonant states. Only higher partial waves, e.g. A1 resonant symmetry, can reproduce the shape of the measured distribution within the assumptions of the model, with one possible explanation being a combination of A1 and T1 symmetries (Fig. 3 in the ESI†), although there is currently no theoretical basis for this assignment. It is plausible that one or more assumptions of the model are broken in this case.
3.4 Production of CCl2− ions
From the ion yield of CCl2− ions in Fig. 2(c), it is evident that the CCl2− ions are only produced from the higher energy resonance. Ragesh et al. and Scheunemann et al. also reported the a weak CCl2− signal close to its energetical threshold around the 2 eV resonance.11,14 That signal might be below the present detection limit.Different dissociation channels leading to CCl2− ions with their thermodynamically calculated threshold energies are listed in Table 5.
| Ch. no. | DEA channels | Threshold (eV) |
|---|---|---|
| (a) | CCl2− + Cl + Cl | 4.90 |
| (b) | CCl2− + Cl2 | 2.50 |
| (c) | CCl3− + Cl → Cl + CCl2− + Cl | 4.90 |
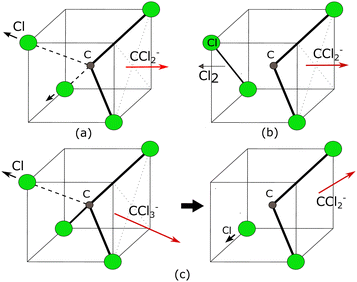
Here, Ch. (a) and Ch. (b) are the symmetric bond dissociation process while Ch. (c) is the sequential one (Fig. 12). In Ch. (a), the two C–Cl bonds in CCl4 break simultaneously, eject two Cl atoms, and form a CCl2− ion. While in Ch. (b) two C–Cl bonds break simultaneously and form one Cl–Cl bond to produce one Cl2 and one CCl2− ion. On the other hand, in the sequential dissociation process [ch. (c)], the CCl3− ion is formed in the first step, and in the second step, the CCl3− ion further dissociates to produce CCl2− and Cl.
The time-sliced VMI image taken at 6.0 eV incident electron energy is shown in Fig. 13. The sliced image shows a ring structure with a higher ion count in the backward direction. The kinetic energy distribution of CCl2− ions for 6.0 eV electron energy [Fig. 13(b)] shows one single peak peaking at about 0.4 eV with the distribution extended up to 1.0 eV. The kinetic energy distribution is obtained from the square of the radius and is not influenced by the asymmetry between the upper and lower half of the image caused by the magnetic field.
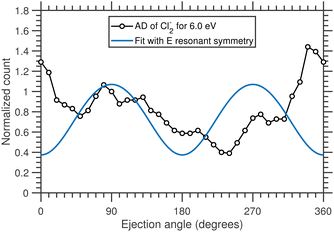
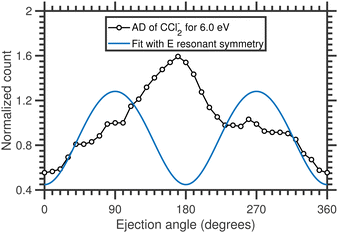
The angular distribution of CCl2− ions is extracted from the time-sliced image for 6.0 eV incident electron energy and is plotted in Fig. 14. The angular distribution is clearly backward-peaking. The blue solid curve in Fig. 14 represents the fitted curve with E resonant symmetry under the direct dissociation approximation and, again, does not reproduce the experimental data. Nonetheless, the fact that the angular distribution of CCl2− ions (backward peaking) and Cl2− ions (forward peaking) at the same electron energy are complementary to each other suggests that the neutral co-fragment to CCl2− is the Cl2 molecule (channel (b) in Table 5) and that there is an electron-hopping between the two fragments. A similar effect had also been previously observed in ammonia.45 As for the Cl2− channel, here the observed forward-backward asymmetry in the angular distribution could almost be reproduced by a combination of A1 and T1 resonant symmetry (Fig. 4 of the ESI†), although no resonance with A1 symmetry has been predicted in this energy range to the best of our knowledge. Future theoretical investigations of the electronic structure and potential energies of the electronic states of the TNI could further elucidate the dynamical signatures revealed in the asymmetries of the present VMI measurements.
3.5 Production of CCl3− ions
The production of the CCl3− ions is only possible via the two-body dissociation process as| e− + CCl4→ CCl4−→ CCl3− + Cl | (3) |
The VMI of CCl3− ions is taken at 1.1 eV incident electron energy around the low energy resonance is shown in Fig. 15. The low signal prevents a meaningful extraction of kinetic energy distribution, nonetheless, the kinetic energies are clearly very low which is consistent with a small excess energy and the high mass of the fragment. The degree of the image prolongation in the forward-backward direction seems to be stronger than for the fragments discussed previously. We ascribe this to an instrumental effect: we have observed a similar increased asymmetry for other heavy ions with low kinetic energy release in our setup (e.g. for SF6−/SF6). Most probably, the magnetic field influence on the Newton sphere shape has stronger effect with increasing flight time of the ions.
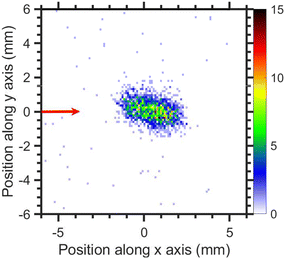 | ||
| Fig. 15 Velocity map image of CCl3− ions (central time slice) for 1.1 eV incident electron energy. The red arrow indicates the incident electron beam direction. | ||
As evident from the ion-yield curve of CCl3− ions, the ion count is very low at the 6.2 eV resonance. Therefore, it was not possible to record the VMI at this resonance.
4 Conclusion
To conclude, complete DEA dynamics of CCl4 have been studied using the velocity map imaging spectrometer. For the first time, we have been able to characterize the Cl− production at the near-zero s-wave attachment using VMI. It revealed that only a small fraction of the excess energy is released in form of the kinetic energy and that this fraction depends very little on the incident electron energy. This points to a high efficiency of the IVR in the transient CCl4− anion. Another surprising effect arises at the 6.2 eV resonance where the Cl2− production shows a bimodal kinetic energy distribution and the fast fragments have clear forward-backward asymmetry with a propensity for the forward fragment emission. This angular distribution cannot be explained using the generalized model for DEA to polyatomic molecules of Azria and co-workers42 which predicts angular distribution with the maxima in perpendicular direction. Nonetheless, a mirror asymmetry (propensity for the backward emission of anions) is visible in the angular distribution of the CCl2− fragment which suggests a long-distance electron hopping between these Cl2 and CCl2 co-fragments.Conflicts of interest
There are no conflicts to declare.Acknowledgements
This work was supported by the Ministry of Education, Youth and Sports of the Czech Republic Project No. LTAUSA19031. A. P. deeply appreciates the “Council of Scientific and Industrial Research (CSIR)” for the financial assistance. Work at Lawrence Berkeley National Laboratory was supported by the U.S. Department of Energy, Office of Science, Basic Energy Sciences, Chemical Sciences, Geosciences and Biosciences Division, under Award No. DE-AC02-05CH11231.Notes and references
- R. D. Morrison, B. L. Murphy and R. E. Doherty, in Environmental Forensics, ed. R. D. Morrison and B. L. Murphy, Academic Press, Burlington, 1964, pp. 259–277 Search PubMed.
- D. Sherry, A. McCulloch, Q. Liang, S. Reimann and P. A. Newman, Environ. Res. Lett., 2018, 13, 024004 CrossRef.
- R. M. Reese, V. H. Dibeler and F. L. Mohler, J. Res. Natl. Bur. Stand., 1956, 57, 367 CrossRef CAS.
- J. D. Craggs, C. A. McDowell and J. W. Warren, Trans. Faraday Soc., 1952, 48, 1093–1099 RSC.
- R. E. Fox and R. K. Curran, J. Chem. Phys., 1961, 34, 1595–1601 CrossRef CAS.
- S. Chu and P. Burrow, Chem. Phys. Lett., 1990, 172, 17–22 CrossRef CAS.
- J. K. Olthoff, J. H. Moore and J. A. Tossell, J. Chem. Phys., 1986, 85, 249–254 CrossRef CAS.
- W. Hickam and D. Berg, J. Chem. Phys., 1958, 29, 517–523 CrossRef CAS.
- D. Spence and G. Schulz, J. Chem. Phys., 1973, 58, 1800–1803 CrossRef CAS.
- S. Matejcik, A. Kiendler, A. Stamatovic and T. Märk, Int. J. Mass Spectrom. Ion Processes, 1995, 149, 311–319 CrossRef.
- H.-U. Scheunemann, E. Illenberger and H. Baumgärtel, Ber. Bunsen-Ges. Phys. Chem., 1980, 84, 580–585 CrossRef CAS.
- E. Illenberger, Ber. Bunsen-Ges. Phys. Chem., 1982, 86, 252–261 CrossRef CAS.
- Z. Li, A. R. Milosavljevicć, I. Carmichael and S. Ptasinska, Phys. Rev. Lett., 2017, 119, 053402 CrossRef PubMed.
- R. Kumar T. P., B. Brynjarsson, B. Ómarsson, M. Hoshino, H. Tanaka, P. Limão-Vieira, D. Jones, M. Brunger and O. Ingólfsson, Int. J. Mass Spectrom., 2018, 426, 12–28 CrossRef.
- M. Braun, S. Marienfeld, M.-W. Ruf and H. Hotop, J. Phys. B: At., Mol. Opt. Phys., 2009, 42, 125202 CrossRef.
- R. F. Tate and J. T. Baker, Phys. Rev., 1938, 53, 683 Search PubMed.
- H. Abdoul-Carime and J. Kopyra, Chem. Phys. Lett., 2023, 810, 140182 CrossRef CAS.
- A. Kalamarides, R. W. Marawar, M. A. Durham, B. G. Lindsay, K. A. Smith and F. B. Dunning, J. Chem. Phys., 1990, 93, 4043–4046 CrossRef CAS.
- R. A. Popple, C. D. Finch, K. A. Smith and F. B. Dunning, J. Chem. Phys., 1996, 104, 8485–8489 CrossRef CAS.
- P. Nag, M. Polášek and J. Fedor, Phys. Rev. A, 2019, 99, 052705 CrossRef CAS.
- P. Nag, M. Tarana and J. Fedor, Phys. Rev. A, 2021, 103, 032830 CrossRef CAS.
- P. Nag and D. Nandi, Phys. Chem. Chem. Phys., 2015, 17, 7130–7137 RSC.
- M. Allan, J. Electron Spectrosc. Relat. Phenom., 1989, 48, 219–351 CrossRef CAS.
- J. Fedor, O. May and M. Allan, Phys. Rev. A: At., Mol., Opt. Phys., 2008, 78, 032701 CrossRef.
- M. Ranković, R. Kumar T. P., P. Nag, J. Kočišek and J. Fedor, J. Chem. Phys., 2020, 152, 244304 CrossRef PubMed.
- T. F. M. Luxford, J. Koččišek, L. Tiefenthaler and P. Nag, Eur. Phys. J. D, 2021, 75, 230 CrossRef CAS.
- O. Jagutzki, A. Czasch and S. Schössler, Proc. SPIE, 2013, 8727, 872701 CrossRef.
- J. A. Tossell and J. W. Davenport, J. Chem. Phys., 1985, 83, 4824 CrossRef.
- R. Curik, F. A. Gianturco and N. Sanna, J. Phys. B: At., Mol. Opt. Phys., 2000, 33, 615 CrossRef CAS.
- G. M. Moreira, A. S. Barbosa, D. F. Pastega and M. H. F. Bettega, J. Phys. B: At., Mol. Opt. Phys., 2016, 49, 035202 CrossRef.
- F.-W. Breitbarth and D. Berg, Chem. Phys. Lett., 1988, 149, 334–338 CrossRef CAS.
- H. Dispert and K. Lacmann, Int. J. Mass Spectrom. Ion Phys., 1978, 28, 49–67 CrossRef CAS.
- Y.-R. Luo, Comprehensive handbook of chemical bond energies, CRC Press, 2007 Search PubMed.
- P. C. Samartzis, I. Sakellariou, T. Gougousi and T. N. Kitsopoulos, J. Chem. Phys., 1997, 107, 43–48 CrossRef CAS.
- P. D. Burrow, A. Modelli, N. S. Chiu and K. D. Jordan, J. Chem. Phys., 1982, 77, 2699–2701 CrossRef CAS.
- U. Berzinsh, M. Gustafsson, D. Hanstorp, A. Klinkmüller, U. Ljungblad and A.-M. Mårtensson-Pendrill, Phys. Rev. A: At., Mol., Opt. Phys., 1995, 51, 231 CrossRef CAS PubMed.
- J. Fedor, J. Kočišek, V. Poterya, O. Votava, A. Pysanenko, L. Lipciuc, T. N. Kitsopoulos and M. Fárník, J. Chem. Phys., 2011, 134, 154303 CrossRef CAS PubMed.
- C. H. Wang, M. Kelley, S. Buathong and F. B. Dunning, J. Chem. Phys., 2014, 140, 234306 CrossRef CAS PubMed.
- A. Modelli, F. Scagnolari, G. Distefano, D. Jones and M. Guerra, J. Chem. Phys., 1992, 96, 2061–2070 CrossRef CAS.
- J. Tiee, F. Wampler and W. Rice, Chem. Phys. Lett., 1979, 65, 425–428 CrossRef CAS.
- T. F. O'Malley and H. S. Taylor, Phys. Rev., 1968, 176, 207–221 CrossRef.
- R. Azria, Y. L. Coat, G. Lefevre and D. Simon, J. Phys. B: At. Mol. Phys., 1979, 12, 679–687 CrossRef CAS.
- B. R. Russell, L. O. Edwards and J. W. Raymonda, J. Am. Chem. Soc., 1973, 95, 2129–2133 CrossRef CAS.
- J. F. Ying and K. T. Leung, J. Chem. Phys., 1994, 101, 8333–8350 CrossRef CAS.
- T. N. Rescigno, C. S. Trevisan, A. E. Orel, D. S. Slaughter, H. Adaniya, A. Belkacem, M. Weyland, A. Dorn and C. W. McCurdy, Phys. Rev. A, 2016, 93, 052704 CrossRef.
Footnote |
| † Electronic supplementary information (ESI) available. See DOI: https://doi.org/10.1039/d3cp04834a |
| This journal is © the Owner Societies 2024 |


