Approaching the free rotor limit: extremely low methyl torsional barrier observed in the microwave spectrum of 2,4-dimethylfluorobenzene†
Safa
Khemissi
 *a,
Martin
Schwell
a,
Isabelle
Kleiner
b and
Ha Vinh Lam
Nguyen
 *ac
*ac
aUniv Paris Est Creteil and Université Paris Cité, CNRS, LISA, F-94010 Créteil, France. E-mail: safa.khemissi@lisa.ipsl.fr; lam.nguyen@lisa.ipsl.fr
bUniversité Paris Cité and Univ Paris Est Creteil, CNRS, LISA, F-75013 Paris, France
cInstitut Universitaire de France (IUF), F-75231 Paris, France
First published on 27th November 2023
Abstract
The microwave spectrum of 2,4-dimethylfluorobenzene was recorded using a molecular jet Fourier transform microwave spectrometer in the frequency range from 2.0 to 26.5 GHz. The spectral assignment and modeling were challenging due to the large tunnelling splittings resulting from the very low barrier to internal rotation of the p-methyl group that approaches the free rotor limit. Internal rotation splittings arising from two inequivalent o- and p-methyl groups were observed, analysed and modelled using the modified version of the XIAM code and the BELGI-Cs-2Tops code, giving a root-mean-square deviation of 549.1 kHz and 4.5 kHz, respectively, for a data set of 885 rotational lines. The torsional barriers of the o- and p-methyl groups were determined to be 227.039(51) cm−1 and 3.23(40) cm−1, respectively. The V3 barrier observed for the p-methyl group is lower than in any other para-methyl substituted toluene derivatives with coupled internal rotations, becoming the lowest value ever observed to date. The barrier to internal rotation of the o-methyl group next to a fluorine atom is consistently around 220 cm−1, as confirmed by comparing it to barriers observed in other toluene derivatives. The experimental rotational constants were compared to those obtained by quantum chemical calculations.
1 Introduction
Internal rotation of methyl groups is one of the most extensively studied Large Amplitude Motions (LAMs) in high resolution microwave spectroscopy. The analysis and modelling of this LAM have been always challenging, but become particularly difficult if the barrier hindering the methyl torsion is low, resulting in large splittings of rotational transitions. The lower the barrier, the more difficult the analysis, especially when the barrier approaches the free rotor limit (V3 < 10 cm−1).1 Despite efforts dedicated to study the effects of methyl internal rotations hindered by low barriers, the number of investigations remains small, and they mainly concern methyl-substituted aromatic molecules.2 The first aromatic molecule known to experience an extremely low-barrier is toluene3–8 with a pure V6 potential of 4.9 cm−1. In some toluene derivatives featuring one methyl internal rotation with pure V6 potential due to symmetry, the methyl torsion is hindered with a barrier height of less than 13 cm−1, such as in p-fluorotoluene (4.8 cm−1),9p-nitrotoluene (12.5 cm−1),10 and p-chlorotoluene (4.8 cm−1).11 In many cases, a combination of V3/V6 is observed, i.e., 14.2/−11 cm−1 for m-tolunitrile,12 18.4/−7.3 cm−1 for p-cresol,13 3.2/−13.9 cm−1 for the anti-conformer of m-cresol,14 7.9/−24.7 cm−1 for p-toluic acid,15 and 6.8/0.023 cm−1 for 3-nitrotoluene.16 In other cases, a pure V3 term is sufficient to model the microwave spectrum, i.e., for the anti-conformer of m-methylbenzaldehyde (4.6 cm−1),17 3-methylphenylacetylene (11.4 cm−1),18 3-fluorotoluene (17.2 cm−1),19 and the syn and anti-conformers of m-toluic acid (17.9 cm−1 and 9.6 cm−1, respectively).20 The lowest V3 barrier approaching the free rotor limit was obtained for m-toluidine with only 2.0 cm−1.21The low barrier problem becomes even more problematic if the molecules possess more than one methyl rotor, often coupled to each other. Only a few toluene derivatives featuring two methyl tops hindered by low barriers have been investigated. They are m-xylene (4.5 cm−1),22 3,5-dimethylbenzaldehyde (syn-m: 53.0 cm−1 and anti-m: 25.3 cm−1)23 and 3,5-dimethylanisole (syn-m: 58.6 cm−1 and anti-m: 36.1 cm−1).24 A few other six-membered rings exhibit two internal rotations hindered by different torsional barriers, an intermediate one and a very low one, such as the three isomers of dimethylanisole (2,5-,24 2,3-25 and 2,4-dimethylanisole26) and syn-2,5-dimethylbenzaldehyde.23 In the case of syn-2,5-dimethylbenzaldehyde, Tudorie et al. reported an extremely low barrier of 5.4 cm−1 for the m-methyl group and an intermediate barrier of 565.7 cm−1 for the o-methyl group.
We have recently initiated a systematic investigation of the dimethylfluorobenzene family with the aim of studying the LAMs of two methyl groups. Our focus is on the sensitivity of the methyl torsional barrier to the steric and electrostatic surrounding. Studies on the microwave spectra of the 2,6-, 3,4- and 2,3-isomers27–29 have shown the influence of steric effects, where the barrier to internal rotation of a methyl group adjacent to a fluorine atom is always around 220 cm−1 and that of a methyl group adjacent to another methyl group is around 500 cm−1. For the 2,3-isomer, the torsional barrier observed for the 2-methyl group cannot be explained by steric effects alone, and electrostatic effects within the conjugated double bond must be considered as well. To gain a deeper comprehension about the interplay between steric and electrostatic effects, we continued with 2,4-dimethylfluorobenzene (24DMFB) where the methyl group in the para position experiences no steric hindrance from surrounding and its torsional barrier of less than 4.0 cm−1 approaches the free rotor limit.
2. Quantum chemical calculations
2.1. Geometry optimisations
All quantum chemical calculations were carried out with the Gaussian 1630 package. The geometry optimisations were performed at the B3LYP-D3BJ/6-311++G(d,p), MP2/6-311++G(d,p) and MP2/6-31G(d,p) levels of theory first. These three levels have been benchmarked for the 2,6, 3,4- and 2,3-isomers27–29 to be the most suitable known levels that predict reliable rotational constants close to the experimental values and also yield accurate molecular structure parameters for many aromatic molecules containing methyl groups such as 5-methyl furfural,31 2-acetyl-5-methylthiophene,32 2,5-dimethylfuran33 and 4-methyl-5-vinylthiazole.34 The predicted dipole moment components and rotational constants are given in Table 1. Ground state rotational constants and quartic centrifugal distortion constants were obtained from anharmonic frequency calculations. The geometry of 24DMFB optimised at the B3LYP-D3BJ/6-311++G(d,p) level is illustrated in Fig. 1. The atomic Cartesian coordinates are given in Table S1 in the ESI.†| Par. | Unit | B3LYP-D3BJ/6-311++G(d,p) | MP2/6-311++G(d,p) | MP2/6-31G(d,p) |
|---|---|---|---|---|
| A e | MHz | 3001.7 | 2989.7 | 3013.0 |
| B e | MHz | 1282.4 | 1276.7 | 1279.2 |
| C e | MHz | 908.6 | 904.7 | 908.0 |
| A 0 | MHz | 2976.1 | 2960.6 | 2986.6 |
| B 0 | MHz | 1275.9 | 1270.5 | 1273.0 |
| C 0 | MHz | 902.9 | 898.8 | 902.5 |
| Δ J | kHz | 0.02555 | 0.02553 | 0.02504 |
| Δ JK | kHz | 0.14677 | 0.06376 | 0.06551 |
| Δ K | kHz | 0.36802 | 0.45835 | 0.44972 |
| δ J | kHz | 0.00774 | 0.00776 | 0.00758 |
| δ K | kHz | −0.31064 | 0.05164 | 0.04028 |
| |μa| | D | 1.7 | 1.6 | 1.4 |
| |μb| | D | 0.8 | 0.8 | 0.6 |
| |μc| | D | 0.0 | 0.0 | 0.0 |
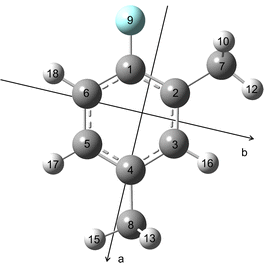 | ||
| Fig. 1 Optimised molecular structure of 24DMFB obtained at the B3LYP-D3BJ/6-311++G(d,p) level of theory in the principal axes of inertia. | ||
A large number of method-basis set combinations were used to optimise the structures of the 2,6-,27 2,3-29 and 3,4-isomers.28 Benchmark calculations are increasingly used to provide equilibrium rotational constants that facilitate the assignments of microwave spectra. Based on our previous results on the three investigated DMFB isomers, we continued our benchmarking efforts with calculations using the density functional methods B3LYP-D3,35–37 B3LYP-D3BJ,38 CAM-B3LYP-D3BJ,39 PBE0,40 ωB97X-D,41 MN1542 and M06-2X.43 MP244 and coupled cluster CCSD45 were used as ab initio methods. All methods except CCSD were combined with several Dunning46 and Pople47 basis sets. The obtained rotational constants are collected in Table S2 in the ESI.†
2.2. Methyl internal rotations
The LAMs of 24DMFB are complex since the molecule possesses two inequivalent internal rotors, the methyl groups in the ortho and para positions. To study these LAMs, the barriers to internal rotation were calculated at the three levels of theory used for geometry optimisations by varying the dihedral angles α1 = ∠(C3, C2, C7, H12) and α2 = ∠(C5, C4, C8, H15), corresponding to torsions about the C2–C7 and C4–C8 bonds, respectively. All other geometry parameters were reoptimised. The resulting potential energy points were parameterised with one-dimensional (1D) Fourier expansions. The obtained potential energy curves are presented in Fig. 2 and 3. The corresponding 1D Fourier coefficients used to plot the curves are given in Table S3 in the ESI.† For the o-methyl group, we found a three-fold V3 potential with small V6 contribution, i.e., 203.4 cm−1 for B3LYP-D3BJ/6-311++G(d,p), 235.4 cm−1 for MP2/6-311++G(d,p) and 202.6 cm−1 for MP2/6-31G(d,p). For the p-methyl group, the ab initio predicted energy curves feature the characteristics of a six-fold potential, as shown in Fig. 3 and can be also recognised in Table S3 (ESI†) from the dominant V6 terms. At the MP2/6-311++G(d,p) and MP2/6-31G(d,p) levels, the predicted V3/V6 ratios are 7.7/27.7 cm−1 and 8.5/22.7 cm−1, respectively. Several studies on similar toluene derivatives have shown that energy potentials calculated using the MP2 method for such steric-hindrance-free methyl groups often involve a V6 term which dominates the V3 one.15,48,49 At the B3LYP-D3BJ/6-311++G(d,p) level of theory, a V3 larger than V6 value with a V3/V6 ratio of 12.1/4.5 cm−1 was obtained, but both values are very small.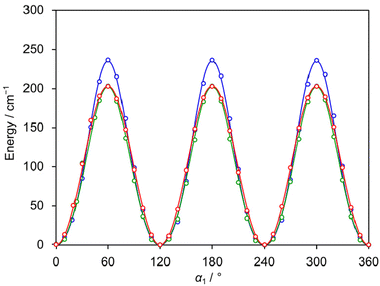 | ||
| Fig. 2 The potential energy curves of 24DMFB obtained by rotating the o-methyl group about the C2–C7 bond (for atom numbering, see Fig. 1). The dihedral angle α1 = ∠(C3, C2, C7, H12) was varied on a 10° grid. Calculations were performed at the B3LYP-D3BJ/6-311++G(d,p) (red curve), MP2/6-311++G(d,p) (blue curve) and MP2/6-31G(d,p) (green curve) levels of theory. The predicted torsional barriers are 203.4 cm−1, 235.4 cm−1 and 202.6 cm−1, respectively. | ||
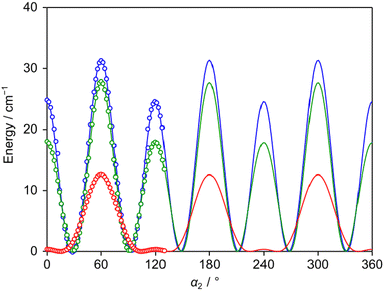 | ||
| Fig. 3 The potential energy curves of 24DMFB obtained by rotating the p-methyl group about the C4–C8 bond (for atom numbering, see Fig. 1). The dihedral angle α2 = ∠(C5, C4, C8, H15) was varied on a 2° grid. Calculations were performed at the B3LYP-D3BJ/6-311++G(d,p) (red curve), MP2/6-311++G(d,p) (blue curve) and MP2/6-31G(d,p) (green curve) levels of theory. To reproduce the obtained energy points, V3/V6 combinations of 12.1/4.5 cm−1, 7.7/27.7 cm−1 and 8.5/22.7 cm−1, respectively, are needed. | ||
2.3. Potential energy surfaces
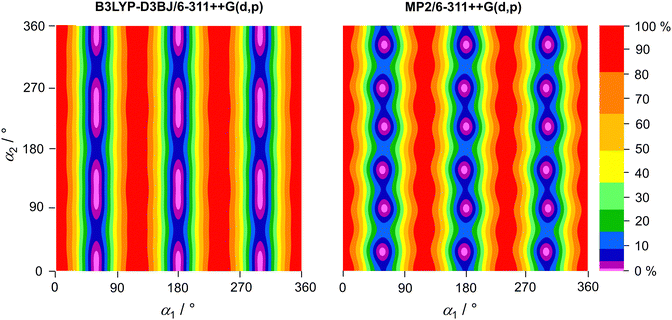
To study the coupling between the two methyl groups, one with a very low and one with an intermediate barrier, two-dimensional potential energy surfaces (2D-PES) depending on the dihedral angles α1 and α2 were calculated at the B3LYP- D3BJ/6-311++G(d,p) and MP2/6-311++G(d,p) levels of theory. The two dihedral angles were varied in 10° steps, while all other geometry parameters were reoptimised. The calculated energies were parameterised using a 2D-Fourier expansion accounting for the C3 symmetry of the o- and p-methyl groups. The Fourier coefficients are given in Table S4 in the ESI.† The resulting 2D-PES are plotted in Fig. 4. The 2D-PES calculated at the MP2/6-3G(d,p) level is very similar to that obtained at the MP2/6-311++G(d,p) level and is given in Fig. S1 in the ESI.† At the B3LYP-D3BJ/6-311++G(d,p) level of theory, the minimum regions feature stretched oblate shapes that indicate a significant coupling between the two tops. Calculations at the MP2/6-311++G(d,p) and MP2/6-31G(d,p) levels show clearly double minimum ranges. That the o- and p-methyl rotations strongly influence each other is reflected in addition by the strong coupling terms cos(3α1)cos(3α2) and sin(3α1)sin(3α2), as well as the large V6 contribution predicted for the p-methyl group (see Table S4 in the ESI†).3. Experimental section
3.1. Measurements
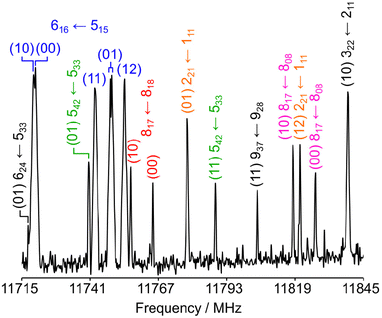
The rotational spectrum of 24DMFB was recorded in the frequency range from 2.0 to 26.5 GHz using a pulsed molecular jet Fourier transform spectrometer with a coaxially oriented beam-resonator arrangement (COBRA).50 The liquid sample of 24DMFB with a purity of 98% was purchased from TCI Europe, Zwijndrecht, Belgium, and measured without further purification. Some drops of the sample were put on a 6 cm piece of a pipe cleaner and inserted in a steel tube placed upstream the nozzle. Helium was used as carrier gas and the He-24DMFB mixture was expanded into the cavity with a backing pressure of about 2 bar. For 24DMFB, a survey scan in the frequency range from 9.6 to 14.0 GHz was recorded by overlapping spectra with a step width of 0.25 MHz. A portion of the scan from 11![[thin space (1/6-em)]](https://www.rsc.org/images/entities/char_2009.gif) 715 MHz to 11
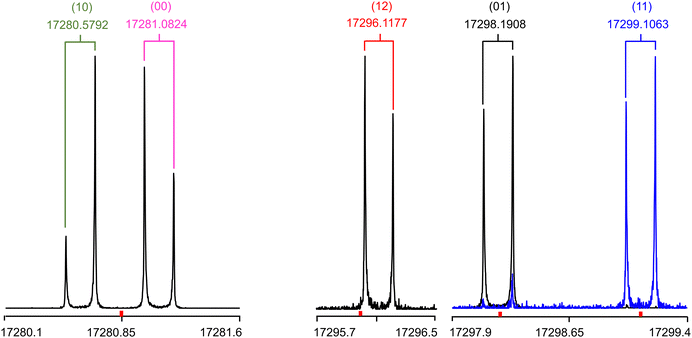
715 MHz to 11![[thin space (1/6-em)]](https://www.rsc.org/images/entities/char_2009.gif) 845 MHz is shown in Fig. 5. All signals observed in the survey scan were remeasured at higher resolution with an experimental line half-width of 2 kHz,51 appearing as doublets due to the Doppler effect caused by the COBRA set up. The estimated measurement accuracy is about 4 kHz. Additional measurements outside the survey were carried out after the spectrum had been assigned. Typical high resolution spectra of the five torsional species of the 909 ← 808 transition are given in Fig. 6.
845 MHz is shown in Fig. 5. All signals observed in the survey scan were remeasured at higher resolution with an experimental line half-width of 2 kHz,51 appearing as doublets due to the Doppler effect caused by the COBRA set up. The estimated measurement accuracy is about 4 kHz. Additional measurements outside the survey were carried out after the spectrum had been assigned. Typical high resolution spectra of the five torsional species of the 909 ← 808 transition are given in Fig. 6.
3.2. Spectral assignments and fits
At the beginning, the rigid-rotor spectrum of 24DMFB was predicted with the program XIAM52 using the equilibrium rotational constants Ae, Be and Ce calculated at the B3LYP-D3BJ/6-311++G(d,p) level of theory recommended for the DMFB family.27–29 Strong a-type, weaker b-type and no c-type transitions were expected based on the dipole moment components given in Table 1. Intense a-type transitions with low Ka values were assigned first. Thereafter, we assigned and included in the rigid-rotor fit further a-type lines with larger Ka values, as well as some b-type transitions.Due to internal rotations of the two inequivalent methyl groups at the ortho and para positions of the phenyl ring, each rotational transition splits into five torsional species (00), (10), (01), (11), and (12). To consider these LAMs, we first examined the internal rotation of the o-methyl group whose barrier height is calculated to be intermediate. We predicted the (10) torsional species frequencies using the rotational constants of the rigid-rotor fit as well as the values for V3,1 and the angle ∠(i1,a) between the internal rotor axis and the principal a-axis obtained at the B3LYP-D3BJ/6-311++G(d,p) level of theory. The assignment of the (10) species lines was straightforward, and we were able to establish a XIAM fit that only includes the (00) and (10) species with a root-mean-square deviation (rms) within the measurement accuracy.
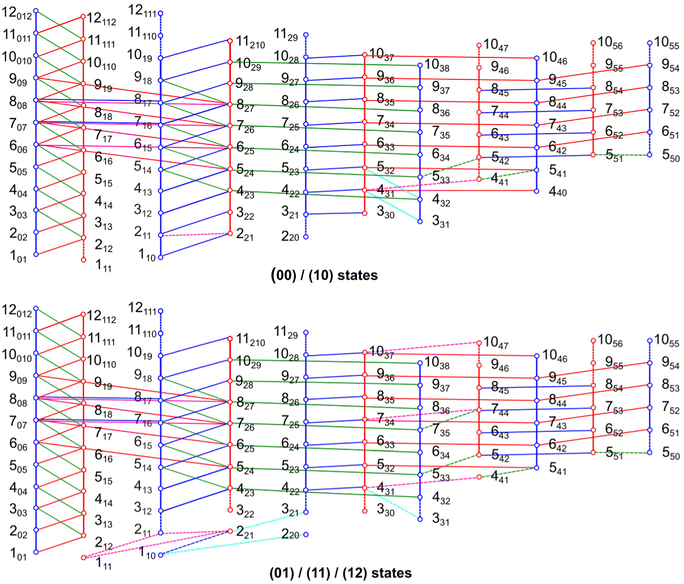
The one-top fit was then expanded into a two-top fit to account for the torsional splittings arising from the p-methyl rotor. The assignments of the (01), (11) and (12) species were much more challenging because of the very low barrier to internal rotation, which causes large, difficult to quantify splittings between these species in the microwave spectrum. To guide the assignment, we searched first for the (01) components of a-type transitions with Ka = 0 and 1 using the XIAM prediction. After fitting the frequencies of these lines, more (01) lines could be found but the XIAM prediction started to fail after a certain number of lines had been included in the fit. To check the correctness of the assignment, we initially used combination difference loops (Ritz cycles)53 which sum to about 4 kHz. The loop ladders are shown in Fig. 7. Subsequently, each torsional species was separately fitted using the SFLAMS program54 where odd power parameters were included in the Hop Hamiltonian:
 | (1) |
We first fitted the Ka = 0 and 1 lines of the (01) species that are loop-checked separately. With the prediction from this separate fit, further lines could be found and both the XIAM fit and the SFLAMS fit were extended. Molecular parameters obtained from the XIAM fit including the (00), (10) and (01) species were used to guide the assignment of the first (11) and (12) torsional lines. After several attempts, we were able to assign a sufficient number of lines that could be checked by combination difference loops and fitted by the SFLAMS program with a standard deviation within the measurement accuracy. Predictions from the SFLAMS fits later guided further assignments. No c-type lines were expected in the microwave spectrum of 24DMFB since the c-dipole moment component is zero due to the Cs symmetry of the molecular frame, but some c- and x-type transitions were still observed for the (10), (01), (11) and (12) species. These types of transitions are forbidden for the (00) species by the rigid-rotor selection rules.55 For the other species, they are allowed by the perturbations arising from the methyl internal rotations. The Ka and Kc quantum numbers lost physical meaning for these transitions, as they only indicate the order of energy. The molecular parameters of the five SFLAMS fits are given in Table 2. Finally, a global fit consisting of 885 torsional lines was carried out using the modified version of the program XIAM54,56 that can include two more higher-order parameters Dc3K and Dc3−, yielding a standard deviation of 549.1 kHz. This rather large deviation is not a rare observation when XIAM has to deal with very low barrier internal rotation. We observed such large values for 2-methylthiazole,48 4,5-dimethylthiazole49 and 2,4-dimethylthiazole.57 Finally, we applied the BELGI-Cs-2Tops program58 on the same data set which succeeded to decrease the rms deviation to 4.5 kHz, satisfactorily close to the measurement accuracy using more higher order parameters. The molecular parameters in the principal axis system obtained with XIAM and BELGI-Cs-2Tops are given in Table 3; the complete list of fitted frequencies with their residuals is available in Table S5 in the ESI.† The BELGI-Cs-2Tops parameters obtained in the “quasi-PAM” system are summarized in Table 4. Note that only a limited number of BELGI molecular parameters can be converted into the principal axis system shown in Table 3.
| Par.a | Unit | Fit (00) | Fit (10) | Fit (01) | Fit (11) | Fit (12) |
|---|---|---|---|---|---|---|
| a All parameters refer to the principal axis system. Watson's A reduction in Ir representation was used. b Number of lines. c Root-mean-square deviation of the fit. | ||||||
| A | MHz | 3051.91814(12) | 3050.73760(11) | 3035.60202(19) | 3034.42121(20) | 3034.23252(20) |
| B | MHz | 1284.460569(47) | 1284.188752(46) | 1284.366566(64) | 1284.096990(54) | 1284.102121(54) |
| C | MHz | 909.093172(34) | 909.096395(33) | 909.114959(49) | 909.120662(36) | 909.116213(36) |
| Δ J | kHz | 0.02347(22) | 0.02264(21) | 0.01785(37) | 0.01623(24) | 0.01670(24) |
| Δ JK | kHz | 0.11479(75) | 0.07318(74) | 0.5234(12) | 0.4891(11) | 0.4750(11) |
| Δ K | kHz | 0.7384(36) | 0.7379(38) | 18.6894(95) | 18.6372(96) | 18.783(11) |
| δ J | kHz | 0.00874(13) | 0.00762(13) | 0.00862(21) | 0.00696(15) | 0.00739(15) |
| δ K | kHz | 0.002243(64) | 0.001594(67) | 0.00482(11) | 0.004174(87) | 0.004064(84) |
| q | MHz | 53.65721(23) | 5409.01107(60) | 5350.70931(62) | 5455.31239(50) | |
| q J | kHz | −2.2031(33) | −4.7020(77) | −2.4461(73) | −6.5910(72) | |
| q K | kHz | −3.437(12) | −575.871(56) | −571.995(56) | −583.601(48) | |
| q JK | kHz | −0.02224(25) | −0.02219(24) | −0.02493(24) | ||
| q KK | kHz | −0.4602(19) | −0.4589(19) | −0.4601(18) | ||
| r | MHz | 24.6679(39) | 519.16058(50) | 542.20062(49) | 493.71397(48) | |
| r J | kHz | −0.3370(60) | −0.9640(58) | 0.4213(57) | ||
| r K | kHz | −118.50(13) | −131.32(12) | −108.76(12) | ||
| N | 186 | 200 | 151 | 172 | 176 | |
| rmsc | kHz | 1.8 | 2.3 | 4.6 | 4.7 | 4.8 |
| Par.a | Unit | XIAMmod | BELGI | Calc.b |
|---|---|---|---|---|
| a All molecular parameters refer to the principal axis system. b Calculated at the B3LYP-D3BJ/6-311++G(d,p) level of theory. The rotational constants refer to the equilibrium structure. Centrifugal distortion constants are obtained from anharmonic frequency calculations. c The Vcc parameter multiplies cos(3α1)cos(3α2). d Derived parameters in XIAMmod. e Fixed to values from the XIAMmod fit. f Fixed due to symmetry. g Number of lines. h Root-mean-square deviation of the fit. | ||||
| A | MHz | 2997.983(16) | 2927.5(72) | 3001.7 |
| B | MHz | 1283.7868(33) | 1277.53(83) | 1282.4 |
| C | MHz | 909.0878(26) | 909.3679(33) | 908.6 |
| Δ K | kHz | −1.72(44) | 0.36802 | |
| V 3,1 | cm−1 | 227.039(51) | 233.92(41) | 203.4 |
| V 3,2 | cm−1 | 3.23(40) | 16.860(58) | 12.1 |
| V cc | cm−1 | −12.9(1.8)c | −6.529(43) | −6.03c |
| ρ 1 | Unitless | 0.01404d | 0.012953(57) | |
| ρ 2 | Unitless | 0.01841d | 0.018843(22) | |
| F 1 | GHz | 161.6173d | 161.6173e | |
| F 2 | GHz | 162.4878d | 162.4878e | |
| D π2K,1 | MHz | 0.841(59) | ||
| D π2K,2 | MHz | 0.477(56) | ||
| D π2−,2 | MHz | −0.264(72) | ||
| D c3J,2 | MHz | 1.02(15) | ||
| D c3K,2 | MHz | 39.1(67) | ||
| D c3−,2 | MHz | 10.8(33) | ||
| ∠(i1,a) | ° | 132.616(37) | 132.97(36) | 133.6 |
| ∠(i1,b) | ° | 42.616(37) | 42.97(37) | 43.6 |
| ∠(i1,c) | ° | 90.0f | 90.0f | 90.0 |
| ∠(i2,a) | ° | 12.8652(11) | 12.29(99) | 13.1 |
| ∠(i2,b) | ° | 77.1348(11) | 77.708(35) | 76.9 |
| ∠(i2,c) | ° | 90.0f | 90.0f | 90.0 |
| N | 885 | 885 | ||
| rmsh | kHz | 549.1 | 4.5 | |
| Operatora | Par.b | Unit | Value |
|---|---|---|---|
| a Operator which the parameters multiply in the program. {A, B} is the anti-commutator AB + BA. α1 and α2 correspond to the o- and p-methyl groups, respectively. b All parameters refer to the quasi-PAM system. c Fixed to values from the XIAMmod fit. d Number of lines. e Root-mean-square deviation of the fit. | |||
| P z 2 | A | MHz | 3007.7(72) |
| P x 2 | B | MHz | 1282.88(83) |
| P y 2 | C | MHz | 909.3679(33) |
| −P4 | Δ J | kHz | 0.0104595(82) |
| −P2Pz2 | Δ JK | kHz | −0.21511(64) |
| −Pz2 | Δ K | kHz | −0.3614(38) |
(1/2)(1 − cos![[thin space (1/6-em)]](https://www.rsc.org/images/entities/char_2009.gif) 3α1) 3α1) |
V 3,1 | cm−1 | 233.92(41) |
| P 1 2 | f 1 | GHz | 161.6173c |
| P x p 1 | r 1 | GHz | −1.7591(84) |
| P x p 1 P 2 | r 1J | kHz | −8.01(40) |
| (1/2){Pz2, Px}p1 | r 1K | MHz | −0.1331(73) |
| P z p 1 | q 1 | GHz | −3.856(20) |
| P z p 1 P 2 | q 1J | kHz | −2.67(83) |
| P z 3 p 1 | q 1K | MHz | −0.208(18) |
| P 1 2 P z 2 | f 1K | MHz | 7.63(70) |
| P 1 2 P x 2 | B 1 | MHz | 0.494(74) |
(1/2)(1 − cos![[thin space (1/6-em)]](https://www.rsc.org/images/entities/char_2009.gif) 3α1)P2 3α1)P2 |
V 3,1J | GHz | 0.0099(11) |
(1/2)(1 − cos![[thin space (1/6-em)]](https://www.rsc.org/images/entities/char_2009.gif) 3α1)Pz2 3α1)Pz2 |
V 3,1K | GHz | 0.248(20) |
(1/2)(1 − cos![[thin space (1/6-em)]](https://www.rsc.org/images/entities/char_2009.gif) 3α1){Px2 − Py2} 3α1){Px2 − Py2} |
V 3,1BC | GHz | 0.0107(11) |
(1/2)(1 − cos![[thin space (1/6-em)]](https://www.rsc.org/images/entities/char_2009.gif) 3α2) 3α2) |
V 3,2 | cm−1 | 16.860(58) |
| P 2 2 | f 2 | GHz | 162.4878c |
| P x p 2 | r 2 | GHz | −0.58045(18) |
| P z p 2 | q 2 | GHz | 6.1314(71) |
| p 2 2 P z 2 | f 2K | MHz | 2.81(12) |
(1/2)(1 − cos![[thin space (1/6-em)]](https://www.rsc.org/images/entities/char_2009.gif) 3α2)P2 3α2)P2 |
V 3,2J | MHz | −0.4611(34) |
(1/2)(1 − cos![[thin space (1/6-em)]](https://www.rsc.org/images/entities/char_2009.gif) 3α2)Pz2 3α2)Pz2 |
V 3,2K | MHz | −15.59(94) |
(1/2)(1 − cos![[thin space (1/6-em)]](https://www.rsc.org/images/entities/char_2009.gif) 3α2){Pz, Px} 3α2){Pz, Px} |
V 3,2AB | MHz | 5.70(14) |
(1/2)(1 − cos![[thin space (1/6-em)]](https://www.rsc.org/images/entities/char_2009.gif) 3α2){Px2 − Py2} 3α2){Px2 − Py2} |
V 3,2BC | MHz | −0.3290(55) |
| P 2 2 P x 2 | B 2 | MHz | 0.0478(16) |
(1 − cos![[thin space (1/6-em)]](https://www.rsc.org/images/entities/char_2009.gif) 3α1)(1 − cos 3α1)(1 − cos![[thin space (1/6-em)]](https://www.rsc.org/images/entities/char_2009.gif) 3α2)Pz2 3α2)Pz2 |
V 12CK | GHz | −0.0498(11) |
(1 − cos![[thin space (1/6-em)]](https://www.rsc.org/images/entities/char_2009.gif) 3α1)(1 − cos 3α1)(1 − cos![[thin space (1/6-em)]](https://www.rsc.org/images/entities/char_2009.gif) 3α2) 3α2) |
V 12C | cm−1 | −6.529(43) |
| p 1 p 2 | F 12 | cm−1 | −0.10538(74) |
| N | 885 | ||
| rmse | kHz | 4.5 | |
4. Results and discussion
The microwave spectrum of 24DMFB was analysed and 885 rotational lines were fitted using the XIAMmod and BELGI-Cs-2Tops programs. The assignment was checked by a combination of separately fitting the torsional species and Ritz cycles. The XIAMmod fit given in Table 3 reaches an rms deviation of 549.1 kHz. The BELGI-Cs-2Tops program decreases the deviation to 4.5 kHz, satisfactorily close to the measurement accuracy of 4 kHz, using additional higher order parameters as given in Table 4.4.1. Rotational constant benchmarking
The benchmark calculations given in Table S2 in the ESI† have shown that all levels of theory used to perform geometry optimisations of 24DMFB yielded equilibrium rotational constants that are in good agreement with the experimental values obtained using the XIAMmod programs with deviations being less than 1.8% in all cases. The rotational constants calculated at the B3LYP-D3BJ/6-311++G(d,p), MP2/6-311++G(d,p) and MP2/6-31G(d,p) levels of theory used to benchmark the 2,6-, 3,4- and 2,3-isomers of DMFB27–29 all performed very well with deviations less than 0.7%, especially B3LYP-D3BJ with deviations less than 0.1%. Therefore, we continue to recommend the B3LYP-D3BJ/6-311++G(d,p) level for microwave spectral assignment of related molecules. The ωB97X-D method in combination with the 6-31+G(d,p), 6-31++G(d,p) and aug-cc-pVDZ basis sets also provided satisfactory results.4.2. Barriers to methyl internal rotation
The torsional barriers of the o- and p-methyl groups are determined to be 227.039(51) cm−1 and 3.23(40) cm−1, respectively, using the XIAMmod program. The value of 233.92(41) cm−1 for the methyl group at the ortho position obtained with the BELGI-Cs-2Tops program is in the same order of magnitude. For the p-methyl group, the BELGI value of 16.860(58) cm−1 is much larger. This is probably connected to the different Vcc values obtained with the two programs. We also note that the A rotational constant obtained with BELGI differs significantly from that of XIAMmod, while the difference is negligible for the C constant. This can be explained by the different approaches used in each program and the large correlation between the rotational constants and the Dab parameter floated in the BELGI code. Therefore, the XIAM values for the rotational constants are more physically meaningful despite the large rms deviation of the fit and they are taken as reference values for comparison with theoretical ones. For the o-methyl group, the barrier heights predicted at the B3LYP-D3BJ/6-311++G(d,p), MP2/6-311++G(d,p) and MP2/6-31G(d,p) levels are 203.4 cm−1, 235.4 cm−1 and 202.6 cm−1, respectively, which are in the same order of magnitude as the value obtained using the XIAMmod and BELGI codes. Unlike the o-methyl group, for the p-methyl top there are large deviations between the calculated values and the XIAMmod value because of the different V6 contributions predicted at different levels. For the MP2/6-311++G(d,p) and MP2/6-31G(d,p) levels of theory, the V6 contribution dominates the V3 term, while it is the inverse for the B3LYP-D3BJ/6-311++G(d,p) level. However, we cannot confirm this experimentally since the V6 term could not be determined using the experimental data set due to the lack of transitions from excited vibrational states. The V6 term can be, in principle, fixed to the predicted value. However, when we fixed the V6 term to the predicted value in the BELGI fit, we obtained almost the same value for the resultant semi-experimental V3 term as when V6 was fixed to zero, and with a similar rms deviation. This is not surprising since in the absence of experimental data from torsional excited states, it is impossible to get a reliable value of V6.The torsional barrier of 227.039(51) cm−1 obtained for the o-methyl group is very close to the value found for 26DMFB (2)27 and for 23DMFB (3)29 as illustrated in Fig. 8. The value is also close to that obtained for 2-fluorotoluene (227.3 cm−1),59 2,3,4-trifluorotoluene (216.3 cm−1),60 2,4,5-trifluorotoluene (190.7 cm−1),60 2,3-difluorotoluene (210.5 cm−1),61 2,4-difluorotoluene (234.2 cm−1)62 and 2,5-difluorotoluene (215.7 cm−1),63 confirming the conclusion given in our previous studies on 23DMFB29 and 26DMFB27 that the barrier to internal rotation of a methyl group adjacent to a fluorine atom is always around 220 cm−1. If we compare the torsional barrier of the p-methyl group to the value of the p-methyl group in 3,4-dimethylfluorobenzene (molecule 4 in Fig. 8),28 a large difference is expected and also observed since the two para methyl groups experience different steric surroundings. The steric-hindrance-free environment leads to an extremely low barrier of the p-methyl group in 24DMFB while an intermediate barrier of 490 cm−1 was found in the case of 34DMFB due to the steric hindrance between the two neighbouring methyl groups. We also compare the very low barrier of the para methyl top in 24DMFB to those obtained for other steric-hindrance-free para-methyl substituted toluene derivatives available in the literature. The value of 3 cm−1 observed for 24DMFB is lower than that of 2,4-dimethylanisole (5, 47.6 cm−1),26p-methyl anisole (6, 49.6 cm−1),64p-tolualdehyde (7, 28.1 cm−1),65p-cresol (8, 18.4 cm−1),13 and p-toluic acid (9, 7.9 cm−1).15 The V3 value of the p-methyl group in 24DMFB is even lower than the pure V6 potential of about 4.9 cm−1 obtained for toluene (10),3–8p-fluorotoluene (11)9 and p-chlorotoluene (12).11 24DMFB is thus the dimethyl substituted toluene derivative with the lowest barrier height ever determined, i.e. lower than the lowest barrier know so far of m-methyl group of syn-2,5-dimethylbenzaldehyde (5.4 cm−1).23
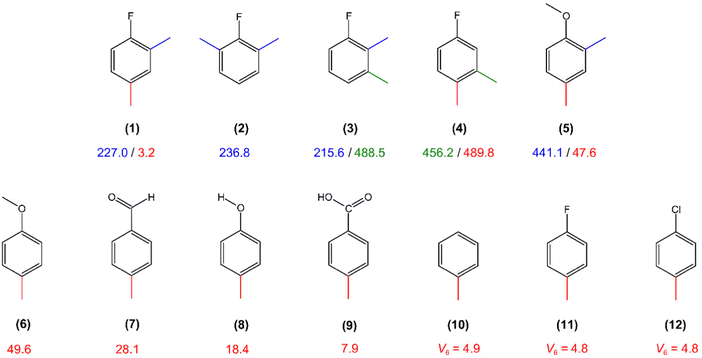 | ||
| Fig. 8 Comparison of the barriers to methyl internal rotation in toluene derivatives: (1) 2,4-dimethylfluorobenzene (this work), (2) 2,6-dimethylfluorobenzene,27 (3) 2,3-dimethylfluorobenzene,29 (4) 3,4-dimethylfluorobenzene,28 (5) 2,4-dimethylanisole,26 (6) p-methyl anisole,64 (7) p-tolualdehyde,65 (8) p-cresol,13 (9) p-toluic acid,15 (10) toluene,3–8 (11) p-fluorotoluene9 and (12) p-chlorotoluene.11 | ||
Despite the same position of the methyl groups in these different molecules and the same steric-hindrance-free surrounding, the barrier values are different from one system to another. This is mediated by the electronic environment and the electronic exchanges through the π-conjugated system depending on the substituents attached to the phenyl group. The coupling between the internal rotations also influences the observed torsional barriers, as shown by the significant Vcc term of the XIAM and BELGI fits as well as calculated by the 2D-PES.
5. Conclusions
The microwave spectrum of 24DMFB was recorded in the frequency range from 2.0 to 26.5 GHz. Torsional splittings were observed due to the internal rotations of two inequivalent methyl groups at the ortho and para positions. The complex splitting patterns were analysed and fitted using the XIAMmod and BELG-Cs-2Tops programs, giving rms deviations of 549.1 kHz and 4.5 kHz, respectively. Combination difference loops and separate fittings of the five torsional components were used to check the assignment and predict new lines. The experimental torsional barriers were determined to be 227.039(51) cm−1 and 3.23(40) cm−1 for the o- and p-methyl groups, respectively. The 2D-PES visualised a significant coupling between the methyl groups, which is also reflected by a large Vcc contribution in the fit. The barrier found for the o-methyl group was compared to those obtained for other ortho-substituted toluene derivatives, confirming that the barrier to internal rotation of a methyl group adjacent to a fluorine atom is always around 220 cm−1. The V3 barrier of the p-methyl group is the lowest value ever observed to date, surpassing all other para-methyl substituted toluene derivatives.Author contributions
The manuscript was written with the contributions of all authors. All authors approved the final version of the manuscript.Conflicts of interest
There are no conflicts of interest to declare.Acknowledgements
This work was supported by the Agence Nationale de la Recherche ANR (project ID ANR-18-CE29-0011) and by the European Union (ERC, 101040480-LACRIDO). Views and opinions expressed are however those of the authors only and do not necessarily reflect those of the European Union. Neither the European Union nor the granting authority can be held responsible for them.References
- H. V. L. Nguyen and I. Kleiner, Phys. Sci. Rev., 2022, 7, 679 Search PubMed.
- H. V. L. Nguyen, W. Caminati and J.-U. Grabow, Molecules, 2022, 27, 3948 CrossRef CAS PubMed.
- H. D. Rudolph, H. Dreizler, A. Jaeschke and P. Wendung, Z. Naturforsch., 1967, 22a, 940 CrossRef.
- W. A. Kreiner, H. D. Rudolph and B. T. Tan, J. Mol. Spectrosc., 1973, 48, 86 CrossRef CAS.
- V. Amir-Ebrahimi, A. Choplin, J. Demaison and G. Roussy, J. Mol. Spectrosc., 1981, 89, 42 CrossRef CAS.
- Z. Kisiel, E. Białkowska-Jaworska, L. Pszczółkowski and H. Mäder, J. Mol. Spectrosc., 2004, 227, 109 CrossRef CAS.
- V. V. Ilyushin, Z. Kisiel, L. Pszczólkowski, H. Mäder and J. T. Hougen, J. Mol. Spectrosc., 2010, 259, 26 CrossRef CAS.
- V. V. Ilyushin, E. A. Alekseev, Z. Kisiel and L. Pszczółkowski, J. Mol. Spectrosc., 2017, 339, 31 CrossRef CAS.
- J. Rottstegge, H. Hartwig and H. Dreizler, J. Mol. Struct., 1999, 478, 37 CrossRef CAS.
- A. Roucou, M. Goubet, I. Kleiner, S. Bteich and A. Cuisset, ChemPhysChem, 2020, 21, 2523 CrossRef CAS PubMed.
- V. A. Shubert, D. Schmitz and M. Schnell, Mol. Phys., 2013, 111, 2189 CrossRef.
- T. Bruhn and H. Mäder, J. Mol. Spectrosc., 2000, 200, 151 CrossRef CAS.
- A. Hellweg and C. Hättig, J. Chem. Phys., 2007, 127, 024307 CrossRef PubMed.
- A. Hellweg, C. Hättig, I. Merke and W. Stahl, J. Chem. Phys., 2006, 124, 204305 CrossRef.
- E. G. Schnitzler, N. A. Seifert, I. Kusuma and W. Jäger, J. Phys. Chem. A, 2017, 121, 8625 CrossRef CAS PubMed.
- A. Roucou, I. Kleiner, M. Goubet, S. Bteich, G. Mouret, R. Bocquet, F. Hindle, W. L. Meerts and A. Cuisset, Chem. Phys. Chem., 2018, 19, 1056 CrossRef CAS.
- A. J. Shirar, D. S. Wilcox, K. M. Hotopp, G. L. Storck, I. Kleiner and B. C. Dian, J. Phys. Chem. A, 2010, 114, 12187 CrossRef PubMed.
- D. A. Obenchain, P. Pinacho, S. Zinn and M. Schnell, J. Mol. Struct., 2020, 1213, 128109 CrossRef.
- K. P. R. Nair, S. Herbers, H. V. L. Nguyen and J.-U. Grabow, Spectrochim. Acta, Part A, 2020, 242, 118709 CrossRef.
- W. Jäger, Microwave study of atmospheric oxidation and product m-toluic acid and its monohydrate, https://hdl.handle.net/2142/97117.
- R. G. Bird and D. W. Pratt, J. Mol. Spectrosc., 2011, 266, 81 CrossRef.
- C. Thomsen and H. Dreizler, Z. Naturforsch., 2001, 56a, 635 CrossRef.
- M. Tudorie, I. Kleiner, M. Jahn, J.-U. Grabow, M. Goubet and O. Pirali, J. Phys. Chem. A, 2013, 117, 13636 CrossRef CAS PubMed.
- L. Ferres, Quantum Chemical and Microwave Spectroscopic Investigations on Phenyl Ring Containing Molecules, PhD dissertation, RWTH Aachen University, Aachen, Germany, 2019 Search PubMed.
- L. Ferres, K.-N. Truong, W. Stahl and H. V. L. Nguyen, Chem. Phys. Chem., 2018, 19, 1781 CrossRef CAS PubMed.
- L. Ferres, W. Stahl and H. V. L. Nguyen, J. Chem. Phys., 2019, 151, 104310 CrossRef.
- S. Khemissi and H. V. L. Nguyen, ChemPhysChem, 2020, 21, 1682 CrossRef CAS.
- J. Mélan, S. Khemissi and H. V. L. Nguyen, Spectrochim. Acta A, 2021, 253, 8 CrossRef.
- S. Khemissi, A. Pérez Salvador and H. V. L. Nguyen, J. Phys. Chem. A, 2021, 125, 8542 CrossRef CAS.
- M. J. Frisch, G. W. Trucks, H. B. Schlegel, G. E. Scuseria, M. A. Robb, J. R. Cheeseman, G. Scalmani, V. Barone, G. A. Petersson, H. Nakatsuji, X. Li, M. Caricato, A. V. Marenich, J. Bloino, B. G. Janesko, R. Gomperts, B. Mennucci, H. P. Hratchian, J. V. Ortiz, A. F. Izmaylov, J. L. Sonnenberg, D. Williams-Young, F. Ding, F. Lipparini, F. Egidi, J. Goings, B. Peng, A. Petrone, T. Henderson, D. Ranasinghe, V. G. Zakrzewski, J. Gao, N. Rega, G. Zheng, W. Liang, M. Hada, M. Ehara, K. Toyota, R. Fukuda, J. Hasegawa, M. Ishida, T. Nakajima, Y. Honda, O. Kitao, H. Nakai, T. Vreven, K. Throssell, J. A. Montgomery, Jr., J. E. Peralta, F. Ogliaro, M. J. Bearpark, J. J. Heyd, E. N. Brothers, K. N. Kudin, V. N. Staroverov, T. A. Keith, R. Kobayashi, J. Normand, K. Raghavachari, A. P. Rendell, J. C. Burant, S. S. Iyengar, J. Tomasi, M. Cossi, J. M. Millam, M. Klene, C. Adamo, R. Cammi, J. W. Ochterski, R. L. Martin, K. Morokuma, O. Farkas, J. B. Foresman and D. J. Fox, Gaussian 16, Revision B.01, Inc., Wallingford CT, 2016 Search PubMed.
- R. Hakiri, N. Derbel, H. V. L. Nguyen and H. Mouhib, Phys. Chem. Chem. Phys., 2018, 20, 25577 RSC.
- C. Dindić and H. V. L. Nguyen, Phys. Chem. Chem. Phys., 2022, 25, 509 RSC.
- V. Van, J. Bruckhuisen, W. Stahl, V. Ilyushin and H. V. L. Nguyen, J. Mol. Spectrosc., 2018, 343, 121 CrossRef CAS.
- S. Khemissi, M. Schwell, I. Kleiner and H. V. L. Nguyen, Mol. Phys., 2022, 120, e2052372 CrossRef.
- A. D. Becke, J. Chem. Phys., 1993, 98, 5648 CrossRef CAS.
- C. Lee, W. Yang and R. G. Parr, Phys. Rev. B, 1988, 37, 785 CrossRef CAS.
- S. Grimme, J. Antony, S. Ehrlich and H. Krieg, J. Chem. Phys., 2010, 132, 15104 CrossRef.
- S. Grimme, S. Ehrlich and L. Goerigk, J. Comput. Chem., 2011, 32, 1456 CrossRef CAS PubMed.
- T. Yanai, D. P. Tew and N. C. Handy, Chem. Phys. Lett., 2004, 393, 51 CrossRef CAS.
- C. Adamo and V. Barone, J. Chem. Phys., 1999, 110, 6158 CrossRef CAS.
- J.-D. Chai and M. Head-Gordon, Phys. Chem. Chem. Phys., 2008, 10, 6615 RSC.
- H. S. Yu, X. He, S. L. Li and D. G. Truhlar, Chem. Sci., 2016, 7, 5032 RSC.
- Y. Zhao and D. G. Truhlar, Theor. Chem. Acc., 2008, 120, 215 Search PubMed.
- C. Møller and M. S. Plesset, Phys. Rev., 1934, 46, 618 CrossRef.
- R. J. Bartlett and M. Musiał, Rev. Mod. Phys., 2007, 79, 291 CrossRef CAS.
- T. H. Dunning, J. Chem. Phys., 1989, 90, 1007 CrossRef CAS.
- M. J. Frisch, J. A. Pople and J. S. Binkley, J. Chem. Phys., 1984, 80, 3265 CrossRef CAS.
- T. Nguyen, V. Van, C. Gutlé, W. Stahl, M. Schwell, I. Kleiner and H. V. L. Nguyen, J. Chem. Phys., 2020, 152, 134306 CrossRef CAS PubMed.
- V. Van, T. Nguyen, W. Stahl, H. V. L. Nguyen and I. Kleiner, J. Mol. Struct., 2020, 1207, 127787 CrossRef.
- J.-U. Grabow, W. Stahl and H. Dreizler, Rev. Sci. Instrum., 1996, 67, 4072 CrossRef CAS.
- J.-U. Grabow and W. Stahl, Z. Naturforsch., 1990, 45a, 1043 CrossRef.
- H. Hartwig and H. Dreizler, Z. Naturforsch., 1996, 51a, 923 CrossRef.
- Y. Zhao, H. V. L. Nguyen, W. Stahl and J. T. Hougen, J. Mol. Spectrosc., 2015, 318, 91 CrossRef.
- S. Herbers, S. M. Fritz, P. Mishra, H. V. L. Nguyen and T. S. Zwier, J. Chem. Phys., 2020, 152, 074301 CrossRef PubMed.
- J. T. Hougen, I. Kleiner and M. Godefroid, J. Mol. Spectrosc., 1994, 163, 559 CrossRef.
- S. Herbers and H. V. L. Nguyen, J. Mol. Spectrosc., 2020, 370, 111289 CrossRef CAS.
- S. Khemissi, V. Van, M. Schwell, I. Kleiner and H. V. L. Nguyen, J. Phys. Chem. A, 2023, 127, 5779 CrossRef CAS PubMed.
- M. Tudorie, I. Kleiner, J. T. Hougen, S. Melandri, L. W. Sutikdja and W. Stahl, J. Mol. Spectrosc., 2011, 269, 211 CrossRef CAS.
- S. Jacobsen, U. Andresen and H. Mäder, Struct. Chem., 2003, 14, 217 CrossRef CAS.
- K. P. R. Nair, S. Herbers, D. A. Obenchain and J.-U. Grabow, Can. J. Phys., 2020, 98, 543 CrossRef CAS.
- K. P. R. Nair, S. Herbers, J.-U. Grabow and A. Lesarri, J. Mol. Spectrosc., 2018, 349, 37 CrossRef CAS.
- K. P. R. Nair, S. Herbers, D. A. Obenchain, J.-U. Grabow and A. Lesarri, J. Mol. Spectrosc., 2018, 344, 21 CrossRef CAS.
- K. P. R. Nair, D. Wachsmuth, J.-U. Grabow and A. Lesarri, J. Mol. Spectrosc., 2017, 337, 46 CrossRef CAS.
- L. Ferres, W. Stahl, I. Kleiner and H. V. L. Nguyen, J. Mol. Spectrosc., 2018, 343, 44 CrossRef CAS.
- H. Saal, J.-U. Grabow, A. R. Hight Walker, J. T. Hougen, I. Kleiner and W. Caminati, J. Mol. Spectrosc., 2018, 351, 55 CrossRef CAS.
Footnote |
| † Electronic supplementary information (ESI) available: Nuclear Cartesian coordinates, basis set variation, Fourier coefficients of the potential curves and the 2D-PES, potential energy surface depending on the dihedral angles α1 and α2 calculated at the MP2/6-311++G(d,p) level of theory, and frequency list. See DOI: https://doi.org/10.1039/d3cp04748b |
| This journal is © the Owner Societies 2024 |

