
 Open Access Article
 This Open Access Article is licensed under a Creative Commons Attribution-Non Commercial 3.0 Unported Licence
Exploring the impact of alignment media on RDC analysis of phosphorus-containing compounds: a molecular docking approach†
Markéta Christou
Tichotová
 ab,
Lucie
Tučková
a,
Hugo
Kocek
a,
Aleš
Růžička
c,
Michal
Straka
a and
Eliška
Procházková
*a
ab,
Lucie
Tučková
a,
Hugo
Kocek
a,
Aleš
Růžička
c,
Michal
Straka
a and
Eliška
Procházková
*a
aInstitute of Organic Chemistry and Biochemistry, Czech Academy of Sciences, 160 00 Prague, Czech Republic. E-mail: prochazkova@uochb.cas.cz
bDepartment of Physical and Macromolecular Chemistry, Faculty of Science, Charles University, 116 28 Prague, Czech Republic
cDepartment of General and Inorganic Chemistry, Faculty of Chemical Technology, University of Pardubice, Pardubice 532 10, Czech Republic
First published on 13th December 2023
Abstract
Residual dipolar couplings (RDCs) are employed in NMR analysis when conventional methods, such as J-couplings and nuclear Overhauser effects (NOEs) fail. Low-energy (optimized) conformers are often used as input structures in RDC analysis programs. However, these low-energy structures do not necessarily resemble conformations found in anisotropic environments due to interactions with the alignment medium, especially if the analyte molecules are flexible. Considering interactions with alignment media in RDC analysis, we developed and evaluated a molecular docking-based approach to generate more accurate conformer ensembles for compounds in the presence of the poly-γ-benzyl-L-glutamate alignment medium. We designed chiral phosphorus-containing compounds that enabled us to utilize 31P NMR parameters for the stereochemical analysis. Using P3D/PALES software to evaluate diastereomer discrimination, we found that our conformer ensembles outperform moderately the standard, low-energy conformers in RDC analysis. To further improve our results, we (i) averaged the experimental values of the molecular docking-based conformers by applying the Boltzmann distribution and (ii) optimized the structures through normal mode relaxation, thereby enhancing the Pearson correlation factor R and even diastereomer discrimination in some cases. Nevertheless, we presume that significant differences between J-couplings in isotropic and in anisotropic environments may preclude RDC measurements for flexible molecules. Therefore, generating conformer ensembles based on molecular docking enhances RDC analysis for mildly flexible systems while flexible molecules may require applying more advanced approaches, in particular approaches including dynamical effects.
Introduction
Conformation and configuration are key features of molecules, affecting their physical, chemical, and biological properties. Relative configuration can be determined by X-ray diffraction (XRD). However, XRD requires a single crystal, which is often difficult to obtain, particularly for biologically active compounds. Moreover, conformations in solid crystals do not necessarily match conformations in solution. In solution, molecular structures are typically analyzed by nuclear magnetic resonance (NMR) spectroscopy. Standard stereochemical analysis based on NMR relies on vicinal 1H–1H 3J-couplings, which are correlated to dihedral angles in a molecule through the Karplus equation,1 or nuclear Overhauser effect2,3 (NOE). When both J-couplings and NOEs fail, molecular stereochemistry may be analyzed using residual dipolar couplings (RDCs).Residual dipolar couplings can be detected when molecular tumbling is reduced in an anisotropic environment.4,5 The anisotropic environment is induced in alignment media,6 such as poly-β-phenethylaspartates,7 stretched polyvinyl acetate gels,8 or poly-γ-benzyl-L-glutamate9 (PBLG). For structural determination, experimental RDC values are correlated with theoretical RDCs, which are back-calculated using alignment tensors of optimized molecular structures (conformers) of isomers studied.
Several program packages based on different principles are available to back-calculate theoretical RDCs (MSpin,10 RDC@hotFCHT,11 MDOC,12 REDCAT,13 and DipoCoup14). However, these approaches usually disregard specific analyte interactions with the alignment medium. To take these interactions into consideration, we must know the 3D structure of both interacting partners. However, to the best of our knowledge, the exact molecular structure of some alignment media remains beyond the reach of contemporary experimentation.
P3D/PALES15–17 was the first method to consider the atomic structure of the alignment medium in determining RDCs of small molecules. P3D/PALES has been adapted to a model of PBLG, which has a well-defined helical structure in chloroform.18–20 The simulations use molecular structures of low-energy conformers as inputs (henceforth referred to as the low-energy approach). However, utilizing this approach in our previous work did not lead to the desired diastereomer discrimination, especially for flexible molecules.21 The potential energy surface (PES) of flexible molecules is usually shallow and may contain several minima (corresponding to conformers) within a few tenths of kcal mol−1 from the global minimum (GM). Importantly, PES may be strongly affected by the environment, i.e., by the presence of the alignment medium. Thus, low-energy structures provided for P3D/PALES simulations may significantly differ from those present in the experiment.
So far, several methods have been proposed for studying non-rigid molecules using RDCs. The most common RDC analysis relies on the alignment tensor fit; this has been adapted either as a single-alignment-tensor22,23 or multiple-alignment-tensor24,25 fitting approach to an optimised conformation ensemble. However, the idea of a single-alignment-tensor fitting to an ensemble of conformers is not generally applicable. The latter approach requires a large amount of anisotropic data, which are not always available. Another approach, usually used for macromolecules, employs the so-called reweight models26–29 (maximum entropy, maximum parsimony, maximum allowed probability, etc.). However, these methods are computationally demanding and fail for more flexible systems. To overcome problems connected to the generation of structures, molecular-dynamics based MDOC12,30,31 or multi-alignment-media based TITANIA32 are an option. However, the main drawback of these methods is, again, the limited availability of larger amounts of experimental data.
The most widely used low-energy approach may not result in a correct back-calculation of theoretical RDCs of non-rigid molecules because a change in analyte conformation affects the RDC values. Based on this assumption, we raised the following research questions: (i) does the alignment medium significantly affect the analyte conformation? (ii) How large can the energy penalty paid by the analyte for the transition to the conformation constrained by the alignment medium be? We propose that conformer ensembles generated via molecular docking may provide a more accurate representation of the reality of the RDC experiment, consequently aiding in answering the posed questions.
Molecular docking is primarily used in drug design33–35 to predict the binding pose (pose = conformation, position, and orientation) of a docked substrate (usually a small molecule = ligand) within a protein binding site. Nevertheless, by treating an analyte as the ligand and an alignment medium as the binding site, molecular docking may generate a more accurate conformer ensemble than the standard low-energy approach. Accordingly, we can consider the low-energy approach to generate conformers in isotropic solution and the molecular docking procedure to generate conformers in the presence of the alignment medium in RDC experiments.
In this study, we developed and evaluated a molecular docking-based approach to generate more accurate conformer ensembles for compounds in the poly-γ-benzyl-L-glutamate (PBLG)9,36–40 alignment medium environment. The model compounds used in this work feature a chiral phosphorus atom. We had shown in our previous work21 that 31P NMR parameters provide structural insights that aid the stereochemical analysis of phosphorus-containing compounds. We presume that the conformer ensembles generated via docking may provide a better approximation to the reality of RDC experiments than the conventional low-energy approach. Conformers generated by docking were used as inputs for RDC analysis. With the obtained back-calculated (theoretical) RDC datasets, we created Boltzmann distribution-weighted average RDC datasets which were then correlated with experimental RDC values. In addition, we relaxed the resulting geometries by constrained optimization in internal coordinates (henceforth referred to as normal mode relaxation). This approach preserves the overall molecular shape predicted by docking while relaxing the bond lengths and angles to obtain even more accurate input structures. The applicability of our molecular docking-based approach was evaluated by the P3D/PALES method. Finally, we also provide a comprehensive discussion of the underlying reasons behind the obtained results.
Results and discussion
Design and characterization of model compounds
We designed three classes of model compounds (Fig. 1) differing in molecular flexibility, as indicated by the nConf20 parameter, which have been devised to quantify the flexibility of a molecule41 (details are provided in the Experimental Section). As the most rigid compounds, we prepared phosphorylated derivatives of isopinocampheol (IPC; 1, nConf20 = 0), which is often used as a model compound in RDC studies.9,42–44 We synthetized all four isomers of 1 to probe the robustness of the proposed docking-based approach. The absolute configuration of 1 was determined by X-ray diffraction (more details in ESI†). Subsequently, we applied the docking approach to mildly (2, nConf20 = 2) and highly flexible compounds (3, nConf20 = 8) that have been studied in our previous work.21 Both 2 and 3 were characterized in our previous study21 by means of NMR spectroscopy. Therein, also the absolute configuration of 2-SR and 2-RR was determined by X-ray diffraction. So far, we have been unable to prepare suitable crystals of 3 for X-ray diffraction analysis. This reluctance to crystallize has been previously associated with high molecular flexibility.45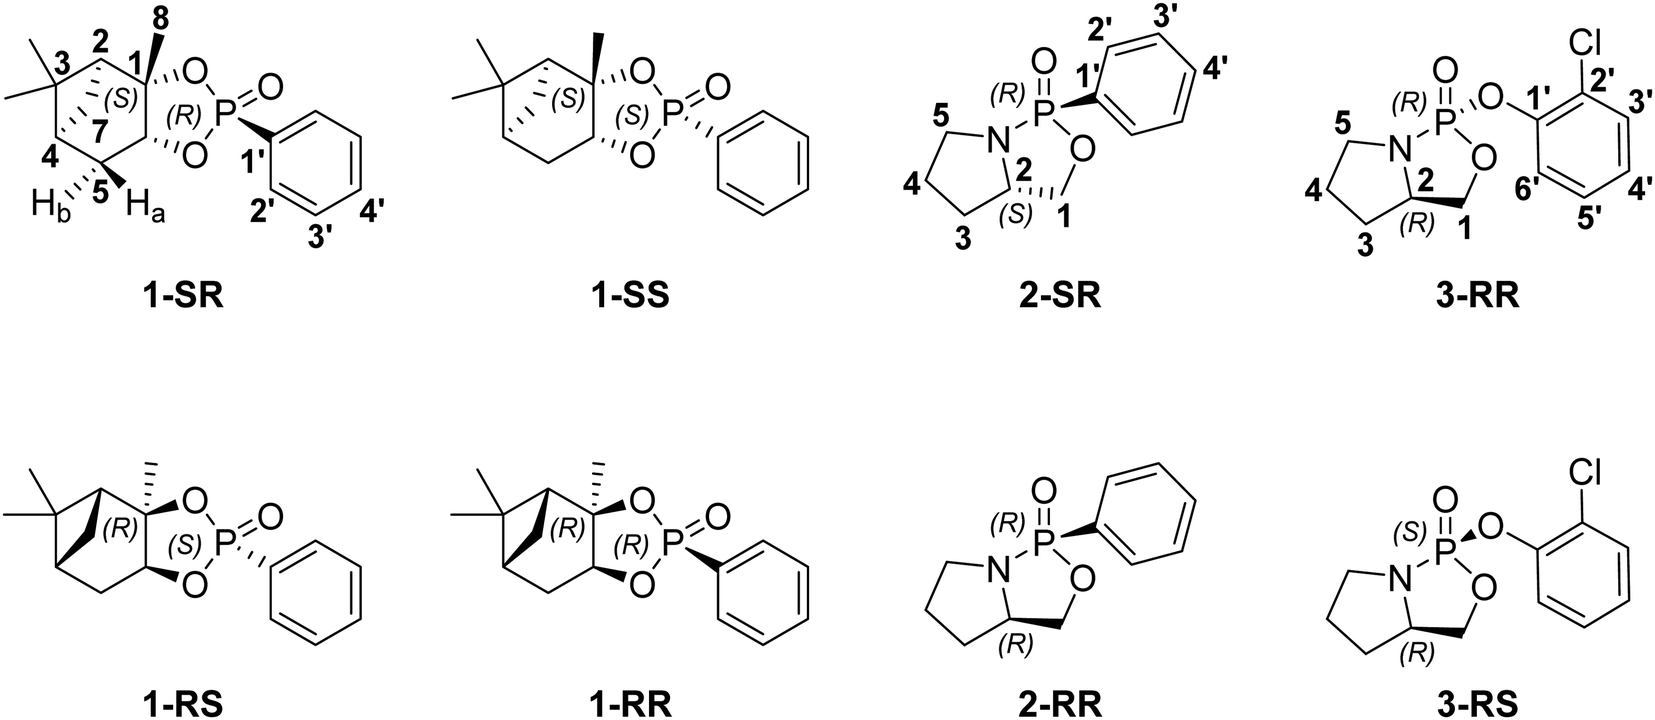 | ||
| Fig. 1 Chemical structures and atom numbering of the compounds studied. Absolute configuration of compounds 1 and 2 was determined by X-ray diffraction. Stereochemistry is denoted only for the relevant chiral centers (i.e., phosphorus and carbon C1 for 1 or C2 for 2 and 3). | ||
Molecular docking of 1 (rigid structures)
Standard conformational analysis revealed only one low-energy conformer for each stereoisomer of 1. Conversely, by molecular docking we found four unique conformers of 1-SR, one of 1-SS, three of 1-RS, and three of 1-RR. The DFT-calculated single point energies of the 1-SR and 1-SS conformers generated by docking were located approximately 6 kcal mol−1 above the individual global minima (GMs), whereas those of 1-RS and 1-RR were located more than 13 kcal mol−1 above GMs (Table S2 in ESI†).The different energy distributions of unique conformations of individual isomers may be explained by differences in their diastereotopic interactions with the alignment medium. In particular, the energy penalty seems to be associated with the configuration on carbon C1 (Fig. 1). As shown in Fig. 2, the detailed microscopic view of poses obtained from molecular docking reveals that the (SX)-isomers (X = R or S; Fig. 2(a) and (b)) fit into the groove that winds around the PBLG polymer chain. By contrast, the (RX)-isomers (Fig. 2(c) and (d)) do not fit into this groove due to the shape of the bicyclic part of the molecule. The π–π stacking between the phenyl groups of the polymer and the analyte was observed throughout majority of the poses. The distance between the stacked rings was ∼4 Å. Table S2 (ESI†) lists the DFT single-point energies of all unique conformers generated by docking and calculated relatively to the individual GMs (ΔE = E(conf.) − E(GM), where E is the electronic energy of the given system).
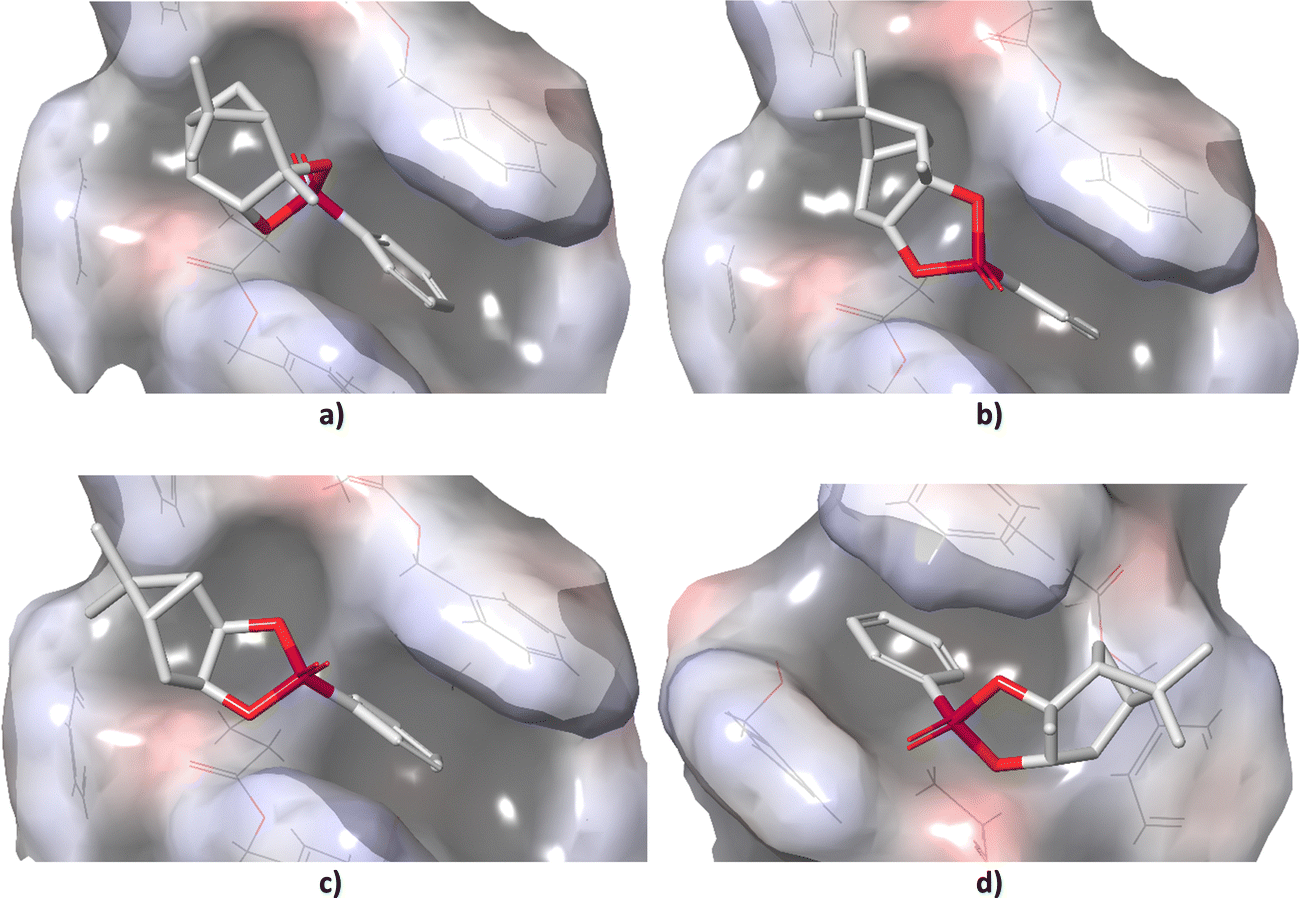 | ||
| Fig. 2 Docked poses of (a) 1-SR, (b) 1-SS, (c) 1-RS, and (d) 1-RR in the helical structure of PBLG obtained from molecular docking. Carbon atoms are in white, oxygen in red, phosphorus in purple; hydrogens were omitted for clarity. | ||
To address the conformational tumbling of the molecule in the environment of the alignment medium, we calculated the Boltzmann distribution-weighted average of the RDCs of conformers obtained from docking. These RDCs (Unrelaxed. Boltz.) were correlated with all the experimental datasets of each isomer, as shown in Fig. 3 (the RDC values of each conformer are provided in Fig. S8–S23 in ESI†). The Pearson correlation coefficients (R) of the GM theoretical RDCs are also shown in Fig. 3.
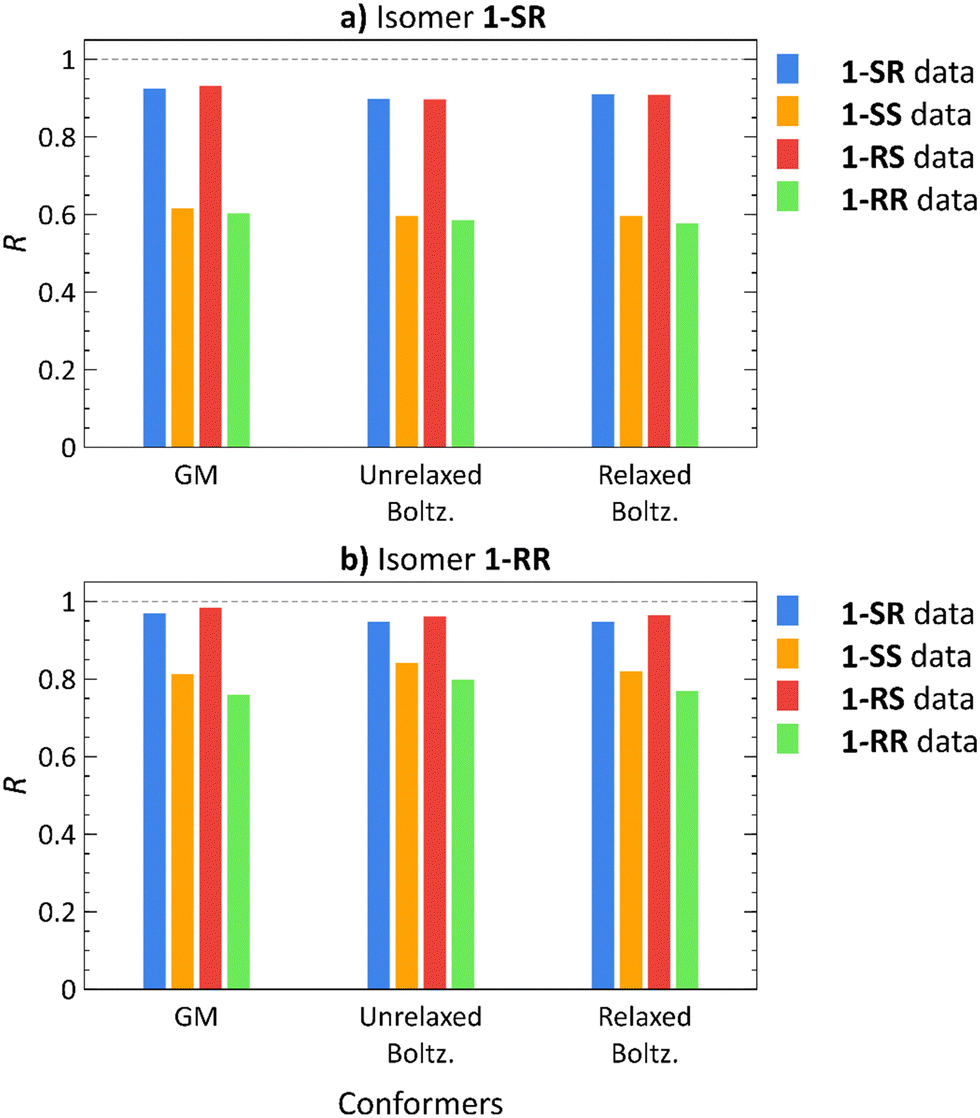 | ||
| Fig. 3 Pearson correlation coefficients (R) of RDCs calculated using global minimum (GM) conformers, Boltzmann distribution-weighted theoretical RDCs of conformers obtained from molecular docking (Unrelaxed Boltz.), and the same conformers after normal mode relaxation (Relaxed Boltz.) of isomers 1-SR (a) and 1-RR (b) correlated with 1-SR (blue), 1-SS (orange), 1-RS (red), and 1-RR (green) RDC experimental datasets. | ||
For 1-SR and 1-RS, only the correct RDC datasets yields high correlation coefficients (R > 0.8); for 1-SS and 1-RR, both the correct and the incorrect datasets lead to high correlation coefficients (Fig. 3). Nevertheless, the correct 1-SS and 1-RR datasets show a stronger correlation with the (correct) 1-SS and 1-RR structures, than with 1-SR and 1-RS. Therefore, diastereomer discrimination is not unequivocal although we are able to unilaterally determine the configuration of the enantiomer pairs of the compounds under study.
To improve the diastereomer discrimination, we relaxed the structures generated by docking using the normal mode relaxation method developed by Bouř et al.46,47 (computational details are provided in the Experimental Section). We assumed that density functional theory (DFT)-aided relaxation of the conformers obtained from docking would lead to more accurate conformer ensembles. The relaxed conformers were found approximately 1 kcal mol−1 for 1-SR and 1-SS and 2–4 kcal mol−1 for 1-RS and 1-RR above the corresponding GM (Table S3, ESI†). Normal mode relaxation slightly improved the diastereomer distinction, albeit with the same trends as those observed in unrelaxed conformers and GM structures. Thus, implementing molecular docking does not appear to be beneficial for RDC-aided structural elucidation of structures as rigid as isomers of 1 (nConf20 = 0).
Molecular docking of 2 (mildly flexible molecules)
The molecules 2-SR and 2-RR are more flexible than the isomers of 1, as shown by the number of conformations (see below) as well as by nConf20 parameter of 2, but still partly rigid due to their two interconnected five-membered rings. Using the low-energy approach, we have previously identified three non-redundant low-energy conformers for each diastereomer of isolated system 2.21 In turn, the docking procedure, which mimics the anisotropic environment, found tens of docking poses for each diastereomer of 2. Again, π–π stacking was observed for the majority of the discovered poses. However, many of the resulting conformers were nearly identical; hence, we had to apply a method for eliminating redundant conformers.In our previous study, we have employed an approach based on dihedral angle analysis,21 ultimately identifying three unique conformers for both isomers. In this work, we used a more complex machine learning (ML)-based algorithm for eliminating redundant conformers (henceforth referred to as ML elimination, see Experimental Section). As a result, we found 22 and 21 unique conformers for 2-SR and 2-RR, respectively. According to the DFT single-point energies, all of these conformers are located 4–10 kcal mol−1 above the corresponding GMs (Table S4, ESI†). The structures generated by docking were then relaxed by normal mode relaxation. The relaxed conformers lie 1–6 kcal mol−1 above the corresponding GMs (Table S5, ESI†).
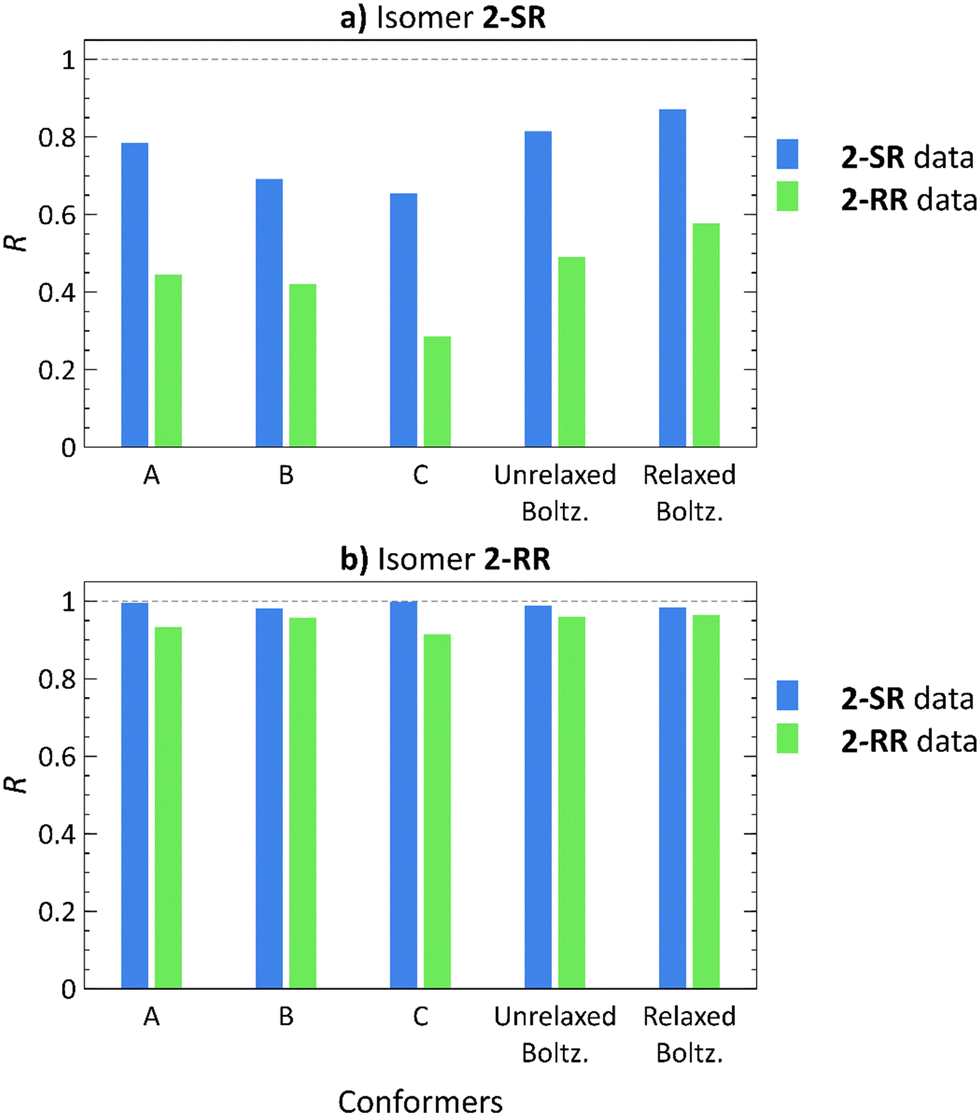
Employing the Boltzmann distribution-weighted theoretical RDCs, we calculated the R values against the sets of experimental RDCs. The results shown in Fig. 4 demonstrate that the overall trends match those observed in our previous study21 (also included in Fig. 4 for a direct comparison: conformers A, B, C).
 | ||
| Fig. 4 Pearson correlation coefficients (R) of RDCs calculated using low-energy conformers21 (A)–(C), Boltzmann distribution-weighted theoretical RDCs of conformers obtained from molecular docking (Unrelaxed Boltz.), and the same conformers after relaxation by normal mode relaxation (Relaxed Boltz.) of structures 2-SR (a) and 2-RR (b) correlated with the 2-SR (blue) and 2-RR (green) RDC experimental datasets. | ||
The 2-RR RDC dataset provides the best diastereomer discrimination (Tables S57 and S59, ESI†), whereas the 2-SR dataset yields a good fit (R > 0.8) for both 2-SR and 2-RR structures (Tables S56 and S58, ESI†). However, the 2-SR structures show a higher overall correlation for conformers from molecular docking as compared to the low-energy approach. Furthermore, the additional normal mode relaxation increases the R values in all cases, except for the 2-SR RDC dataset with 2-RR conformers, where the R is slightly lower (R = 0.988 for the unrelaxed versus 0.985 for relaxed structures).
For the 2-SR isomer, the GM structure yields R = 0.785 using the 2-SR experimental RDCs,21Fig. 4. Employing conformers generated by molecular docking increases the 2-SR dataset R value to 0.815. Subsequent normal mode relaxation further improves the correlation (R = 0.871), albeit for both the correct and the incorrect datasets. Using conformers of 2-RR, diastereomer discrimination was not possible, neither using the low-energy nor the docking approach. Although the 2-SR dataset produces R > 0.8 for both 2-RR and 2-SR molecular structures, the 2-RR RDC dataset unambiguously yields a weak correlation for 2-SR (R = 0.578 after normal mode relaxation) and a strong correlation for 2-RR structures (R = 0.964 after normal mode relaxation). Thus, we have been able to achieve only unilateral diastereomer discrimination.
Notwithstanding the unilateral diastereomer discrimination, the structures can be assigned to datasets at a specific level of probability. Overall, the trends of 1 and 2 are rather similar. For visual comparison, the lowest energy conformers obtained in the previous study (A,21 red), and the lowest energy conformers generated by molecular docking with (green) and without (blue) subsequent normal mode relaxation are shown in Fig. 5.
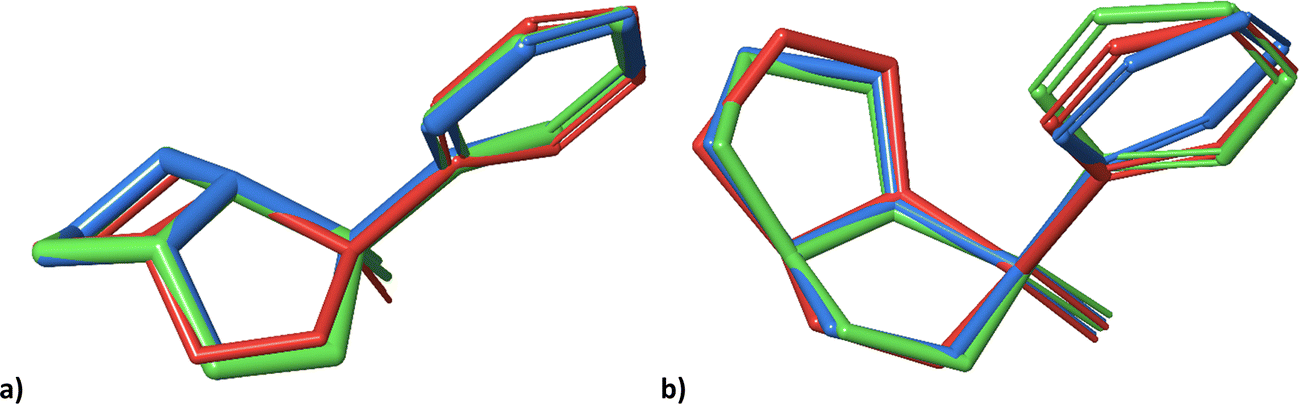 | ||
| Fig. 5 Geometries of the lowest energy conformers of 2-SR (a) and 2-RR (b) from the previous study21 (red), and the lowest energy conformers obtained from molecular docking into PLBG before (blue) and after normal mode relaxation (green). | ||
Molecular docking of 3 (highly flexible molecules)
3-RS and 3-RR are the most flexible molecules in this study. In our previous work,21 conformational analysis of 3 with subsequent elimination of redundant structures produced 9 and 17 unique low-energy conformers for 3-RS and 3-RR, respectively. The docking approach with ML elimination of redundant conformers identified 23 unique conformers for 3-RS and 34 conformers for 3-RR isomer. The DFT-calculated single-point energies revealed that these conformers are located 6–15 kcal mol−1 above the individual GMs, and 2–11 kcal mol−1 above the GMs after the subsequent normal mode optimization (details in Tables S6 and S7, ESI†). Unfortunately, we could not assign the experimental RDC datasets to the two isomers of 3, as we were unable to prepare crystals of 3 suitable for X-ray diffraction analysis (presumably because of the high flexibility of these molecules as indicated above). For this reason, the two measured RDC datasets are denoted as 3-A and 3-B in the following.The 3-A RDC dataset yields higher correlation coefficients with both 3-RS and 3-RR structures than the 3-B dataset, Fig. 6. The best correlation coefficients (R > 0.8) were obtained for the normal mode-relaxed 3-RS conformers with the 3-A dataset. However, the 3-B dataset fits on 3-RS structures as well, although the absolute R values are smaller than for the 3-A dataset (R = 0.802 and 0.590 for 3-A and 3-B RDC datasets, respectively). Thus, whether any degree of diastereomer discrimination can be inferred is at best questionable.
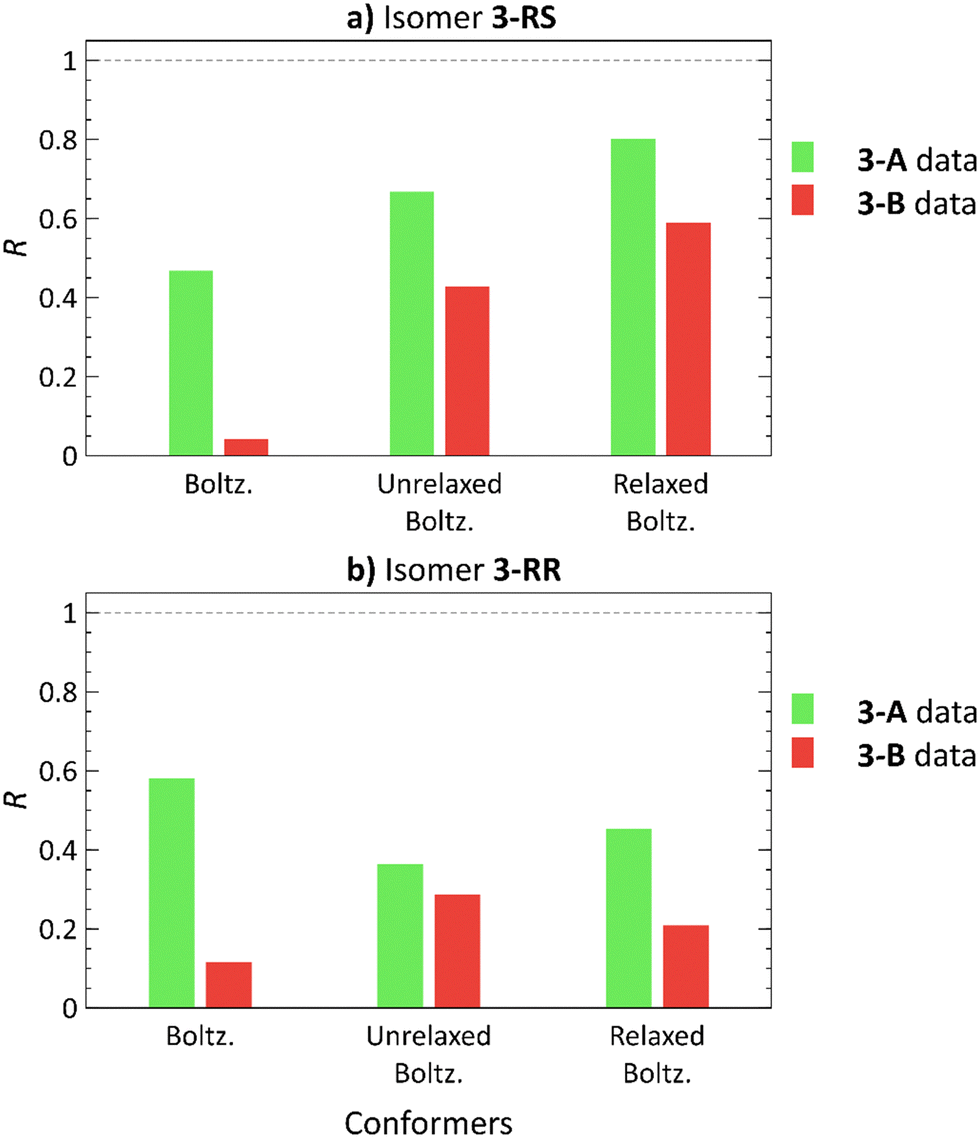 | ||
| Fig. 6 Pearson correlation coefficients (R) of Boltzmann distribution-weighted average RDCs calculated using theoretical RDCs of low-energy conformers21 (Boltz.), conformers obtained from molecular docking (unrelaxed Boltz.) and these conformers after normal mode relaxation (relaxed Boltz.) of 3-RS (a) and 3-RR (b) correlated with the 3-A (green) and 3-B (red) RDC experimental datasets. | ||
The trend, in which one dataset yields good correlation for both diastereomers was observed for all of the studied compounds, albeit less markedly for 3. So, does this trend have a physical meaning? We speculate that a possible explanation is that the isomers with an ‘all-fitting’ RDC dataset (1-SR, 1-RS, 2-SR, 3-A) are moving more freely in the alignment medium environment. Thus, the induced RDCs are averaged over a higher number of geometries, accounting the goodness-of-fit of the experimental RDCs and the calculated RDCs of various conformers and isomers. Conversely, the isomers with the ‘non-fitting’ RDC dataset (1-SS, 1-RR, 2-RR, 3-B) may be involved in isomer-specific interactions with the alignment medium, which cannot be adequately modelled by molecular docking. For 3, another possible explanation may be the higher variability of the RDC values of the 3-A dataset (Tables S32–S39, ESI†). Consequently, the 3-A dataset has higher R values than the 3-B dataset.
Fig. 6 shows yet another trend: using normal mode relaxation significantly improves the correlation of the worst-fitting RDC dataset 3-B with 3-RS structures and worsens the correlation with 3-RR isomer structures. A similar trend is observed in Fig. 4, where the 2-SR RDC dataset shows a slightly lower R with the incorrect 2-RR structures after normal mode relaxation, suggesting an incorrect structure/dataset match. However, without the XRD structure, we cannot ascertain whether this trend can help us to identify which dataset belongs to which isomer with a high level of certainty.
Furthermore, for highly flexible molecules such as 3, the conventional approach for the experimental determination of RDCs may fail.12,24,32,48,49 Typically, the J-couplings extracted from experiment in the isotropic environment (i.e., isotropic J-couplings) are subtracted from the total T-couplings measured in the anisotropic environment to yield RDCs (eqn (1) in Experimental Section). However, the isotropic J-couplings may significantly differ from the real anisotropic J-couplings in the alignment medium, as indicated by the different conformer populations in isotropic and in anisotropic environments.
The differences between J-couplings calculated employing different conformer ensembles are clear and support our hypothesis: as shown in Table 1, we calculated J-couplings in the isotropic (presented by the low-energy conformer ensemble) and in the anisotropic environment (presented by the docking-obtained conformer ensemble). As an example, the calculated isotropic and anisotropic JC3–P-couplings of the 3-RR isomer are 3.8 and 1.0 Hz, respectively, resulting in a difference of 2.8 Hz between the isotropic and anisotropic value. For RDC calculated according to eqn (1) in Experimental Section, this difference would lead to an error of 2000% of the experimental RDC value determined using the isotropic J-coupling. More examples to show the difference between J-couplings calculated using different conformer ensembles can be found in Table 1. A more detailed study on this subject is currently underway.
| Interaction | Exp. J (Hz)21 | Calc. J low-energy ensemble (Hz)21 | Calc. J relaxed docking ensemble (Hz) | |||
|---|---|---|---|---|---|---|
| 3-A | 3-B | 3-RS | 3-RR | 3-RS | 3-RR | |
| C1–P | 4.8 | 4.6 | 6.8 | 5.6 | 6.9 | 5.1 |
| C2–P | 13.0 | 12.9 | 12.2 | 13.1 | 10.7 | 12.0 |
| C3–P | 4.1 | 3.6 | 3.1 | 3.8 | 0.4 | 1.0 |
| C4–P | 3.4 | 3.1 | 2.0 | 2.7 | −0.7 | 0.8 |
| C5–P | 3.2 | 1.4 | 0.4 | 2.4 | −0.5 | 1.4 |
| C1'–P | 6.1 | 8.9 | −10.8 | −10.7 | −11.7 | −7.7 |
| C2′–P | 7.6 | 8.9 | 8.7 | 5.9 | 10.9 | 7.0 |
| C3′–P | 2.9 | 2.6 | −0.8 | −2.3 | 0.0 | −1.2 |
| C4′–P | 1.8 | 1.4 | 1.2 | 2.6 | 0.5 | 1.7 |
| C5′–P | 1.7 | 1.3 | −1.5 | −2.6 | −0.8 | −1.9 |
| C6′–P | 1.3 | 0.8 | 2.1 | 3.2 | 2.9 | 2.2 |
| C2–H2 | 151.4 | 150.3 | 147.3 | 141.4 | 145.5 | 134.3 |
| C3′–H3′ | 163.6 | 163.9 | 162.9 | 156.7 | 162.2 | 150.3 |
| C4′–H4′ | 162.6 | 162.5 | 160.6 | 154.4 | 160.0 | 148.4 |
| C5′–H5′ | 165.4 | 163.0 | 159.6 | 153.9 | 159.4 | 147.6 |
| C6′–H6′ | 165.6 | 165.3 | 164.7 | 156.8 | 162.3 | 149.9 |
Experimental section
Computational methodology
| pales -elPales -3D -pot3D PBLG.dx -lcS 0.8 -maxPot 2 -z1 150 -zN 250 -nX 129 -nY 129 -nZ 385 -dX 0.4 -dY 0.4 -dZ 0.4 -H -nosurf -pdb Molecule.pdb -inD RDCs.tbl -wv 0.12 -rM 8 -pka charges.pka -outD output.out, |
![[thin space (1/6-em)]](https://www.rsc.org/images/entities/char_2009.gif) 000 to mitigate the influence of stochasticity in the process of structure generation.
000 to mitigate the influence of stochasticity in the process of structure generation.
Experimental methodology
Due to the high viscosity of the solution, the sample was homogenized using a manual centrifuge. Sample homogeneity was then monitored by 2H image experiments, and the alignment order was determined by measuring the quadrupolar splitting of the solvent in 2H NMR spectra.
 | (1) |
The RDC data were evaluated using Pearson's correlation coefficient R and quality factor Q.
Pearson's correlation coefficient R is defined as follows:
 | (2) |
The quality factor is given by the following equation:
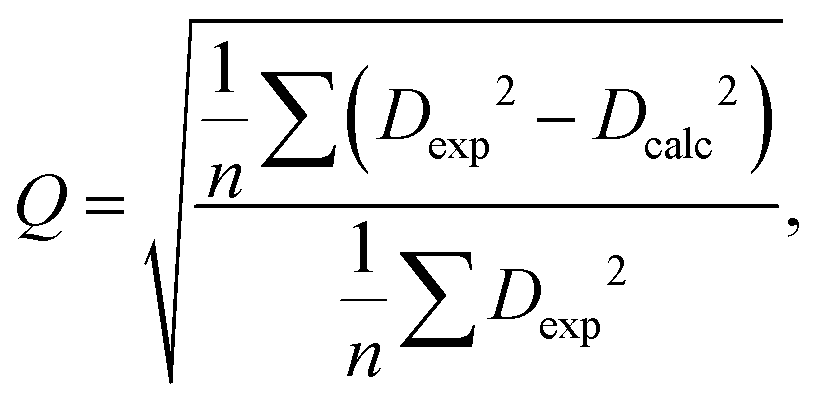 | (3) |
Conclusions
In this work, we investigated whether the involvement of alignment media in generation of conformer ensembles via molecular docking improves the performance of RDC-aided stereochemical analysis. We have found that it depends on the flexibility of the molecules under study. The docking approach does not markedly affect the conformation space of rigid molecules such as 1, neither it significantly improves the quality of RDC analysis. However, the different conformer ensembles do affect the results, indicating that the alignment medium influences the conformation space of the analyte molecules. Generally, a non-negligible energetic penalty for higher-lying conformers may be compensated for by the analyte–medium interactions which may extend/alter the conformer ensembles in the anisotropic environment in comparison with the isotropic solution. This energy penalty is diastereotopic (isomer-dependent), this effect is most profound in the case of rigid molecules, such as isomers of 1 that are not as capable of adapting to the chiral environment of PBLG. For mildly flexible systems, such as 2, the ensembles of conformers generated by molecular docking clearly enhance the accuracy of RDC-aided stereochemical analysis. Additional DFT optimization of conformers obtained from molecular docking by constrained normal mode relaxation further improves the accuracy of RDC analysis and brings in a clearer diastereomer discrimination. The docking approach does not improve the results of RDC analysis for highly flexible structures, such as 3; we speculate that this is due to the possibly incorrect experimental determination of RDCs using J-couplings obtained from experiments in isotropic solutions. The total coupling T of an anisotropic conformer ensemble consists of RDCs and J-couplings, however, the difference between anisotropic an isotropic J-couplings may increase with molecular flexibility due to the fact that J-couplings are rather sensitive to changes in molecular geometries. This difference may preclude RDC determination for highly flexible molecules because – like RDCs – anisotropic J-couplings cannot be measured directly. To answer the questions laid in the Introduction, the consideration of alignment medium does have an effect on the conformation space of analyte and thus the quality of RDC analysis. Even more accurate conformer ensembles may be generated using advanced simulation methods (employing, e.g., QM/MM or molecular dynamics). Furthermore, the simple model containing “static snapshots”, i.e., singular conformers of the studied systems, is perhaps insufficient for the correct description of the entire conformational space. Methods addressing fast molecular motion and dynamic effects may provide more precise results, however, at a larger computational cost. From experimental point of view, the effect of different alignment media on the RDC values should be compared because specific analyte–medium interactions likely induce different conformer ensembles, which are associated with different sets of RDCs.Conflicts of interest
There are no conflicts to declare.Acknowledgements
This research was funded by the Czech Science Foundation (21-23014S). We thank Dr Jakub Kaminský for his help with the normal mode relaxation method, Kvetoslava Kertisová for HR-MS analysis, Alain Ibáñez de Opakua for the model structure of PBLG, and Dr Carlos V. Melo for editing the manuscript.References
- M. Karplus, J. Am. Chem. Soc., 1963, 85, 2870–2871 CrossRef CAS.
- R. A. Bell and J. K. Saunders, Can. J. Chem., 1970, 48, 1114–1122 CrossRef CAS.
- A. W. Overhauser, Phys. Rev., 1953, 92, 411–415 CrossRef CAS.
- F. Kramer, M. V. Deshmukh, H. Kessler and S. J. Glaser, Concepts Magn. Reson., Part A, 2004, 21A, 10–21 CrossRef.
- C. M. Thiele, Eur. J. Org. Chem., 2008, 5673–5685 CrossRef CAS.
- G. Kummerlöwe and B. Luy, TrAC, Trends Anal. Chem., 2009, 28, 483–493 CrossRef.
- M. Schwab, D. Herold and C. M. Thiele, Chem. – Eur. J., 2017, 23, 14576–14584 CrossRef CAS PubMed.
- J. C. Freudenberger, S. Knor, K. Kobzar, D. Heckmann, T. Paululat, H. Kessler and B. Luy, Angew. Chem., Int. Ed., 2005, 44, 423–426 CrossRef CAS PubMed.
- A. Marx and C. Thiele, Chem. – Eur. J., 2009, 15, 254–260 CrossRef CAS.
- A. Navarro-Vázquez, Magn. Reson. Chem., 2012, 50, S73–S79 CrossRef PubMed.
- V. Schmidts, PhD thesis, Technische Universität Darmstadt, 2013 Search PubMed.
- M. Di Pietro, U. Sternberg and B. Luy, J. Phys. Chem. B, 2019, 123, 8480–8491 CrossRef CAS.
- H. Valafar and J. H. Prestegard, J. Magn. Reson., 2004, 167, 228–241 CrossRef CAS PubMed.
- J. Meiler, W. Peti and C. Griesinger, J. Biomol. NMR, 2000, 17, 283–294 CrossRef CAS PubMed.
- A. Ibáñez de Opakua, F. Klama, I. E. Ndukwe, G. E. Martin, R. T. Williamson and M. Zweckstetter, Angew. Chem., Int. Ed., 2020, 59, 6172–6176 CrossRef PubMed.
- A. Ibáñez de Opakua and M. Zweckstetter, Magn. Reson., 2021, 2, 105–116 CrossRef PubMed.
- M. Zweckstetter, Nat. Protoc., 2008, 3, 679–690 CrossRef CAS PubMed.
- J. R. Kim and T. Ree, J. Polym. Sci., Polym. Chem. Ed., 1985, 23, 215–221 CrossRef CAS.
- P. Doty, J. H. Bradbury and A. M. Holtzer, J. Am. Chem. Soc., 1956, 78, 947–954 CrossRef CAS.
- M. Sarfati, P. Lesot, D. Merlet and J. Courtieu, Chem. Commun., 2000, 2069–2081 RSC.
- M. Tichotová, A. Ešnerová, L. Tučková, L. Bednárová, I. Císařová, O. Baszczyňski and E. Procházková, J. Magn. Reson., 2022, 336, 107149 CrossRef PubMed.
- A. Schuetz, J. Junker, A. Leonov, O. F. Lange, T. F. Molinski and C. Griesinger, J. Am. Chem. Soc., 2007, 129, 15114–15115 CrossRef CAS PubMed.
- P. Trigo-Mouriño, R. Santamaría-Fernández, V. M. Sánchez-Pedregal and A. Navarro-Vázquez, J. Org. Chem., 2010, 75, 3101–3104 CrossRef PubMed.
- C. M. Thiele, V. Schmidts, B. Böttcher, I. Louzao, R. Berger, A. Maliniak and B. Stevensson, Angew. Chem., Int. Ed., 2009, 48, 6708–6712 CrossRef CAS PubMed.
- C. M. Thiele, A. Maliniak and B. Stevensson, J. Am. Chem. Soc., 2009, 131, 12878–12879 CrossRef CAS PubMed.
- D. Selegato, C. Bracco, C. Giannelli, G. Parigi, C. Luchinat, L. Sgheri and E. Ravera, ChemPhysChem, 2021, 22, 127–138 CrossRef PubMed.
- E. Ravera, L. Sgheri, G. Parigi and C. Luchinat, Phys. Chem. Chem. Phys., 2016, 18, 5686–5701 RSC.
- S. Bottaro, T. Bengtsen and K. Lindorff-Larsen, Methods Mol. Biol., 2020, 2112, 219–240 CrossRef CAS PubMed.
- I. Bertini, Y. K. Gupta, C. Luchinat, G. Parigi, M. Peana, L. Sgheri and J. Yuan, J. Am. Chem. Soc., 2007, 129, 12786–12794 CrossRef CAS PubMed.
- U. Sternberg, P. Tzvetkova and C. Muhle-Goll, Phys. Chem. Chem. Phys., 2020, 22, 17375–17384 RSC.
- P. Tzvetkova, U. Sternberg, T. Gloge, A. Vazquez and B. Luy, Chem. Sci., 2019, 10, 8774–8791 RSC.
- F. A. Roth, V. Schmidts, J. Rettig and C. M. Thiele, Phys. Chem. Chem. Phys., 2022, 24, 281–286 RSC.
- F. Stanzione, I. Giangreco and J. C. Cole, Prog. Med. Chem., 2021, 60, 273–343 Search PubMed.
- N. S. Pagadala, K. Syed and J. Tuszynski, Biophys. Rev., 2017, 9, 91–102 CrossRef CAS PubMed.
- K. A. Peele, C. Potla Durthi, T. Srihansa, S. Krupanidhi, V. S. Ayyagari, D. J. Babu, M. Indira, A. R. Reddy and T. C. Venkateswarulu, Inform. Med. Unlocked, 2020, 19, 100345 CrossRef PubMed.
- V. M. Marathias, G. J. Tawa, I. Goljer and A. C. Bach, Chirality, 2007, 19, 741–750 CrossRef CAS PubMed.
- A. Marx, V. Schmidts and C. M. Thiele, Magn. Reson. Chem., 2009, 47, 734–740 CrossRef CAS PubMed.
- A. Marx, B. Böttcher and C. M. Thiele, Chem. – Eur. J., 2010, 16, 1656–1663 CrossRef CAS PubMed.
- L. Vrzal, M. Kratochvilova-Simanova, T. Landovsky, K. Polivkova, J. Budka, H. Dvorakova and P. Lhotak, Org. Biomol. Chem., 2015, 13, 9610–9618 RSC.
- T. Landovský, M. Tichotová, L. Vrzal, J. Budka, V. Eigner, H. Dvořáková and P. Lhoták, Tetrahedron, 2018, 74, 902–907 CrossRef.
- J. G. P. Wicker and R. I. Cooper, J. Chem. Inf. Model., 2016, 56, 2347–2352 CrossRef CAS PubMed.
- S. Hansmann, T. Larem and C. M. Thiele, Eur. J. Org. Chem., 2016, 1324–1329 CrossRef CAS.
- T. Montag and C. M. Thiele, Chem. – Eur. J., 2013, 19, 2271–2274 CrossRef CAS.
- S. Jeziorowski and C. Thiele, Chem. – Eur. J., 2018, 24, 15631–15637 CrossRef CAS PubMed.
- L. Yu, S. M. Reutzel-Edens and C. A. Mitchell, Org. Process Res. Dev., 2000, 4, 396–402 CrossRef CAS.
- P. Bouř and T. A. Keiderling, J. Chem. Phys., 2002, 117, 4126–4132 CrossRef.
- P. Bouř, Collect. Czech. Chem. Commun., 2005, 70, 1315–1340 CrossRef.
- A. Canales, J. Jiménez-Barbero and M. Martín-Pastor, Magn. Reson. Chem., 2012, 50, S80–S85 CrossRef CAS PubMed.
- M. E. Di Pietro, G. De Luca, G. Celebre, D. Merlet and C. Aroulanda, Mol. Cryst. Liq. Cryst., 2015, 614, 39–53 CrossRef CAS.
- Schrödinger Release 2022-1 ed., Schrödinger, LLC, New York, NY, 2022 Search PubMed.
- C. Lu, C. Wu, D. Ghoreishi, W. Chen, L. Wang, W. Damm, G. A. Ross, M. K. Dahlgren, E. Russell, C. D. Von Bargen, R. Abel, R. A. Friesner and E. D. Harder, J. Chem. Theory Comput., 2021, 17, 4291–4300 CrossRef CAS PubMed.
- R. A. Friesner, R. B. Murphy, M. P. Repasky, L. L. Frye, J. R. Greenwood, T. A. Halgren, P. C. Sanschagrin and D. T. Mainz, J. Med. Chem., 2006, 49, 6177–6196 CrossRef CAS PubMed.
- T. A. Halgren, R. B. Murphy, R. A. Friesner, H. S. Beard, L. L. Frye, W. T. Pollard and J. L. Banks, J. Med. Chem., 2004, 47, 1750–1759 CrossRef CAS PubMed.
- R. A. Friesner, J. L. Banks, R. B. Murphy, T. A. Halgren, J. J. Klicic, D. T. Mainz, M. P. Repasky, E. H. Knoll, M. Shelley, J. K. Perry, D. E. Shaw, P. Francis and P. S. Shenkin, J. Med. Chem., 2004, 47, 1739–1749 CrossRef CAS PubMed.
- Gaussian 16 Rev. C.01, Wallingford, CT, 2016 Search PubMed.
- C. Lee, W. Yang and R. G. Parr, Phys. Rev. B: Condens. Matter Mater. Phys., 1988, 37, 785–789 CrossRef CAS PubMed.
- A. D. Becke, J. Chem. Phys., 1993, 98, 5648–5652 CrossRef CAS.
- S. H. Vosko, L. Wilk and M. Nusair, Can. J. Phys., 1980, 58, 1200–1211 CrossRef CAS.
- P. J. Stephens, F. J. Devlin, C. F. Chabalowski and M. J. Frisch, J. Phys. Chem., 1994, 98, 11623–11627 CrossRef CAS.
- S. Grimme, J. Antony, S. Ehrlich and H. Krieg, J. Chem. Phys., 2010, 132, 154104 CrossRef PubMed.
- V. Barone and M. Cossi, J. Phys. Chem. A, 1998, 102, 1995–2001 CrossRef CAS.
- L. Benda, Z. Sochorová Vokáčová, M. Straka and V. Sychrovský, J. Phys. Chem. B, 2012, 116, 3823–3833 CrossRef CAS.
- J. Fukal, O. Páv, M. Buděšínský, I. Rosenberg, J. Šebera and V. Sychrovský, Phys. Chem. Chem. Phys., 2019, 21, 9924–9934 RSC.
- J. Fukal, O. Páv, M. Buděšínský, J. Šebera and V. Sychrovský, Phys. Chem. Chem. Phys., 2017, 19, 31830–31841 RSC.
- M. Cossi, N. Rega, G. Scalmani and V. Barone, J. Comput. Chem., 2003, 24, 669–681 CrossRef CAS PubMed.
- D. Comaniciu and P. Meer, IEEE Trans. Pattern Anal. Mach. Intell., 2002, 24, 603–619 CrossRef.
- T. Kalvoda, M. Culka, L. Rulíšek and E. Andris, J. Phys. Chem. B, 2022, 126, 5949–5958 CrossRef CAS.
- N. Godbout, D. Salahub, J. Andzelm and E. Wimmer, Can. J. Chem., 2011, 70, 560–571 CrossRef.
- T. Raček, O. Schindler, D. Toušek, V. Horský, K. Berka, J. Koča and R. Svobodová, Nucleic Acids Res., 2020, 48, W591–W596 CrossRef PubMed.
- W. J. Mortier, S. K. Ghosh and S. Shankar, J. Am. Chem. Soc., 1986, 108, 4315–4320 CrossRef CAS.
- S. Geidl, T. Bouchal, T. Raček, R. Svobodová Vařeková, V. Hejret, A. Křenek, R. Abagyan and J. Koča, J. Cheminformatics, 2015, 7, 59 CrossRef PubMed.
- M. Tichotová, T. Landovský, J. Lang, S. Jeziorowski, V. Schmidts, M. Kohout, M. Babor, P. Lhoták, C. M. Thiele and H. Dvořáková, J. Org. Chem., 2023 DOI:10.1021/acs.joc.2c02594.
- R. S. Stoll, M. V. Peters, A. Kuhn, S. Heiles, R. Goddard, M. Bühl, C. M. Thiele and S. Hecht, J. Am. Chem. Soc., 2009, 131, 357–367 CrossRef CAS PubMed.
Footnote |
| † Electronic supplementary information (ESI) available. CCDC 2277412–2277415. For ESI and crystallographic data in CIF or other electronic format see DOI: https://doi.org/10.1039/d3cp04099b |
| This journal is © the Owner Societies 2024 |