Towards hybrid quantum mechanical/molecular mechanical simulations of Li and Na intercalation in graphite – force field development and DFTB parametrisation†
Received
13th June 2023
, Accepted 14th December 2023
First published on 2nd January 2024
Abstract
In this work a previously established QM/MM simulation protocol for the treatment of solid-state interfaces was extended towards the treatment of layered bulk materials enabling for instance investigation of metal intercalation in graphitic carbon materials. In order to study the intercalation of Li in graphite, new density functional tight binding (DFTB) parameters for Li have been created. Molecular dynamics (MD) simulations at constant temperatures (273.15, 298.15 and 323.15 K) have been carried out to assess the performance of the presented DFTB MD simulation approach. The intercalation of variable lithium and sodium content was investigated via z-distribution functions and analysis of the diffusivity in the direction parallel to the graphene plane. Both the calculated diffusion coefficients and the activation energy in case of lithium are in good agreement with experimental data. The comparison of the QM/MM MD simulation results provide detailed insights into the structural and dynamical properties of intercalated metal ions.
1 Introduction
Since the first research on lithium batteries in the 1970s1,2 their energy storage capabilities were of high interest, due to the small specific weight of the metal known to display the lowest atomic number. Possible applications range from small batteries as developed in the early stages to larger energy carriers as for instance employed in modern electric vehicles (EVs).3–5 In addition, as climate change is rapidly progressing while globalisation faces increasing challenges, rechargeable batteries are largely considered as a potential replacement for fossile fuel-based energy economies. In the past decades research focusing on metal-ion batteries employing alternatives to lithium received increased interest. At the same time, the potential shortage6 in natural deposits is of pressing concern as the lithium supply will probably be depleted in several decades and the metal itself, due to its production, is not considered as sustainable.7 These factors make the search for potential alternatives obligatory. Potential replacement candidates, in combination with chemical systems featuring aromatic groups such as graphite and metal–organic frameworks are elements in close vicinity of lithium in the periodic table, with sodium being frequently discussed as promising ionic species for battery applications.8
However, graphitic intercalation of sodium is energetically unfavourable due to the absence of a partially covalent character in the carbon–sodium bond.9 To understand the nano-scale processes at the electrode where redox reactions take place, a theoretical treatment offers several advantages to exploring the exact interaction motifs of the metal-substrate complex. The geometry of the system significantly influences the reaction behaviour. A different position of a sodium ion bound to an aromatic group (e.g. in graphite or a metal–organic framework) as well as variations in the interionic distance, directly impacts the reaction kinetics and thus the electrode performance.
As experimental methods are only able to determine specific properties of a system, theoretical calculations are often employed to supplement experimental investigations. Understanding the chemical interactions in batteries at the molecular level potentially facilitates the design of alternative metal-ion batteries. Although, alkali-metal graphite interaction motifs have been previously studied,10–12 to the best of knowledge no combined quantum mechanical (QM) molecular dynamics (MD) simulations capable of describing the systems at elevated thermal conditions have been carried out. The latter provides detailed insight into system properties at a specific thermodynamic state point (e.g. constant temperature and pressure). Unfortunately, the computational demand required to investigate a sufficiently large simulation system is beyond the capabilities of even modern computational infrastructure. As they involve an explicit treatment of electrons in addition to the self-consistent field procedure, single-point calculations and geometry optimisations (employing e.g. Hartee Fock, Hybrid GGA DFT or MP2) for small molecular systems containing about 100 atoms is computationally manageable within a reasonable time frame. However, MD simulations require a sufficiently large system size (i.e. >500 atoms) in addition to several thousand to hundreds of thousands of MD time steps (i.e. single-point QM calculations) to enable a detailed analysis of the system properties. Especially the determination of diffusive properties requires particularly long sampling times since according to Einstein the diffusion coefficient has to be analysed in the long time limit. Thus, the combination of these different requirements being high accuracy in the description of interaction, the use of a sufficiently large simulation system and the requirement of long sampling times lead to the development of hybrid quantum mechanical/molecular mechanics (QM/MM) methods.
Hybrid QM/MM approaches are a well-established alternative to achieve an adequate compromise between accuracy and computational cost. Initially being focused on the treatment of biomacromolecular systems,13 in which classical force fields tend to fail in the description of complex interactions (such as protein coordination of a metal centre), the QM/MM framework was successfully extended to other research questions including solid-state chemistry.14–16 Typically, quantum mechanical methods, either HF-based methods such as perturbation-theory or density functional theory (DFT) achieve an accurate and efficient treatment of the target system.17,18 Previous adaptations of QM/MM methods for carbon-based solid-state systems have been proposed and adapted for carbon nanotubes19 and also for the calculations of properties of molecular crystals,20,21 but not involving a 2d-periodic QM/MM treatment. The latter has been employed in investigations of the surface structures of metallic beryllium and magnesium oxide14 at generalized-gradient approximated (GGA) DFT level employing inter alia pseudo atoms near the QM/MM interface. In calculations of surface structures, it is typically too expensive to include a sufficient number of layers to adequately represent the bulk of the solid. In particular, the exposure of the QM system at the opposite side of the target interface to a vacuum environment influences the properties of the QM system in a negative way.14 It could be established in the previous work that the inclusion of an MM-layer via partial charges (MgO) or pseudoatoms (Be) leads not only to a significantly improved description of the bulk material, but also enhances the accuracy of process occurring at the surface of the QM region. On the other hand, due to the unfavourable scaling of QM-based methods with the system size, a QM/MM setup is typically at least one order of magnitude faster compared to a similar all-QM treatment. Later, the outlined QM/MM framework was extended towards the application of the semi-empirical density functional tight binding (DFTB) approach in the treatment of R-TiO216 and α-Al2O322 surfaces.16 Due to the more efficient execution times of DFTB being a factor of 100 to 1000 faster than DFT methods, long simulation times of several hundred picoseconds up to the nanosecond scale could be achieved.
In this work the solid-state adapted QM/MM MD14 approach was extended to the treatment of layered carbon systems in combination with DFTB. The extension of two-dimensional systems in z-direction using additional (pseudo-)atoms or layers usually leads to a significantly better description of the overall system as the important regions to study are not directly exposed to a vacuum environment. In addition, considering an isolated treatment of the QM zone which in this framework corresponds to two graphene layers (i.e. bigraphene) and the metal in questions, artifacts resulting from the missing representation of a bulk system may arise. While QM/MM provides just an approximation, it is comparably inexpensive to add a significant amount of additional layers to provide an improved description of bulk graphite. The MD part of the presented application also benefits from an increased system size as oscillations in temperature are reduced upon increase in the total number of atoms. Thus, adding a significant amount of atoms to the MM region greatly improves the overall thermostatisation of the system and the diffusion analysis of intercalated compounds is much more reliable as an overall drift of the graphite system is reduced. In addition to this extension of the QM/MM MD approach, new DFTB parameters to include lithium in the 3ob set23 have been derived. To ensure a compatible treatment of the system in the QM and MM zone, new force field parameters for the treatment of the individual layers of graphite have been derived. This setup enables to compare the interactions of lithium in its neutral form with graphite against its Na-based counterpart.
2 Methods
2.1 QM/MM framework
As already mentioned in the introduction, the 2d-periodic QM/MM setup initially introduced for the treatment of magnesium oxide and beryllium at DFT level was adapted for graphitic systems. In particular, the system was divided into a QM and a MM zone based on the layered structure. As the binding motifs of the intercalated species are of interest, the QM zone consisted of two layers of graphite while six layers of MM graphite were added to stabilise the system geometry as depicted in Fig. 1. However, further prerequisites are necessary to achieve an accurate representation of the system: the interactions of the two alkali metals lithium and sodium with graphitic layers were modeled. While C–Na DFTB parameters are included in the 3ob set,23 no parameters for lithium were available. DFTB parameters always consist of several different contributions: single atom parameters such as on-site orbital energies and the associated Hubbard parameters and its derivatives, pair-wise orbital interactions stored in so-called Slater–Koster tables, and the repulsive potential typically represented via a suitable spline function. Both, the Slater–Koster table and the repulsive potential were newly created for the Li–C and Li–H interaction.
 |
| | Fig. 1 Side and top view of the employed periodic cell in the simulations of graphite intercalating a metal atom (red), QM atoms are rendered as spheres; to highlight the QM zone (blue), only the QM layers are shown in the top view. | |
Similar to previous approaches, the QM/MM interaction was realised with Morse potentials for the CQM–CMM pairs based on all atom QM calculations in analogy to the method used in the previous studies.24 However, the available force field parameters for aromatic carbon structures were not sufficiently compatible with the QM treatment. As this is a requirement by QM/MM frameworks in addition to the quantum mechanical treatment, new force field parameters were created, that represent the atomic interactions with increased accuracy. A dedicated force field was parametrised to achieve ideal compatibility between the QM and MM treatment as well as a consistent overall description of the system in terms of energy and the resulting forces. The bonded molecular mechanics (MM) potential employed in the QM/MM simulation can be mathematically represented by the following equation, (e.g. similar to the OPLS force field developed by Jorgensen et al.25):
| |  | (1) |
The separate terms to the intramolecular energy VintraMM of the atomic interactions are bond stretch, angle bending and dihedrals contributions. In addition, a Morse potential has been employed to achieve a proper description of the interlayer interaction:
| | | VinterMM = V0·(1 − e−α(r − r0))2 − V0 | (2) |
2.2 DFTB parametrisation of Li–Li, Li–C and Li–H
2.2.1 Slater–Koster tables.
The DFTB 3ob set23 features parameters for a large number of interactions, however no dedicated parameters for lithium are available. The term 3ob points towards a parameter set initially developed with a focus on organic and biomolecular systems employing density functional tight binding of 3rd order. The latter corresponds to a DFTB approach expressing the Kohn–Sham energy known from density functional theory via a 3rd order Taylor polynomial with respect to fluctuations in the equilibrium density.26 This formalism is also employed in the semi-empirical extended tight binding methods developed by Grimme et al.27 Although being developed in the context of (bio)organic chemistry, this DFTB parametrization proved surprisingly robust for a broad variety of system relevant in the regime of computational material sciences. Examples include the study of complex host–guest interactions in metal–organic frameworks28–31 as well as the binding of anthraquinone to graphene/graphite.32 These works provide a direct proof of concept that the applied SCC DFTB/3ob method is capable of treating solid-state systems including carbon-based layered materials. Following the parametrisation routine of the 3ob set23 whose Slater–Koster tables are based on a reference using the PBE33 functional, new lithium parameters were created. The required one-center parameters for lithium, namely the orbital eigenvalues for s- and p-shells and the Hubbard U parameter, which corresponds to the chemical hardness of the atom, were calculated using the hotcent program package.34 The respective missing Hubbard derivative was calculated via hotcent employing again the PBE33 functional. According to| |  | (3) |
with  being the orbital eigenvalues with respect to the occupation number n (high, and low) and Δn being the step length representing a change in occupation set to 0.01. The spin constant necessary for open-shell calculations was determined according to eqn (4). As for sodium in the 3ob set, only the spin constant for the ss-orbital orbital contribution has been calculated and is employed for ss, sp, sp and pp orbital interactions.35
| |  | (4) |
With the one-center parameters being available, the Slater–Koster table for the electronic part of the lithium–lithium interaction was created employing a quadratic confinement potential of the form
| |  | (5) |
as used in the creation of the 3ob set with
r0 being the radial confinement parameter. The fitting of the Li–Li SK tables employed the band structure of metallic lithium (space group number 229,
Im![[3 with combining macron]](https://www.rsc.org/images/entities/char_0033_0304.gif) m
m) calculated at PBE
33/POB-TZVP REV2
36 level using Crystal17.
37 Based on the resulting confinement parameters, the Slater–Koster tables for the lithium–carbon and the lithium–hydrogen interaction were created. The confinement parameters for C and H were taken from the literature, according to the 3ob set.
23
To ensure the implementation of the proper workflow in hotcent, the Hubbard derivatives of sodium and potassium were calculated and compared to the values reported for the 3ob set. Similarly, to ensure that the electronic part of the created Li–H–C interactions are compatible with the 3ob set, the C–C Slater–Koster table was recreated using the hotcent program package,34i.e. the assessment of the PBE functional as implemented in the hotcent program yields the same data as obtained via the PBE calculations in the original parametrisation of the 3ob set.
2.2.2 DFTB repulsive potentials.
The repulsive contributions to the of Li–Li, Li–C and Li–H interactions were fitted to data of MP238/cc-pVTZ39 potential energy scans near the equilibrium distance carried out with Gaussian16.40 The MP2 level represents a highly suitable compromise between accuracy and computational efficiency for small molecules. Fitting of the interactions to the reference systems and data was then carried out with the tango program package41 interfaced to the DFTB+ program.42 The default parameters were employed, except for the force scaling factor of the Li–C interaction which was slightly increased to a value of 0.021 to achieve a sufficient distance between a Li0 atom and the center of a coronene molecule. The scaling factor was empirically derived via a scan, as the distance between the lithium atom interacting with the coronene molecule was of particular relevance for this setup. While for the Li–Li and Li–H interactions this was procedure carried out by scanning the distance between two atoms of either species pair, the Li–C repulsive interaction was derived from a scan of methyllithium in which the distance between lithium and the methyl residue was varied in analogy to the parametrisation of the Na–C repulsive potential in the 3ob set.35 The latter explains why the parametrisation of the Li–H interaction was required for this study as well, although no H-atom is present in the target metal-graphite system treated in the QM/MM MD simulations.
2.3 DFTB derived force-field parameters
Orthorombised graphene supercells (the initial structure was taken from ICSD number 215149443 and optimised at SCC DFTB/3ob/D3 level) with either a single or dual carbon layer residing inside the unit cell served as reference for the parametrisation of the carbon–carbon interaction. While the interactions regarding bonds, angles and dihedrals in the created force fields are described by harmonic potentials, the complex interlayer interaction as well as the metal–carbon contributions are modeled by a Morse-potential. The parametrisation of C–Li0 and C–Na0 was carried out employing graphene flakes (C96H24) with an approximate radius of 9 Å (see Fig. S7, ESI†). The force field parameter fitting procedure was carried out by employing geometries from the quantum-mechanical calculations and generating the potential energy curves fitting the reference data. Initial guess parameters for the respective interactions were employed and then iteratively optimised to resemble the potential energy scans. Following the parametrisation of the C–C bond, the angle potential was adjusted. In the final step the dihedral potential was determined by employing the parameters of the bond and angle potentials.
The graphene reference calculations for intramolecular carbon–carbon interactions were carried out using the DFTB+ program package42 employing the 3ob parameter set under periodic boundary conditions with a Monkhorst–Pack sampling based on a 2 × 2 × 2 (kmax = 2) extension. As the interlayer interaction of graphite is of highly dispersive character, the DFTD3 dispersion correction44 developed by Grimme et al. was applied. The carbon–carbon interaction potentials for bonds, angles and dihedrals were parametrised based on a number of potential energy scans of an orthorombised and optimised 12 × 12 graphene supercell containing a total of 288 atoms (a = 29.663 Å, b′ = 25.688 Å, γ = 90°, see Fig. S2, ESI†).
Bonds.
Equally varying the size of the lattice constants a and b′ at constant angle γ leaves angles and dihedrals of the system unaffected and only modifies the bond length of carbon–carbon pairs. The potential energy scan was performed via individual single-point calculations in which the cell parameters a and b′ as well as the particle positions were varied in the range from 95 to 105% in 1% increments.
Angles.
The parametrisation of the potential describing the C–C–C angles in graphene was achieved by shifting half of the atoms in the unit cell by 0.5 Å in 0.1 Å increments along the b′ direction. As C–C bonds are affected by the scan as well, the respective contributions arising due to bond stretch have to be subtracted prior to the fitting of the angle potential.
Dihedrals.
Following the parametrisation of the bond and angle interactions, the dihedral potential can be derived in a similar manner. In this case all atoms in the graphene sheet were moved out of plane by 0.5 Å in 0.1 Å steps above and below in an alternating way. The resulting geometries served as input for single point calculations to assess the reference energy of the system. Since in this new geometry the bond distances and the angles are varied as well, the respective contributions have again been subtracted prior to the fitting.
Interlayer distance.
To model the interlayer potential two graphene layers were included in the orthorombic 12 × 12 supercell in a stacked configuration resulting in a total of 576 atoms. After optimisation, a scan of the interlayer distance in the range of −1.0 Å to 7.0 Å relative to the equilibrium distance was carried out.
Carbon–lithium and carbon–sodium interaction.
The parametrisation of the carbon–lithium and carbon–sodium interactions was carried out by scanning the distance of the respective metal atom in its neutral form over the center of a n-coronene flake. To achieve a long-range interaction through multiple graphene layers for a sufficient energy contribution the scan ranged from −1.0 Å to 8.0 Å with 0.1 Å increments relative to the equilibrium distance. In case of Li, the DFTB parameters derived in this work have been applied. A Morse-potential was employed to fit the single-point energies of the distance scan to achieve a proper description of the carbon–metal interaction.
2.4 QM/MM layer interaction
To achieve a consistent description including the correct modelling of the interlayer distance and layer-interactions, the created interlayer potential was applied to all layers in the system except for the QM–QM layer pair. The QM/MM method is additive, so the total potential Vtot is given as:| | | Vtot = VQM + VMM + VQM/MM | (6) |
with VQM being the result from the respective treatment of the periodic QM subsystem (in this work SCC DFTB), VMM results from the application of the various bond, angle, dihedral and Morse potential terms derived in this work. Since the individual layers of the graphite structures are either included into the QM and MM zones as a whole, the interaction between QM layer and the respective metal atom with atoms located in the MM layers, VQM/MM is only comprised of the respective Morse contributions for the CMM–CQM and CMM–metal interactions derived in this work. Since no atoms may change from the QM to the MM zone and no covalent bonds are cleaved by the QM/MM interface, no special treatment for these situations has to be considered. As a consequence, the forces acting on a particular atom are simply those resulting from the derivative of the total potential energy Vtot.
2.5 DFTB/MM MD simulations
All simulations were carried out in the QMCFC program16,22,45 interfaced to DFTB+ in the canonical (NVT) ensemble. Calculations of energies and forces were carried out under 2d-periodic boundary conditions employing the 3ob parameter set23 in combination with the newly created parameters for the Li–C and Li–Li interactions. The D3 dispersion correction scheme based on Becke-Johnson damping developed by Grimme was applied44 as required by the 3ob set.23 Monkhorst–Pack sampling was performed considering only the Γ point for the systems subject to a periodic QM treatment as all critical interactions are taken into account in real space, while the reciprocal space part can be kept to a minimum. To integrate the equations of motion, the velocity-Verlet algorithm was employed. As the systems do not feature any hydrogen atoms an increased MD time step of 2.0 fs could be applied. The system temperatures were adjusted to 273 K, 298 K and 323 K employing the Nosé–Hoover thermostat for the determination of the Einstein diffusion coefficients and associated activation energies of the alkali metal atoms near standard conditions.
Graphitic intercalation of monovalent ions.
An xy-periodic graphite-derived system containing eight graphene layers, each containing 288 atoms, was used. Six of the layers only contained carbon atoms considered as MM particles, while two layers were treated via quantum mechanical methods to enable electronic interactions between the metal atoms and the graphite system. Nine simulations were carried out for either metallic species to compare the systems interactions in dependence of the number of intercalated atoms. In addition, a simulation of the neat graphite system employing the same parameters was executed to serve as reference system. Furthermore, the deformation of the layers and the distance between the fully QM treated layers was analysed via pair distribution functions to assess the influence of the intercalation on the layer distance. In addition, atomic charges of the intercalated atoms were monitored along the simulation time to determine the influence of either species and the number of metal atoms in the system on the charge distribution.
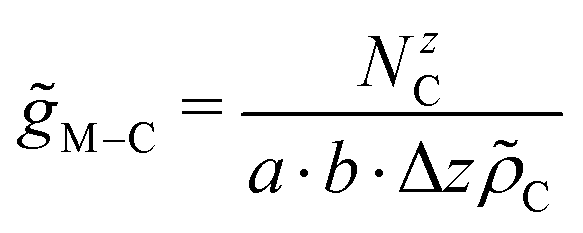
2.6 Calculation of Z-distance distributions
The distributions of C-atoms relative to the metal M along the non-periodic direction (i.e. z-axis) were probed via distance distribution functions46 using increments Δz of 0.01 Å. The associated number of C-atoms NzC were then normalised based on the volume of the respective histogram bin and the number density of the C-atoms ![[small rho, Greek, tilde]](https://www.rsc.org/images/entities/i_char_e0e4.gif) C.
C.| |  | (7) |
2.7 Calculation of vibrational power spectra
Vibrational spectra can be derived from the simulation trajectory via the Fourier transform of the respective velocity auto-correlation function (VACF)46:| |  | (8) |
where v0 and vt are the velocities of the system at the time origin and at time t, respectively. A correlation window of 0.5 ps in combination with an exponential window function employing a decay constant of 4.0 ps−1 in the Fourier transformation proved sufficient to determine the respective power spectra.
2.8 Calculation of diffusion coefficients and activation energy
The diffusion coefficient of the alkali metals was calculated via the Einstein relation:47| | 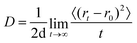 | (9) |
where r0 and rt are the position of the metal atom at the time origin and at time t, respectively, and d corresponds to the dimensionality of the system (in this case d = 2). The correlation window was set to 5 ps. The diffusion coefficient D is determined via a linear regression of the last 2 ps of the correlation window. The activation energies can be subsequently determined via the Arrhenius dependence of the diffusion coefficient| |  | (10) |
where EA is the activation energy, R the molar gas constant, T the temperature and D0 the pre-exponential factor.
3 Results
3.1 Slater–Koster table creation of Li–Li, Li–C and Li–H
The creation of the Slater–Koster tables for the homonuclear Li–Li and the heteronuclear Li–C and Li–H interaction was carried out based on the workflow outlined by Van den Bossche et al. using the program hotcent.34 The confinement parameters for C and H were taken from the literature as given in the 3ob set23 while those of Li were newly determined in this work. To ensure the compatibility of the parametrisation, the Slater–Koster table of the C–C interaction of the 3ob set23 was recreated employing the published confinement parameters (see Fig. S1 in the ESI†). Similarly, the Hubbard derivatives of sodium and potassium were successfully recreated (see Table S1, ESI†).
First, the Li–Li Slater–Koster tables were parametrised employing the band structure of crystalline lithium determined at PBE/POB-TZVP REV2 level as reference yielding also two distinct parameters for the orbital and wave function confinement (see Table 1). Knowledge of the latter enabled the construction of the Li–C and Li–H Slater–Koster tables.
Table 1 Parameters for one-center properties and the confinement for the creation of the lithium–lithium Slater–Koster table to fit into the DFTB 3ob set
| DFTB conf. |
Bohr |
|
r
0,orb
|
3.936 |
|
r
0,wf
|
8.559 |
| DFTB prop. |
Hartree |

|
−0.10570 |

|
−0.04000 |
|
U
|
0.17660 |
|
U
d
|
−0.04574 |
|
W
A,ss
|
−0.00965 |
3.2 Fitting the repulsive interactions of Li–Li, Li–C and Li–H
Reference potential energy scans at MP2/cc-pVTZ level of theory considering the Li–Li and Li–H atoms pairs were carried out. In case of carbon and lithium the Li–C distance in the molecule methyllithium was varied. The fitting procedure was then carried out using the program tango41 requiring the previously constructed Slater–Koster tables as input. The resulting interactions were then validated in test calculations considering methyllithium as well as Li0 over the central ring of a coronene molecule. In both cases energy minimisations of the respective structures using the newly generated parametrisations yielded data well within the range expected for DFTB calculations (see Table S2, ESI†).
3.3 Force field parametrisation
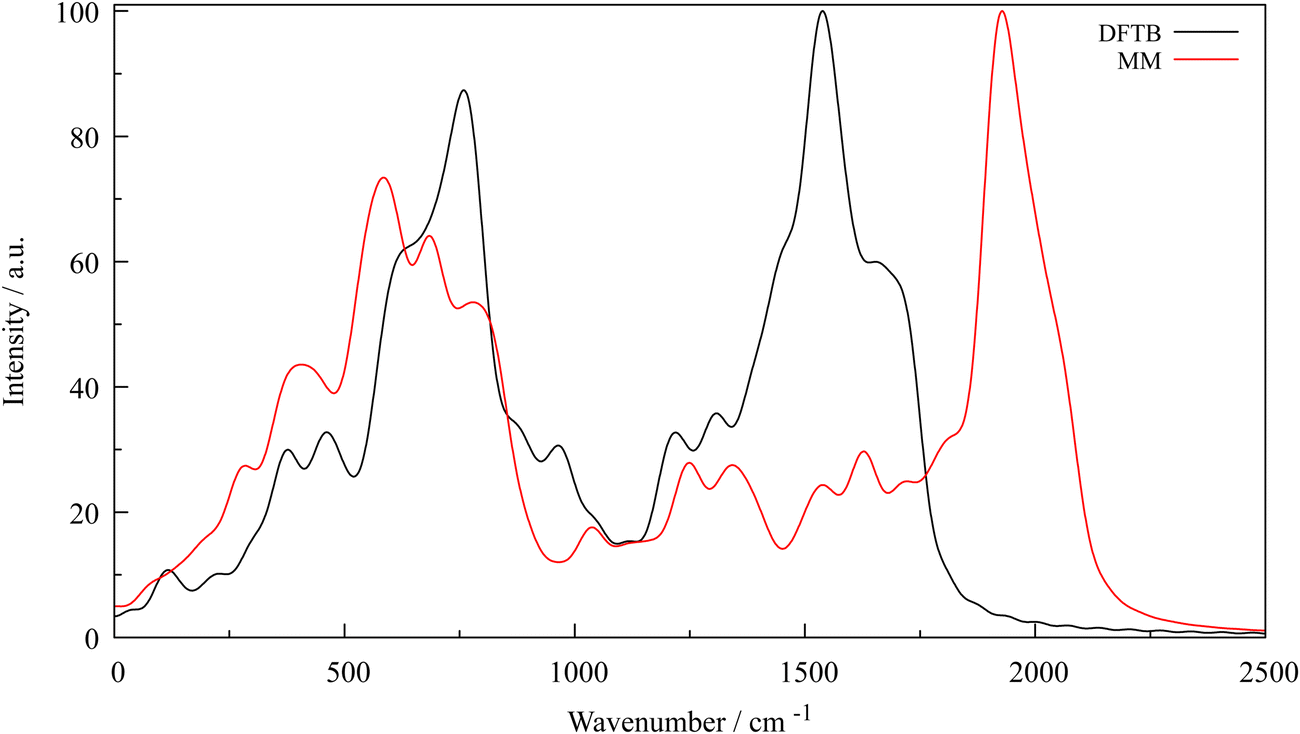
Carbon–carbon interaction potentials for bonds, angles and dihedrals were parametrised by employing a series of potential energy scans of an orthorombised and optimised 12 × 12 graphene supercell containing 288 atoms (a = 29.663 Å, b′ = 25.688 Å, γ = 90°, see Fig. S2, ESI†). Results of the respective scans, fitted harmonic force field potentials and C–metal Morse potentials are listed in Table 2. The potentials of the interlayer and the carbon–metal interactions are depicted in Fig. S6, S8 and S9 (ESI†). Visualisations of the respective scan setup are shown in Fig. S7 (ESI†). The two generated power spectra generated via the VACF from the trajectories of single-layer systems containing 288 carbon atoms of the reference DFTB and MM simulations are shown in Fig. 2. Both vibrational spectra feature similar wave numbers by trend except for the band at approx. 2000 cm−1 and also intensities differ, but the overall shape of the spectrum until the wave number about 1750 cm−1 is reproduced sufficiently. The band calculated from the MM trajectory is probably due to an overestimation generated by approximations made in the molecular mechanics treatment of the system. An improvement might be the application of additional terms like van der Waals-like intralayer contributions to C–C atoms at large distances. However, the parametrisation of such additional terms is challenging owing to the inseparability of bond stretch and intralayer van der Waals contributions. Due to this shortcoming, their inclusion was omitted in this work. Furthermore, calculated intensities of a power spectrum should be interpreted with care as their values are rather arbitrary (due to the applied Fourier transform) and only simulations of single layer systems were carried out, fully neglecting layer-layer interactions which can be expected to further alter the shape of the vibrational spectra. Since in force fields bonded contributions are considered to be highly local, a single layer is sufficient to derive adequate potential parameters that provide an accurate structural representation of the system.
Table 2 AMBER gaff/gaff2 force field parameters for aromatic carbons compared to parameters obtained using the newly created DFTB/3ob associated set (see eqn (1) in the text). In case of the dihedral potential the frequency factor n is set to 2 in all cases
| Parameter/interaction |
Amber (gaff/gaff2) |
| Force constant |
Equlibrium value |
| Bonds |
461.1/378.6 kcal mol−1 Å−2 |
1.3980/1.3984 Å |
| Angles |
66.6/68.8 kcal mol−1 rad−2 |
120.02° |
| Dihedrals (ca-ca-ca-c2) |
1.1 kcal mol−1 |
180.0° |
| Parameter/interaction |
Force field with DFTB/3ob reference |
| Force constant |
Equilibrium value |
| Bonds |
603.2 kcal mol−1 Å−2 |
1.42715 Å |
| Angles |
42.8 kcal mol−1 rad−2 |
120.0° |
| Dihedrals |
1.29 kcal mol−1 |
180.0° |
| Parameter/interaction |
Morse Potentials with DFTB/3ob reference |
|
D (kcal mol−1) |
α (Å−1) |
Equilibrium value (Å) |
| Li–C |
2.49 |
−2.84 |
2.75 |
| Na–C |
2.01 |
−1.75 |
2.83 |
 |
| | Fig. 2 Vibrational power spectrum calculated from the velocities of the simulation trajectories, DFTB (black) and MM (red); intensities were normalised to a value of 100. | |
3.4 QM/MM MD simulations
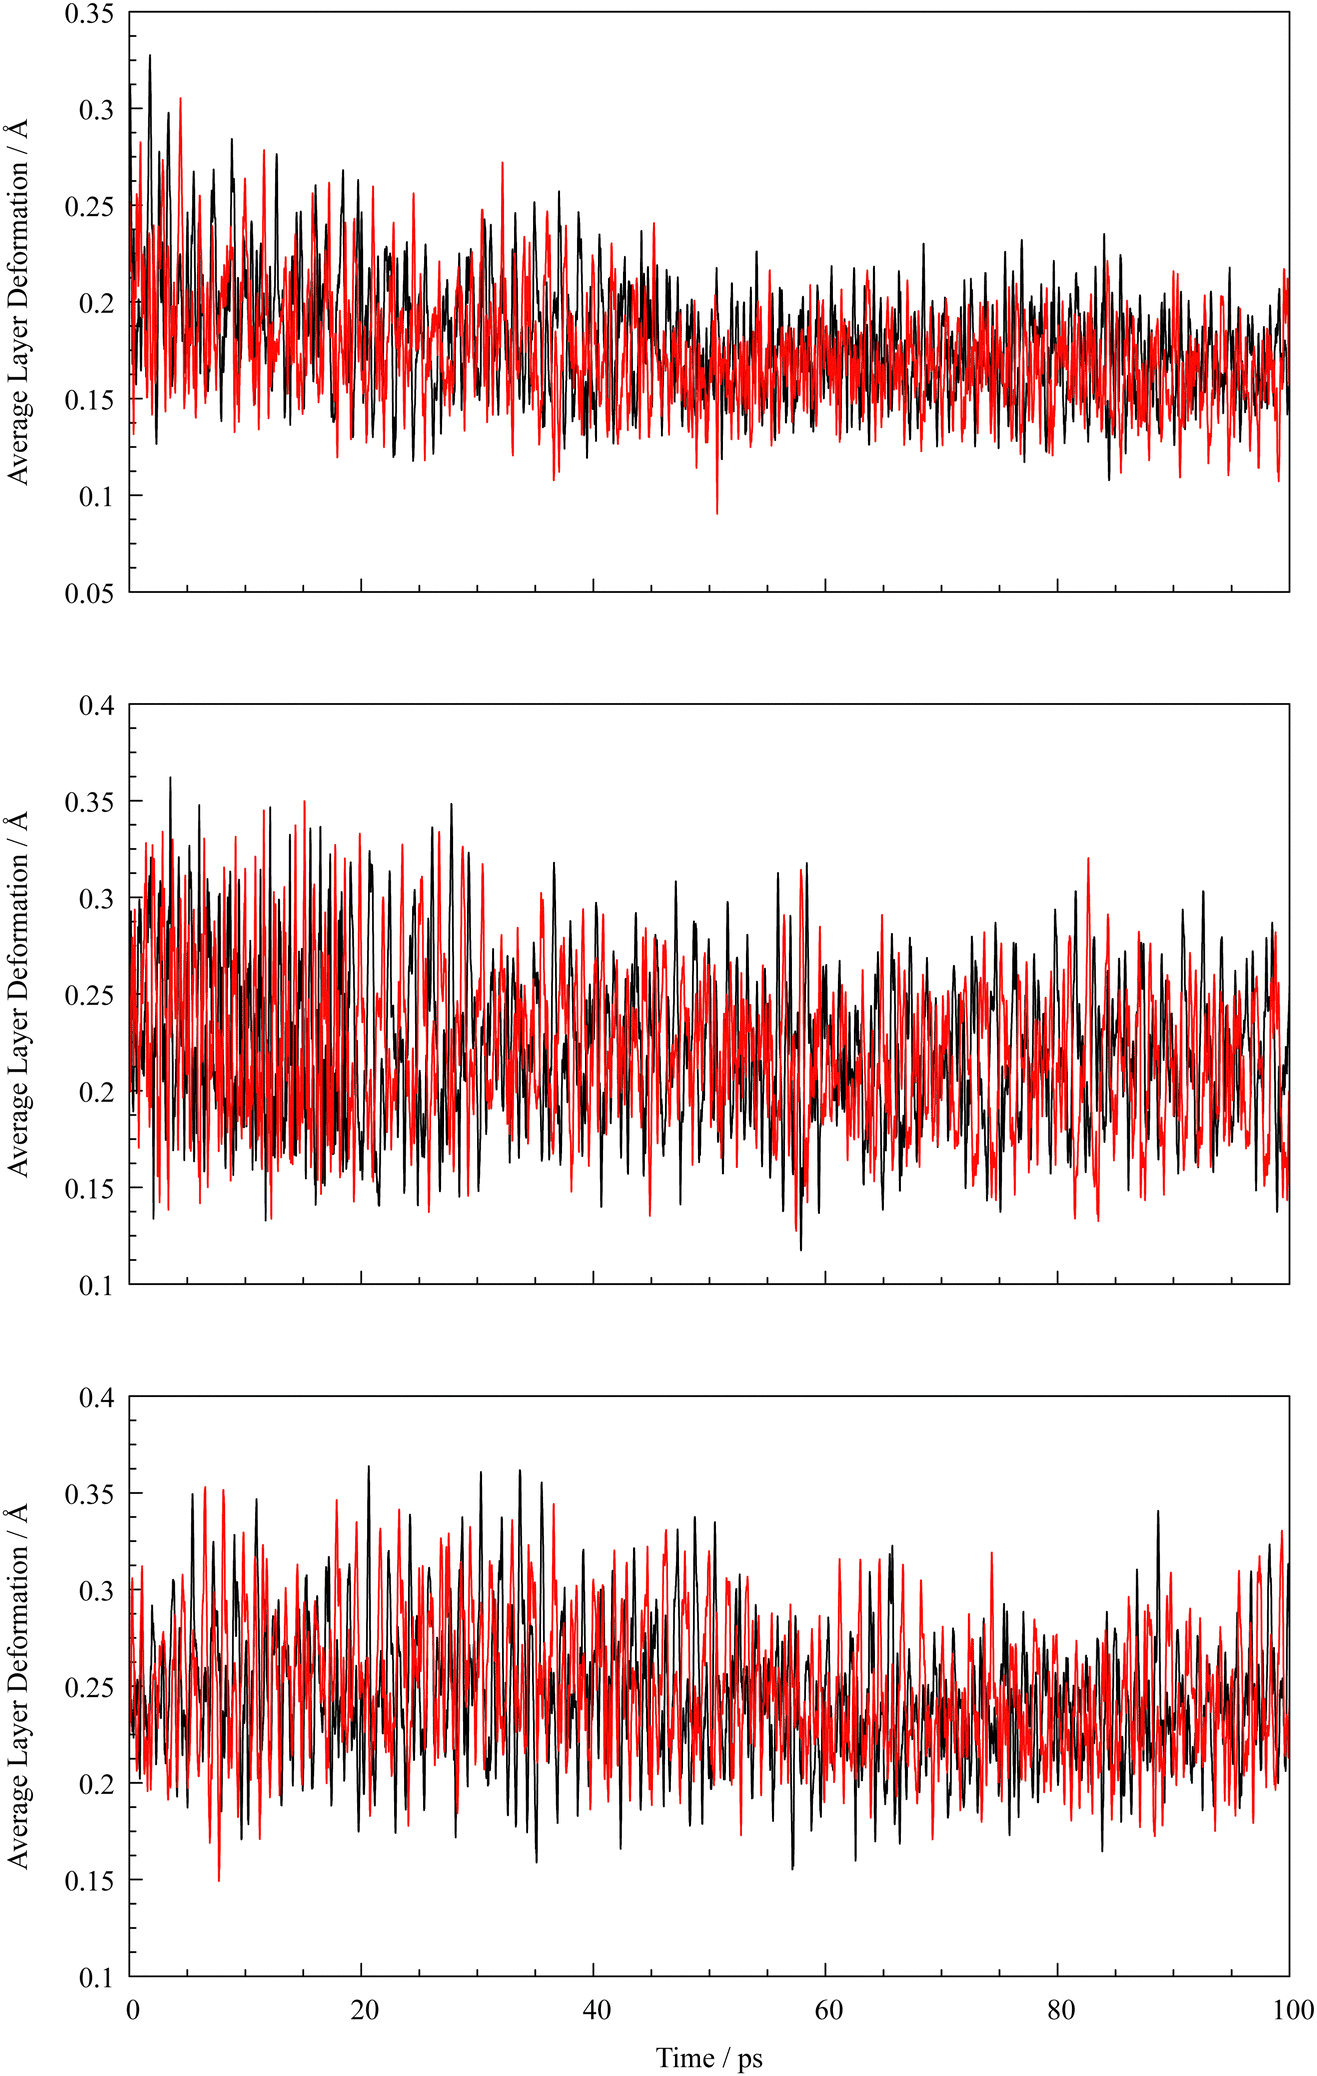
The QM/MM treated graphene system is depicted in Fig. 1, with highlighted QM zone (blue) intercalating a metal atom. Note that the treatment of system was only 2d-periodic, which was achieved by setting the value of the cell parameter in z-direction to 100 Å. After an initial equilibration phase the metal atoms reside between the QM treated graphene layers and oscillate slightly above the centers of the aromatic ring system. An A–A layer stacking motif seems to be enforced by the interaction of the atoms with the aromatic system, as this structure is favoured by Coulombs law as the aromatic ring systems attract the electron density of the additional atoms. Also, a slight deformation of the layers closest to the metal atom is observed, the QM graphene layers and thus the MM layers are bulged by the presence of either one, two or four metal atoms. The more atoms are added between the QM layers, the stronger the deformation of the adjacent layers and thus the shape changes of the MM layers proportionally. Each intercalation leads to similar bulging of the layer as well as the A–A stacking motifs of the graphene layers, which is also supported by the pair distribution functions depicted in Fig. S14 and S15 (ESI†). The respective maximum and average graphene plane deformations from the average coordinates of the plane over the simulations at 298 K are depicted in Fig. 3 and 4, while the maximum layer deformations are depicted in Fig. S16 and S17 of the ESI.† It can be seen that after an initial equilibration phase both average and maximum deformation converge to a value dependent on the interlayer loading of metal atoms. The intercalation of two atoms leads to the strongest deformation plane as a smaller part is deformed by the intercalation in comparison to the system with four intercalated atoms. As more of the graphene plane is deformed, the average coordinate shifts accordingly and thus both average and maximum deformation decrease relative to the average plane.
 |
| | Fig. 3 Graphene plane deformations over time of the individual QM layers (black and red) intercalating one (top), two (center) and four (bottom) lithium atoms. | |
 |
| | Fig. 4 Graphene plane deformations over time of the individual QM layers (black and red) intercalating one (top), two (center) and four (bottom) sodium atoms. | |
In Table S3 (ESI†) the average atomic charges of the metal atoms with respect to the number of intercalated atoms over the simulation time are listed. The sodium atom charges are slightly higher (≈0.65 e) than the respective values of lithium (≈0.54 e) which is in agreement with their position on the electronegativity scale. Also a change of individual atom charges in dependence of interlayer occupation is observed. While the single lithium atom features an average charge of 0.535 e the two lithium atoms only carry on average a positive charge of approx 0.525 e. When four lithium atoms are intercalated an average value of 0.535 e is observed. This might be a result of the carbon layer being able to delocalize specific amounts of charge provided by additional atoms more well into the layer structure. In addition, the dimerisation of two lithium atoms did lead to marginally lower charges of the atomic species.
In case of sodium, the atomic charges do not increase but remained largely unaffected upon increased occupation. One and two sodium atoms interacting with the graphene layers carry an average charge of approx. 0.65 e while four intercalated atoms only carry a charge of approx. 0.64 e. The values observed in case of 298 K in the two-atomic case deviate from the other two respective values is the result of sodium dimerisation observed during the simulation leading to marginally lower charges. This is also observed in case of the intercalation of four sodium atoms, where a lower average charge is present in the simulation at 323 K.
The analysis of the trajectories employing z-distance distribution functions (ZDFs) in dependence of the interlayer occupation are depicted in Fig. S14 and S15 (ESI†). As mentioned above, the more atoms reside between the graphene layers, the more the shape of the ZDFs change. The more lithium atoms in the system, the larger the shift of the peaks to higher values and even the outermost MM layers are influenced by the intercalated atoms (that are at a distance of approx. 11 to 12 Å). The shifting is in the range from 0.04 Å in both Na and Li single atom to dual intercalation case and 0.11 Å (Li) and 0.12 Å (Na) from two to four intercalated atoms. This is also visible in the snapshot of a frame from the simulation trajectory of the system depicted in Fig. 1. While the intercalation of one lithium atom leads to almost symmetrical Gaussian-shaped peaks with only small fronting shoulders, the peaks are not only broadened by addition of Li atoms but also shifted to higher distances and also slightly split. This effect is strongly pronounced in the ZDF of the simulation with four lithium atoms as the first ZDF maximum is more broadened and even split into two peaks. When comparing the Li–C ZDFs with the respective ZDFs of sodium and carbon, two distinct differences were observed. Firstly, the peak broadening of the ZDF does not occur to the same extent, the peaks are more narrow and Gaussian-like and do not or only slightly feature fronting. Secondly, the shifting observed in the lithium case is also not as strongly present, the peaks are only shifted to slightly higher values, which suggests the influence of the sodium atom is weaker than that of its Li counterpart.
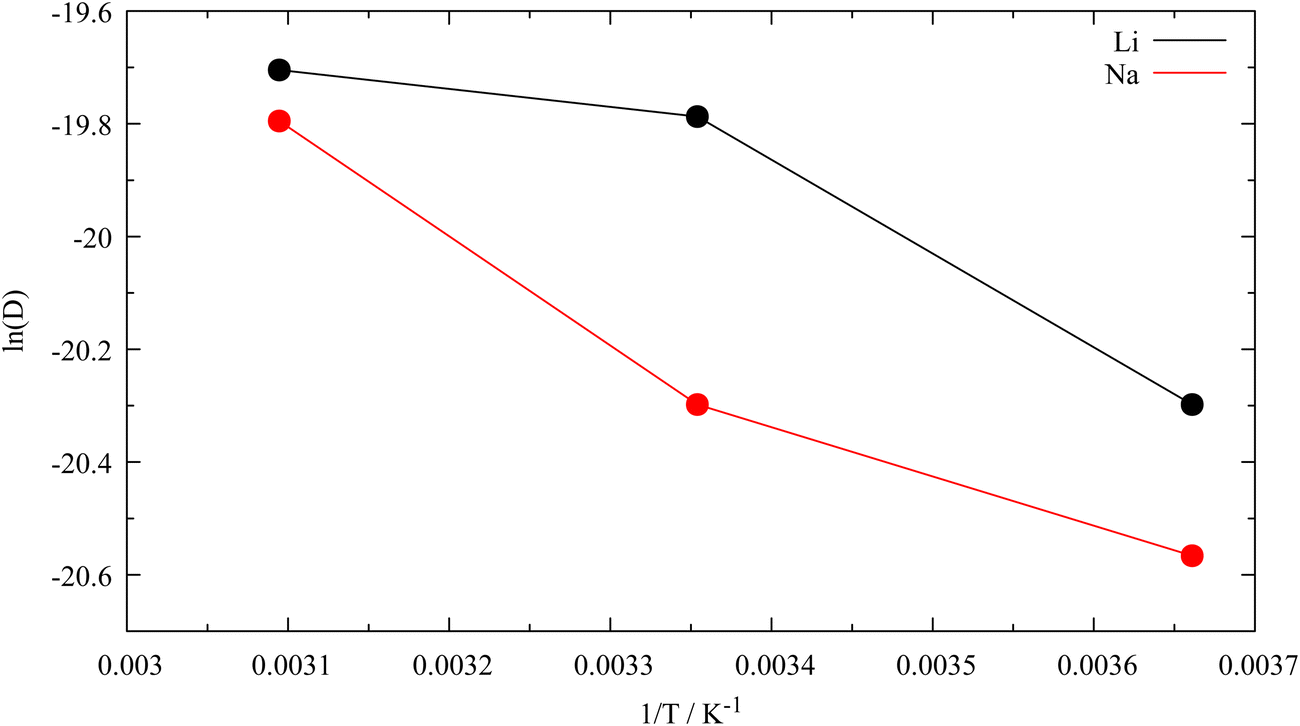
The determined diffusion coefficients and associated activation energies calculated via the Einstein relation and the Arrhenius dependence of the systems containing a single alkali metal atom are listed in Table 3 and shown in Fig. 5. Although at first sight, the temperature dependency of the logarithmic diffusion coefficients may appear nonlinear, the associated coefficients of determination (R2) obtained from the linear regression, namely 0.88 and 0.95 for Li and Na, respectively, are satisfactory. These simulation results provide clear evidence that the outlined parametrisation of the lithium–carbon interaction along with the respective force field description of the graphite layers enables the investigation of intercalation properties. The presented data has to be regarded as a proof of concept and it can be expected that future detailed investigations (i.e. carrying out simulations at more different temperatures and statistical evaluation of associated data) based on this methodology will provide detailed insight into the diffusive properties of metal intercalation. Due to the clustering and thus the probably inhibited intralayer diffusion of the clustered metal atom pairs the diffusion coefficient and thus the activation energies were not determined for the simulations considering higher loadings. This clustering was recently observed in other works focused on agglomeration of lithium atoms in graphitic systems48 and was reproduced in the simulations. Associated data describing the metal–metal distances over the simulation trajectories are depicted in Fig. S10–S13 (ESI†). As a slight drift of the QM-layers was observed, geometries of both layers throughout the simulation were projected in the initial system geometry of the simulation, so that the movement of the metal atom and the MM layers resulted in relative motion to QM layers. The reason for the drift probably is a result of the perfect crystalline structure of the graphite system and the possibility of individual layers to move along the periodic directions, which is not possible in an experimental setup. Re-projection of the QM-layers and subsequent analysis of the new trajectory lead to massive improvement of the results of diffusion coefficients and activation energies, as the layer drift had a non-negligible influence on the position of the metal atom and thus on the associated diffusion coefficient with values ranging from 1.5 × 10⁻⁵ to 2.8 × 10⁻⁵ cm2 s−1 for lithium and 1.2 × 10⁻⁵ to 2.5 × 10⁻⁵ cm2 s−1 for sodium, respectively. The associated activation energies feature values of 90 meV in case of lithium and 110 meV for sodium. Values taken from the literature suggest a range of ∼10−7 to 10−5 cm2 s−1 for the diffusion coefficient of lithium parallel to the planes in graphitic carbon49–53 and 270 meV for C6Li and 170 meV for C12Li dependent on the composition49 and 160 meV for basal surface plane migration for Li0.2–0.3C.50 Values for both properties were estimated for temperatures from 300–310 K. Reference data for the sodium diffusion parallel to graphene planes are not available, which would be of interest for this study. However, the experimental data suggests a trend of decreasing activation energies dependent on the composition. Considering that only one lithium or sodium atom is present in either layer system, the calculated diffusion coefficients and activation energies are well within the expected range.
Table 3 Diffusion coefficients of the alkali metal atoms calculated via the Einstein relation and associated activation energies
|
|
T/K |
D
xy
/cm2 s−1 |
E
A/eV |
| Li |
273.15 |
1.53 × 10⁻⁵ |
0.0915 |
| 298.15 |
2.55 × 10⁻⁵ |
| 323.15 |
2.77 × 10⁻⁵ |
|
|
| Na |
273.15 |
1.17 × 10⁻⁵ |
0.116 |
| 298.15 |
1.53 × 10⁻⁵ |
| 323.15 |
2.53 × 10⁻⁵ |
 |
| | Fig. 5 Arrhenius plot of the Li and Na diffusion coefficients in graphite (D in cm2 s−1). | |
Considering that the parameters of the 3ob set23 were created for the treatment of non-periodic organic and bioorganic systems, the data obtained for Li and Na in graphitic carbon are surprisingly robust. In addition the results are highly reliant on the respective parametrisation and the electronic part i.e. the Slater–Koster table of the parameters were created with the GGA functional PBE not considering exact Hartree Fock exchange contributions which might also be of importance as outlined by Becke54 in these kind of interactions. Furthermore, the treated model systems feature ideal crystalline geometries, i.e. no defects, or doping of the graphene layer were taken into account, which might also be of importance to improve the agreement with respect to experimental measurements. Non-ideal structural elements such as grain boundaries or point-defects can be expected to provide further detailed information about the properties of graphite-intercalated systems at the atomic level as key properties such as diffusion are strongly dependent on the structural environment which has also been observed experimentally.51
4 Conclusion
In this work, a novel 2d-periodic QM/MM simulation protocol was derived for a class of solid-state systems, enabling time-efficient and accurate investigation of graphene/graphite-like or graphene-derived materials. Even modified graphene systems are accessible with this approach, only limited by the parameters available in the respective DFTB parameters. In this work the 3ob set was extended by newly created parameters for lithium. The comparison of z-distribution functions derived for variable amounts of loading of lithium and sodium in a graphite model system provide manifold data about the structural properties from an atomistic perspective. The calculated properties such as the diffusion coefficient of lithium in graphite are found well within the range of the results of experimental methods and serve as a benchmark of both the provided DFTB parameters and the force field parametrisations. Only a limited number of model systems were shown in this work, but this setup can be easily adapted to other systems. Furthermore, access to defective and substituted systems, e.g. impurities, which are of particular interest, in QM zones are provided.
The simulations of Li- and Na-intercalation in graphitic carbon only provides a first step towards a more detailed understanding of charge storage in these kind of materials. A much more intricate but at the same time more challenging question is the behaviour of the ionic forms of Li+ and Na+ intercalated between the respective layers. However, due to the requirement of charge neutrality in a periodic QM treatment the consideration of ions in the QM zone will require further development of the applied QM/MM methodology. While a neutralising plasma environment compensating the net charge of the QM system might provide an easy-to-implement approach to consider ions in the periodic QM zone, most literature advices against such a treatment for accuracy reasons. An alternative to a fully periodic QM setup is to include only a subset of atoms of a specific layer into the QM zone. This, however, results in bonds cleaved by the QM/MM interface. While suitable approaches to deal with these so-called QM/MM frontier bonds have been formulated, they are typical focused on (bio)organic systems and need to be adjusted prior to applications in solid-state systems which is the focus of ongoing research activities.
In addition to these aspect regarding the development of novel QM/MM frameworks, the DFTB parameter set for Li–Li, Li–C and Li–H interactions will proof highly beneficial for research related to energy storage applications. It should stressed, however, that due to the semi-empirical nature of DFTB methods, the performance of a specific parametrization should always be assessed against high level QM calculations at ab initio and DFT level prior to the application in an actual study.
Conflicts of interest
There are no conflicts to declare.
Acknowledgements
The computational results presented have been achieved (in part) using the HPC infrastructure of the University of Innsbruck.
References
- J. Besenhard and H. Fritz, J. Electroanal. Chem., 1974, 53, 329–333 CrossRef CAS.
- J. Besenhard, Carbon, 1976, 14, 111–115 CrossRef CAS.
- X. Zeng, M. Li, D. A. El-Hady, W. Alshitari, A. S. Al-Bogami, J. Lu and K. Amine, Adv. Energy Mater., 2019, 9, 1900161 CrossRef.
- A. Eftekhari, ACS Sustainable Chem. Eng., 2019, 7, 5602–5613 CrossRef CAS.
- J. Speirs, M. Contestabile, Y. Houari and R. Gross, Renew. Sustainable Energy Rev., 2014, 35, 183–193 CrossRef.
- T. P. Narins, Extr. Ind. Soc., 2017, 4, 321–328 Search PubMed.
- B. Jerez, I. Garcés and R. Torres, Polit. Geogr., 2021, 87, 102382 CrossRef.
- C. Delmas, Adv. Energy Mater., 2018, 8, 1703137 CrossRef.
- H. Moriwake, A. Kuwabara, C. A. J. Fisher and Y. Ikuhara, RSC Adv., 2017, 7, 36550–36554 RSC.
- C. Panosetti, S. B. Annies, C. Grosu, S. Seidlmayer and C. Scheurer, J. Phys. Chem. A, 2021, 125, 691–699 CrossRef CAS PubMed.
- D.-M. Kim, S. C. Jung, S. Ha, Y. Kim, Y. Park, J. H. Ryu, Y.-K. Han and K. T. Lee, Chem. Mater., 2018, 30, 3199–3203 CrossRef CAS.
- J. Park, Z.-L. Xu and K. Kang, Front. Chem., 2020, 8 Search PubMed.
- M. Hitzenberger, M. Ratanasak, V. Parasuk and T. S. Hofer, Theor. Chem. Acc., 2016, 135 Search PubMed.
- T. S. Hofer and A. O. Tirler, J. Chem. Theory Comput., 2015, 11, 5873–5887 CrossRef CAS PubMed.
- N. Prasetyo and T. S. Hofer, Comput. Mater. Sci., 2019, 164, 195–204 CrossRef CAS.
- M. Saleh and T. S. Hofer, J. Phys. Chem. C, 2019, 123, 7230–7245 CrossRef CAS.
- C. F. Schwenk, T. S. Hofer and B. M. Rode, J. Phys. Chem. A, 2004, 108, 1509–1514 CrossRef CAS.
- W. D. Saputri, H. D. Pranowo and T. S. Hofer, J. Mol. Liq., 2022, 347, 118286 CrossRef CAS.
- J. R. Golebiowski, J. R. Kermode, P. D. Haynes and A. A. Mostofi, Phys. Chem. Chem. Phys., 2020, 22, 12007–12014 RSC.
- R. Bjornsson and M. Bühl, J. Chem. Theory Comput., 2012, 8, 498–508 CrossRef CAS PubMed.
- H. Zou, Y. Ma, H. Liu, Q. Mu, K. Zhang, Y. Song, L. Lin, C.-K. Wang and J. Fan, J. Mater. Chem. C, 2022, 10, 517–531 RSC.
- N. Prasetyo and T. S. Hofer, Comput. Mater. Sci., 2019, 164, 195–204 CrossRef CAS.
- M. Gaus, A. Goez and M. Elstner, J. Chem. Theory Comput., 2012, 9, 338–354 CrossRef PubMed.
- M. Saleh and T. S. Hofer, J. Phys. Chem. C, 2019, 123, 7230–7245 CrossRef CAS.
- W. L. Jorgensen and J. Tirado-Rives, J. Am. Chem. Soc., 1988, 110, 1657–1666 CrossRef CAS PubMed.
- P. Koskinen and V. Mäkinen, Comput. Mater. Sci., 2009, 47, 237–253 CrossRef CAS.
- C. Bannwarth, E. Caldeweyher, S. Ehlert, A. Hansen, P. Pracht, J. Seibert, S. Spicher and S. Grimme, J. Chem. Theory Comput., 2020, 11 Search PubMed.
- F. R. S. Purtscher, L. Christanell, M. Schulte, S. Seiwald, M. Rödl, I. Ober, L. K. Maruschka, H. Khoder, H. A. Schwartz, E.-E. Bendeif and T. S. Hofer, J. Phys. Chem. C, 2023, 127, 1560–1575 CrossRef CAS PubMed.
- M. Rödl, S. Kerschbaumer, H. Kopacka, L. Blaser, F. R. S. Purtscher, H. Huppertz, T. S. Hofer and H. A. Schwartz, RSC Adv., 2021, 11, 3917–3930 RSC.
- R. V. Listyarini, J. Gamper and T. S. Hofer, J. Phys. Chem. B, 2023, 127, 9378–9389 CrossRef CAS PubMed.
- T. S. Hofer, R. V. Listyarini, E. Hajdarevic, L. Maier, F. R. S. Purtscher, J. Gamper and F. Hanser, J. Phys. Chem. Lett., 2023, 14, 6018–6027 CrossRef CAS PubMed.
- D. Werner, D. H. Apaydin, D. Wielend, K. Geistlinger, W. D. Saputri, U. J. Griesser, E. Draževic, T. S. Hofer and E. Portenkirchner, J. Phys. Chem. C, 2021, 125, 3745–3757 CrossRef CAS PubMed.
- J. P. Perdew, K. Burke and M. Ernzerhof, Phys. Rev. Lett., 1996, 77, 3865–3868 CrossRef CAS PubMed.
- M. V. den Bossche, J. Phys. Chem. A, 2019, 123, 3038–3045 CrossRef PubMed.
- M. Kubillus, T. Kubar, M. Gaus, J. Rezác and M. Elstner, J. Chem. Theory Comput., 2014, 11, 332–342 CrossRef PubMed.
- D. V. Oliveira, J. Laun, M. F. Peintinger and T. Bredow, J. Comput. Chem., 2019, 40, 2364–2376 CrossRef PubMed.
- R. Dovesi, A. Erba, R. Orlando, C. M. Zicovich-Wilson, B. Civalleri, L. Maschio, M. Rérat, S. Casassa, J. Baima, S. Salustro and B. Kirtman, Wiley Interdiscip. Rev.: Comput. Mol. Sci., 2018, 8, e1360 Search PubMed.
- C. Møller and M. S. Plesset, Phys. Rev., 1934, 46, 618–622 CrossRef.
- T. H. Dunning, Chem. Phys., 1989, 90, 1007–1023 CAS.
-
M. J. Frisch, G. W. Trucks, H. B. Schlegel, G. E. Scuseria, M. A. Robb, J. R. Cheeseman, G. Scalmani, V. Barone, G. A. Petersson, H. Nakatsuji, X. Li, M. Caricato, A. V. Marenich, J. Bloino, B. G. Janesko, R. Gomperts, B. Mennucci, H. P. Hratchian, J. V. Ortiz, A. F. Izmaylov, J. L. Sonnenberg, D. Williams-Young, F. Ding, F. Lipparini, F. Egidi, J. Goings, B. Peng, A. Petrone, T. Henderson, D. Ranasinghe, V. G. Zakrzewski, J. Gao, N. Rega, G. Zheng, W. Liang, M. Hada, M. Ehara, K. Toyota, R. Fukuda, J. Hasegawa, M. Ishida, T. Nakajima, Y. Honda, O. Kitao, H. Nakai, T. Vreven, K. Throssell, J. A. Montgomery, Jr., J. E. Peralta, F. Ogliaro, M. J. Bearpark, J. J. Heyd, E. N. Brothers, K. N. Kudin, V. N. Staroverov, T. A. Keith, R. Kobayashi, J. Normand, K. Raghavachari, A. P. Rendell, J. C. Burant, S. S. Iyengar, J. Tomasi, M. Cossi, J. M. Millam, M. Klene, C. Adamo, R. Cammi, J. W. Ochterski, R. L. Martin, K. Morokuma, O. Farkas, J. B. Foresman and D. J. Fox, Gaussian-16 Revision C.01, 2016, Gaussian Inc, Wallingford CT Search PubMed.
- M. V. den Bossche, H. Grönbeck and B. Hammer, J. Chem. Theory Comput., 2018, 14, 2797–2807 CrossRef PubMed.
- B. Hourahine, B. Aradi, V. Blum, F. Bonafé, A. Buccheri, C. Camacho, C. Cevallos, M. Y. Deshaye, T. Dumitrica, A. Dominguez, S. Ehlert, M. Elstner, T. van der Heide, J. Hermann, S. Irle, J. J. Kranz, C. Köhler, T. Kowalczyk, T. Kubar, I. S. Lee, V. Lutsker, R. J. Maurer, S. K. Min, I. Mitchell, C. Negre, T. A. Niehaus, A. M. N. Niklasson, A. J. Page, A. Pecchia, G. Penazzi, M. P. Persson, J. Rezác, C. G. Sánchez, M. Sternberg, M. Stöhr, F. Stuckenberg, A. Tkatchenko, V. W. Z. Yu and T. Frauenheim, Chem. Phys., 2020, 152, 124101 CAS.
-
X. Li, Z. Wu, X. Ma, L. Xin, X. Yu and Y. Liu, CCDC 2151494: Experimental Crystal Structure Determination, 2023, https://www.ccdc.cam.ac.uk/services/structure_request?id=doi:10.5517/ccdc.csd.cc2b6t1fsid=DataCite.
- S. Grimme, J. Antony, S. Ehrlich and H. Krieg, Chem. Phys., 2010, 132, 154104 Search PubMed.
- R. J. Frick, T. S. Hofer, A. B. Pribil, B. R. Randolf and B. M. Rode, Phys. Chem. Chem. Phys., 2010, 12, 11736 RSC.
-
M. P. Allen and D. J. Tildesley, Computer Simulation of Liquids, Clarendon Press, Oxford, England, 1989 Search PubMed.
- A. Einstein, Ann. Phys., 1905, 322, 549–560 CrossRef.
- C. Peng, A. Bhandari, J. Dziedzic, J. R. Owen, C.-K. Skylaris and D. Kramer, J. Mater. Chem. A, 2021, 9, 16798–16804 RSC.
- I. Umegaki, S. Kawauchi, H. Sawada, H. Nozaki, Y. Higuchi, K. Miwa, Y. Kondo, M. Månsson, M. Telling, F. C. Coomer, S. P. Cottrell, T. Sasaki, T. Kobayashi and J. Sugiyama, Phys. Chem. Chem. Phys., 2017, 19, 19058–19066 RSC.
- L. Mandeltort and J. T. Yates, J. Phys. Chem. C, 2012, 116, 24962–24967 CrossRef CAS.
- K. Persson, V. A. Sethuraman, L. J. Hardwick, Y. Hinuma, Y. S. Meng, A. van der Ven, V. Srinivasan, R. Kostecki and G. Ceder, J. Phys. Chem. Lett., 2010, 1, 1176–1180 CrossRef CAS.
- K. Persson, Y. Hinuma, Y. S. Meng, A. V. der Ven and G. Ceder, Phys. Rev. B: Condens. Matter Mater. Phys., 2010, 82 Search PubMed.
- M. Kühne, F. Paolucci, J. Popovic, P. M. Ostrovsky, J. Maier and J. H. Smet, Nat. Nanotechnol., 2017, 12, 895–900 CrossRef PubMed.
- A. D. Becke, Chem. Phys., 1993, 98, 5648–5652 CAS.
Footnote |
| † Electronic supplementary information (ESI) available: Pdf file: recreation of the C–C Slater–Koster table; orthorombisation of the graphene supercell; depiction of the scan configurations for the force-field parametrisation; average charges of the alkali metal atoms; alkali metal atom pair distances; z-distribution functions; analysis of the graphene plane deformation; geometries of methyllithium, graphene flakes and the dual layer graphene system in xyz-format. Zip file: Slater–Koster files and for the interactions of Li–Li, Li–H and Li–C; STO coefficients for Li. See DOI: https://doi.org/10.1039/d3cp02765a |
|
| This journal is © the Owner Societies 2024 |
Click here to see how this site uses Cookies. View our privacy policy here. 
 Open Access Article
 This Open Access Article is licensed under a
  and
Thomas S.
Hofer
and
Thomas S.
Hofer


 being the orbital eigenvalues with respect to the occupation number n (high, and low) and Δn being the step length representing a change in occupation set to 0.01. The spin constant necessary for open-shell calculations was determined according to eqn (4). As for sodium in the 3ob set, only the spin constant for the ss-orbital orbital contribution has been calculated and is employed for ss, sp, sp and pp orbital interactions.35