
 Open Access Article
 This Open Access Article is licensed under a Creative Commons Attribution-Non Commercial 3.0 Unported Licence
Ultrafast electron dynamics in excited states of conjugated thiophene–fluorene organic polymer (pF8T2) thin films†
T.
Reiker
 *ab,
Z.
Liu
c,
C.
Winter
b,
M. V.
Cappellari
d,
D. Gonzalez
Abradelo
d,
C. A.
Strassert
d,
D.
Zhang
c and
H.
Zacharias
ab
*ab,
Z.
Liu
c,
C.
Winter
b,
M. V.
Cappellari
d,
D. Gonzalez
Abradelo
d,
C. A.
Strassert
d,
D.
Zhang
c and
H.
Zacharias
ab
aCenter for Soft Nanoscience, University of Münster, 48149 Münster, Germany. E-mail: tobiasreiker@uni-muenster.de
bPhysics Institute, University of Münster, 48149 Münster, Germany
cOrganic Solids Laboratory, Institute of Chemistry, Chinese Academy of Science, Beijing 100190, P. R. China
dCenter for Nanotechnology and Institute for Inorganic and Analytical Chemistry, University of Münster, Heisenbergstraße 11, 48149 Münster, Germany
First published on 22nd January 2024
Abstract
The electronic states of poly(9,9-dioctylfluorenyl-alt-bithiophene) pF8T2 on H/Si(100) substrates, prototypical for organic photovoltaics, were investigated by ultrafast photoelectron spectroscopy and by time-resolved fluorescence studies. Occupied and unoccupied electronic states were analysed by ultraviolet photoelectron spectroscopy (UPS), static and dynamic femtosecond two-photon photoemission (2PPE), and time-correlated single photon counting (TCSPC). Time-resolved measurements allow assessment of population lifetimes of intermediate states. The combination of time-resolved photoelectron spectroscopy and fluorescence excitation allows following the electronic dynamics in excited states from the femtosecond to the nanosecond time scale. For this prototypical material the electron kinetic energy resolved lifetimes range from about a few tens of femtoseconds up to hundreds of picoseconds. After annealing these types of organic thin films the efficiency of organic solar cells usually increases. We show that annealing does not influence the initial ultrafast charge generation processes, but the long-lived states. However, the nanosecond scale fluorescence lifetimes measured by TCSPC are prolonged after annealing, which therefore is identified as the cause of a greater exciton diffusion range and thus is beneficial for charge carrier extraction.
Introduction
In the last decade, conjugated polymers have drawn increasing attention as materials for organic optoelectronic devices. Advanced research activities in organic solar cells, organic light-emitting diodes (OLED), and organic field effect transistors (OFET) promise low-cost solution processes and advanced fabrication methods using donor–acceptor (D)–(A) polymers. To unlock the large potential of organic semiconductors, a direct assessment of the electronic dynamics can guide molecular design development. One of the many advantages of conjugated polymers is their solubility in organic solvents, which offers the possibility of processing directly from a liquid solution.1–6Poly(9,9-dioctylfluorene-alt-bithiophene) (pF8T2) serves as a model system for various research approaches to improve the understanding of electronic dynamics in organic semiconductors. The polymer can be modified by addition of different side chains, which has great influence on the arrangement of the molecules in devices and thus also directly on the charge carrier mobility in the final thin film. Further, there are several possibilities to combine different heterogeneous compounds with this polymer to increase the efficiency of organic semiconductor devices. Recently organic photovoltaic devices with power conversion efficiencies between 6% and 16% were reported.7–10
The F8T2 molecule is a highly researched and widely used representative of fluorene copolymers and a fundamental and adaptable feedstock as donor material in semiconducting organic blends.11–22 Fluorene-based polymers are more stable than thiophene based polymers.23 Roozbeh et al. recently showed that it is possible to process F8T2 with water or ethanol, thus providing an environmentally more preferential synthesis step.10 Fenwick et al. built OFETs containing F8T2 and reached a field-effect mobility of 2.1 × 10⁻³ cm2 V−1 s−1 in the saturation regime.24 Besides the production from simple drop-casting and spin-coating,25 thin film transistors from F8T2 have also been printed, thus opening up a complete new processing technique,1 easily extendable to large area fabrication. For pure F8T2 thin film transistors, Sirringhaus et al. reported mobilities of 0.01–0.02 cm2 V−1 s−1 which reflects the strong π–π interchain interactions.11 On the basis of pF8T2, OLEDs have already been produced, which achieved an optical output power of 45 μW at 15 V emitting in the green spectral range.26 Another promising property is the possibility of circularly polarised luminescence, a feature that has been investigated by Duong and Fujiki.27 Recently, this material has been employed by Fuchter and co-workers for the generation of circularly polarized light based on an injection of electrons with orbital angular momentum (OAM) which yields opposite helicity of the light emitted in opposite direction.28–30
In reverse, polymer solar cells can benefit from the large absorption in the blue spectral region and, together with a potential acceptor, cover a wide part of the solar spectrum.31 A current density of 0.23 mA cm−2 has been measured for pF8T2-based polymer solar cells.26 Yasuda et al. reached a conversion efficiency of 2.28% with a F8T2:PC70BM organic photovoltaic cell.15 Currently, great efforts are pursued to further increase the photovoltaic efficiency by modifying the sidechains of F8T2,32 or by using Förster resonant energy transfer in combination with suitable acceptor materials,10e.g., nanoparticles.21
As an alignable liquid crystalline semiconducting polymer, new opportunities are opening up in the design of organic (opto-)electronic components. Through contact-free photo alignment, Sakamoto et al. showed its potential as integrated OFETs with spatially aligned active layers, where the π-conjugated orbitals were mainly extended along the backbone structure in pF8T2.33 One of the first conjugated polymer FET on the basis of F8T2 was reported by Sirringhaus and co-workers. Therein they pointed out the polaronic nature of charge transport and referred to the competitive characteristics between electron delocalization over the molecular backbone, the electron–phonon coupling, and the disorder in the polymer thin film.11,12,14 This polaronic nature is mainly of intrachain character and can be explained by an isolated chain model, whereas for thiophene based polymers, e.g. P3HT, interchain interactions are evident.12
The fundamental change in the electron configuration of the pF8T2 polymer, as opposed to the individual components, was demonstrated by Santos et al. by comparing the spectroscopic properties of pF8T2 and PFO:P3HT blends.34 They observed that the fundamental properties of dioctylfluorenes and bithiophenes can no longer be observed in a pF8T2 film and thus the electron configuration of the D–A conjugated polymer is completely reconfigured.
Despite the large body of works in using prototypical pF8T2 films or various applications the underlying fundamental electronic processes still lack a detailed understanding. Therefore, in this contribution we want to provide a deeper insight into the electronic configuration and electronic dynamics of pF8T2 on the shortest time scale. In general, femtosecond time scales have only been scarcely addressed for polymeric thin films in the past.15,23,35–40 First, we report the relative energetic positions of occupied and unoccupied states, which influence the charge injecting barriers from electrodes for possible devices based on pF8T2. The lifetimes of the excited charge carriers have a direct influence on the basic processes of organic semiconductors. It is therefore essential to identify the electronic dynamics right after excitation. Time-resolved two-photon photoelectron spectroscopy allows to assess also states which do not show fluorescence. It has been shown that annealing deposited films increases the efficiency in (opto-)electronic applications.11,20,41 In order to assess the underlying microscopic processes, we compare in this work the electronic dynamics of pristine thin films as deposited and those which have been annealed in vacuum from the ultrafast carrier generation up to the fluorescence of long-lived states.
Experimental set-up
The conjugated polymer pF8T2 was prepared according to previous reports.11,13 The molecular weight was determined at 150 °C with a GPC 220 high temperature chromatograph equipped with an IR5 detector; polystyrene was utilized as the calibration standard and 1,2,4-trichlorobenzene as eluent (1.0 mL min−1). The Mw (weight-average molecular weight) and PDI (polydispersity) of pF8T2 were measured to be 163 kDa and 1.7, respectively. The HOMO energy value is estimated at EB = −5.5 eV with respect to the vacuum energy, as deduced from cyclic voltammetry. The LUMO is estimated at EB = −3.1 eV from the optical π–π* gap.13 A sketch of the monomer unit is shown in Scheme 1. | ||
| Scheme 1 Monomeric unit of pF8T2. | ||
The polymer was dissolved in toluene at 60 °C (7 mg per ml). The solution was spin-coated onto an HF-treated p-doped Si(100) wafer with a resistivity of 1–5 Ω cm. The HF-treatment yields H/Si(100),42 and silicon avoids charging effects during photoelectron spectroscopy. For all photoelectron spectroscopy measurements, the samples were mounted in an UHV chamber with a base pressure of p = 5 × 10⁻¹¹ mbar. The annealing process up to 200 °C for 60 min where also performed in UHV. Absorption and emission spectra were measured thereafter in air. For absorbance measurement thin films were prepared on fused silica substrates and measured with a UV-Visible/NIR spectrophotometer (Jasco V-770), see Fig. 1. Steady-state emission spectra were recorded on a fluorescence spectrometer equipped with a xenon lamp (λ = 250–900 nm, FluoTime300 PicoQuant). Steady-state spectra and fluorescence lifetimes were recorded in time-correlated single photon counting (TCSPC) mode by using a PicoHarp 300 with a minimum base resolution of 4 ps. All emission and excitation spectra were corrected for source intensity (lamp and grating) according to standard correction curves. More details of the set-up for emission spectroscopy are given in the ESI.† In order to gain insight into the occupied electronic states, ultraviolet photoelectron spectra (UPS) were taken in UHV using a helium lamp (He–I line, Ephot = 21.2 eV) as light source and an energy dispersive cylindrical sector analyser (Focus, CSA-300) for analysing the kinetic energy spectrum of photoemitted electrons.
 | ||
| Fig. 1 Normalized absorbance of pF8T2 thin films on fused silica. In (a) pristine and annealed spectra are shown, (b) and (c) display the main peak with background subtracted and Franck–Condon fits for as-prepared and annealed films. In cyan the fits for ordered H-like aggregated and in magenta those for the amorphous phase are visualized. | ||
For analysing the unoccupied states, first static and then dynamic photoelectron spectroscopy with a femtosecond pulsed laser source were implemented. For one-colour two-photon photoelectron spectroscopy (2PPE) the output of a Ti:sapphire laser system (frep = 6 kHz, Ep = 1.4 mJ, τp = 30 fs) was frequency doubled by a 150 μm thick BBO crystal to obtain UV light with a centre frequency of λ = 390 nm (hν = 3.2 eV). Static photoemission was then carried out by focusing this second harmonic radiation onto the sample mounted in an UHV chamber (base pressure p = 5 × 10⁻¹¹ mbar) to a spot diameter of approximately d ≈ 300 μm. The electron kinetic energy of the liberated photoelectrons was analysed by a time-of-flight tube (eToF) and detected with a delay-line detector (Surface Concept DLD 6565-4Q).
For ultrafast time-resolved measurements, a Mach-Zehnder type interferometer splits the λ = 390 nm pulses into two identical partial beams. One arm of the interferometer is delayed with a high-precision linear delay stage (Physik Instrumente, PI M-405.DG), providing a resolution of Δτ = 1 fs and a maximal possible delay range of Δτ = ±167 ps. In the other arm, the polarisation is rotated by a zero-order half-wave plate by 90° before both partial beams are spatially superimposed via a thin-film beam splitter. Due to different reflection losses the pulse energies of the p- and s-polarised radiation amounts to about 55% and 45%, respectively. This collinear setup with crossed polarisations prevents interference effects in the measurement. By self-diffraction autocorrelation, a duration for the UV pulse of τFWHM = (35 ± 2) fs was determined. For a detailed description of the setup also see ref. 43 and 44.
Temporally resolved spectra were recorded at 71 delays in the femtosecond range from Δτ = −500 fs to +500 fs. For each delay 10 seconds of integration time were set, with five repetitions; on every pass, the delays were selected at random to distribute any long-term laser drift equally. The temporal evolution of the molecular system is determined by summation of the photoelectron counts within an interval of 200 time-of-flight channels, which corresponds to approximately ΔE = 100 meV steps, depending on the kinetic energy of the photoelectrons. For each of these energy steps the decay constants are extracted by fitting the temporal evolution of the photoelectron signal with a convolution of a Gaussian and an exponential decay. The width of the Gaussian was set to Δtcross = 49 fs to represent the correlation of the two combined laser pulses, as determined by self-diffraction autocorrelation.
On the same UHV system also a fiber laser source (ActiveFiberSystems, λ = 1030 nm, repetition rate of 500 kHz, 40 fs pulse duration), was employed for two-colour experiments. The 4th harmonic (s-polarised, λ = 257 nm, hv = 4.8 eV) of this fundamental was generated by consecutive conversion in two BBO crystals. Finally, the UV pulses were separated and recompressed by a prism compressor. After compensation of the optical paths, the 4th harmonic is collinearly overlapped with the frequency doubled output of a wavelength tuneable non-collinear optical parametric amplifier (NOPA, Light Conversion Orpheus N, λ = 350–460 nm, hv = 3.55–2.7 eV, p-polarised). For this experiment, the travel range of the linear translation stage is limited by its precision to Δτ = ±60 ps. The pulse length of the 257 nm radiation was previously determined to be τFWHM = 70 fs using cross-correlation with the fundamental in BBO. Directly at the output of the NOPA the pulse length of the fundamental of the NOPA is below 30 fs, so we assume that its second harmonic tends to be shorter. Both pulses pass through approx. 6 mm fused silica. The temporal resolution of the system was determined to τFWHM = (68 ± 1) fs, using the 2PPE signal from hot electrons on an uncoated H-terminated silicon wafer, see Fig. S1 (ESI†).
Results and discussion
Absorption
The optical absorption spectrum of the polymer film is shown in Fig. 1. Besides deep-UV absorption a broad feature from hν = 2.4 to 3.7 eV (λ = 517 to 335 nm) appears that contains at least three distinguishable sub-maxima at hν = 2.54, 2.71 eV, and a broader maximum in the higher energy shoulder of the main peak at about 2.89 eV, which correspond to wavelength of λ = 488, 458, and 429 nm, respectively. For the pristine thin film (blue) the first emerging vibronic replica (hν = 2.71 eV) is slightly higher in absorbance than the energetically lowest transition. This energy difference of about Δhν = 0.16–0.19 eV is characteristic for C–C and C![[double bond, length as m-dash]](https://www.rsc.org/images/entities/char_e001.gif) C stretching vibrations. Also, many benzene and other carbon related bond stretching frequencies correspond typically to an energy difference between Δhν = 0.12 and 0.2 eV.32,45,46 On the blue side of the maximum there is a shoulder, from the next higher vibronic transition(s). Higher energy maxima appear above hν = 4 eV with peaks at hν = 4.16, 4.75, and 6.02 eV with increasing absorption strength in the deep ultraviolet and at respective wavelength of λ = 298, 261, and 206 nm. Similar spectra of a pF8T2 thin films were previously reported, e.g., by Muenmart et al.47 in the visible spectral range, further the UV features below λ = 320 nm and at λ = 210 nm were also observed.28,48 TDDFT calculations of Damas et al. predict excitations between the HOMO–LUMO, as well as between the HOMO−1–LUMO+1, that appear in the absorption spectra at λ = 455 and 353 nm, respectively (Δhν = 2.7 and 3.5 eV).49 In these calculations, both excitations are attributed π–π* character and exhibit the highest transition probabilities. An assignment of the energy levels can be found in Fig. 6. The regions of the measured LUMO and LUMO+1 are indicated as grey boxes. On the right side the calculations of Damas et al. are included as bars.
C stretching vibrations. Also, many benzene and other carbon related bond stretching frequencies correspond typically to an energy difference between Δhν = 0.12 and 0.2 eV.32,45,46 On the blue side of the maximum there is a shoulder, from the next higher vibronic transition(s). Higher energy maxima appear above hν = 4 eV with peaks at hν = 4.16, 4.75, and 6.02 eV with increasing absorption strength in the deep ultraviolet and at respective wavelength of λ = 298, 261, and 206 nm. Similar spectra of a pF8T2 thin films were previously reported, e.g., by Muenmart et al.47 in the visible spectral range, further the UV features below λ = 320 nm and at λ = 210 nm were also observed.28,48 TDDFT calculations of Damas et al. predict excitations between the HOMO–LUMO, as well as between the HOMO−1–LUMO+1, that appear in the absorption spectra at λ = 455 and 353 nm, respectively (Δhν = 2.7 and 3.5 eV).49 In these calculations, both excitations are attributed π–π* character and exhibit the highest transition probabilities. An assignment of the energy levels can be found in Fig. 6. The regions of the measured LUMO and LUMO+1 are indicated as grey boxes. On the right side the calculations of Damas et al. are included as bars.
The vibronic broadening of conjugated polymers can typically be described by Franck–Condon fits depending on the Huang–Rhys factor.50–53 For this purpose, we have isolated the main peak in Fig. 1b and subtracted a background, see Fig. S2 (ESI†). To model the region between 2.0 and 3.9 eV, the superposition of two Franck–Condon progressions is used. The first (cyan) begins with the main peak at EO00 = (2.535 ± 0.001) eV, a vibrational separation of EOp = (0.178 ± 0.001) eV and a Huang–Rhys factor of SO1 = (1.05 ± 0.14). The second sequence (magenta) starts at EA00 = (2.85 ± 0.01) eV, a vibrational separation of EAp = (0.182 ± 0.007) eV and a Huang–Rhys factor SA2 = (1.36 ± 0.22).
With the annealing of the thin film in the UHV the absorption spectrum changes, see Fig. 1. In particular, the main absorption peak spans now a width from hν = 1.5 to 4 eV. The two most prominent vibronic replicas at hν = 2.49 eV and 2.67 eV show approximately the same height. Fig. 1c shows the main absorption peak for the annealed thin film, analogous to the as-prepared film, where the energetic positions of the (0-0) transitions of Franck–Condon progressions with EO00 = (2.492 ± 0.001) and EA00 = (2.788 ± 0.006) eV are not significantly changed (EOp = (0.177 ± 0.001) eV and EAp = (0.178 ± 0.002 eV), respectively). The Huang–Rhys factors of the lower energy progression stays with SO1 = (0.98 ± 0.06) close to one, but increase to SA2 = (1.67 ± 0.08) for the higher energetic one.
In general, a red shift of the absorption spectra by annealing is associated with a stronger interaction between the chains. The thermal treatment allows a reorganisation in the thin film layer, from which a closer stacking with correspondingly stronger interactions follows.54 Annealing influences the morphological structure, roughness and molecular ordering.41 With annealing of pF8T2, the electron transport improves due to the reduction of grain boundaries and an improved interconnection.55 According to Ma et al. pF8T2 can undergo different phase transitions during annealing: a glassy state at 100 °C, an amorphous elastic state around 130 °C, crystallization between 150 and 200 °C, and an isotropic state above 310–330 °C.41,50,56 While annealing between 100 and 200 °C improves the electronic and photovoltaic properties, higher temperatures seem to reduce crystallinity and increase disorder, which has a negative impact on these properties.41 A new absorption peak due to annealing was also observed for the polymers P3HT and PFO, which is attributed either to the formation of a β-phase or to J-aggregates.57–62 An amorphic part in the absorbance spectra was also observed previously for related polymers,63–65 and particularly also in pF8T2.50 Following this interpretation, we assign the two strongly represented progressions to the ordered H-like aggregated (cyan) and amorphic (magenta) phase. The fact that the annealing also enhances the low-energy shoulder is attributed to the formation of β- or J-aggregates, as observed before in pF8T250,66 and other polymers.57–62
Photoluminescence spectra
The emission spectrum for pF8T2 on H/Si(100) after excitation with a wavelength of λ = 400 nm (hν = 3.10 eV) is shown in Fig. 2. The spectrum basically resembles previous studies.26,67,68 Since the potential energy hypersurfaces of the ground and first excited state are often quite similar in this type of molecules, absorption and emission are commonly like mirror images of each other, as in the present study. Nevertheless, considering the size and complexity of the polymer electron system, the vibrational modes in the ground and the first excited state S1 can differ slightly. The emission for the pristine sample (Fig. 2a) begins at hν = 1.7 eV and extends to just above 2.4 eV, with a maximum at hν = 2.22 eV. The fluorescence feature is composed of two peaks at hν = 2.23 and 2.10 eV and two shoulders at hν = 1.97 eV and hν = 1.83 eV. In the absorption measurements, see Fig. 1, the (0-0) transition was identified at about E00 = 2.5 eV. Notably, there is no discernible intensity at this energy in the pristine emission spectrum. We conclude that for the as-prepared sample the (0-0) peak is almost completely suppressed, in accordance with the observations of Ma et al.50 Spin-coated pF8T2 is presumed to form disordered H-like aggregates with low or suppressed (0-0) transition.68,69 The emission spectrum was modelled using a modified Franck–Condon progression as outlined in eqn (S6) of the ESI.† For the emission spectra of aggregated films the exciton coherence number α scales the (0-0) transition. Since this transition is spin forbidden, the coherence number is set to α = 0. Represented in cyan in Fig. 2a, the emission spectrum thus corresponds to a Franck–Condon progression with EO00 = (2.370 ± 0.003) eV and separations of the vibrational transitions of EOp = (0.134 ± 0.004) eV, where the Huang–Rhys factor assumes SOp = (1.63 ± 0.04). Accordingly, the vibronic (v′–v′′) transitions from (0-1) to (0-N) occur at wavelengths of λ = 556, 590, 629, 678 nm (hν = 2.23, 2.10, 1.97, 1.83 eV). There is still a discrepancy in the energy of the (0-0) transition between absorption and emission spectra. This characteristic red shift in the emission spectra is a commonly observed phenomenon in this type of polymers.53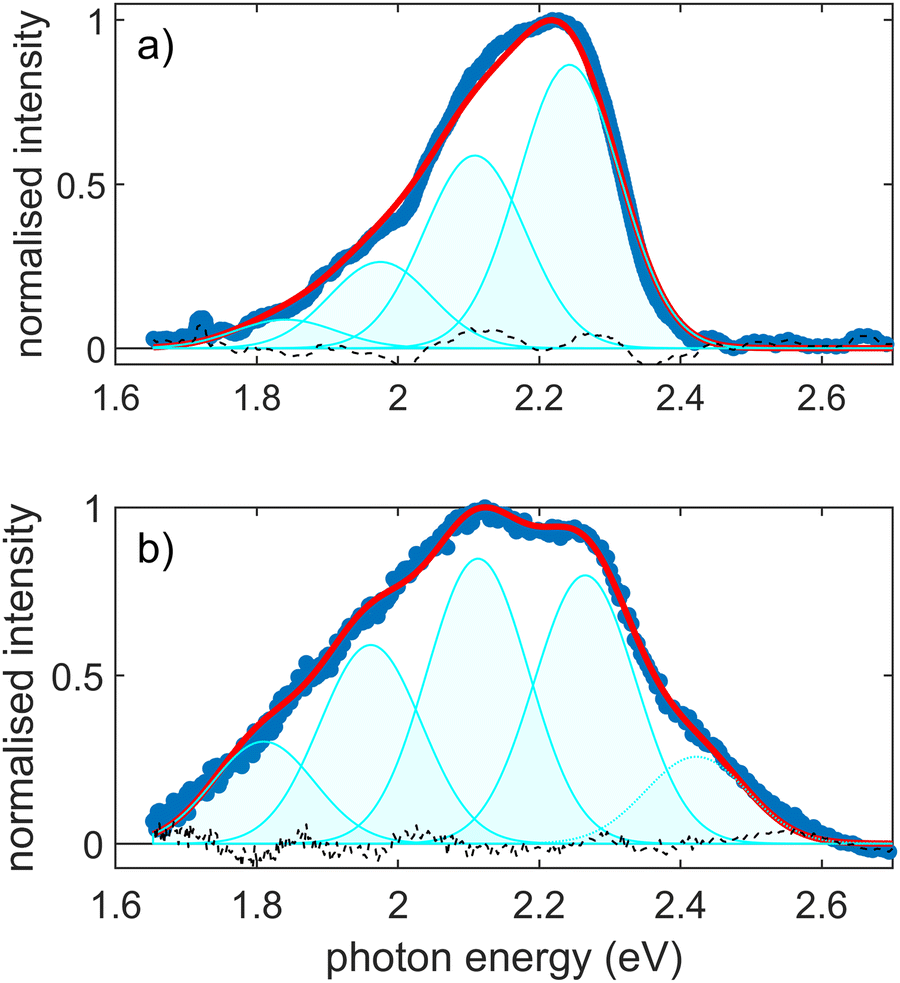 | ||
| Fig. 2 Normalized emission spectra (blue) after excitation at λ = 400 nm of pF8T2 thin films on H/Si(100) for (a) as-prepared and (b) annealed samples. In red is shown the Franck–Condon fit, and in cyan the contributions of the vibronic replicas. | ||
After annealing the sample, the emission spectrum broadens, see the graph in (Fig. 2b). The Huang–Rhys factor increases with annealing and a contribution from J-aggregates arises. The previously almost completely suppressed (0-0) transition becomes now visible through the J-aggregate centred at hν = 2.4 eV. The emission spectrum extends thus on the blue side up to hν = 2.6 eV. The maximum emission intensity shifts from hν = 2.25 eV to the next vibronic transition at about hν = 2.11 eV. On the red side, the relative intensities of transitions to higher vibrations in the electronic ground state increase significantly, which leads to a Huang–Rhys factor of S = (2.62 ± 0.02). For both cases, pristine and annealed, the spectra cannot be sufficiently described by a classical Franck–Condon progression. A modified progression with a scaled (0-0) transition according to eqn (S6) in the ESI,† is fitted. This scaling factor α is correlated to the disorder and spatial correlation length, see also Franck–Condon Fit section in the ESI.†![[thin space (1/6-em)]](https://www.rsc.org/images/entities/char_2009.gif) 63 From such a fit we deduce α = 0 for the as-prepared film and α = (0.69 ± 0.05) for the annealed film. A description of the fitting procedure and a summarizing Table S1 are given in the ESI,† together with the evaluation of the emission spectra of the thin films prepared on H/Si(100) and fused silica substrates, Fig. S3 (ESI†). The observed difference between the Huang–Rhys factors between absorption and emission is not unusual, further annealing can also change the peak positions and widths somewhat.70
63 From such a fit we deduce α = 0 for the as-prepared film and α = (0.69 ± 0.05) for the annealed film. A description of the fitting procedure and a summarizing Table S1 are given in the ESI,† together with the evaluation of the emission spectra of the thin films prepared on H/Si(100) and fused silica substrates, Fig. S3 (ESI†). The observed difference between the Huang–Rhys factors between absorption and emission is not unusual, further annealing can also change the peak positions and widths somewhat.70
According to Kettner et al. the ratio of I(0-0)/I(0-1) ≪ 1, as for the as-prepared sample, indicates strong intermolecular coupling, and a slightly higher ratio of closer to 1 indicates order up to a certain degree.32 For both films in Fig. 2a, a measured value of α < 1 indicates a predominant side-by-side H-aggregate packing.71 Wang and Rothberg also describe a similar connection between the suppression of the (0-0) signal and the H/J aggregation and interchain coupling.72 A self-organized phase arising due to relaxion and re-ordering of the chains during the annealing process, in turn, promotes strong interchain coupling and resulting in longer exciton lifetimes, and was attributed to J-aggregates.50 The fraction of the non-aggregated polymers present in the absorbance spectra in Fig. 1 is not observed in the emission spectra in Fig. 2, we therefore assume a very efficient and ultra-fast energy transfer from the amorphous to the ordered phase. It has been observed previously that in this way even small portions of a phase in the thin layer can dominate the emission.51,62 The optical absorbance and emission spectra presented here demonstrate that the samples were prepared and exhibit the anticipated behaviour in accordance with the existing literature. Therefore, the static and ultrafast photoelectron spectra measured and discussed below represent results for typical spin coated pF8T2 films.
Occupied states
The energetic position of occupied electronic states was determined by UPS. A typical spectrum obtained with a He–I source is shown in Fig. 3. For the pF8T2/H/Si(100) system the valence band maximum (VBM) is located at EB = EVBM − EVac = −5.5 eV below the vacuum level with the centre of the HOMO at EB = −5.6 eV. The arrows in Fig. 3 indicate different states which were determined from the 1st and 2nd derivatives of the UPS spectra. The corresponding HOMO−1 is poorly pronounced, has a binding energy of EB = −6.5 eV and is closely accompanied by another state at EB = −6.7 eV. In addition, three more states can be identified at EB = −7.5 eV, −8.8 eV and −10.4 eV with respect to the vacuum energy. Deeper lying states at EB = −13.4 eV and −14.9 eV probably correspond to the σ-bonds. Calculations by Damas et al. reveal that the state at EB = −5.6 eV can be assigned to equal shares to thiophene and fluorene, while the state at EB = −6.5 eV is formed mainly by thiophene.49 The calculated density-of-states increases steeply to larger binding energies, which also is supported by the UPS measurement. Theoretical calculations by Kurban predict the occupied states at EB = −5.6, −6.4, −6.7 and −7.5 eV, which agrees quite remarkably with the experimental values presented here.73 The four uppermost states that we assign to the π-states are included as brown bars in the schematic energy level overview, see Fig. 6. We observe a good agreement between the experimental results and the theoretical predictions. | ||
| Fig. 3 He-I UPS from pF8T2 thin films on H/Si(100). The occupied states located at E − Evac = −5.6, −6.5, −6.7, −7.5, −8.8, −10.4, −13.4 and −14.9 eV below vacuum level are indicated by the black arrows. | ||
Unoccupied states
Single-colour two-photon photoelectron spectroscopy was performed with the frequency doubled output of the NOPA. The central wavelength was decreased in Δλ = 10 nm (Δhν = 60–100 meV) steps between λ = 460 and 350 nm. The photoelectrons collected at each wavelength setting were accumulated over t = 300 s. Fig. 4 shows the measured photoelectron spectra at each photon energy, with an exponential background subtracted, see Fig. S4 (ESI†). The spectra excited by photon energies between hν = 2.7 and 3.1 eV (λ = 460–400 nm) reveal a broad peak around a kinetic energy of Ekin = 1 eV, which is well described by two Gaussian curves, see Fig. S5 in the ESI.† The maxima A and B of the Gaussian fits are marked with circles in Fig. 4a. The dashed lines indicate that their centre steadily evolves towards higher kinetic energies as the exciting photon energy increases. We find peaks A and B only for photon energies smaller than hν = 3.1 eV. Presumably due to different effective cross sections during the excitation of the corresponding occupied and unoccupied states, A and B vanish into the background for larger excitation energies. At photon energies of hν = 3.1 eV and higher a new feature at low electron kinetic energies evolves, see Fig. 4a and b. Again, this peak can be well described by two Gaussian components, see Fig. S5h–m (ESI†), which we denote C and D in Fig. 4b. The maxima of the features C and D are marked with diamonds in Fig. 4b, and also evolve to higher kinetic energies with increasing photon energy.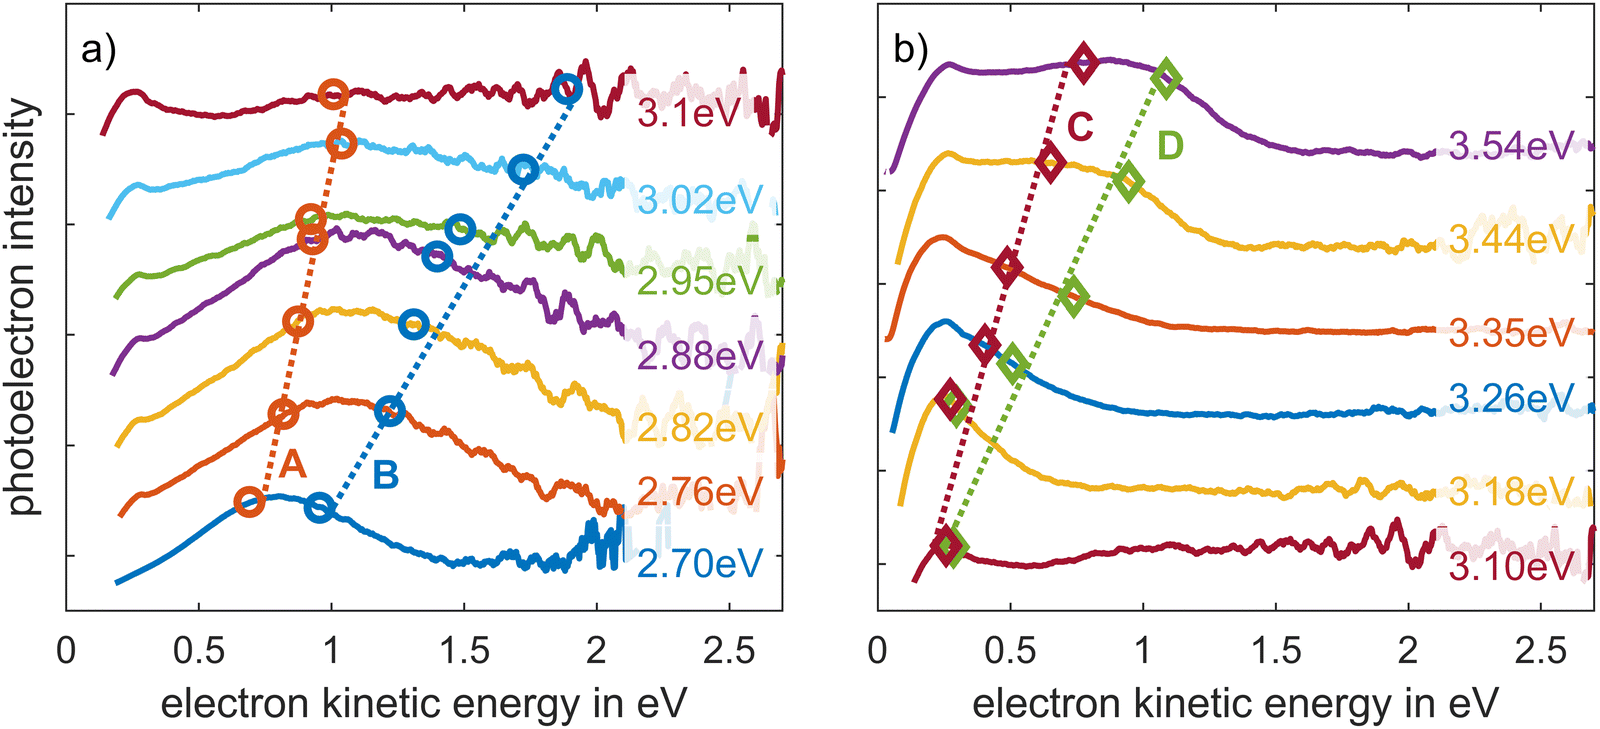 | ||
| Fig. 4 One-colour two-photon photoelectron spectra of pF8T2 thin film for photon energies between (a) hν = 2.70 and 3.1 eV (λ = 460–400 nm), and (b) 3.10–3.54 eV (λ = 400–350 nm). An exponential background was subtracted from the spectra. The markings correspond to the peak positions approximated by Gaussian curves. For photons energies larger than hν = 3.1 eV, the states C and D dominate, so that A and B can no longer be identified in the background. The dotted lines are a guide for the eye to follow the course of the corresponding maxima. Note that the individual traces are offset in the intensity scale for better visibility. The individually fitted graphs can be found in Fig. S5 (ESI†). | ||
The energetic evolution of states A to D is shown in Fig. 5 where the kinetic energy of photoelectrons is plotted versus the photon energy. For each state the slope as a function of photon energy is determined via a linear regression, Fig. 5a, which yield mA = (0.8 ± 0.3), mB = (2.1 ± 0.5), mC = (1.2 ± 0.3) and mD = (2.0 ± 0.4). A slope of m = 1 indicates that one photon of the two-photon process populates an unoccupied state and the second one liberates the electrons from this state. A slope of m = 2 implies that two photons without an intermediate state liberate the electrons from an occupied or from a previously populated state. Together with the kinetic energy of the photoelectrons, this permits to localise the binding energy of the states with respect to the vacuum energy.
 | ||
| Fig. 5 (a) Peak positions as a function of photon energy and the slope of a linear regression. (b) Integrated photoelectron signal vs. pulse energy for pF8T2 thin film measured with an excitation at λ = 460 nm, showing a cubic dependence in the pulse energy range applied. | ||
State A shows a slope of mA = 0.8, and together with its kinetic energy of Ekin = 0.7 eV at hν = 2.76 eV a binding energy of state A with respect to the vacuum level of EAB ≈ −2 eV is found. This state can thus be identified with the LUMO+1, see Fig. 6. For state B we observe a slope of mB = 2.1. This means that two photons are required to emit electrons out of state B. Together with the kinetic energy of Ekin = 1.2 eV at hν = 2.76 eV we arrive at an energetic position of state B of EBB = −4.3 eV below the vacuum level. Altogether, a three-photon process liberates these electrons. That is also consistent with the cubic intensity dependence of the photoelectron signal, see Fig. 5b and also Fig. 10a. That locates the occupied state from which the electrons originate at EB ≈ −7 eV, which is in good agreement with the occupied states measured with UPS, see Fig. 6. This observation witnesses the excitation of an unoccupied state at about 1.2 eV above the VBM, which is temporally occupied by one photon from the π-states around EB ≈ −7 eV and then liberated with two simultaneously arriving photons. Such an energy of about 1 eV above the VBM is typical for excitons and polarons in organic semiconductors. By employing transient absorption spectroscopy, Roozbeh et al. documented a broad excited state absorption (ESA) band in the near infrared between λ = 800 and 1350 nm centred at λ = 1020 nm (hν ≈ 1.22 eV) for F8T2 nanoparticles.10 Such a state corresponds to a binding energy of EExB = − 4.3 eV with respect to the vacuum level, and thus matches very well the state B observed here. Yonezawa et al. also reported an exciton with an absorption at λ = 800 nm and a photoexcited donor polaron around λ = 700 nm from an F8T2 film in this energy region, which would correspond to binding energies of EB ≈ −3.8 and −4.0 eV, respectively.23 Since the photon energies from transient absorption measurements do not yield directly the binding energies of states, we proceed with the supposition that an CT-exciton or polaron is formed symmetrically within the bandgap.74 The ESA then originates from the CT-state, previously being populated from occupied states, and terminates at the S1/LUMO. Therefore, the photon energy of the ESA provides a measure of the energetic position relative to the LUMO. We added these states from the transient absorption measurement of Yonezawa et al. to Fig. 6.
 | ||
| Fig. 6 Energy level diagram with binding energies of the unoccupied states involved A, B, C, in red, the occupied state D from one colour 2PPE or He-I UPS, and the valence band maximum in green. The states in orange are derived from the absorption spectra. (*) In blue are the experimental determined polaron and exciton from Yonezawa, and in grey the adapted states from the calculations of Damas et al. and Kurban et al.38,49,73 Arrows indicate excitation pathways at the given wavelength. | ||
The states C and D only show up at higher photon energies, indicating the onset of a significantly more efficient 2PPE process, which is now possible due to the higher photon energy. State C with a slope of mC = 1.2 indicates an unoccupied state of about ECB = −2.8 eV below the vacuum energy. This position is thus in good agreement with the LUMO and its higher vibronic states, also identified in the absorption measurements, see Fig. 1. In contrast, we suggest that signal D is caused by occupied states around EDB = −6.0 eV, thus 0.5 eV below the VBM, because it shows a slope of mD = 2.0 for a direct 2PPE process. In summary, we thus assign process A to the excitation into the LUMO+1, B to an excitonic or polaronic property, C to the LUMO, and D to the directly excited highest occupied molecular states. The positions of these states are shown in the overview in Fig. 6.
Two-colour 2PPE excitation
In order to investigate the temporal dynamics of the lowest unoccupied states, we choose a two-colour two-photon process with λpump = 460 nm (hν = 2.7 eV, p-polarised, P = 2 nJ) and λprobe = 257 nm (hν = 4.82 eV, s-polarised, P ≈ 100 pJ). As can be seen in the schematic energy level diagram in Fig. 6, the photon energy of hν = 2.7 eV is well suited to excite electrons from the VBM into the LUMO. The fourth harmonic (λ = 257 nm) of the fundamental laser radiation with hνprobe = 4.8 eV can then excite the electrons from the LUMO into the vacuum. Electron kinetic energy spectra of the two-colour experiment are shown in Fig. 7. The blue curve represents the photoelectron spectra at a delay of Δτ = (140 ± 10) fs after the temporal overlap of pump and probe pulses, where the 2PPE signal is most intense. The red line shows the measured signal when the λprobe = 257 nm probe pulse arrives first. Comparing the spectra on the logarithmic plot, a feature becomes evident at a kinetic energy of about Ekin ≈ 1.55 eV. From this kinetic energy we deduce that the state which emits the photoelectrons shows a binding energy of about EB = −3.25 eV. It is thus slightly vibronically relaxed by about ΔE = 0.45 eV from the initially excited one. This is in good agreement with the lowest vibronic state of the LUMO determined by absorption and emission, see Fig. 6. This intensity maximum is located on top of a photoelectron spectrum which is otherwise dominated by secondary electrons. The photoelectron spectrum extends to a kinetic energy of Ekin = 2.1 eV, which corresponds to the energy of those electrons which are directly released by a two-photon process from the VBM with the combined photon energies of pump and probe pulses. | ||
| Fig. 7 Electron kinetic energy spectra of pF8T2 thin films excited with λpump = 460 nm (p-polarised) and λprobe = 257 nm (s-polarised) for the (a) pristine and the (b) annealed samples. The traces show the spectra for a delay belonging to a probe pulse arriving first on the sample (red line) and corresponding to the maximum 2PPE signal at a delay of about Δτ = 140 fs (blue line). | ||
After annealing the sample for 60 minutes to 200 °C in UHV, we directly repeated these measurements; the photoelectron spectra are shown in Fig. 7b. Apart from a slightly increased photoelectron signal across all kinetic energies, there is essentially no difference in the shape of the photoemission spectra after annealing. After annealing the 2PPE signal is more pronounced for kinetic energies greater than Ekin = 1.9 eV. The shape of the spectrum does not allow a clear separation of different states. Presumably, the probe pulse interrogates a mixed excitation of the exciton and the LUMO. This is probably due to the energetic width of Δhν = 0.1 eV of the pulses and also to the amorphous layer of molecular chains due to the spin coating technique.
Time-resolved two-colour 2PPE excitation
The time dependence of the recorded 2PPE signal shows a sharp rise after Δτ = 0 ps, and then it decreases exponentially. Fig. 8 plots exemplarily this 2PPE signal for photoelectron kinetic energies of about Ekin = 1.6 eV, the region which we identify with the LUMO. The population decay can be described by an ultrafast lifetime τ1 < 500 fs, a short lifetime of τ2 < 3 ps and a longer decay time of about τ3 ≈ 10 ps. In addition, the decay curves contain a long-lived component that lies outside the measurement range. We adapt this very long-lived component of τ4 = 150 ps from the following TCSPC measurements. However, any lifetime τ4 > 100 ps is suitable to describe the data sufficiently, without further effects on the shorter lifetimes. The signal I2PPE was therefore fitted with a fourfold exponential decay convoluted with a Gaussian; where τk represents the corresponding decay time, Ak represents the relative contribution to the signal, Δτ is the temporal delay, τ0 is the temporal zero where both pulses overlap, and τp correlates to the width of the cross-correlation of both pulses.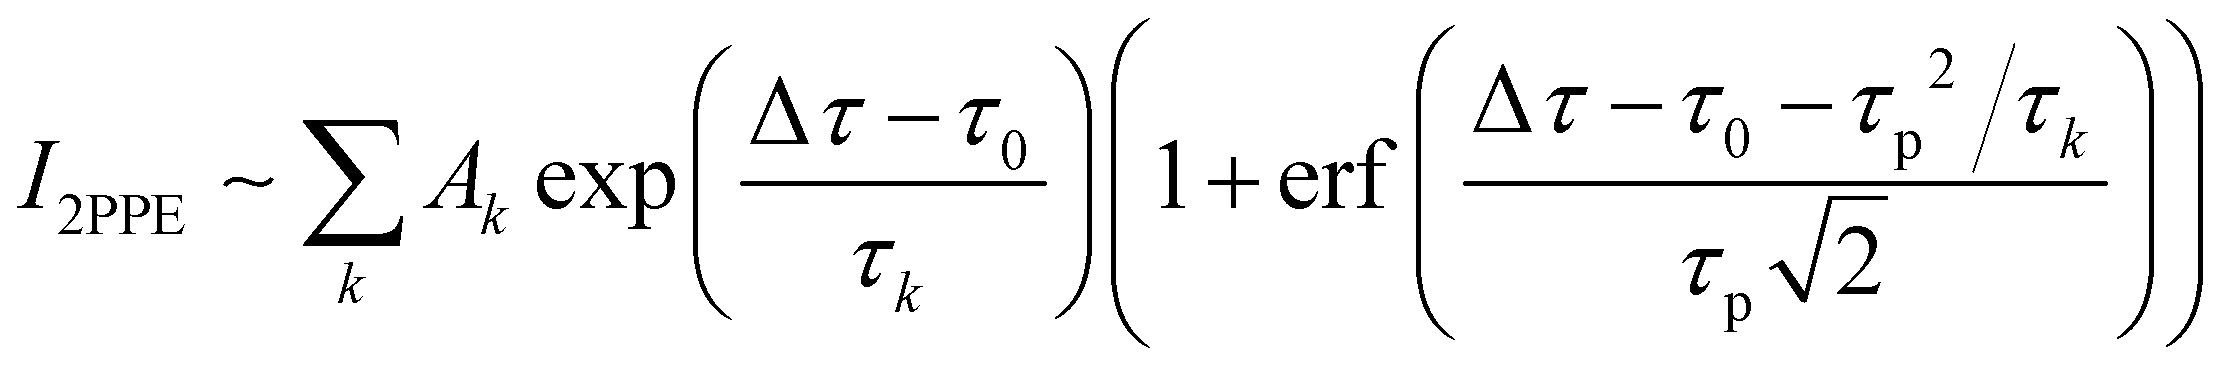 | (1) |
 . This describes, e.g., a Förster resonant transfer (β = 1/2) or a transport of excitons in inhomogeneous films.51,62,75–78 However, Fig. S9 (ESI†) shows that this model deviates strongly for delays Δτ > 10 ps from the experimental data.
 | ||
| Fig. 8 Time-dependent 2PPE signal of the electron energy region Ekin = 1.6 eV. With open circles (o) for as-prepared and crosses (+) for annealed samples. The black line is a four-exponential fit to the as-prepared data points, see Table 1. The inset shows a zoom around τ0, with a rise time of τCX = (74 ± 15) fs. The red and blue arrow mark the corresponding delay times of the spectra shown in Fig. 7. | ||
In Fig. 9 the evaluation of the lifetimes over the entire energy distribution is shown, see Fig. S6–S8 (ESI†) for individual fits, residuals and relative amplitudes. We observe a slight but systematic increase of τ for decreasing Ekin, i.e., for states with larger binding energies. Furthermore, the population decay does not appear to change significantly after annealing, and no significant change in decay times can be measured within the statistical uncertainty. The early formation of charge carriers or the process of their formation is accordingly not changed by annealing. Consequently, the process seems to depend neither on the optimized surface nor on the restructuring of the molecules, but is rather a phenomenon within the conjugated donor–acceptor molecules themselves. Similar observations of a non-existent or only weak effect on the dynamics of the excitonic states by different pre-treatments or post-treatments, such as annealing, have been reported before for conjugated polymers.44,79–82
 | ||
| Fig. 9 Development of the lifetimes deduced from tr-2PPE spectra recorded with λpump = 460 nm and λprobe = 257 nm, in intervals of ΔEkin = 0.1 eV. The data points at Ekin = 2 eV were integrated over ΔEkin = 0.2 eV due to low intensity. (o) For the pristine and (+) for the sample 60 min annealed to 200 °C. τ1 is shown in blue, τ2 in green, and τ3 in purple. The dashed lines represent the ±1σ interval of the fit values. Depicted in grey is the spectrum for the case where both pulses are superimposed in time, see Fig. 7. | ||
In Fig. 6 we suggest possible decay processes for excitation at λpump = 460 nm as probed by λprobe = 257 nm indicated by waved arrows. The pump pulse excites electrons from occupied states near the VBM into higher vibronic levels of the LUMO. The electrons liberated by the probe pulse thus have a kinetic energy of Ekin ≈ 2 eV. These higher excited states decay into energetically lower levels of the LUMO, the energetically lowest is located at EB = −3.3 eV, see Fig. 6. We suggest that the decay from the excited vibronic levels of the LUMO corresponds to the ultrafast decay time τ1 ≈ 100–300 fs at this kinetic energy, see Fig. 9. Electrons emitted from the energetically lowest vibronic LUMO level possess a kinetic energy of about Ekin = 1.6 eV. This state appears to persist for about 1–3 ps and then decays further, as is described by τ2. The longest lifetimes of τ3 ∼ 10 ps are typically attributed to excitonic excitations, as discussed below. Photoelectrons originating from an excitonic or polaronic state appear at kinetic energies in the range of Ekin = 0.5–1 eV for the photon energies employed here, as denoted in Fig. 6 by the black dashed arrow.
After the photoexcitation of the thin film by λpump = 460 nm into the LUMO (or the next higher vibronic replica), an exciton begins to form; this process was summarized recently by Barford.83 Therefore, the multi-exponential decay is a composite result of diverse self-localisation processes, which take place on distinct temporal scales. Within a time frame of 100–200 fs, the self-localization from so-called quasi-extended exciton states to local exciton ground states is primarily induced by coupling to the surrounding environment. Slightly longer up to 10 ps takes the localization due to coupling of the exciton to several bond rotations of the polymer. The next longer lifetime of about τ3 ≈ 10 ps would then already describe the stochastic intrachain diffusion of excitons including skipping and crawling motions. The term “skipping” describes a thermally activated process of a momentarily excited exciton into a more delocalized state before it stochastically collapses again into another chain segment. “Crawling” are adiabatic motions of the entire exciton along a polymer chain. In a more general picture, the local excited state or Frenkel-like exciton is formed, which decays within about a few hundreds of femtoseconds via vibronic coupling into a (intramolecular) charge transfer state with a lifetime of typical a few picoseconds.36,39,84–88 Dias et al. attributed longer lifetimes of about one to two picoseconds to the stabilization of an intramolecular charge transfer state for polyfluorene copolymers.85 Yonezawa et al. recently applied femtosecond transient absorption spectroscopy at an pF8T2 film and proposed an exciton lifetime of about τ = 2.7 ps (absorption at λ = 800 nm) and the existence of a photoexcited donor polaron (absorption at λ = 700 nm) with a millisecond lifetime.15,23,38 In a study of the fluorescence decay of F8T2 dissolved in methylcyclohexane by Rodrigues et al., lifetimes around 20–40 ps were attributed to solvent/conformation relaxation or intramolecular energy transfer from non-ordered to ordered chain segments.67 It is conceivable that these intrachain processes within the film are reduced to a few picoseconds. Thus, the lifetimes τ2 and τ3 observed here are in good agreement with the previously measured picosecond decay processes. In addition, we show an ultrafast initial decay in the range of three hundred femtoseconds for pF8T2. Photoluminescence lifetimes of 38 and 180 ps have been measured by Mbarek et al., both attributed to excitonic excitations.46 In the thin film it is also possible that there are multiple non-radiative additional decay paths. They are in competition to exciton formation. This migration of the exciton likely exhibits a multi-exponential behaviour, and is therefore a parallel process to the longest lifetime represented by tr-2PPE. The approximately 150 ps are on a characteristic timescale for processes including Förster resonant transfer processes.83 The background we subtracted could indicate an extremely long-lived state, much longer than the inverse repetition rate, 1/frep = 2 μs, e.g., long-living polarons as reported earlier.15,23,38,89,90 These states were also observed in several other conjugated polymers and frequently attributed to non-emissive polarons arising within the first hundred femtoseconds in parallel with other photogenerated species, e.g. excitons and charge transfer states.14,91–98
Static 2PPE at 390 nm
We further employed the second harmonic of a Ti:sapphire femtosecond pulsed laser centred around λ = 390 nm (hν = 3.18 eV, τFWHM = 35 fs), to excite the polymer films. In Fig. 10a the dependence of the integrated photoelectron signal on the pulse energy of the p-polarised excitation energy is shown. In double logarithmic representation it is evident that initially the signal shows a cubic dependence. At an excitation pulse energy of EP = 30 nJ (Φ = 0.29 μJ cm−2), a sharp change occurs and a second order dependence was observed. That indicates a saturation of one of the excitation steps. A static photoelectron spectrum for s- and p-polarisation is shown in Fig. 10b, with applied pulse energies corresponding to EP = 3.6 and 4.4 nJ, respectively. The spectrum excited by p-polarised light resembles that excited by the s-polarised light, but is seven times more intense. In both cases the spectrum consists of a peak with a maximum at Ekin = 0.1 eV with a long tail to higher kinetic energies up to just above 1 eV. This intensity differences are partially be explained by different reflections of the exciting light for s- and p-polarisation, being 3.5 times higher for s-polarisation. The difference in intensity presumably results from the fact that p-polarised light can also excite dipole moments vertically orientated to the surface. Nevertheless, for intrachain excitations, the dipole components along the polymer chain usually predominates as, e.g., has been shown for poly(9,9-dioctylfluorene) films (PFO).99 | ||
| Fig. 10 Static and dynamic photoelectron spectroscopy measurements of a pF8T2 thin film. (a) Dependence of the PE signal on the pulse energy. The fit suggests a three-photon process below 30 nJ and a two-photon process for higher pulse energies. (b) PE spectra for p- and s-polarised radiation excited with E = 4.4 and 3.6 nJ, respectively (c) Time-resolved 3PPE measurement obtained with cross-polarised laser pulses at Ekin = 0.49 eV with lifetimes of 122 fs for the left and 166 fs for the right side, for a combined excitation pulse energy of E = 8 nJ. (d) Lifetimes for left (blue) and right (red) side of the tr-3PPE signal for varying electron kinetic energies. | ||
Electrons originating from an occupied level just below the valence band maximum of E − EVac = −5.5 eV, liberated directly by a two-photon process through λ = 390 nm radiation and only including a virtual intermediate state, appear at Ekin = 0.85 eV. At about this energy, an intense shoulder is also observed in Fig. 10b. The peak around Ekin = 0.1eV is likely to contain a large number of secondary electrons, this energy range would also include electrons released with another photon from higher vibronic states of the LUMO, see Fig. 6. The photon energy of hν = 3.18 eV is not sufficient to probe the vibrational lowest level of the LUMO.
Based on Fig. 10a, there should also be a three-photon process. With this process, the LUMO+1 is probably populated by two photons and is probed with a single photon. The blue arrows in Fig. 6 indicate therefore a three-photon process involving the LUMO+1, where the LUMO+1 is populated by two photons from a lower occupied state and is ionized by a third photon. Photoelectrons liberated by this process are associated with a kinetic energy of Ekin = 1 eV.
Time-resolved 2PPE at 390 nm
For recording of the dynamical behaviour of the electronically excited states, cross-polarised laser pulses were employed to avoid coherence artefacts. The photoelectron spectra are evaluated as a function of the delay time between both pulses for a range of Δτ = ±500 fs. The intensities reveal an exponential population decay which is completed within a few hundred femtoseconds. Fig. 10c shows the evolution of the time-resolved photoelectron signal at a kinetic energy of Ekin = 0.49 eV. The data show an asymmetric correlation function. We interpret this observation as two lifetimes depending on the order of the pulses. A slightly longer lifetime of τ = 166 fs is observed when the s-polarised pulse arrives first, and a shorter one of τ = 122 fs for a p-polarised pumping pulse. The evaluation is therefore carried out for the left and right sides of the correlation functions. Separated by time zero, the data points of each side were fitted with a convolution of a Gaussian function (τFWHM = 35 fs), which corresponds to the autocorrelation of the laser pulses, and a single exponential decay. For the decay at negative delays, when the p-pulse arrives first, the decay is completed faster than for the positive delays for all the kinetic energy intervals evaluated. This is presented in Fig. 10d, where the lifetimes are shown vs. the electron kinetic energy in binnings over 200 ToF channels, corresponding to approximately 100 meV steps, which slightly depends on the kinetic energy of the photoelectrons. For both p- and s-polarisation, there is a tendency for the lifetime to decrease with increasing kinetic energy down to about, respectively, 64 fs and 80 fs at Ekin = 1 eV. Furthermore, the two curves show a maximum of 140 fs and 200 fs for a kinetic energy between Ekin = 0.15 and 0.3 eV.The ultrafast lifetimes around Ekin = 1 eV of about τ = 60–80 fs are probably associated with the decay of the LUMO+1, whereas the lifetime of τ = 100–200 fs at low kinetic energy is similar to the decay of energetically higher vibronic states of the LUMO which we identified before also with the time-resolved two-colour experiment, see Fig. 6. The longer lifetime in the configuration of a s-polarised pump and p-polarised probe pulse, can be explained by the experimental set-up, because taken together the in- and out-of-plane components of the p-polarised pulse interrogate a broader distribution of higher vibronic states.
Fluorescence lifetimes
In the time-resolved 2PPE measurements, at least one lifetime far outside the accessible maximum pulse delay range was observed. By means of time-correlated single photon counting (TCSPC), an insight into the radiative transitions with longer lifetimes from the picosecond to the nanosecond range is now covered. Fig. 11 shows the fluorescence decay after excitation with a laser pulse at λ = 400 nm. A triple exponential decay of the fluorescence is observed, both for pristine (τp) thin films as for those which have been annealed (τa). Therefore, we again use a fit function (eqn (1)) which is a convolution of the Gaussian instrumental response function and a triple exponential decay. The shortest lifetime τp1F = (0.15 ± 0.01) ns is of the order of the fourth lifetime τ4 of the time-resolved 2PPE experiment and describes well the long-lived background in the tr-2PPE signal. The next longer lifetime of τp2F = (0.46 ± 0.01) ns is of the typical range for D–A molecules, as is the longest lifetime of τp3F = (1.77 ± 0.07) ns. The shortest lifetime of the annealed thin film τa1F = (0.14 ± 0.01) ns is comparable to the pristine sample. The other lifetimes of the excited states of annealed thin films show values of τa2F = (0.58 ± 0.01) ns and τa3F = (2.42 ± 0.02) ns, a significant longer temporal decay than for the pristine samples. These results thus indicate an extended lifetime of the excited states induced by annealing.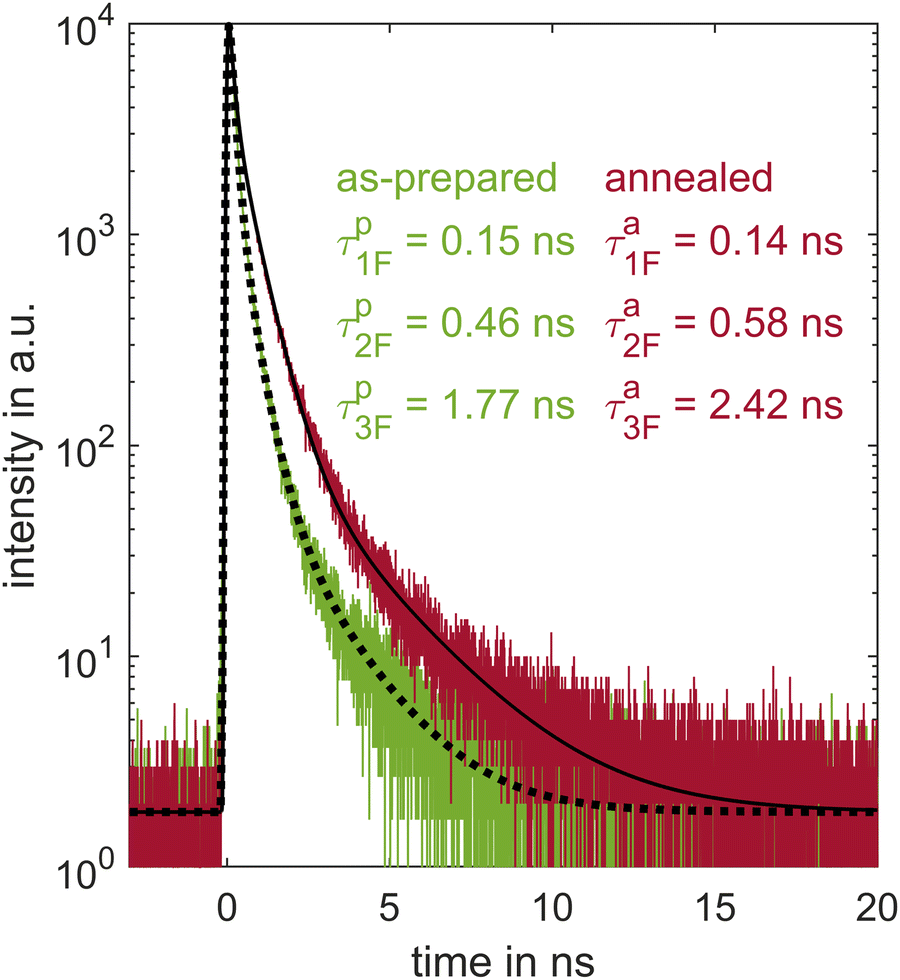 | ||
| Fig. 11 The time evolution of the fluorescence of the pF8T2 thin film shows a threefold exponential decay indicated by the fit in black, resulting in the lifetimes: τp1F = (0.15 ± 0.01) ns, τp2F = (0.46 ± 0.01) and τp3F = (1.77 ± 0.07) ns before and τa1F = (0.14 ± 0.01) ns, τa2F = (0.58 ± 0.01) ns and τa3F = (2.42 ± 0.02) ns after annealing. Lifetimes are corrected by the instrumental response function. | ||
In both cases, the shortest fluorescence component has the strongest relative amplitude weighting within the decay: Ap1F = (87.1 ± 0.1) % and Aa1F = (68.9 ± 0.02) %. The longest lifetime only represents less than 1% of the relative contribution. Nevertheless, its weight doubles from Ap3F = (0.55 ± 0.04) % before annealing to Aa3F = (1.01 ± 0.01) % after annealing. With annealing, the relative amplitude of the intermediate lifetime shows the most significant change from Ap2F = (12.3 ± 0.1) % to Aa2F = (30.1 ± 0.02) %.
A multiple exponential decay is commonly observed for the fluorescence lifetimes in thin film conjugated polymer layers. Because of the often randomly mixed phases, not every lifetime is necessarily uniquely assignable.85 The multi-exponential fit is therefore mostly a phenomenological description but by comparing analogous polymers on the discussed timescales allows for an unambiguous distinction of the predominant processes. Kettner et al. observed biexponential fluorescence decay curves for pF8T2 films.32 They describe a fast decay with a time constant of about τ = 0.3–0.4 ns and a longer one of about τ = 1.1 ns. Both decay constants were rather independent of the excitation wavelength in the range from λ = 550 to 640 nm, which covers the three lowest vibronic states in S1. The short one is assigned to exciton migration towards lower energies and the longer one as a typical decay mechanism in polyfluorene, where the molecular disorder is responsible for diffusion and trapping of excitons.
For the decay with approximately τ1F = 150 ps we addressed already Förster resonance transfer processes in the tr-2PPE section. It is also conceivable to attribute them to a more rapid component of the fluorescent decay, which is associated with self-quenching and leads to a short lifetime.87 This aligns with the observed decreased amplitude A1 after annealing. The second fluorescence lifetime τ2F probably corresponds also to the transport of the generated exciton to lower energy sites. The lifetime of the migrated exciton is about τp3F = (1.77 ± 0.07) ns before and τa3F = (2.42 ± 0.02) ns after annealing. The third lifetime would accordingly correspond to the lifetime of the exciton which should be affected by the quality of the thin film. The data observed show that annealing improves the quality of the film because its lifetime is enhanced, and thus the diffusion length of the exciton increases. This is consistent with the fact that the efficiency of photovoltaic devices is higher after annealing. This hypothesis is in agreement with the interpretation of and Mbarek et al.46 and Gao et al.81 They pointed out that a fast generation but slow recombination is beneficial for the extraction of charge carriers in fluorene and thiophene based polymers. Also Long et al. measured longer photoluminescence lifetimes for a conjugated polymer after annealing, and correlate this with an increasing of the two dimensional exciton diffusion length.100
Conclusions
The occupied and unoccupied states of the pF8T2 thin film on H-terminated silicon substrates were investigated by time-resolved photoelectron spectroscopy, as well as by optical absorption and time-resolved fluorescence spectroscopy. Two deeper lying occupied states at a binding energy of EB = −13.4 eV and −14.9 eV are probably associated with the σ-bonds of the polymer. Three states at EB = −7.5 eV, −8.8 eV and −10.4 eV are typical for π-bonds and finally culminate to the HOMO and HOMO−1 estimated at energies of EB = −5.6 eV and −6.5 eV, respectively. The energetic location of the valence band maximum at EVBM = −5.5 eV is in good agreement with results of cyclic voltammetry. The unoccupied states were investigated by ultraviolet two- and three-photon spectroscopy. In single-colour photoelectron spectroscopy, we were able to identify at least four states A to D, assigning state D to an occupied state, probably related to the HOMO. The state B is energetically located at EBB = −4.3 eV and thus in the range of excitons and polarons. The states A and C are in good agreement with the maxima from the absorption spectra, therefore we correlate them with the LUMO+1 and LUMO, respectively. For the thin film pF8T2 on hydrogen-terminated silicon, an involvement of at least four lifetimes was determined over the energy range measured by photoelectron spectroscopy.We identify ultrafast mechanisms with rise and decay times in the femtosecond and picosecond range, typical for the ultrafast generation and arrangement of the charge carriers in conjugated donor–acceptor polymers. We further attribute an ultrafast process, measured with λ = 390 nm, with a lifetime of about 100 fs to the excitation decay of the LUMO+1. In addition, a lifetime in the range of about 300 fs was observed with two colour tr-2PPE, corresponding to the decay of vibronic levels of the LUMO. A longer lifetime of 1–3 ps, as well as long lifetimes of 10 ps and about 150 ps after 460 nm excitation are attributed to the decay path towards excitonic levels. The fluorescence measurements also show a triple exponential decay. The shortest fluorescence lifetime of τ1F = 140–150 ps corresponds to the longest one measured in photoelectron spectroscopy. Furthermore, lifetimes in the range of τ2F = 0.4–0.7 ns and τ3F = 1.7–2.4 ns show that the excitonic decay process has two different temporal components. It is demonstrated, that annealing has little to no effect on the ultrafast part of charge carrier generation. However, annealing extends the long-lived excitonic decays further and thereby facilitates an improved efficiency of the charge carrier separation, which may have an advantageous effect on the efficiency of photovoltaic devices.
Author contributions
T. R.: optical spectroscopy, tr-2PPE, analysis, writing – original draft, Z. L.: investigation, synthesis, C. W.: investigation, tr-2ppe with Ti:Sa, M. V. C.: TCSPC review and editing, D. G. A.: TCSPC, C. A. S. writing – review and editing, D. Z. conceptualization, funding acquisition, writing – review and editing.; H. Z.: conceptualization, methodology, funding acquisition, writing – review and editing.Conflicts of interest
There are no conflicts to declare.Acknowledgements
The authors thank the Deutsche Forschungsgemeinschaft (PAK 943, Za 110/26-1) and the National and Natural Science Foundation of China (21661132006) for partial financial support. C. A. S. gratefully acknowledges the generous financial support for the acquisition of an “Integrated Confocal Luminescence Spectrometer with Spatiotemporal Resolution and Multiphoton Excitation” (DFG/Land NRW: INST 211/915-1 FUGG; DFG EXC1003: “Berufungsmittel”).References
- A. Salleo, Charge transport in polymeric transistors, Mater. Today, 2007, 10, 38–45 CrossRef CAS.
- C. Wang, H. Dong, W. Hu, Y. Liu and D. Zhu, Semiconducting π-Conjugated Systems in Field-Effect Transistors: A Material Odyssey of Organic Electronics, Chem. Rev., 2012, 112, 2208–2267 CrossRef CAS PubMed.
- H. Sirringhaus, 25th Anniversary Article: Organic Field-Effect Transistors: The Path Beyond Amorphous Silicon, Adv. Mater., 2014, 26, 1319–1335 CrossRef CAS PubMed.
- J. Yao, C. Yu, Z. Liu, H. Luo, Y. Yang, G. Zhang and D. Zhang, Significant Improvement of Semiconducting Performance of the Diketopyrrolopyrrole–Quaterthiophene Conjugated Polymer through Side-Chain Engineering via Hydrogen-Bonding, J. Am. Chem. Soc., 2016, 138, 173–185 CrossRef CAS PubMed.
- X. Guo, Y. Xu, S. Ogier, T. N. Ng, M. Caironi, A. Perinot, L. Li, J. Zhao, W. Tang, R. A. Sporea, A. Nejim, J. Carrabina, P. Cain and F. Yan, Current Status and Opportunities of Organic Thin-Film Transistor Technologies, IEEE Trans. Electron Devices, 2017, 64, 1906–1921 CAS.
- C. Dai, S. Xu, W. Liu, X. Gong, M. Panahandeh-Fard, Z. Liu, D. Zhang, C. Xue, K. P. Loh and B. Liu, Dibenzothiophene- S, S -Dioxide-Based Conjugated Polymers: Highly Efficient Photocatalyts for Hydrogen Production from Water under Visible Light, Small, 2018, 14, 1801839 CrossRef PubMed.
- S. H. Park, A. Roy, S. Beaupré, S. Cho, N. Coates, J. S. Moon, D. Moses, M. Leclerc, K. Lee and A. J. Heeger, Bulk heterojunction solar cells with internal quantum efficiency approaching 100%, Nat. Photonics, 2009, 3, 297–302 CrossRef CAS.
- B. Fan, D. Zhang, M. Li, W. Zhong, Z. Zeng, L. Ying, F. Huang and Y. Cao, Achieving over 16% efficiency for single-junction organic solar cells, Sci. China: Chem., 2019, 62, 746–752 CrossRef CAS.
- Y. Cui, H. Yao, J. Zhang, T. Zhang, Y. Wang, L. Hong, K. Xian, B. Xu, S. Zhang, J. Peng, Z. Wei, F. Gao and J. Hou, Over 16% efficiency organic photovoltaic cells enabled by a chlorinated acceptor with increased open-circuit voltages, Nat. Commun., 2019, 10, 2515 CrossRef PubMed.
- A. Roozbeh, M. de, J. Bassi, A. B. Pereira, L. S. Roman, T. Buckup and I. A. Heisler, Energy Transfer in Aqueously Dispersed Organic Semiconductor Nanoparticles, J. Phys. Chem. C, 2020, 124, 27946–27953 CrossRef CAS.
- H. Sirringhaus, R. J. Wilson, R. H. Friend, M. Inbasekaran, W. Wu, E. P. Woo, M. Grell and D. D. C. Bradley, Mobility enhancement in conjugated polymer field-effect transistors through chain alignment in a liquid-crystalline phase, Appl. Phys. Lett., 2000, 77, 406–408 CrossRef CAS.
- H. Sirringhaus, Device Physics of Solution-Processed Organic Field-Effect Transistors, Adv. Mater., 2005, 17, 2411–2425 CrossRef CAS.
- L.-L. Chua, J. Zaumseil, J.-F. Chang, E. C.-W. Ou, P. K.-H. Ho, H. Sirringhaus and R. H. Friend, General observation of n-type field-effect behaviour in organic semiconductors, Nature, 2005, 434, 194–199 CrossRef CAS PubMed.
- Y. Y. Deng and H. Sirringhaus, Optical absorptions of polyfluorene transistors, Phys. Rev. B: Condens. Matter Mater. Phys., 2005, 72, 045207 CrossRef.
- T. Yasuda, K. Yonezawa, M. Ito, H. Kamioka, L. Han and Y. Moritomo, Photovoltaic Properties and Charge Dynamics in Nanophase-Separated F8T2/PCBM Blend Films, J. Photopolym. Sci. Technol., 2012, 25, 271–276 CrossRef CAS.
- Y. Moritomo, T. Yasuda, K. Yonezawa, T. Sakurai, Y. Takeichi, H. Suga, Y. Takahashi, N. Inami, K. Mase and K. Ono, Fullerene mixing effect on carrier formation in bulk-hetero organic solar cell, Sci. Rep., 2015, 5, 9483 CrossRef CAS PubMed.
- P. B. Pati, G. Damas, L. Tian, D. L. A. Fernandes, L. Zhang, I. B. Pehlivan, T. Edvinsson, C. M. Araujo and H. Tian, An experimental and theoretical study of an efficient polymer nano-photocatalyst for hydrogen evolution, Energy Environ. Sci., 2017, 10, 1372–1376 RSC.
- L. Martelo, T. das Neves, J. Figueiredo, L. Marques, A. Fedorov, A. Charas, M. Berberan-Santos and H. Burrows, Towards the Development of a Low-Cost Device for the Detection of Explosives Vapors by Fluorescence Quenching of Conjugated Polymers in Solid Matrices, Sensors, 2017, 17, 2532 CrossRef PubMed.
- P. Zhang, W. Yi, H. Xu, C. Gao, J. Hou, W. Jin, Y. Lei and X. Hou, Supramolecular interactions of poly[(9,9-dioctylfluorenyl-2,7-diyl)-co-thiophene] with single-walled carbon nanotubes, Nanotechnol. Rev., 2018, 7, 487–495 CrossRef CAS.
- T. Ma, N. Song, B. Liu, J. Ren, H. Zhang and D. Lu, Effect of External Electric Field on Poly[(9,9-dioctylfluorenyl-2,7-diyl)-alt-co-(bithiophene)] Chain Orderness, Morphology, and Carrier Mobility in Different Condensation Processes, J. Phys. Chem. C, 2019, 123, 13993–14002 CrossRef CAS.
- M. de, J. Bassi, L. Wouk, W. Renzi, C. K. Oliveira, J. L. Duarte, I. A. Heisler and L. S. Roman, Non-radiative energy transfer in aqueously dispersed polymeric nanoparticles for photovoltaic applications, Synth. Met., 2021, 275, 116740 CrossRef.
- M. D. J. Bassi, M. Araujo Todo Bom, M. L. Terribile Budel, E. Maltempi De Souza, M. Müller Dos Santos and L. S. Roman, Optical Biosensor for the Detection of Infectious Diseases Using the Copolymer F8T2 with Application to COVID-19, Sensors, 2022, 22, 5673 CrossRef CAS PubMed.
- K. Yonezawa, M. Ito, H. Kamioka, T. Yasuda, L. Han and Y. Moritomo, Charge-Transfer State and Charge Dynamics in Poly(9,9′-dioctylfluorene-co-bithiophene) and [6,6]-Phenyl C70-butyric Acid Methyl Ester Blend Film, Appl. Phys. Express, 2011, 4, 122601 CrossRef.
- O. Fenwick, C. V. Dyck, K. Murugavel, D. Cornil, F. Reinders, S. Haar, M. Mayor, J. Cornil and P. Samorì, Modulating the charge injection in organic field-effect transistors: fluorinated oligophenyl self-assembled monolayers for high work function electrodes, J. Mater. Chem. C, 2015, 3, 3007–3015 RSC.
- A. Salleo, M. L. Chabinyc, M. S. Yang and R. A. Street, Polymer thin-film transistors with chemically modified dielectric interfaces, Appl. Phys. Lett., 2002, 81, 4383–4385 CrossRef CAS.
- X. Xu, E. Zhu, L. Bian, Z. Wang, J. Wang, Z. Zhuo, J. Wang, F. Zhang and W. Tang, Luminescent and photovoltaic properties of poly(9,9-dioctylfluorene-co-bithiophene) in organic electronic devices, Chin. Sci. Bull., 2012, 57, 970–975 CrossRef CAS.
- S. T. Duong and M. Fujiki, The origin of bisignate circularly polarized luminescence (CPL) spectra from chiral polymer aggregates and molecular camphor: anti-Kasha's rule revealed by CPL excitation (CPLE) spectra, Polym. Chem., 2017, 8, 4673–4679 RSC.
- J. Wade, J. N. Hilfiker, J. R. Brandt, L. Liirò-Peluso, L. Wan, X. Shi, F. Salerno, S. T. J. Ryan, S. Schöche, O. Arteaga, T. Jávorfi, G. Siligardi, C. Wang, D. B. Amabilino, P. H. Beton, A. J. Campbell and M. J. Fuchter, Natural optical activity as the origin of the large chiroptical properties in π-conjugated polymer thin films, Nat. Commun., 2020, 11, 6137 CrossRef CAS PubMed.
- M. D. Ward, J. Wade, X. Shi, J. Nelson, A. J. Campbell and M. J. Fuchter, Highly Selective High-Speed Circularly Polarized Photodiodes Based on π-Conjugated Polymers, Adv. Opt. Mater., 2022, 10, 2101044 CrossRef CAS.
- L. Minion, J. Wade, J. M. Moreno-aranjo, S. Ryan, G. Siligardi and M. J. Fuchter, Insights into the origins of inverted circular dichroism in thin films of a chiral side chain polyfluorene, Chirality, 2023, 35, 817–825 CrossRef CAS PubMed.
- Y. Garcia-Basabe, N. A. D. Yamamoto, L. S. Roman and M. L. M. Rocco, The effect of thermal annealing on the charge transfer dynamics of a donor–acceptor copolymer and fullerene: F8T2 and F8T2:PCBM, Phys. Chem. Chem. Phys., 2015, 17, 11244–11251 RSC.
- O. Kettner, A. Pein, G. Trimmel, P. Christian, C. Röthel, I. Salzmann, R. Resel, G. Lakhwani, F. Lombeck, M. Sommer and B. Friedel, Mixed side-chain geometries for aggregation control of poly(fluorene-alt-bithiophene) and their effects on photophysics and charge transport, Synth. Met., 2016, 220, 162–173 CrossRef CAS.
- K. Sakamoto, T. Yasuda, K. Miki, M. Chikamatsu and R. Azumi, Anisotropic field-effect hole mobility of liquid crystalline conjugated polymer layers formed on photoaligned polyimide films, J. Appl. Phys., 2011, 109, 013702 CrossRef.
- P. L. Santos, L. A. Cury, F. B. Dias and A. P. Monkman, Spectroscopic studies of different poly3hexylthiophene chain environments in a polyfluorene matrix, J. Lumin., 2016, 172, 118–123 CrossRef CAS.
- I.-W. Hwang, C. Soci, D. Moses, Z. Zhu, D. Waller, R. Gaudiana, C. J. Brabec and A. J. Heeger, Ultrafast Electron Transfer and Decay Dynamics in a Small Band Gap Bulk Heterojunction Material, Adv. Mater., 2007, 19, 2307–2312 CrossRef CAS.
- N. Banerji, S. Cowan, M. Leclerc, E. Vauthey and A. J. Heeger, Exciton Formation, Relaxation, and Decay in PCDTBT, J. Am. Chem. Soc., 2010, 132, 17459–17470 CrossRef CAS PubMed.
- A. Ruseckas and I. D. W. Samuel, Exciton self-trapping in MEH-PPV films studied by ultrafast emission depolarization, Phys. Status Solidi C, 2006, 3, 263–266 CrossRef CAS.
- K. Yonezawa, M. Ito, H. Kamioka, T. Yasuda, L. Han and Y. Moritomo, Carrier Formation Dynamics of Organic Photovoltaics as Investigated by Time-Resolved Spectroscopy, Adv. Opt. Technol, 2012, 316045 Search PubMed.
- P. Roy, A. Jha, V. B. Yasarapudi, T. Ram, B. Puttaraju, S. Patil and J. Dasgupta, Ultrafast bridge planarization in donor–π–acceptor copolymers drives intramolecular charge transfer, Nat. Commun., 2017, 8, 1716 CrossRef PubMed.
- L. Bogner, Z. Yang, S. Baum, M. Corso, R. Fitzner, P. Bäuerle, K. J. Franke, J. I. Pascual and P. Tegeder, Electronic States and Exciton Dynamics in Dicyanovinyl-Sexithiophene on Au(111), J. Phys. Chem. C, 2016, 120, 27268–27275 CrossRef CAS.
- A. Suzuki, H. Suzuki, H. Maruhashi, S. Banya, T. Akiyama and T. Oku, Effect of annealing on photovoltaic properties and microstructure of conventional and inverted organic solar cells using active bilayer based on liquid-crystal semiconducting polymer and fullerene, Int. J. Energy Res., 2014, 38, 1541–1550 CrossRef CAS.
- P. Dumas, Y. J. Chabal and P. Jakob, Morphology of hydrogen-terminated Si(111) and Si(100) surfaces upon etching in HF and buffered-HF solutions, Surf. Sci., 1992, 269–270, 867–878 CrossRef CAS.
- N. F. Kleimeier, D. K. Bhowmick and H. Zacharias, Femtosecond Electron Dynamics in Dye-Functionalized 6H-SiC(0001), J. Phys. Chem. C, 2015, 119, 27489–27495 CrossRef CAS.
- T. Reiker, Z. Liu, C. Winter, N. F. Kleimeier, D. Zhang and H. Zacharias, Dynamics in Electronically Excited States of Diketopyrrolopyrrole–Thiophene Conjugated Polymer Thin Films, J. Phys. Chem. C, 2021, 125, 5572–5580 CrossRef CAS.
- E. Agosti, M. Rivola, V. Hernandez, M. D. Zoppo and G. Zerbi, Electronic and dynamical effects from the unusual features of the Raman spectra of oligo and polythiophenes, Synth. Met., 1999, 100, 101–112 CrossRef CAS.
- M. Mbarek, M. M. Almoneef, Y. ben Saleh and K. Alimi, Organic optoelectronic copolymer involving PVK and F8T2: synthesis and characterization, Spectrochim. Acta, Part A, 2021, 252, 119509 CrossRef CAS PubMed.
- D. Muenmart, A. B. Foster, A. Harvey, M.-T. Chen, O. Navarro, V. Promarak, M. C. McCairn, J. M. Behrendt and M. L. Turner, Conjugated Polymer Nanoparticles by Suzuki-Miyaura Cross-Coupling Reactions in an Emulsion at Room Temperature, Macromolecules, 2014, 47, 6531–6539 CrossRef CAS.
- E. Lim, B.-J. Jung, M. Chikamatsu, R. Azumi, K. Yase, L.-M. Do and H.-K. Shim, Synergistic effect of polymer and oligomer blends for solution-processable organic thin-film transistors, Org. Electron., 2008, 9, 952–958 CrossRef CAS.
- G. Damas, C. F. N. Marchiori and C. M. Araujo, On the Design of Donor–Acceptor Conjugated Polymers for Photocatalytic Hydrogen Evolution Reaction: First-Principles Theory-Based Assessment, J. Phys. Chem. C, 2018, 122, 26876–26888 CrossRef CAS.
- T. Ma, Z. Wang, C. Song, N. Song, J. Ren, B. Liu, H. Zhang, H. Zhang and D. Lu, J-Aggregate Behavior of Poly[(9,9-dioctyluorenyl-2,7-diyl)-alt-co-(bithiophene)] (F8T2) in Crystal and Liquid Crystal Phases, J. Phys. Chem. C, 2019, 123, 24321–24327 CrossRef CAS.
- H. J. Eggimann, F. Le Roux and L. M. Herz, How β-Phase Content Moderates Chain Conjugation and Energy Transfer in Polyfluorene Films, J. Phys. Chem. Lett., 2019, 10, 1729–1736 CrossRef CAS PubMed.
- H. Bässler and B. Schweitzer, Site-Selective Fluorescence Spectroscopy of Conjugated Polymers and Oligomers, Acc. Chem. Res., 1999, 32, 173–182 CrossRef.
- N. J. Hestand and F. C. Spano, Expanded Theory of H- and J-Molecular Aggregates: The Effects of Vibronic Coupling and Intermolecular Charge Transfer, Chem. Rev., 2018, 118, 7069–7163 CrossRef CAS PubMed.
- J. Huang, C. Yang, Z. Ho, D. Kekuda, M. Wu, F. Chien, P. Chen, C. Chu and K. Ho, Annealing effect of polymer bulk heterojunction solar cells based on polyfluorene and fullerene blend, Org. Electron., 2009, 10, 27–33 CrossRef CAS.
- K. Koiwai, H. Kajii and Y. Ohmori, Effects of film morphology on ambipolar transport in top-gate-type organic field-effect transistors using poly(9,9-dioctylfluorene-co-bithiophene), Synth. Met., 2011, 161, 2107–2112 CrossRef CAS.
- L. Kinder, J. Kanicki and P. Petroff, Structural ordering and enhanced carrier mobility in organic polymer thin film transistors, Synth. Met., 2004, 146, 181–185 CrossRef CAS.
- E. T. Niles, J. D. Roehling, H. Yamagata, A. J. Wise, F. C. Spano, A. J. Moulé and J. K. Grey, J-Aggregate Behavior in Poly-3-hexylthiophene Nanofibers, J. Phys. Chem. Lett., 2012, 3, 259–263 CrossRef CAS.
- J. D. Roehling, I. Arslan and A. J. Moulé, Controlling microstructure in poly(3-hexylthiophene) nanofibers, J. Mater. Chem., 2012, 22, 2498–2506 RSC.
- F. C. Spano, Modeling disorder in polymer aggregates: the optical spectroscopy of regioregular poly(3-hexylthiophene) thin films, J. Chem. Phys., 2005, 122, 234701 CrossRef PubMed.
- T. Li, B. Liu, H. Zhang, J. Ren, Z. Bai, X. Li, T. Ma and D. Lu, Effect of conjugated polymer poly (9,9-dioctylfluorene) (PFO) molecular weight change on the single chains, aggregation and β phase, Polymer, 2016, 103, 299–306 CrossRef CAS.
- Z. Bai, Y. Liu, T. Li, X. Li, B. Liu, B. Liu and D. Lu, Quantitative Study on β-Phase Heredity Based on Poly(9,9-dioctylfluorene) from Solutions to Films and the Effect on Hole Mobility, J. Phys. Chem. C, 2016, 120, 27820–27828 CrossRef CAS.
- A. L. T. Khan, P. Sreearunothai, L. M. Herz, M. J. Banach and A. Köhler, Morphology-dependent energy transfer within polyfluorene thin films, Phys. Rev. B: Condens. Matter Mater. Phys., 2004, 69, 085201 CrossRef.
- J. Clark, C. Silva, R. H. Friend and F. C. Spano, Role of Intermolecular Coupling in the Photophysics of Disordered Organic Semiconductors: Aggregate Emission in Regioregular Polythiophene, Phys. Rev. Lett., 2007, 98, 206406 CrossRef PubMed.
- G. Jo, J. Jung and M. Chang, Controlled Self-Assembly of Conjugated Polymers via a Solvent Vapor Pre-Treatment for Use in Organic Field-Effect Transistors, Polymers, 2019, 11, 332 CrossRef PubMed.
- G. Nagarjuna, M. Baghgar, J. A. Labastide, D. D. Algaier, M. D. Barnes and D. Venkataraman, Tuning Aggregation of Poly(3-hexylthiophene) within Nanoparticles, ACS Nano, 2012, 6, 10750–10758 CrossRef CAS PubMed.
- Y. Yuan, J. Shu, P. Liu, Y. Zhang, Y. Duan and J. Zhang, Study on π–π Interaction in H- and J-Aggregates of Poly(3-hexylthiophene) Nanowires by Multiple Techniques, J. Phys. Chem. B, 2015, 119, 8446–8456 CrossRef CAS PubMed.
- R. F. Rodrigues, A. Charas, J. Morgado and A. Maçanita, Self-Organization and Excited-State Dynamics of a Fluorene-Bithiophene Copolymer (F8T2) in Solution, Macromolecules, 2010, 43, 765–771 CrossRef CAS.
- I. Riisness and M. J. Gordon, Electronic structure disorder, vibronic coupling, and charge transfer excitons in poly(fluorene-alt-bithiophene):fullerene films, Appl. Phys. Lett., 2013, 102, 113302 CrossRef.
- F. C. Spano, The Spectral Signatures of Frenkel Polarons in H- and J-Aggregates, Acc. Chem. Res., 2010, 43, 429–439 CrossRef CAS PubMed.
- H. Yamagata, N. J. Hestand, F. C. Spano, A. Köhler, C. Scharsich, S. T. Hoffmann and H. Bässler, The red-phase of poly[2-methoxy-5-(2-ethylhexyloxy)-1,4-phenylenevinylene] (MEH-PPV): a disordered HJ-aggregate, J. Chem. Phys., 2013, 139, 114903 CrossRef PubMed.
- F. Dou, J. Li, H. Men and X. Zhang, Controlling Molecule Aggregation and Electronic Spatial Coherence in the H-Aggregate and J-Aggregate Regime at Room Temperature, Polymers, 2020, 12, 786 CrossRef CAS PubMed.
- L. Wang and L. Rothberg, Complications in the Interpretation of F8T2 Spectra in Terms of Morphology, J. Phys. Chem. B, 2021, 125, 5660–5666 CrossRef CAS PubMed.
- M. Kurban, The effects of a single atom substitution and temperature on electronic and photophysical properties F8T2 organic material, Bilge Int. J. Sci. Technol. Res., 2019, 3, 40–44 CrossRef.
- G. Han and Y. Yi, Origin of Photocurrent and Voltage Losses in Organic Solar Cells, Adv. Theory Simul., 2019, 2, 1900067 CrossRef.
- G. Williams and D. C. Watts, Non-symmetrical dielectric relaxation behaviour arising from a simple empirical decay function, Trans. Faraday Soc., 1970, 66, 80–85 RSC.
- J. G. Müller, J. M. Lupton, J. Feldmann, U. Lemmer, M. C. Scharber, N. S. Sariciftci, C. J. Brabec and U. Scherf, Ultrafast dynamics of charge carrier photogeneration and geminate recombination in conjugated polymer:fullerene solar cells, Phys. Rev. B: Condens. Matter Mater. Phys., 2005, 72, 195208 CrossRef.
- N. P. Wells, B. W. Boudouris, M. A. Hillmyer and D. A. Blank, Intramolecular Exciton Relaxation and Migration Dynamics in Poly(3-hexylthiophene), J. Phys. Chem. C, 2007, 111, 15404–15414 CrossRef CAS.
- K. M. Gaab and C. J. Bardeen, Wavelength and Temperature Dependence of the Femtosecond Pump−Probe Anisotropies in the Conjugated Polymer MEH-PPV: Implications for Energy-Transfer Dynamics, J. Phys. Chem. B, 2004, 108, 4619–4626 CrossRef CAS.
- M. K. Charyton, T. Reiker, K. Kotwica, M. Góra, H. Zacharias and N. D. Boscher, Unsubstituted thiophene–diketopyrrolopyrrole conjugated polymer thin films via oxidative chemical vapor deposition – electronic behavior, Mater. Adv., 2023, 4, 2625–2635 RSC.
- J. M. Hodgkiss, A. R. Campbell, R. A. Marsh, A. Rao, S. Albert-Seifried and R. H. Friend, Subnanosecond Geminate Charge Recombination in Polymer-Polymer Photovoltaic Devices, Phys. Rev. Lett., 2010, 104, 177701 CrossRef PubMed.
- B.-R. Gao, J.-F. Qu, Y. Wang, Y.-Y. Fu, L. Wang, Q.-D. Chen, H.-B. Sun, Y.-H. Geng, H.-Y. Wang and Z.-Y. Xie, Femtosecond Spectroscopic Study of Photoinduced Charge Separation and Recombination in the Donor–Acceptor Co-Oligomers for Solar Cells, J. Phys. Chem. C, 2013, 117, 4836–4843 CrossRef CAS.
- R. Hu, Z. Liu, J. Zhang, L. Tian, G. Wang, J. Chen, K. He and R. Wang, Morphology optimization and charge characteristics in PM6-based solar cells via ternary solvent processing, J. Mater. Sci.: Mater. Electron., 2022, 33, 5370–5379 CrossRef CAS.
- W. Barford, Exciton dynamics in conjugated polymer systems, Front. Phys., 2022, 10, 1004042 CrossRef.
- M. Scarongella, A. Laktionov, U. Rothlisberger and N. Banerji, Charge transfer relaxation in donor–acceptor type conjugated materials, J. Mater. Chem. C, 2013, 1, 2308 RSC.
- F. B. Dias, S. King, A. P. Monkman, I. I. Perepichka, M. A. Kryuchkov, I. F. Perepichka and M. R. Bryce, Dipolar Stabilization of Emissive Singlet Charge Transfer Excited States in Polyfluorene Copolymers, J. Phys. Chem. B, 2008, 112, 6557–6566 CrossRef CAS PubMed.
- C. Lin, T. Kim, J. D. Schultz, R. M. Young and M. R. Wasielewski, Accelerating symmetry-breaking charge separation in a perylenediimide trimer through a vibronically coherent dimer intermediate, Nat. Chem., 2022, 14, 786–793 CrossRef CAS PubMed.
- N. Banerji, Sub-picosecond delocalization in the excited state of conjugated homopolymers and donor–acceptor copolymers, J. Mater. Chem. C, 2013, 1, 3052 RSC.
- I. Hwang and G. D. Scholes, Electronic Energy Transfer and Quantum-Coherence in π-Conjugated Polymers, Chem. Mater., 2011, 23, 610–620 CrossRef CAS.
- P. Ravirajan, S. A. Haque, J. R. Durrant, D. Poplavskyy, D. D. C. Bradley and J. Nelson, Hybrid nanocrystalline TiO2 solar cells with a fluorene–thiophene copolymer as a sensitizer and hole conductor, J. Appl. Phys., 2004, 95, 1473–1480 CrossRef CAS.
- P. Ravirajan, S. A. Haque, D. Poplavskyy, J. R. Durrant, D. D. C. Bradley and J. Nelson, Nanoporous TiO2 solar cells sensitised with a fluorene–thiophene copolymer, Thin Solid Films, 2004, 451–452, 624–629 CrossRef CAS.
- G. Grancini, M. Maiuri, D. Fazzi, A. Petrozza, H.-J. Egelhaaf, D. Brida, G. Cerullo and G. Lanzani, Hot exciton dissociation in polymer solar cells, Nat. Mater., 2013, 12, 29–33 CrossRef CAS PubMed.
- P. B. Miranda, D. Moses and A. J. Heeger, Ultrafast photogeneration of charged polarons in conjugated polymers, Phys. Rev. B: Condens. Matter Mater. Phys., 2001, 64, 081201 CrossRef.
- E. L. Frankevich, A. A. Lymarev, I. Sokolik, F. E. Karasz, S. Blumstengel, R. H. Baughman and H. H. Hörhold, Polaron-pair generation in poly(phenylene vinylenes), Phys. Rev. B: Condens. Matter Mater. Phys., 1992, 46, 9320–9324 CrossRef CAS PubMed.
- J. W. P. Hsu, M. Yan, T. M. Jedju, L. J. Rothberg and B. R. Hsieh, Assignment of the picosecond photoinduced absorption in phenylene vinylene polymers, Phys. Rev. B: Condens. Matter Mater. Phys., 1994, 49, 712–715 CrossRef CAS PubMed.
- M. Yan, L. J. Rothberg, F. Papadimitrakopoulos, M. E. Galvin and T. M. Miller, Spatially indirect excitons as primary photoexcitations in conjugated polymers, Phys. Rev. Lett., 1994, 72, 1104–1107 CrossRef CAS PubMed.
- E. M. Conwell and H. A. Mizes, Photogeneration of polaron pairs in conducting polymers, Phys. Rev. B: Condens. Matter Mater. Phys., 1995, 51, 6953–6958 CrossRef CAS PubMed.
- P. J. Brown, D. S. Thomas, A. Köhler, J. S. Wilson, J.-S. Kim, C. M. Ramsdale, H. Sirringhaus and R. H. Friend, Effect of interchain interactions on the absorption and emission of poly(3-hexylthiophene), Phys. Rev. B: Condens. Matter Mater. Phys., 2003, 67, 064203 CrossRef.
- T. G. Bjorklund, S.-H. Lim and C. J. Bardeen, Use of Picosecond Fluorescence Dynamics as an Indicator of Exciton Motion in Conjugated Polymers: Dependence on Chemical Structure and Temperature, J. Phys. Chem. B, 2001, 105, 11970–11977 CrossRef CAS.
- S. Xu, V. I. Klimov, B. Kraabel, H. Wang and D. W. McBranch, Femtosecond transient absorption study of oriented poly(9,9-dioctylfluorene) film: hot carriers, excitons, and charged polarons, Phys. Rev. B: Condens. Matter Mater. Phys., 2001, 64, 193201 CrossRef.
- Y. Long, G. J. Hedley, A. Ruseckas, M. Chowdhury, T. Roland, L. A. Serrano, G. Cooke and I. D. W. Samuel, Effect of Annealing on Exciton Diffusion in a High Performance Small Molecule Organic Photovoltaic Material, ACS Appl. Mater. Interfaces, 2017, 9, 14945–14952 CrossRef CAS PubMed.
Footnote |
| † Electronic supplementary information (ESI) available: Cross correlation of laser pulses, details of data processing in one and two-colour photoelectron spectroscopy. See DOI: https://doi.org/10.1039/d3cp00502j |
| This journal is © the Owner Societies 2024 |