
Spherulite-enhanced macroscopic polarization in molecular ferroelectric films from vacuum deposition†
Bibek
Tiwari
 a,
Yuanyuan
Ni
a,
Jackson
Savage
b,
Ellen
Daugherty
c,
Bharat
Giri
a,
Xin
Li
a and
Xiaoshan
Xu
*ad
a,
Yuanyuan
Ni
a,
Jackson
Savage
b,
Ellen
Daugherty
c,
Bharat
Giri
a,
Xin
Li
a and
Xiaoshan
Xu
*ad
aDepartment of Physics and Astronomy, University of Nebraska-Lincoln, Nebraska 68588, USA. E-mail: xiaoshan.xu@unl.edu
bDepartment of Physics, University of Chicago, Illinois 60637, USA
cDepartment of Chemistry, The College of Wooster, Ohio 44691, USA
dDepartment of Physics and Astronomy and the Nebraska Center for Materials and Nanoscience, University of Nebraska-Lincoln, Lincoln, Nebraska 68588, USA
First published on 11th June 2024
Abstract
Proton-transfer type molecular ferroelectrics hold significant promise for practical application due to their large spontaneous polarizations, high Curie temperatures, and small switching fields. However, it remains puzzling that preparation of quasi-2D films exhibiting macroscopic ferroelectric behaviors has been reported in only few molecular ferroelectrics. To address this puzzle, we studied the impact of microstructures on the macroscopic ferroelectric properties of 5,6-dichloro-2-methylbenzimidazole (DC-MBI) films grown using the low-temperature deposition followed by the restrained crystallization (LDRC) method. Our findings revealed a competition between dense spherulites and porous microstructures containing randomly oriented nanograins in the as-grown films. Post-growth annealing at moderate temperature promotes the formation of spherulites, leading to macroscopic ferroelectric polarization switching. These results underscore the critical role of microstructure density in determining macroscopic ferroelectric properties, potentially resolving the puzzle for the absence of such behavior in many molecular ferroelectric films. We anticipate that the approach proposed in this study to enhance microstructure density will significantly advance the fabrication of quasi-2D molecular ferroelectric films and unlock their potential in device applications.
I. Introduction
Potential benefits of utilizing organic ferroelectric materials carry significant implications across various applications. Notably, their remarkable dielectric, pyroelectric, and piezoelectric properties, on par with those observed in conventional inorganic ferroelectrics, position them as promising contenders for actuators, transducers and pyroelectric detectors.1–4 Moreover, their environmentally friendly attributes stand in stark contrast to the prevalent use of lead and rare-metal ferroelectrics in today's technology landscape.Proton-transfer type ferroelectrics of molecular crystals, compared with other organic ferroelectrics, offer distinct advantages, including low coercivity (∼10 kV cm−1) and large spontaneous polarizations.5 In particular, croconic acid exhibits a spontaneous polarization around 30 μC cm−2,6 which is on par with prototype inorganic ferroelectric BaTiO3. The presence of hydrogen bonds, responsible for cohesion in proton-transfer molecular ferroelectrics, allows spontaneous polarization to persist up to the melting temperature, typically exceeding 400 K,5,7,8 which is comparable to the Curie temperature of BaTiO3.
The application potential of organic ferroelectrics hinges on viable thin-film fabrication approaches that preserve their ferroelectric properties. However, the growth of quasi-2D films of molecular ferroelectrics seems to conflict with the crystallization process,9,10 which is essential for establishing ferroelectric order. The conflict arises because molecular crystals tend to form 3D structures due to their weak interactions with most inorganic substrates. Recently, a method called low-temperature deposition followed by restrained crystallization (LDRC) has emerged as a promising route. It allows control over film crystallization while maintaining the quasi-2D morphology. For instance, when applied to methylbenzimidazole (MBI),11 LDRC results in quasi-2D highly-oriented dense spherulites that exhibit single-crystal-level ferroelectric properties. On the other hand, croconic acid films typically consist of porous microstructures with randomly oriented nanograins.12 Although ferroelectric polarization switching has been routinely demonstrated for individual grains,13,14 achieving it with macroscopic electrodes in croconic acid films remains rare.15 Therefore, beyond considering quasi-2D morphology and crystallization, understanding the optimal microstructure for ferroelectric behavior and developing strategies to achieve it are critical questions.
To address these questions, we turn our attention to 5,6-dichloro-2-methylbenzimidazole (DC-MBI), a proton-transfer type ferroelectric with spontaneous polarization approximately 10 μC cm−2 (at 373 K).6,16 As shown in Fig. 1(a), DC-MBI crystallizes in a Pca21 structure in which the molecules form a chain-like structure connected by the N–H⋯N hydrogen bonds.6 The spontaneous polarization is along the c axis, which corresponds to the chain direction. Note that the melting point of DC-MBI is about 250 °C, positioning it between those of MBI (≈175 °C) and croconic acid (≈300 °C).17–19 Therefore, we anticipate that DC-MBI films will exhibit microstructure characteristics from both MBI (dense spherulites) and croconic acid (porous randomly oriented nanograins). Indeed, employing the LDRC method [Fig. 1(b)], we observe a competition between spherulites and the porous microstructure of randomly oriented nanograins. Furthermore, post-deposition annealing at moderate temperature promotes the formation of spherulites, resulting in well-defined ferroelectric switching loops and enhanced dielectric constants.
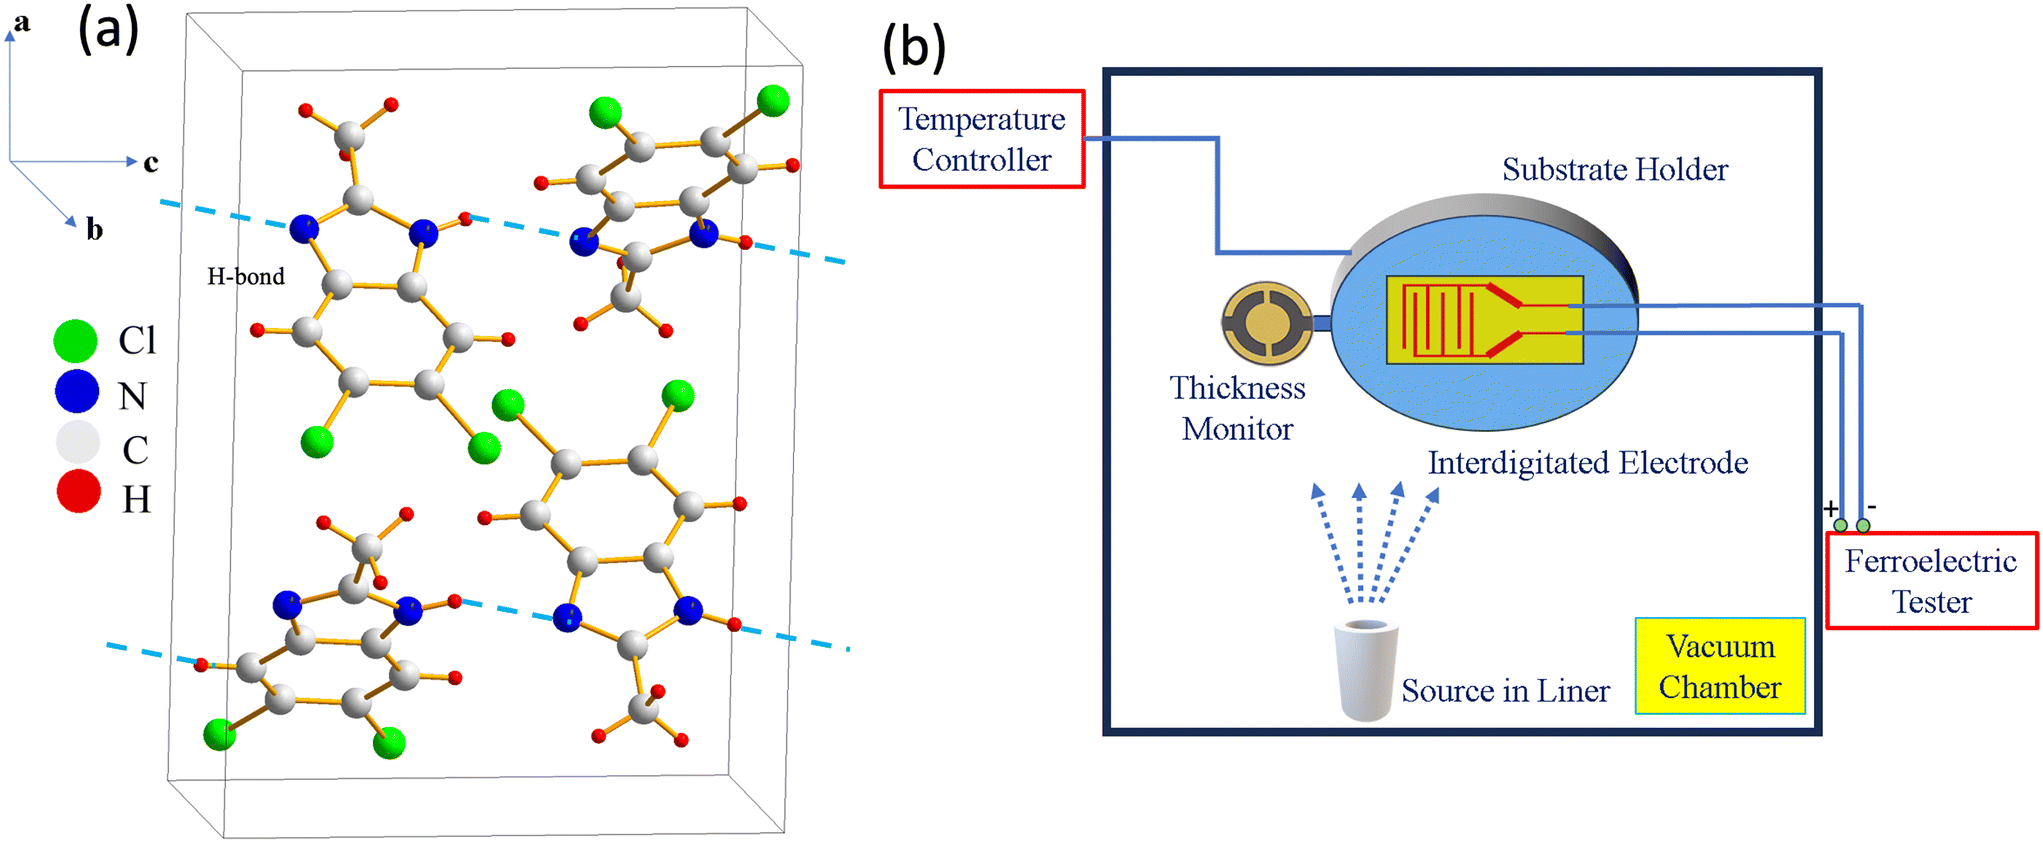 | ||
| Fig. 1 (a) The unit cell of the DC-MBI crystal structure with hydrogen bonding pointed along the c-axis shown in dotted form. (b) The schematic experimental setup for the low-temperature deposition – cooling conditions are maintained through the continuous supply of liquid nitrogen. | ||
II. Results and discussion
Growth of DC-MBI films
We first determine the effect of substrate temperature on the formation of spherulites. Fig. 2(a–f) show the laser microscopy images for the DC-MBI films (for powder sample morphology via SEM and TEM, see Fig. S1†). These films were deposited on sapphire substrates in high vacuum, at various substrate temperatures Ts with a nominal thickness of 1 μm. The warming process was gradual (∼0.2 K per minute) until reaching room temperature. At Ts = 294 K [Fig. 2(a)], the most prominent features in the image are the disk-shaped structures (highlighted by the box). These disks have an approximate diameter of 100 μm and a thickness of 1.0 ± 0.6 μm (for statistics at other Ts see Table S1 in the ESI†). We refer to these as type-I features. In addition, dendric-shaped features are visible. Notably, the large white area in the image remains uncovered by the film. As we decrease Ts to ≤273 K, another disk-shaped feature emerges alongside type-I. This one has a thickness of 2.0 ± 1.2 μm. We label it type-II (see Fig. 2(b)). When Ts drops below 173 K, both type-I and type-II features persist, but the substrates become fully covered, as indicated by the extensive grey area. Fig. 2(g) shows the area coverage as functions of thickness. Overall, coverage of both type-I and type-II features diminishes for both low and high Ts. Interestingly, the maximum coverage for type-II occurs at higher Ts compared to that of type-I. | ||
| Fig. 2 Laser microscope images for the sample with a 1 μm thickness on (001) sapphire at various substrate temperatures: 294 K (a), 273 K (b), 223 K (c), 198 K (d), 183 K (e), and 173 K (f). At 163 K and below, we find the optical morphology like (f). (g) Percentage coverage of spherulites, dendrites and other regions for different Ts samples. (h and i) Close-up laser microscope images for type-I and type-II features. | ||
The type-I feature appears to be spherulites. Fig. 2(h) provides a closed-up view of the type-I feature in Fig. 2(b). On top of the circular shape are ring-like bands evenly spaced around the center, following a radial direction. These rings are a typical characteristic of spherulites resulting from rhythmic growth.20,21 On the other hand, the type-II feature in Fig. 2(i), while also circular, appears more porous, with fluffy boundaries and lacking the distinct rings, which is consistent with spherical dendrites.22 The ordered nature of the type-I feature is further confirmed by the scanning electron microscopy (SEM) images shown in Fig. S2.† In contrast, the background grey area in Fig. 2(f) shows no sign of order.
The Ts dependence, as shown in the images in Fig. 2(a–f), can be understood in terms of spherulite and dendrite nucleation. When Ts is below 173 K, the sticking coefficient23 during the deposition is high, resulting in full film coverage. Nucleation of spherulites and dendrites occurs as the films warm up to room temperature. The disk shape arises due to the constraint imposed by the film morphology during the low temperature deposition.11 Conversely, when Ts exceeds 173 K, the sticking coefficient decreases. The reduction means that nucleation of spherulites and dendrites is important for the film coverage. Typically, spherulite growth requires large supersaturation and slow growth speed21 compared to the dendrites. This is consistent with the observation that the Ts for the maximum coverage of the spherulite is lower than that of spherical dendrites in Fig. 2(g). Therefore, we decided that the optimal substrate temperature for promoting the spherulite growth is Ts = 183 K.
Next, we study the effect of film thickness at a substrate temperature Ts of 183 K. To assess the ferroelectric properties, the substrates were pre-patterned with Pt interdigital electrodes (IDEs). Fig. 3(a–d) display the optical images of the films on IDEs (similar morphology observed on the Au/Si substrate, Fig. S3†) with crossed polarizers of various film thicknesses. In this setup, the light path involves the 1st polarizer, the film, followed by the 2nd polarizer. When the film is optically isotropic, no light passes through the 2nd polarizer, resulting in a dark image. On the other hand, if the film has in-plane anisotropy, it can rotate the light polarization, leading to non-zero transmission through the 2nd polarizer, unless the light's polarization aligns precisely with the film's optical axis. Spherulites consists of fiber crystallites aligned radially. The optical axes predominantly run parallel or perpendicular to the fiber, causing rotation of light's polarization, except when the radial direction aligns with either polarizer's axes. This phenomenon gives rise to the characteristic Maltese cross, a hallmark feature of spherulites,21 as clearly observed for the type-I feature in Fig. 3(a–d). Here, the axes of the maximum intensity form a 45° angle with both polarizers' axes. In contrast, the type-II feature exhibits substantially weaker light intensity than the type-I feature and does not show the Maltese cross. This aligns with its less-ordered structure. Finally, the background area, referred to as the type-III feature, shows minimal light intensity, indicative of a highly disordered nature. Additionally, the XPS measurement (Fig. S4†) qualitatively reveals a similar bonding environment for both the powder and film samples.
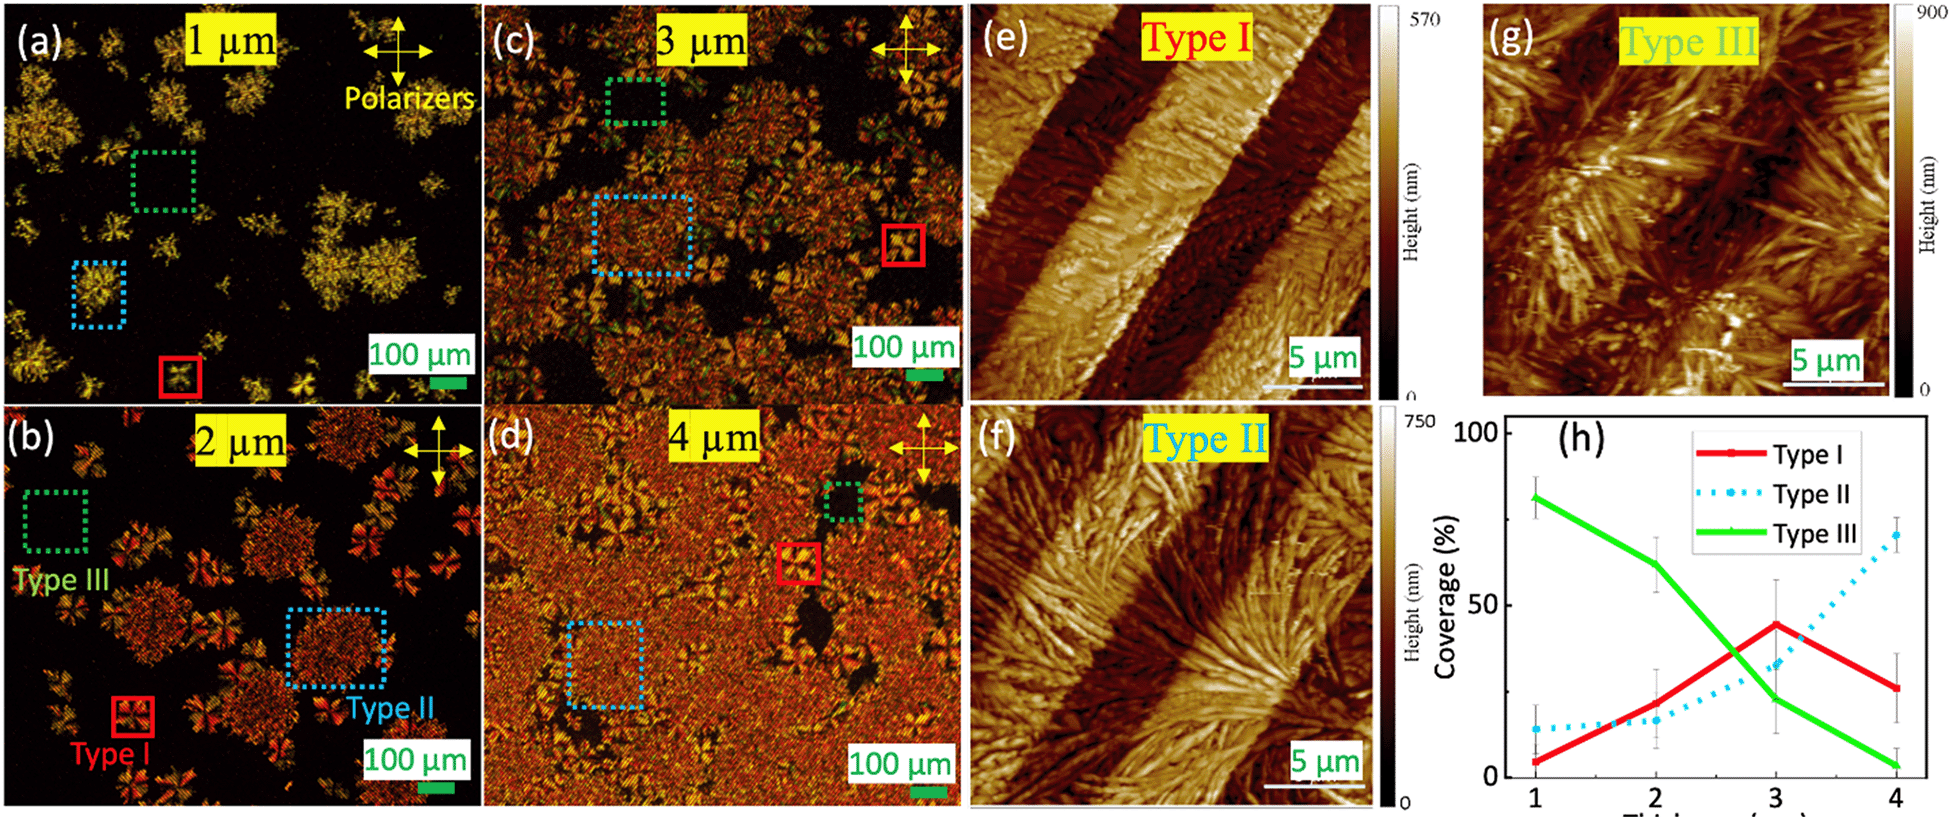 | ||
| Fig. 3 (a–d) Crossed polarized images over IDE substrates for thicknesses of 1 μm, 2 μm, 3 μm and 4 μm, respectively. (e–g) The AFM images over the IDE for type-I, type-II and type-III features. (h) The thickness dependence of the three typical areas labeled as I (spherulite), II and III in Fig. 2(b). | ||
We confirm the microstructure order of these features using atomic force microscopy (AFM), as depicted in Fig. 3(e–g). In these images, one can discern the step (approximately 200 nm) and the periodicity (around 10 μm) of the IDE. From type-I to type-III, the disorder increases. The type-I feature [Fig. 3(e)] consists of well-aligned crystallite fibers densely packed together. In comparison, in the type-II feature [Fig. 3(f)], the fibers are less aligned, resulting in a porous structure. However, there is still a discernable alignment direction in the image. For the type-III area [Fig. 3(g)], the fibers are randomly oriented, leading to even greater porosity. As a consequence, the area becomes optically isotropic, consistent with the minimal light intensity observed for the type-III feature in Fig. 3(a–d). Additionally, we can infer the disorders and porosity from the roughness of the AFM images measured within the IDE digits. Specifically, the root-mean-square roughness is approximately 30 nm, 70 nm, and 100 nm for the type-I, type-II, and type-III regions, respectively. Therefore, there is a clear correlation between the brightness observed in the crossed-polarizer optical images, the microstructure density/porosity, and the order of the crystallite fibers.
Fig. 3(h) shows how the coverage of the different feature types depends on film thickness. As the thickness increases, the coverage of the type-II feature increases monotonically, while the type-III area consistently reduces. In particular, at 4 μm thickness, the majority of the area is occupied by both type-I and type-II features, with the less-ordered type-II feature prevailing.
Annealing and electrical study of the films
Previous work on MBI11 revealed that single-crystal-level ferroelectric properties were obseved in films consisting of spherulites. To increase the population of spherulites, which is the most ordered microstructures among the three types of features, we carried out annealing on the film samples. During this process, the samples were gradually (approximately 0.2 K per minute) warmed up in the atmosphere from room temperature to 353 K and kept at 353 K for 2.5 hours. Fig. 4(a and b) are optical images (from different areas) of a 4 μm film before and after the annealing, respectively, with crossed polarizers. After the annealing, most of the area in the image is covered by the Maltese cross, indicating dominance by the type-I feature (spherulites). In other words, the presence of the type-II and type-III features was significantly reduced. Additionally, the Maltese crosses observed after the annealing [Fig. 4(b)] are often much larger than those before annealing [Fig. 4(a)], approaching the sizes of the type-II features in Fig. 4(a). This suggests that the type-II feature may have achieved better fiber order and transformed into spherulites similar to the type-I feature. Further insight into the annealing effect can be gleaned from the AFM images. Fig. 4(c) shows an area of densely packed fibers in the type-I feature. After the annealing [Fig. 4(d)], the fibers appeared noticeably longer, likely due to merging. More importantly, the alignment (or order) became more obvious. | ||
| Fig. 4 Effects of annealing DC-MBI films. (a and b) Cross polarized images of the 4 μm grown sample on a bare IDE substrate before and after annealing (not on exact same area but has typical behavior) at 80 °C respectively. (c and d) AFM images of a part of the spherulite before and after annealing. (e) XRD patterns for the powder and as-grown 1 μm, 2 μm, 3 μm, 4 μm, and 4 μm annealed samples; all data are consistently collected for 1 h on Bruker's D8. | ||
Specular θ–2θ X-ray diffraction (XRD) provides insights into the preferred crystalline orientations of the films (for comparison with powder and simulation, see Fig. S1d†). These orientations clearly changes with thickness, as shown in Fig. 4(e). For the 1 μm film, despite the weak diffraction intensity, the most well-defined peaks are (210) and (311). Interestingly, the (010) peak, nearly invisible for the powder sample, is now discernable. Consequently, for the 1 μm film, the (010) direction appears to be the preferred out-of-plane direction. The (010) peak becomes well-defined for the 2 μm and 3 μm films, although the relative intensity decreases with the film thickness. For the 4 μm film, the (010) peak disappears. In contrast, the (002) peak, initially very weak in the powder sample, grows stronger with the film thickness. This suggests that the (001) orientation is preferred for the thicker films. For the 4 μm film after annealing, the (002) peak is still strong, maintaining the (001) orientation as the preferred orientation.
Therefore, annealing clearly enhances the order of the crystallite fibers and overall density of the microstructure. This improvement is anticipated to positively impact the macroscopic ferroelectric properties of the DC-MBI films, as discussed below.
The in situ measurement of polarization–voltage (P–V) relation sheds light on how the microstructure impacts the macroscopic ferroelectric properties. At Ts = 183 K, the P–V relation is linear (for comparison with different thicknesses, see Fig. S5†), indicating behavior akin to a typical capacitor. In Fig. 5(a), the capacitances are plotted as functions of thickness for various films. The analysis based on the partial capacitance model24 results in dielectric constants εDC-MBI = 2.7 for DC-MBI and εSubstrate = 5.4 for the IDE. Notably, the value for DC-MBI is close to that for amorphous MBI (2.93),11 which is a factor of 30 less than the value for MBI single crystals. Therefore, DC-MBI films at Ts =183 K is most likely in an amorphous phase.
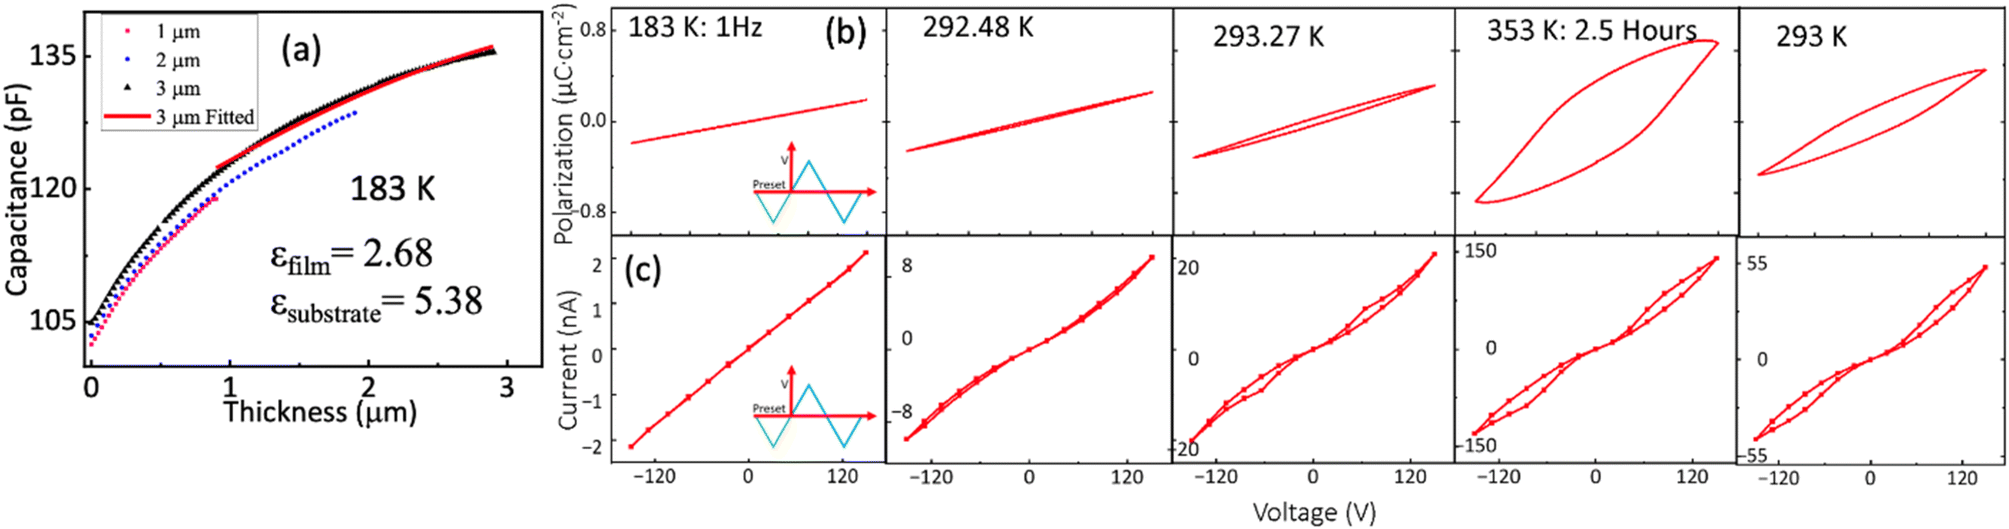 | ||
| Fig. 5 (a) Thickness dependence of IDE capacitive response at 183 K in the paraelectric phase; the graph is fitted based on the parallel capacitance model of the IDE with the validation of the necessary criterion.24 (b) IDE device trend during various stages of annealing from 183 K to 353 K and back to room temperature for electrical polarization and current (c). | ||
The effect of annealing (0.2 K per minute from room temperature to 353 K) becomes evident in Fig. 5(b) for a 4 μm film. Before annealing, the P–V relation at room temperature (294 K) has a visible but minimal opening, attributed to the limited order shown in Fig. 5(b). After annealing at 353 K for 2.5 hours, the loop opens further. This suggests that the transformation from more disordered microstructures to spherulites drives the macroscopic ferroelectric behavior in DC-MBI (for the local microscopic ferroelectric domain and poling results, see Fig. S6 and S7†). Even upon cooling back to room temperature (294 K), the P–V loop remains open, confirming that this behavior primarily arises from the irreversible process of microstructure ordering. The remanent polarization at 294 K after cooling, measured using the PUND method at 0.5 Hz for the 4 μm thick sample, is approximately 0.2 μC cm−2.
The current–voltage (I–V) relationship in Fig. 5(c), along with the resistance measured at 150 V (Fig. 6), reveals a large change of resistance at transition temperature. During the deposition at Ts = 183 K, the I–V relation is linear but with a small slope. This corresponds to the large (approximately 100 GΩ) resistance of the insulating dielectrics between IDEs. As the film warms up, the I–V relation exhibits current peaks superimposed on a linear background. These current peaks are consistent with the polarization switching; the slope of the linear background is the inverse of resistance, which decreases during the annealing processes. At 353 K after 2.5 hour annealing, the resistance drops to approximately 1 GΩ, a two-orders-of-magnitude decrease compared to the value at 183 K for the amorphous phase. However, the subtle structrual transition occurs at ∼293 K, as indicated by capacitance, resistance, and remanence measurements (Fig. 6). Here, the resistance drops to approximately 7 GΩ. This large resistance change is consistent with the amorphous-to-spherulite transition observed in MBI films. After cooling down to 294 K and below, the resistance remains consistently low (≈10 GΩ), confirming the irreversible microstructure ordering process.
 | ||
| Fig. 6 The remanent polarization (a), capacitance (b) and resistance (c) as a function of temperature showing the structural phase transition at 293 K. The inset on a and b, respectively, show the changes in Pr and Capacitance during the annealing process. The thickness of the sample is 4 μm, and the resistance is extracted from I–V curves at 150 V. | ||
Discussion
The formation of spherulites in thin films depends on two critical conditions: (1) a large driving force which can result from supercooling or supersaturation and (2) slow kinetics due to interface-controlled growth.21 The large driving force can be realized at low deposition temperature, which is also necessary for (1) reducing the diffusion so that a quasi-2D morphology can be formed and (2) increasing the sticking coefficient so that high film coverage can be achieved.On the flip side, using a low deposition temperature may significantly slow down the spherulite growth to an impractical time scale. Consequently, post-deposition annealing becomes essential. The optimal annealing temperature is determined by the crystal growth speed which reaches a maximum at an intermediate temperature Tmax. This maximum occurs because the growth is slow both at low temperature (due to the slow diffusion) and at high temperature (due to the small driving force). Previous work indicates that T < Tmax favors spherulite growth, while T > Tmax promotes larger 3D single crystals.21 Hence, the annealing temperature should satisfy T < Tmax. In this work, besides the annealing described in Fig. 5 and 6, we also experimented at higher annealing temperature (Fig. S8†), but the results indicate either growth of larger crystals or re-evaporation of film materials, leading to the destruction of the quasi-2D morphology.
The comprehensive microscopy techniques employed in this study, including optical microscopy, crossed-polarizer optical microscopy, SEM, and AFM, provide valuable insights into how the macroscopic polarization of the films depends on their microstructure. At deposition temperature, the amorphous phase dominates, which is expected to exhibit a paraelectric behavior. After deposition, as the film warms up to room temperature and crystallizes, the porous spherical dendrites become dominant. The effect of porosity on macroscopic polarization can be demonstrated using a double layer model (Fig. S9†).25 This model reveals significantly reduced dielectric constants and polarization compared to the single crystal. The post-deposition annealing is crucial for converting disordered porous microstructures into dense spherulites. These spherulites are expected to exhibit a dielectric constant and remanent polarization that are close to the single crystal values. However, the maximum Pr found (approximately 0.2 μC cm−2) is still substantially lower than that of the single crystals. One possible reason is that the polar (001) axis is mostly aligned along the out-of-plane direction [Fig. 4(e)], while the P–V measurements are in-plane.
Ultimately, not all materials exhibit spherulite growth.21 However, we can summarize some general guidelines for processes that optimizes macroscopic ferroelectric properties: (1) low-temperature deposition for the quasi-2D morphology and amorphous phase and (2) post-growth annealing at moderate temperature for controlled crystallization. This process leads to dense microstructures without breaking the quasi-2D morphology. The critical insight from this study lies in recognizing the importance of achieving high microstructure density.
Conclusion
Our investigation focused on the growth of DC-MBI films using the LDRC method, varying deposition temperatures and thicknesses, and post-deposition annealing. We observed a diverse mix of microstructures, including dense spherulites, porous spherical dendrites, and even more porous randomly oriented fibers. Even with the deposition temperature optimized for spherulite populations, thicker films predominantly exhibited spherical dendrites. However, annealing at a moderate temperature transforms these dendrites into spherulites, which then demonstrate macroscopic ferroelectric polarization switching. The relatively small remanent polarization can be attributed to the preferred orientation of the polar axis along the out-of-plane direction while the measurements are in-plane. These results underscore the significance of microstructure density alongside the quasi-2D morphology in the fabricating films with desirable macroscopic ferroelectric properties. The approach we have established here, i.e., low-temperature deposition followed by controlled crystallization at moderate temperature, is likely applicable to most molecular ferroelectric films.Methods
We deposited micrometer thick DC-MBI films using Angstrom Engineering's physical vapor deposition system (EvoVac) within a vacuum setting (∼10−7 Torr) under thermal evaporation. The modified tool's schematic diagram is shown in Fig. 1. Deposition at reduced pressure enabled us to reach the sublimation point (∼130 °C) before the melting point (∼240 °C) of DC-MBI, achieving an average deposition rate of ∼0.48 A s−1. These films were deposited on glass substrates with Pt interdigitated electrodes (IDEs) (G-IDEPT5, Metrohm, US) with a period of 10 μm (gap of 4 μm) (Fig. S10†). The electrodes were connected to a Radiant Precision RT66C ferroelectric tester system for real-time in situ electrical measurements. The deposition was carried out at room temperature and at various cryogenic temperatures controlled using a Lakeshore temperature control system with liquid nitrogen circulation to attain cryogenic conditions. A quartz crystal monitor (QCM) integrated into the deposition system continuously monitored the real-time film thickness. The actual thickness was calibrated later using a couple of test deposited samples, deviating from the nominal thickness by ∼100 nm. The spherulitic characteristics of the samples were assessed using a reflective cross-polarized Nikon Eclipse L200N microscope. Micro-scale topographical features were examined using a Keyence laser scanning microscope, while nano-scale features were investigated using a ScanAsyst PeakForce Tapping Mode on a Bruker Icon atomic force microscope (AFM). Post-processing annealing of samples in an ambient environment was conducted using a 1200 °C furnace oven. Bruker's D8 2D detector was used as the diffractometer.Data availability
Data available on request from the authors.Conflicts of interest
There are no conflicts to declare.Acknowledgements
This research was primarily supported by the U.S. Department of Energy (DOE), Office of Science, Basic Energy Sciences (BES), under Award No. DE-SC0019173. The work was also supported in part by the Nebraska Center for Energy Sciences Research (NCESR). The research was performed in part at the Nebraska Nanoscale Facility: National Nanotechnology Coordinated Infrastructure and the Nebraska Center for Materials and Nanoscience, which are supported by the NSF under Grant No. ECCS-2025298 and the Nebraska Research Initiative.References
- M. Owczarek, K. A. Hujsak and D. P. Ferris, et al., Flexible ferroelectric organic crystals, Nat. Commun., 2016, 7 DOI:10.1038/ncomms13108.
- W. Gao, L. Chang and H. Ma, et al., Flexible organic ferroelectric films with a large piezoelectric response, NPG Asia Mater., 2015, 7(6) DOI:10.1038/am.2015.54.
- R. Sugano, Y. Hirai and T. Tashiro, et al., Ultrathin flexible memory devices based on organic ferroelectric transistors, Jpn. J. Appl. Phys., 2016, 55(10) DOI:10.7567/JJAP.55.10TA04.
- X. Jiang, H. Lu and Y. Yin, et al., Room temperature ferroelectricity in continuous croconic acid thin films, Appl. Phys. Lett., 2016, 109(10) DOI:10.1063/1.4962278.
- S. Horiuchi, K. Kobayashi, R. Kumai and S. Ishibashi, Proton tautomerism for strong polarization switching, Nat. Commun., 2017, 8 DOI:10.1038/ncomms14426.
- S. Horiuchi, Y. Tokunaga and G. Giovannetti, et al., Above-room-temperature ferroelectricity in a single-component molecular crystal, Nature, 2010, 463(7282), 789–792, DOI:10.1038/nature08731.
- W. Zhong, R. D. King-Smith and D. Vanderbilt, Giant LO-TO splittings in perovskite ferroelectrics, Phys. Rev. Lett., 1994, 72(22), 3618–3621, DOI:10.1103/PhysRevLett.72.3618.
- R. D. King-Smith and D. Vanderbilt, First-principles investigation of ferroelectricity in perovskite compounds, Phys. Rev. B: Condens. Matter Mater. Phys., 1994, 49(9), 5828–5844, DOI:10.1103/PhysRevB.49.5828.
- Y. Neria and R. Neugebauer, Bulk Crystal Growth: Basic Techniques, and Growth Mechanisms and Dynamics, 2007, vol. 121, Accessed February 14, 2024, http://www.sciencedirect.com:5070/book/9780444633033/handbook-of-crystal-growth Search PubMed.
- T. Nishinaga, P. Rudolph and T. Kuech, Handbook of crystal growth, 2015, Accessed February 14, 2024, https://books.google.com/books/about/Handbook_of_Crystal_Growth_2E.html?id=Sr_wrQEACAAJ Search PubMed.
- Y. Yuan, Y. Ni, X. Jiang, Y. Yun, J. Li and X. Xu, Highly Oriented Organic Ferroelectric Films with Single-Crystal-Level Properties from Restrained Crystallization, Cryst. Growth Des., 2022, 22(4), 2124–2131, DOI:10.1021/acs.cgd.1c01176.
- Y. Yuan, X. Jiang, S. Poddar and X. Xu, Electric-field assisted nucleation processes of croconic acid films, CrystEngComm, 2019, 21(48), 7460–7467, 10.1039/c9ce01493d.
- S. Mohapatra, E. Beaurepaire, W. Weber, M. Bowen, S. Boukari and V. Da Costa, Accessing nanoscopic polarization reversal processes in an organic ferroelectric thin film, Nanoscale, 2021, 13(46), 19466–19473, 10.1039/D1NR05957B.
- S. Mohapatra, V. Da Costa and G. Avedissian, et al., Robust ferroelectric properties of organic croconic acid films grown on spintronically relevant substrates, Mater. Adv., 2020, 1(3), 415–420, 10.1039/d0ma00147c.
- L. Hu, R. Feng and J. Wang, et al., Space-Charge-Stabilized Ferroelectric Polarization in Self-Oriented Croconic Acid Films, Adv. Funct. Mater., 2018, 28(11), 1705463, DOI:10.1002/ADFM.201705463.
- S. Horiuchi, F. Kagawa and K. Hatahara, et al., Above-room-temperature ferroelectricity and antiferroelectricity in benzimidazoles, Nat. Commun., 2012, 3 DOI:10.1038/ncomms2322.
- 2-Methylbenzimidazole, 98%, Thermo Scientific Chemicals, Quantity: 5 g | Fisher Scientific, Accessed February 14, 2024, https://www.fishersci.com/shop/products/2-methylbenzimidazole-98-thermo-scientific-1/AC126330050 Search PubMed.
- 5,6-Dichloro-2-methylbenzimidazole 98.0%, TCI America, Quantity: 1 g | Fisher Scientific, Accessed February 14, 2024. https://www.fishersci.com/shop/products/5-6-dichloro-2-methylbenzimidazole-tci-america-2/D34885G Search PubMed.
- Croconic acid 98 488-86-8, Accessed February 14, 2024, https://www.sigmaaldrich.com/US/en/product/aldrich/391700 Search PubMed.
- B. Crist and J. M. Schultz, Polymer spherulites: A critical review, Prog. Polym. Sci., 2016, 56, 1–63, DOI:10.1016/J.PROGPOLYMSCI.2015.11.006.
- A. G. Shtukenberg, Y. O. Punin, E. Gunn and B. Kahr, Spherulites, Chem. Rev., 2012, 112(3), 1805–1838, DOI:10.1021/CR200297F/ASSET/CR200297F.FP.PNG_V03.
- J. A. Dantzig and M. Rappaz. Solidification, 2nd edn, 2016, Accessed February 14, 2024, https://press.uchicago.edu/ucp/books/book/distributed/S/bo110496959.html Search PubMed.
- I. Langmuir, J. Am. Chem. Soc., 1916, 38(11), 2221–2295, DOI:10.1021/ja02268a002.
- R. Igreja and C. J. Dias, Analytical evaluation of the interdigital electrodes capacitance for a multi-layered structure, Sens. Actuators, A, 2004, 112(2–3), 291–301, DOI:10.1016/j.sna.2004.01.040.
- Y. Yun, P. Buragohain and A. S. Thind, et al., Spontaneous Polarization in an Ultrathin Improper-Ferroelectric/Dielectric Bilayer in a Capacitor Structure at Cryogenic Temperatures, Phys. Rev. Appl., 2022, 18(3), 034071, DOI:10.1103/PHYSREVAPPLIED.18.034071/FIGURES/4/MEDIUM.
Footnote |
| † Electronic supplementary information (ESI) available. See DOI: https://doi.org/10.1039/d4ce00417e |
| This journal is © The Royal Society of Chemistry 2024 |