
 Open Access Article
 This Open Access Article is licensed under a Creative Commons Attribution-Non Commercial 3.0 Unported Licence
Integration of a model-driven workflow into an industrial pharmaceutical facility: supporting process development of API crystallisation†
Thomas
Pickles
 a,
Vaclav
Svoboda
b,
Ivan
Marziano
c,
Cameron J.
Brown
a and
Alastair J.
Florence
*a
a,
Vaclav
Svoboda
b,
Ivan
Marziano
c,
Cameron J.
Brown
a and
Alastair J.
Florence
*a
aCMAC Future Manufacturing Research Hub, Technology and Innovation Centre, The University of Strathclyde, Glasgow, G1 1RD, UK. E-mail: alastair.florence@strath.ac.uk
bChemical Research and Development, Worldwide Research and Development, Pfizer, Groton, Connecticut, USA
cPfizer R&D UK Limited, Ramsgate Road, Sandwich CT13 9NJ, UK
First published on 29th July 2024
Abstract
Developing crystallisation processes in the pharmaceutical industry is material and resource intensive due to the large design space, i.e. many different process parameters and combinations thereof. Furthermore, small scale experimental results don't necessarily translate when volume is scaled up due to changes in liquid flow, mixing and heat transfer surface area. However, indications that knowledge-driven resource reduction on a small scale is possible and results may be worth investigating at larger scales. Therefore, this study presents and evaluates a knowledge-driven workflow which achieves its goal of reducing the necessary resources previously required to develop a crystallisation process suitable for commercial manufacture in a pharmaceutical setting. By following this workflow, thermodynamic and isothermal kinetic data for the cooling crystallization of (3S,5R)-3-(aminomethyl)-5-methyl-octanoic acid (PD-299685) within an 8-week timeframe were obtained. Moreover, the workflow was expanded to include isothermal kinetic parameters from a 50-fold scaled-up cooling crystallisation, as well as antisolvent and seeded crystallisation of PD-299685. The systematic and standardised data collection facilitated by this workflow enabled the design and optimisation of the PD-299685 crystallisation process. The proposed scalable industrial crystallisation route for PD-299685 combines cooling and antisolvent techniques, offering a wide metastable zone width to facilitate speck-free filtration and effective seeding. This approach allows for control over product quality, resulting in particles with a desired aspect ratio of 0.766 and a d(v,90) value of 234 μm through wet milling. These parameters align with the proposed API material target specifications for solid oral dosage form quality, specifically oral bioavailability and content uniformity, and efficient drug product manufacture all whilst demonstrating a significant reduction in material usage.
1. Introduction
The use of crystallisation in the pharmaceutical industry fulfils several roles including purification and particle engineering. It serves as a purification technique to eliminate impurities, ensuring that drug products comply with regulatory requirements.1,2 Additionally, crystallisation can be employed for particle engineering by modifying solid-state characteristics such as polymorphism3 and physical properties such as shape and size. These differences in properties can impact bioavailability, downstream processing and drug product manufacturing.4(3S,5R)-3-(Aminomethyl)-5-methyl-octanoic acid (PD-299685) had been clinically evaluated for the reduction of hot flashes associated with menopause as a replacement for hormone replacement therapy.5 PD-299685 as the final product comes from a complex many-step synthesis where previous crystallisation routes included cooling crystallisation in 50![[thin space (1/6-em)]](https://www.rsc.org/images/entities/char_2009.gif) :50 water/isopropanol or 50:50 water/ethanol by volume.6 Given that the final crystallization had been the object of previous development efforts, this study set out to assess whether novel, workflow-based approaches to crystallization development would lead either to a more efficient process compared to that previously published, or the faster identification of a comparable process.
:50 water/isopropanol or 50:50 water/ethanol by volume.6 Given that the final crystallization had been the object of previous development efforts, this study set out to assess whether novel, workflow-based approaches to crystallization development would lead either to a more efficient process compared to that previously published, or the faster identification of a comparable process.
Typical workflows for developing crystallisation processes consist of solubility and metastable zone width (MSZW) measurements to find a suitable solvent that primarily gives a high yield and high throughput/low process mass intensity (PMI) within safe operating temperatures and the desired polymorph. Once a solvent system and crystallization type is chosen then various experiments can be performed, generally at 50–100 mL scale, to determine most kinetic parameters and whether seeding or other process controls, such as milling, are necessary to control additional product attributes such as purity or particle size. Process development and optimisation are usually carried out following known domain relationships and chemistry intuition, or by design of experiments (DoE).7 A step-by-step workflow to assist with consistent data collection for the early stages of process understanding has been developed,8 as shown in Fig. 1. Execution of the workflow produces a comprehensive dataset of thermodynamic and kinetic parameters for cooling crystallisation via isothermal experiments. The workflow consists of:
 | ||
| Fig. 1 Schematic diagram of the workflow for crystallisation data collection, adapted from ref. 8. *Minimum of 3–4 data points must be used for reliable estimates of R2 values. For some solvent systems, this may not be achievable as qualitative solubility can still be used to eliminate potential solvents. | ||
1. Aim setting.
2. Collating of prior knowledge.
A. Decision A determines whether enough experimental raw material data is already known.
3. Characterising raw material.
4. Setting target parameters.
5. A solubility study.
6. Analysis.
7. Choosing a solvent system.
B. Decision B is whether a van't Hoff solubility line can be plotted for the solvents and solvent mixtures trialled, based upon predictions, with an r2 accuracy exceeding 0.90.
8. A kinetic parameter study is then completed varying the supersaturation and temperature looking for the effects on nucleation rate, growth rate and induction time.
9. Further analysis.
C. Decision C allows for the user to change the solvent system if any unexpected fouling occurred.
D. Decision D forms part of an optimisation loop until the target parameters set earlier are achieved.
E. Decision E, the main extension from previous reported work,8,9 allows for a call-out to seeded, antisolvent, validation and a crystallisation process design.
10. Optimisation and feedback loops.
11. Additional experiments into other modes of crystallisation.
Advancements in data-driven algorithms such as solubility predictive models, enhancements in machine learning image analysis10 and availability of scale-up predictive models for unit operations such as filtration and drying11 have been deployed to enhance the workflow. With the extension into seeded and antisolvent crystallisation and validation from 2 mL to 50–100 mL scale, a new crystallisation of PD-299685 was designed and optimised.
With the major advancements in small-scale crystallisation hardware and automation, the overarching aim of this paper was to successfully develop a batch crystallisation process that supersedes past methods, using much less material and time.
2. Materials, equipment and methods
2.1. Materials
PD-299685 (PRD: 114276/102), (3S,5R)-3-(aminomethyl)-5-methyl-octanoic acid, was supplied by Pfizer R&D UK (Fig. 2). | ||
| Fig. 2 Molecular structure of (3S,5R)-3-(aminomethyl)-5-methyl-octanoic acid. | ||
The pure solvents (≧99%) were chosen to ensure functional diversity while following solvents guidelines by the International Conference on Harmonization (ICH)12i.e., avoiding class 1.
2.2. Equipment
Small-scale (∼7 mL) crystallisation experiments were performed in the Crystalline (Technobis)13 where in-built process analytical technology (PAT) consists of light transmissivity and particle viewing via high-definition image collection. Images were processed either in proprietary software or by a convolutional neural network (CNN) image analysis algorithm.10 Validation crystallisation experiments were performed in the EasyMax (50–100 ml) (Mettler Toledo)14 fitted with a Blaze Probe Meso (BlazeMetrics),15 providing both microscopy and turbidity capabilities.X-ray powder diffraction (XRPD) patterns were collected using a D8 Endeavor (Bruker)16 and the data was visualised in DIFFRAC.EVA software.17 Off-line dry powder size and shape measurements were collected using Morphologi G3 (Malvern Panalytical).18 Differential scanning calorimetry (DSC) was performed on the DSC3+ (Mettler Toledo).19 Microscopy images were collected using an Eclipse Ci POL (Nikon)20 equipped with a Micropix camera.21
2.3. Methodology
2.3.1.1. Solubility and solvent effects study (polythermal global search). In this section, the solubility and effect of solvents of PD-299685 was investigated by performing a series of experiments using a Crystalline (Technobis) platform. Known masses of PD-299685 were weighed into 8 mL screw-top vials where known solvent volumes were added; each vial contained a 10 mm PTFE magnetic stirrer bar. The vials were then subjected to a temperature program consisting of three repeated cycles, with each cycle is as follows:
1. Heat at a rate of 0.5 °C min−1 to 10 °C below the solvent boiling point or 90 °C (whichever is lowest) and hold at this temperature for 10 minutes.
2. Cool at a rate of 0.5 °C min−1 to 5 °C and hold at this temperature for 10 minutes.
3. The above temperature cycle was repeated two more times.
The stir rate was fixed at 900 RPM for all the above steps.
Image analysis was carried out to extract the point of dissolution and the primary nucleation threshold for each vial, and subsequently, the metastable zone width (MSZW) was calculated. Solid state analysis, via XRPD, was performed on samples where deviations were observed from the expected crystal morphology. The data obtained from the experiments were analysed to understand the effect that different solvent systems have both on the crystal and the process.
Initial concentration values and additional solvent systems to trial were predicted using COSMO-RS22 and a group contribution UNIFAC model, implemented in Dynochem (Scale-up systems).23 The model has the underlying theory that molecules of solute and solvent are broken down into their constituent functional groups and interactions can then be parameterised. Predicted and measured solubility values were done in an iterative process. Measured data on single solvent systems allowed for refinement of the model for single solvent systems and also predictions in binary and ternary solvent systems.
2.3.1.2. Kinetic parameter study (isothermal local search). The impact of varying process conditions on the extracted kinetic parameters of PD-299685 at isothermal temperatures from Crystalline (Technobis) data was investigated. Known masses of PD-299685 were weighed into 8 mL screw-top vials where 7 mL of 55
:45 (v/v) water/1-propanol was then added, each vial contained a stirrer. The vials were then subjected to a temperature program consisting of five repeated cycles, each cycle is as follows:
1. The vials were heated at a rate of 1 °C min−1 to 60 °C and held at this temperature for 10 minutes.
2. The vials were rapidly cooled at a rate of 10 °C min−1 to the isothermal temperature of interest, with no stirring.
3. The vials were held at this temperature for 3 hours.
4. The above temperature cycle was repeated four more times.
The agitator geometry was varied across this study to assess magnetic flea, hook stirrer, 3-blade pitched impeller and double 3-blade pitched impeller as different stirring methods. The stir rate was fixed at 900 RPM.
Image analysis of the Crystalline image data was done using a CNN algorithm,8,10 to extract the induction time, the growth rate, the aspect ratio (defined as ferret max/ferret min) and an arbitrary secondary nucleation rate from the isothermal hold. Samples were filtered, washed with acetone, and dried using a standard vacuum filtration setup. The data obtained from the experiments were analysed to understand a good spread of the design space between process conditions and crystallisation kinetic parameters.
2.3.1.3. Additional experiments – seeded, antisolvent, easy-max validation. The impact of other modes of crystallisation and the implications of scaling up were investigated. The same methodology and analysis as detailed in section 2.3.1.2 were used for the kinetic parameter estimations of seeded and antisolvent crystallisations. The only minor discrepancy was that for seeded crystallisation experiments, a known mass of PD-299685 was added during the isothermal holds.
For the validation experiments, an EasyMax (Mettler Toledo) was equipped with a 50 mL glass one-piece vessel. A known mass of PD-299685 was added to the reactor vessel and then 45 mL of 55:45 (v/v) water/1-propanol was added, with agitation using an overhead PTFE half-moon stirrer. The experiment used the same temperature program as detailed in section 2.3.1.2.
1. Heated to 75 °C at a rate of 1 °C min−1 and held for 30 minutes.
2. Cooled to 60 °C at a rate of 0.2 °C min−1.
3. Seed material was added and then held for 30 minutes.
4. Antisolvent was added over 45 minutes and held for 30 minutes.
5. Cooled to 5 °C at a rate of 0.2 °C min−1.
6. Additional specific method section as detailed in section 2.3.2.1 and 2.3.2.2.
This base profile was determined as a product of the workflow based upon a covariance analysis of the kinetic parameters which allowed prediction of process parameters to get the desired product and performance. The predicted process, that complies with operational contracts and objectives set, was developed in Crystalline and then validated in the EasyMax equipped with a Blaze probe.
2.3.2.1. Crystalline. For the optimized process run at screening scale, 350.9 mg of PD-299685 was added to an 8 mL vial and 4.67 mL of 55
:45 water/1-propanol was added. An overhead 3-blade pitched impeller cap was used to seal the vial. The vial was transferred to the Crystalline (Technobis) and underwent the above process profile where 7.1 mg of seed and 2.33 mL of water (antisolvent) were added. After the final cool, the vial was isothermally held for 10 hours. The stir rate was fixed at 900 rpm throughout the whole process. The API was filtered using a Whatman Autovial 12 (Cytiva) filter and washed with 2 × 2 mL of cold acetone and dried in a vacuum oven at 40 °C.
2.3.2.2. EasyMax. Referring to Table 1 for specific details, PD-299685 was added to a two-piece 100 mL vessel and 66.67 mL of 55
:45 water/1-propanol was added. A pitched 4-blade metal stirrer was used at an agitation rate of 300 RPM throughout, except for when high-shear wet milling (HSWM) was in operation. The reaction mixture underwent the base process profile detailed above with 33.33 mL of water (antisolvent) added. After the final cool, the process underwent specific methodology per iteration. The slurry was wet milled. The API was filtered through a 21 mm diameter Buchner funnel and washed with 2 × 10 mL cold acetone and dried in a vacuum oven at 40 °C.
| Mass of API (g) | Mass of seed (mg) | Additional specific method details | HSWM details |
|---|---|---|---|
| 4.992 | 99.67 | Isothermally held at 5 °C for 10 hours after the final cool | IKA T25 Ultra Turrax equipped with a S25KD-25F dispersing tool for 2 minutes at 5000 rpm |
| 5.013 | 101.8 | Milled after the final cool and the slurry underwent a thermocycling of heating to 20 °C at 1 °C min−1, held for 30 minutes, cooled to 5 °C at 0.2 °C min−1 three times. Isothermally held for 8 hours | IKA T25 Ultra Turrax equipped with a S25KD-25F dispersing tool for 2 minutes at 5000 rpm |
| 5.055 | 102.8 | Isothermally held at 5 °C for 14 hours after final cool, milled, and isothermally held for 1 hour | IKA T25 Ultra Turrax equipped with a S25KD-25F dispersing tool for 2 minutes at 3000 rpm |
| 5.061 | 99.7 | Isothermally held at 5 °C for 12 hours after final cool, milled, and isothermally held for 1 hour | IKA MagicLab equipped with fine teeth for a single pass at 14600 rpm |
3. Results & discussion
3.1. Workflow
The sections described below align to boxes within the workflow (Fig. 1) where the section number of 3.1.X. with X referring to the specific numbered box.The aim of the solubility and solvent effects study was to collect quantitative and qualitative data on the thermodynamic crystallisation behaviour and to evaluate the UNIFAC solubility prediction24 regression model. The aim of the kinetic parameter study focused on collecting quantitative kinetic data using a range of agitation methods, volumes, and crystallisation techniques. Additional experimentation was aimed at expanding and validating the workflow by using various stirrer types (to evaluate mixing sensitivity) and particle size and shape analysis methods (to simplify data analysis). The investigation of the seeded, antisolvent, and validation experiments aimed to explore the design space and enhance the capabilities of the workflow. This research built upon prior work8,9 developing efficient process development workflows, offering an extension and enhancement of its application.
The collected data, both quantitative and qualitative, were utilised to inform a novel crystallisation process for the API. The process was optimised to align with drug product attributes, highlighting the industrial advantages of the workflow's approach. The study aimed to show that the use of workflows allows for efficient and effective process development direction for any given API.
:50 vol/vol EtOH:water to get a yield of 87%.6 The resulting drug product was made into immediate-release tablets with doses of 5–20 mg using direct compression. However, a drawback of the previous process was the final broad particle size distribution (PSD), with a d90 value exceeding 800 μm. This could potentially impact drug product content uniformity, particularly at lower doses. HSWM was therefore required to reduce the PSD to target size for tabletting.
For the kinetic parameter study, the primary objective target was to collect data over the design space to determine induction time, growth rate, and nucleation rate under different process conditions, such as supersaturation and temperature.
The target parameters for the end crystallisation process design and optimization were yield, particle shape, and particle size. The study aimed to maximize yield while maintaining an aspect ratio greater than 0.5 (ref. 4) and a particle size (d90) of 100–350 μm. Improvements to the manufacturability of the process such as increasing the MSZW for speck free filtration and avoiding mechanical milling were desirable.
3.1.5.1. Iteration one. The first iteration of the solubility and solvent effects study consisted of collecting data for PD-299685 in pure solvents. As shown in Fig. 3(a) the solubility of PD-299685 was very low in all organic solvents and moderate in water. To improve the coverage of the UNIFAC model and to provide data on synergetic effects in solvent mixtures, the solubility of PD-299685 was explored in 50
:50 (v/v) binary mixtures of water and organic solvents. The range of solvent mixtures was limited due to the poor miscibility of some organic solvents with water. The increased solubility caused by synergetic effects can be seen in Fig. 3(b). Observed crystal habit was block-like for most solvent systems with a small amount of fines generation or aggregation, which was likely caused by the magnetic stir bar grinding particles.
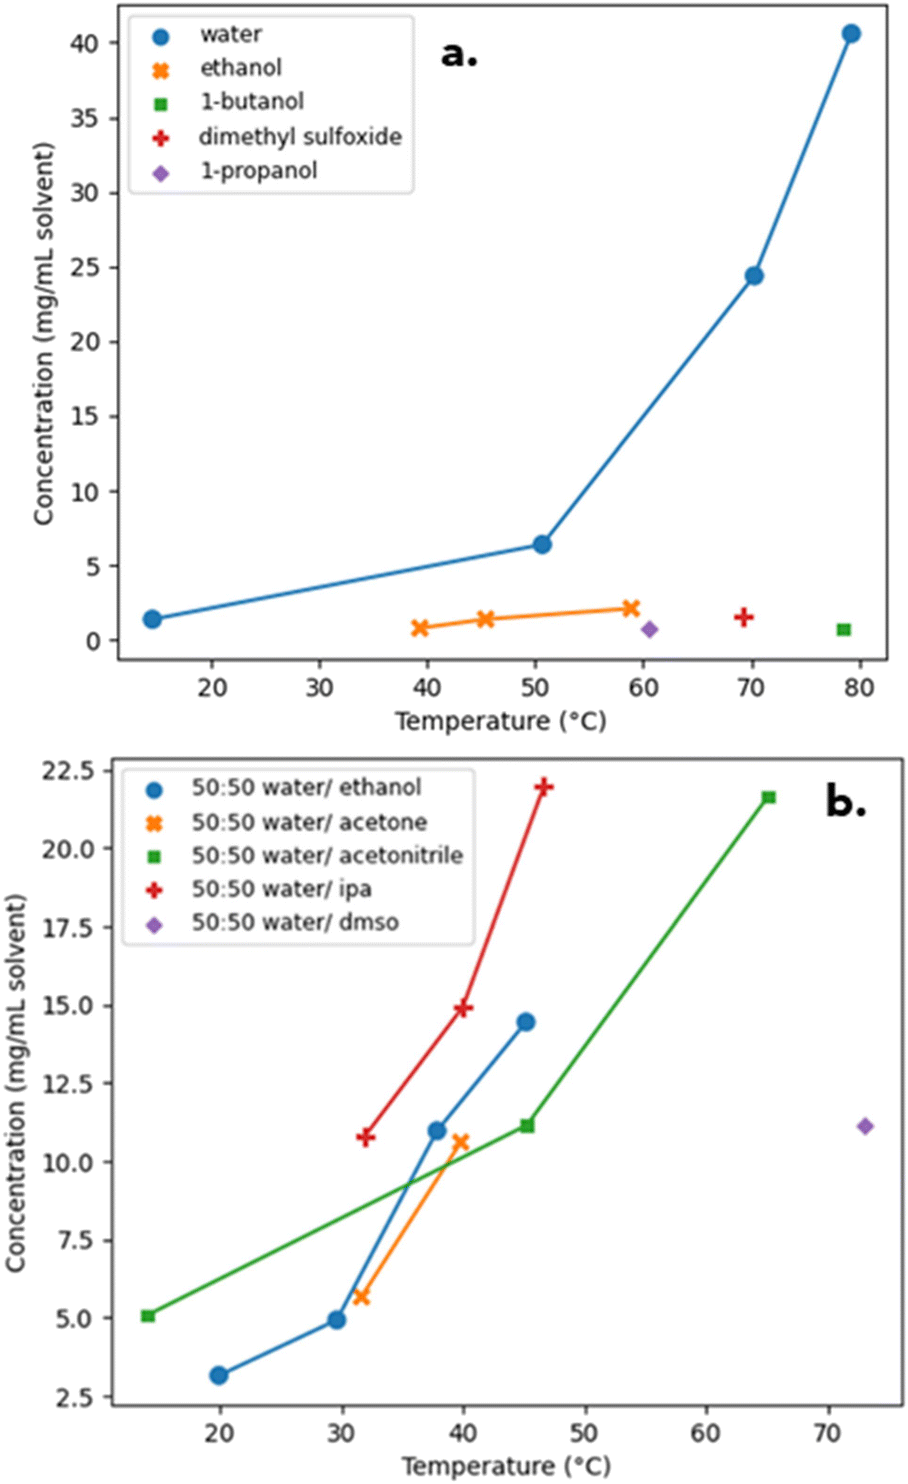 | ||
| Fig. 3 Approximate solubility-temperature profile of experimental results of PD-299685 in various pure solvents (a) and 50:50 binary solvent mixtures (b). NOTE: join-the-dot lines were used as the solubility-temperature profiles were estimates based on limited data points. | ||
The data from this iteration was used to fit a Dynochem UNIFAC model, and binary solubility prediction was run at 5 °C, 25 °C, 50 °C and 70 °C for the covered solvents. Highly synergetic effects were observed for water/alcohol and water/acetonitrile mixtures (Fig. S1 in the ESI†). The higher predicted solubility of PD-299685 at high temperatures, compared to pure and 50:50 (v/v) solvents, allows for more economic solvent and vessel usage, whereas minimal change at low temperatures enhances a predicted cooling crystallisation yield to more than 98% for all systems.
The best binary solvent compositions, due to highest synergistic solubility, for further study from this iteration were 40:60 (w/w) ethanol/water, 40:60 (w/w) IPA/water and 40:60 (w/w) 1-propanol/water which equates to volume fractions of 45:55. Acetonitrile/water has good synergy (where the solubility exceeds that of the single solvents) at 30:70 (w/w), equating to 33:66 (v/v), and was also further explored. Acetone/water mixtures were eliminated from the study due to low solubility at the upper operating temperature of acetone due to its low boiling point. Ethanol/glycerol had the highest predicted synergy for an organic/organic solvent mixture but with still very low solubility so was also eliminated from the study.
3.1.5.2. Iteration two. The recommended solvent systems from the above iteration were trialled experimentally and the data observed (Fig. 4) was fed back into a UNIFAC model.
 | ||
| Fig. 4 Approximate solubility-temperature profile of the experimental results of PD-299685 in the UNIFAC recommended solvent systems. NOTE: join-the-dot lines were used as the solubility-temperature profiles were estimates based on limited data points. | ||
The UNIFAC regression model fitted with the new experimental data returned recommended solvent systems the same as the previous iteration, therefore termination criteria for the solubility and solvent effects study had been met. Section 3.1.7. discusses the classification, ranking and selection of a solvent system.
3.1.5.3. Iteration three. As an extension to the general workflow, ternary solvents were also explored. As 55
:45 (v/v) water/1-propanol gave the steepest solubility curve that was chosen as the base binary mixture. Various UNIFAC model predictions were done with the water/1-propanol solvent mixture plus an additional miscible solvent. The general trends showed that the addition of a third solvent had a limited impact on the solubility except with acetonitrile where the addition of large volumes of solvent slightly reduces the overall solubility of PD-299685, at low temperatures, in the ternary solvent system. These predictions for PD-299685 in water/1-propanol and acetonitrile were validated in the laboratory and it was confirmed the addition of acetonitrile reduced the solubility but by a minimal amount. The importance of this in designing an antisolvent crystallisation is discussed in section 3.1.7.
 | ||
| Fig. 5 X-ray powder diffraction patterns for PD-299685 recrystallised from 55:45 (v/v) water/1-propanol overlayed against reference form A/starting material. | ||
• 1-Butanol, 1-propanol, 2-methyl THF, acetone, acetonitrile, ethyl acetate, heptane, isopropanol and isopropyl acetate are antisolvents.
• Ethanol and DMSO are practically unusable pure solvent systems due to low solubility.
• Water/organic mixtures gave good synergistic solubility.
• Acetone would be an ideal wash solvent for filtration and drying due to low API solubility and low boiling point.
It is worth noting that with the rise of green solvents such as ionic liquids, deep eutectic solvents and supercritical fluids, as part of carbon footprint reduction campaigns then the ranking of solvents in this workflow could also incorporate green metrics weighted alongside quality product attributes.
3.1.7.1. Cooling crystallisation solvent. Solubility within the target parameters was observed for water/organic binary solvent systems due to synergy meaning that these solvent systems can be classified as good cooling crystallisation solvents. The solubility profile (Fig. 4) for 55
:45 (v/v) water/1-propanol had the steepest gradient and therefore highest predicted yield from cooling crystallisation. Furthermore, water/1-propanol had the highest possible operating temperature out of the potential solvent systems meaning that higher temperatures and thus higher throughput can be achieved. No considerable operational and handling issues were observed at low temperature. No fouling was observed through image analysis and direct observation therefore this solvent mixture was chosen as the cooling crystallisation solvent.
Additional solubility measurements were carried out to allow for a better fit to the data over a range of temperatures (Fig. 6). A thermal stability trial was also conducted where a highly concentrated sample was held for 24 hours at 75, 80, 82.5 and 85 °C using the Crystal-16 (Technobis)13 and aliquots were sampled using HPLC. Negligible chemical degradation was observed for all temperatures after 2 hours, however a new impurity with molecular weight of 170.2 g mol−1 was observed after 5 hours for vials held at 80 °C and above. Therefore, a maximum temperature of 75 °C will be used for PD-299685 in 55:45 (v/v) water/1-propanol to allow an extended hold for dissolution if scaled up to plant.
 | ||
| Fig. 6 Solubility-temperature profile for PD-299685 in 55:45 water/1-propanol with the data fitted with the van't Hoff relationship. | ||
3.1.7.2. Antisolvent crystallisation solvent. Three possible antisolvent processes were explored in section 3.1.5., which were the addition of water, the addition of 1-propanol and the addition of acetonitrile. As seen in Fig. S1 of the ESI† the predicted solubility was lower the closer the solvent mixture was to pure solvent. The addition of 1-propanol to PD-299685 in 55
:45 (v/v) water/1-propanol (to change the 1-propanol content to 63%) reduced the solubility as did the addition of water (to change the water content to 70%). The addition of water reduced the solubility of PD-299685 more as the final solvent composition is closer to the pure solvent and therefore had the least synergy of the two solvent system options. As presented in iteration three, of section 3.1.5. the addition of acetonitrile reduced the solubility but to minimal effect compared to the addition of water. It is also worth noting that ternary solvent mixtures are not preferred due to increased complexity of solvent recovery and increased analytical burden. Therefore 70:30 (v/v) water/1-propanol (Fig. 7) was the chosen final composition for antisolvent crystallization for the kinetic parameter study.
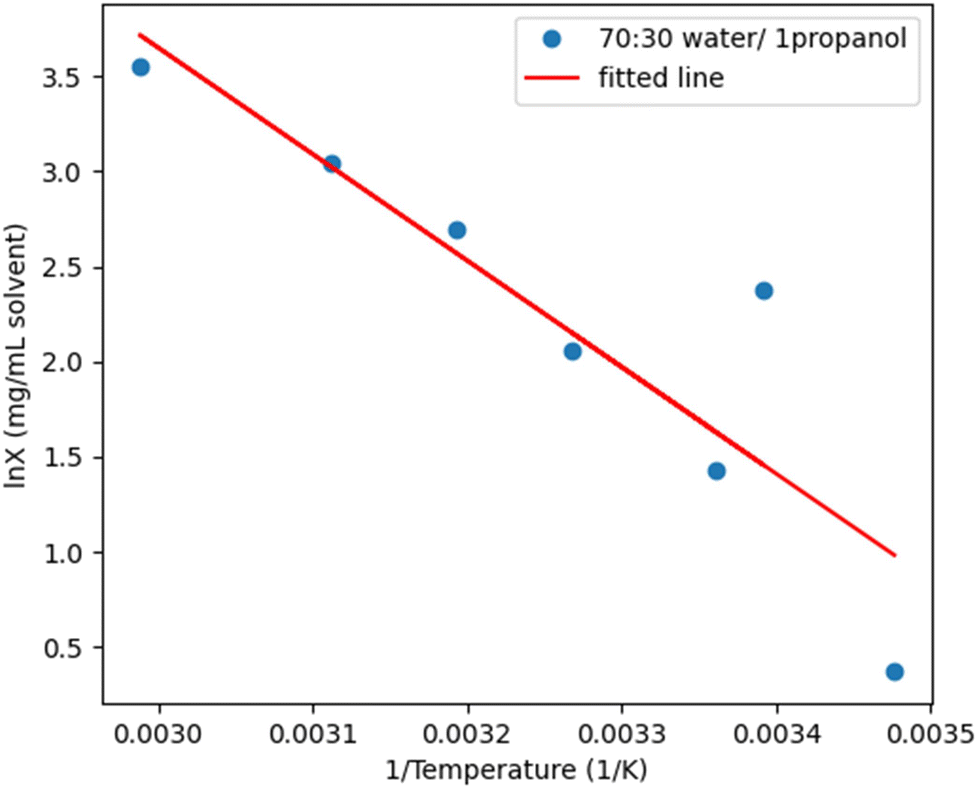 | ||
| Fig. 7 Solubility-temperature profile for PD-299685 in 70:30 water/1-propanol with the data with the van't Hoff relationship. | ||
An additional series of measurements was conducted for PD-299685 in 64:36 (v/v) water/1-propanol to fit solubility for the halfway point of antisolvent addition. No fouling was observed through image analysis and observational analysis.
The XRPD pattern (Fig. S2 of the ESI†) confirms that the increase in water content in the solvent composition did not cause the formation of the monohydrate polymorph. The stable form A, was produced. In addition, this solvent composition was stress-tested by holding a slurry of PD-299685 in 70:30 water/1-propanol at 5 °C for more than 5 days using the Crystal-16 (Technobis)13 where no solid form transformation in the product was observed.
Primary nucleation was not observed for any of the vials ran at a temperature of 16 °C and a supersaturation ratio of 3.2 likely due to the low concentration of the vial. This qualitatively showed that high supersaturation or seeding are required at low temperatures. A comparison of different stirrers on the effect of crystallisation was conducted on vial 7 of each experiment (temperature of 28 °C, supersaturation of 2.91) where the magnetic stirrer showed attrition, the hook-shaped stirrer showed reduced mixing and the 3-blade pitched stirrer showed good mixing. The differences in quality of crystal generation were negligible between the single and the double 3-blade pitched impellers therefore the single was chosen for further study in section 3.2. as it is more commonly used in plant-scale reactors.
The qualitative observations (Fig. 8) between the different stirring methods were validated using microscopy and Morphologi data (Fig. 9) which showed that the particles crystallised in the vial with a magnetic flea had a d(v,90) approximately 3.5 times smaller compared to overhead stirring methods.
 | ||
| Fig. 8 Crystalline (Technobis) images from the end of the final hold cycle for vial 7 agitated by magnetic flea (a), 3-blade pitched (b), 3-blade double pitched (c) and hook (d) stirrers. | ||
 | ||
| Fig. 9 Volume-based particle size distribution (PSD) from Morphologi for all Crystalline stirring methods. NOTE; the difference in smoothing is due to varying number of total particles. | ||
The kinetic parameters extracted, using CNN image analysis, were visualised using a covariance matrix due to the multiple dimensionalities of the design and measured variable space.
The agitation methods were assigned a discrete eigenvalue to allow for numerical comparisons between continuous and categorical variables across the design space. It can be seen from the co-variance matrix (Fig. S3(a) of the ESI†) that changing between the magnetic flea and the 3-blade pitched impellor, had a large impact on the measured kinetic parameters. It can qualitatively be concluded that the use of the magnetic flea in this study ground the particles and created clouds of fines which created more particle surface area for faster desaturation.
The data presented in Fig. S3(b) (of the ESI†) indicates that there was no statistically significant difference in terms of impact for type of overhead agitation (hook, single 3-blade pitch, double 3-blade pitch) on nucleation, although – as mentioned in an earlier section – the hook impeller gave rise to a poor mixing environment.
PD-299685 can be classified as a slow nucleating and fast growing API across varied process conditions and when using an overhead stirrer, the most representative of a plant scale process, yields large crystals. The d90 of crystals from the isothermal study were larger than 500 μm which exceeded the required particle size required for API formulation in this instance. The general crystal habit was blocks, which were acceptable for downstream processing. Other morphologies, such as needles, are less desirable from a process perspective given that particles exhibiting this shape generally have poor bulk properties, including for instance flow, the information gathered in this stage was foundational for designing an end crystallisation process mainly in terms of the impact of agitation and mixing and knowing the impact of temperature and supersaturation on nucleation and growth.
3.1.11.1. Seeded. Seeded experiments were performed following a space-filling Latin hypercube DoE plan, as explained in section 3.1.8. (Table S2 of the ESI†) at lower supersaturations than the previous section. The 3-pitched blade stirrer was used in line with findings reported in section 3.1.8. Due to the difficulty in accurately dosing equal small quantities of seed into the Crystalline during the hold period, it was decided to pause the image analysis and add circa. 5–10 mg and the difference in vial weight was recorded, before then restarting the image collection.
The covariance matrix (Fig. S4(a) of the ESI†) shows that an increase in seed mass caused both growth and nucleation rates to increase where the growth rate dominated over the nucleation rate. Nucleation however dominated over growth at higher temperatures and higher supersaturations, as expected. Microscopy of samples taken of vial 3 (supersaturation of 1.60, temperature of 35 °C) showed many small crystals with some large agglomerates compared to vial 7 (supersaturation of 1.55, temperature of 28 °C) which showed dispersed square crystals over 500 μm.
3.1.11.2. Antisolvent. The same experimental plan as previously used for the local kinetic search (section 3.1.8.) was performed here but using only the overhead 3-blade pitched stirrer. The data from that section was used alongside data gathered for the addition of half of the antisolvent and the addition of all the antisolvent. i.e., an isothermal study was conducted in 55
:45 (v/v), 64:36 (v/v) and 70:30 (v/v) water/1-propanol.
It can be seen from the covariance matrix (Fig. S4(b) of the ESI†) that the addition of antisolvent had a positive impact on nucleation and a negative impact on growth. This was ideal for limiting the d90 size of the final crystals. There was also a largely positive relationship between the addition of antisolvent at higher temperatures on nucleation with minimal impact on growth. Therefore, nucleation would largely dominate over growth at high temperatures and higher antisolvent composition.
3.1.11.3. Easy-Max validation. The same experimental plan that was conducted in the local kinetic search (section 3.1.8) was performed using a 50 mL vessel in the EasyMax with an overhead half-moon PTFE stirrer. The crystallisation kinetic parameter data for the 3-blade pitched impellor in the Crystalline and the data from the EasyMax were compared by covariance matrix as shown in Fig. S4(c) (of the ESI†) as these two stirrers have the most similar geometry and tip speed.
It can be seen from the covariance matrix (Fig. S4(c) of the ESI†) that there are major variances between the Crystalline and EasyMax nucleation and growth data which can be accounted for by differences in PAT and reactor geometry. The Blaze probe used for the EasyMax image collection had a much smaller field of view (FOV) compared to the Crystalline cameras, and therefore it was challenging to track nucleation and growth for such large particles due to particle sample size per image. Despite the large variances, microscopy images (Fig. 10) showed good qualitative similarities in final crystal size between EasyMax and Crystalline when using the 3-blade pitched double impellor.
 | ||
| Fig. 10 Microscopy images taken at 4× magnification of PD-299685 recrystallised from 55:45 (v/v) water/1-propanol using the Crystalline with overhead 3-blade pitched impeller (a) and EasyMax with half-moon PTFE stirrer (b). | ||
The PSDs as shown in Fig. 11 also showed good similarity, where the d(v,90) was 384 μm and 328 μm for the Crystalline 3-blade double pitched and EasyMax PTFE stirrer respectively. Therefore, it can be concluded that for the best estimations of scaling up from Crystalline to EasyMax, the 3-blade double pitched should be used at the millilitre scale. However alternative PAT should be used for online measurements of kinetic parameters for a fast growing compound as the one used here such as imaging with a wider field of view (FOV). However, this is compound specific and the set-up discussed in this paper would most times suffice.
 | ||
| Fig. 11 Volume-based particle size distribution (PSD) from Morphologi for EasyMax overhead PTFE stirrer and Crystalline overhead 3-blade double pitched for SS = 2.91 and temperature = 28 °C. | ||
3.2. Process design and optimisations
After completion of the workflow there was a wealth of data collected, both quantitative and qualitative, on the thermodynamics and kinetics of the system. This allowed the design and optimisation of a commercially viable crystallisation process.As shown in section 3.1.5., the solubility and solvent effects study, the solvent that gave the highest solubility and temperature dependence was 55:45 water/1-propanol with a predicted yield of over 90% for a cooling crystallisation only. The addition of water for a final solvent composition of ∼70:30 reduced the solubility at low temperatures further pushing the predicted yield to 95%. Therefore, a cooling and antisolvent hybrid crystallisation was proposed as the ideal mode of crystallisation. The local kinetic parameter study (section 3.1.8.) showed that the use of an overhead blade impeller would yield crystals to align with shape and size target parameters set out and would be most like the actual manufacturing vessel. Analysis of covariance between isothermal experiments in Crystalline and EasyMax showed good comparisons between the different scales. This enabled process understanding of kinetic parameters at millilitre scale before process optimisation. Due to past issues of large particle size, the proposed crystallisation route should allow for nucleation to dominate over growth. Analysis of covariance in the seeded and antisolvent experiments in section 3.1.11. showed that this could be achieved where seeding was done at higher temperatures and using lower seed mass. Furthermore, a fast antisolvent addition at higher temperatures should also allow for more nucleation. A cooling rate of 0.2 °C min−1 was determined due to heat transfer constraints associated with plant-sized equipment.
Particle size data in Table 2 shows that a wide range of particle sizes can be accessed by adjusting the wet mill parameters which suggests that ‘tuning’ particle size in later development would be possible upon scale.
| Run | d(v,90) (μm) | Mean aspect ratio | Yield (%) | Comment(s) |
|---|---|---|---|---|
| a Refers to Fig. S5 (of the ESI†). | ||||
| 1 | 476 | 0.688 | 91 | HSWM reduced d(v,90) from 664 μm, slow filtration |
| 2 | 600 | 0.743 | 92 | Hold and thermocycling after HSWM allowed for excessive growth, narrow PSDa (less fines), slow filtration |
| 3 | 523 | 0.725 | 92 | Hold after HSWM allowed recovery of yield but also growth, slow filtration |
| 4 | 234 | 0.766 | 92 | Narrow PSD,a fast filtration |
4. Conclusions
The use of a structured workflow allowed for quick collection of data where a thermodynamic model and kinetic model were developed for PD-299685 in circa 8 weeks. Low time and material usage due to frontloading solubility and kinetic experiments with models early on could lead to rapid process development for the enabling route during early stage development. Additionally, validation between stirring methods, scale-up and different modes of crystallisation was done as part of this study. This showed that the Crystalline with an overhead stirrer gave the best estimate of how the crystallisation would occur in the EasyMax. Scaling down to the millilitre scale and using offline analysis such as Morphologi provided the best comparisons. Further work however needs to be done to incorporate comparable online PAT at difference scales. Smart decision-making alternating between experimental data and solubility prediction algorithms allowed for a fast thermodynamic model to be developed and applied to inform solvent selection for an industrial crystallisation process. A space-filling Latin hypercube DoE were employed to plan the least number of experiments to make a kinetic model for cooling, seeded and antisolvent crystallisations. These models were then analysed using covariance matrices to determine the ideal supersaturation and temperature for specific process steps in the crystallisation process. The optimum crystallisation process developed was a cooling, seeded and antisolvent hybrid of PD-299685 in 55:45 (v/v) water:1-propanol with additional water as antisolvent. Dissolution was at 75 °C, seeding and addition of antisolvent was done at 60 °C, and then the mixture was cooled to 5 °C before milling. The process proposed gives higher control and product quality over previous processes6 as had an increased MSZW to allow for speck-free filtration and seeding. Additionally, due to the use of antisolvent addition, the yield has been increased by 5% compared to the previous clinical manufacture process.
Data availability
The data supporting this article have been included as part of the ESI.†Conflicts of interest
There are no conflicts to declare.Acknowledgements
The authors would like to thank the Future Continuous Manufacturing and Advanced Crystallization Research Hub (Grant ref.: EP/P006965/1) for funding this work. The authors would like to thank Pfizer R&D UK for the donation of pharmaceutical material and access to the laboratories where the majority of this work was carried out. The authors would also like to acknowledge that some of this work was carried out in the CMAC National Facility supported by UKRPIF (UK Research Partnership Fund) award from the Higher Education Funding Council for England (HEFCE) (Grant ref.: HH13054).References
- S. Vedantam and V. V. Ranade, Sadhana, 2013, 38, 1287–1337 CrossRef CAS.
- I. Khanna, Drug Discovery Today, 2012, 17, 1088–1102 CrossRef PubMed.
- D. Mangin, F. Puel and S. Veesler, Org. Process Res. Dev., 2009, 13, 1241–1253 CrossRef CAS.
- T. Deng, V. Garg, L. Pereira Diaz, D. Markl, C. Brown, A. Florence and M. S. A. Bradley, Int. J. Pharm., 2022, 628, 122309 CrossRef CAS PubMed.
- Pfizer (https://www.pfizer.com/sites/default/files/investors/presentations/MackayNeuro_112906_part2.pdf).
- L. Murtagh, C. Dunne, G. Gabellone, N. J. Panesar, S. Field, L. M. Reeder, J. Saenz, G. P. Smith, K. Kissick, C. Martinez, J. G. Van Alsten, M. C. Evans, L. C. Franklin, T. Nanninga and J. Wong, Org. Process Res. Dev., 2011, 15, 1315–1327 CrossRef CAS.
- M. R. Owen, C. Luscombe, L.-W. Lai, S. Godbert, D. L. Crookes and D. Emiabata-Smith, Org. Process Res. Dev., 2001, 5, 308–323 CrossRef CAS.
- T. Pickles, C. Mustoe, C. Boyle, J. Cardona, C. Brown and A. Florence, CrystEngComm, 2024, 26, 822–834 RSC.
- T. Pickles, C. Mustoe, C. Brown and A. Florence, APS Special Issue, 2022, 7 DOI:10.5920/bjpharm.1128.
- C. Boyle, C. Brown, J. Sefcik and J. Cardona, Improved Particle Characterisation from in-Line PAT: Comparison of Deep Learning and White-Box Methods, Phoenix, Arizona, USA, 2022. Search PubMed.
- S. Ottoboni, B. Wareham, A. Vassileiou, M. Robertson, C. J. Brown, B. Johnston and C. J. Price, Org. Process Res. Dev., 2021, 25, 1143–1159 CrossRef CAS PubMed.
- ICH Harmonisation for better health (https://www.ich.org/page/quality-guidelines).
- Technobis (https://www.crystallizationsystems.com/products/).
- M. Toledo, EasyMax 102 Advanced Thermostat system (https://www.mt.com/gb/en/home/products/L1_AutochemProducts/chemical-synthesis-reactor-systems/EasyMax-Synthesis-Reactor.html).
- BlazeMetrics, Single Probe - Multiple Measurement Technologies (https://www.blazemetrics.com/).
- Bruker (https://www.bruker.com/en/products-and-solutions/diffractometers-and-x-ray-microscopes/x-ray-diffractometers/d8-endeavor.html).
- Bruker, DIFFRAC.EVA: software to evaluate X-ray diffraction data Version 5.2 (https://www.bruker.com/content/bruker/int/en/products-and-solutions/diffractometers-and-x-ray-microscopes/x-ray-diffractometers/diffrac-suite-software/diffrac-eva.html).
- M. Panalytical, Morphologi G3 (https://www.malvernpanalytical.com/en/support/product-support/morphologi-range/morphologi-g3).
- M. Toledo, Thermal Analysis System DSC 3+ (https://www.mt.com/gb/en/home/products/Laboratory_Analytics_Browse/TA_Family_Browse/ta-instruments/thermal-analysis-system-DSC-3-plus.html).
- Nikon, Eclipse Ci POL (https://www.microscope.healthcare.nikon.com/products/polarizing-microscopes/eclipse-ci-pol).
- Micropix (https://micropix.co.uk/).
- A. Klamt, V. Jonas, T. Bürger and J. C. W. Lohrenz, J. Phys. Chem. A, 1998, 102, 5074–5085 CrossRef CAS.
- Scale-Up Systems, https://www.scale-up.com/dynochem).
- S. Gracin, T. Brinck and Å. C. Rasmuson, Ind. Eng. Chem. Res., 2002, 41, 5114–5124 CrossRef CAS.
- P. G. R&D, Pd-299685 API Co-Development Plan (Internal), 2006.
- F. L. Muller, M. Fielding and S. Black, Org. Process Res. Dev., 2009, 13, 1315–1321 CrossRef CAS.
- J.-S. Park, J. Stat. Plan. Inference, 1994, 39, 95–111 CrossRef.
Footnote |
| † Electronic supplementary information (ESI) available: Integration of a model-driven workflow into an industrial pharmaceutical facility: supporting process development of API crystallisation. See DOI: https://doi.org/10.1039/d4ce00358f |
| This journal is © The Royal Society of Chemistry 2024 |