Dual modifications of sensitizers and lanthanide ions on a two-dimensional zirconium-based metal–organic framework for photoluminescent detection†
Jhe-Wei
Chang
a,
Tzu-Chi
Lin
a,
You-Liang
Chen
a,
Po-Chun
Han
 b,
Shang-Cheng
Yang
a,
Meng-Dian
Tsai
a,
Kevin C.-W.
Wu
 bcd and
Chung-Wei
Kung
 *a
*a
aDepartment of Chemical Engineering, National Cheng Kung University, Tainan City, 70101, Taiwan. E-mail: cwkung@mail.ncku.edu.tw
bDepartment of Chemical Engineering, National Taiwan University, Taipei, 10617, Taiwan
cPh. D. Program of Green Materials and Precision Devices, College of Engineering, National Taiwan University, Taipei 10617, Taiwan
dDepartment of Chemical Engineering and Materials Science, Yuan Ze University, Chung-Li, Taoyuan 320, Taiwan
First published on 6th May 2024
Abstract
A two-dimensional (2D) zirconium-based metal–organic framework (Zr-MOF) with abundant terminal –OH/–OH2 groups on its nodes, ZrBTB (BTB = 1,3,5-tris(4-carboxyphenyl)benzene), is utilized as a platform for dual post-synthetic modifications (PSM) to immobilize both the benzophenone-based photosensitizer (benzophenone-4,4′-dicarboxylate, bzpdc) and terbium ions onto the 2D Zr-MOF molecular sheets. Terbium ions are installed on the 2D Zr-MOF at various temperatures to adjust the loading of terbium ions on the 2D Zr-MOF while preserving the loading of the photosensitizer. The crystallinity, morphology, porosity, and loadings of both bzpdc ligands and terbium ions are characterized for each material, and the coordinating locations of terbium ions in the Zr-MOF structure are investigated. The photoluminescence (PL) properties of these materials are then examined. Since the installed bzpdc ligand can induce a highly efficient energy transfer to the neighbouring terbium ion upon excitation, the obtained material after dual PSM (ZrBTB-bzpdc-Tb-120) can show strong PL emissions of terbium ions upon the excitation of the bzpdc ligand at 355 nm, with a PL quantum yield of 5.04%. It is more advantageous than the 2D Zr-MOF solely functionalized with terbium ions, which can only exhibit similar emissions upon the excitation of the BTB linker at a less friendly wavelength of 310 nm, with a lower PL quantum yield of 2.94%. Owing to the high chemical stability as well as good dispersity of the luminescent ZrBTB-bzpdc-Tb-120 in water, its performances in selective PL sensing of Fe(III) ions present in aqueous solutions are investigated.
Introduction
Lanthanide ions exhibit attractive optical properties such as narrow-line emission and diverse luminescent characteristics, leading to their wide applications in chemical sensors, bioimaging and light emitting diodes.1,2 Furthermore, the use of organic sensitizers to render energy transfer to the adjacent lanthanide, also known as the “antenna effect”, can remarkably amplify the photoluminescent (PL) properties of lanthanide ions.1,2 On the other hand, metal–organic frameworks (MOFs) are porous materials constructed from metal-ion clusters and organic linkers with high specific surface areas, interconnected pore structures and modulable chemical functionality,3–8 which have been widely explored as active materials for a range of catalytic applications,9–15 ionic conductors16 and chemical sensors.17–21 Spatially separated active sites immobilized within the highly porous scaffold are expected to be highly accessible to the reactants or analytes coming from the external environment, and the MOF in the form of solid is more easily recycled after use compared to those soluble luminescent materials.21 Such facts have thus made lanthanide-based MOFs constructed from photosensitizing linkers especially attractive for PL sensing.22–26However, since most MOFs are not chemically stable in water,27,28 the applicability of most luminescent MOFs in aqueous solutions is still strongly limited. Among various MOFs, group(IV) metal-based MOFs,29–31 such as zirconium-based MOFs (Zr-MOFs),32,33 have been known for their exceptional stability in water. In addition, Zr-MOFs possess high structural tunability and can achieve high porosity compared to MOFs directly constructed from lanthanide-based nodes.33,34 It thus rendered Zr-MOFs appealing scaffolds for installing lanthanide ions. The incorporation of various lanthanide ions such as terbium and europium in Zr-MOFs and the antenna effect from the photosensitizing linkers to the installed lanthanide ions in Zr-MOFs have thus been reported by researchers from different groups.35–43 In these studies, Zr-MOFs with three-dimensional (3D) porous structures, such as UiO-66 and MOF-808, were usually used for incorporating lanthanide ions. Compared to 3D Zr-MOFs, two-dimensional (2D) Zr-MOFs that can be fully dispersed as separated molecular sheets in aqueous solutions should provide a more readily available contact between the analyte and luminescent centres in the MOF, which should be more beneficial for PL sensing.44,45 In our very recent work, the first example of the installation of lanthanide ions in the structure of a 2D Zr-MOF was reported.46 By post-synthetically immobilizing terbium ions on 2D sheets of a 2D Zr-MOF, ZrBTB (BTB = 1,3,5-tris(4-carboxyphenyl)benzene),47–50 the excited BTB linker under illumination at 310 nm can induce energy transfer to adjacent terbium ions, resulting in the 2D PL material capable of detecting nitrite.46
In all aforementioned studies reporting the incorporation of lanthanide ions in Zr-MOFs, linkers of Zr-MOFs were employed as the chromophore to sensitize the post-synthetically installed lanthanide. Thus, the light-absorbing property of the material as well as the efficiency of energy transfer from the sensitizer to the lanthanide fully relies on the building block of the MOF. Thus, the sensitizing ligand and the linker for constructing the porous framework cannot be selected separately. For example, in the study mentioned previously, we selected one of the most commonly reported 2D Zr-MOFs, ZrBTB, for installing terbium ions on its hexa-zirconium nodes, but UV illumination at 310 nm is required to excite the BTB linker to induce energy transfer to the lanthanide.46 The hexa-zirconium clusters of ZrBTB with six pairs of accessible terminal –OH/–OH2 groups are not only viable for the installation of lanthanide ions,46 but also capable of coordinating carboxylate-based organic ligands via solvent-assisted ligand incorporation (SALI).51–54 We thus reasoned that 2D Zr-MOFs such as ZrBTB can serve as a stable platform to incorporate both lanthanide ions and their sensitizing ligands together. The selection of lanthanide and its sensitizing ligand can thus be decoupled from the design of the MOF scaffold. Such dual modifications of the lanthanide and sensitizer in a Zr-MOF have not been reported to date.
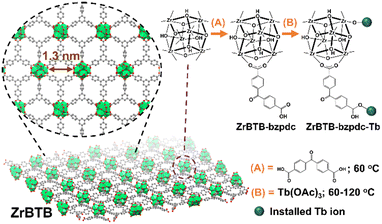
Herein, the 2D ZrBTB was utilized as a platform to coordinate the chromophoric ligand via SALI, followed by the second step of post-synthetic modification (PSM) to install terbium ions. Since benzophenone can be excited under illumination at around 355 nm and can provide highly efficient intramolecular energy transfer to terbium and europium,55,56 as a demonstration, benzophenone-4,4′-dicarboxylate (bzpdc) was selected here for the first step of PSM. During the second step of PSM, terbium ions were further incorporated on both the node of the Zr-MOF and the residual carboxylate group of bzpdc, and the loading of terbium is adjustable by simply altering the temperature of PSM. Luminescent 2D Zr-MOFs that are excitable at a more friendly wavelength of 355 nm and highly dispersible in aqueous solutions can thus be developed. The synthetic procedure as well as the node structures discussed later are illustrated in Fig. 1.
Experimental
1. Chemicals
Information regarding all chemicals used for the synthesis of ZrBTB, measurements of inductively coupled plasma-optical emission spectrometry (ICP-OES), and preparing 1H nuclear magnetic resonance (NMR) samples as well as some chemicals used for testing the selectivity of the material for sensing can be found in our previous work.46 Benzophenone-4,4′-dicarboxylic acid (H2bzpdc, >95%) was purchased from A2B Chem LLC, and terbium(III) acetate hydrate (Tb(OAc)3, 99.9%) was received from Alfa Aesar. Common solvents such as acetone (98%) and dimethylformamide (DMF, ≥99.8%) were obtained from ECHO Chemical Co, Ltd., Taiwan. Other chemicals including silver tetrafluoroborate (AgBF4, Alfa Aesar, 99%), ammonium sulfate ((NH4)2SO4, Duksan Pure Chemicals, 99.0%), cadmium nitrate tetrahydrate (Cd(NO3)2, ≥98.5%, Alfa Aesar), manganese nitrate hydrate (Mn(NO3)2, 98%, Sigma-Aldrich), cobalt sulfate heptahydrate (CoSO4, 99%, Sigma-Aldrich), aluminum nitrate nonahydrate (Al(NO3)3, 98%, Thermo Scientific), iron(III) sulfate hydrate (Fe2(SO4)3, 97%, Sigma-Aldrich), iron(II) chloride, anhydrous (FeCl2, 99.5%, Thermo Scientific), lead(II) nitrate (Pb(NO3)2, Alfa Aesar, 99%), zinc nitrate hexahydrate (Zn(NO3)2, 99%, Alfa Aesar), copper(II) chloride dihydrate (CuCl2, ≥99.0%, Sigma-Aldrich), nickel nitrate hexahydrate (Ni(NO3)2, 98%, Alfa Aesar), potassium nitrate (KNO3, 99%, Alfa Aesar) and mercuric chloride (HgCl2, 99.5%, Thermo Scientific) were used as received. All aqueous solutions and suspensions were prepared by using deionized water.2. Synthesis of materials
ZrBTB was synthesized by following the protocol reported previously.46 Thereafter, 50 mg of ZrBTB was ultrasonically dispersed in a solution containing 132 mg of H2bzpdc (18 equivalents of 50 mg of ZrBTB)46 and 4 mL of DMF in a scintillation vial. The mixture was placed in an oven at 60 °C for 18 h. The obtained solid was separated from the solution and washed with 12 mL of DMF three times through centrifugation. The solvent-exchange process with 12 mL of acetone was then performed three times overnight, similar to that used during the synthesis of ZrBTB.46 After drying the resulting solid in a vacuum oven at 80 °C overnight, the ZrBTB-bzpdc powder was obtained.To further install terbium ions in ZrBTB-bzpdc, a procedure similar to that utilized to incorporate terbium in ZrBTB reported previously was used.46 In brief, 40 mg of ZrBTB-bzpdc was ultrasonically dispersed in a solution composed of 131 mg of Tb(OAc)3 (18 equivalents of 40 mg of ZrBTB)46 and 12 mL of DMF in a vial, and the mixture was heated in an oven at 60, 80, 100, or 120 °C for 18 h. The material was thereafter washed with 12 mL of DMF three times followed by solvent exchange with 12 mL of acetone three times, similar to the process described in the previous paragraph. After activating the solid in a vacuum oven at 80 °C overnight, the resulting materials synthesized at 60, 80, 100 and 120 °C were designated as “ZrBTB-bzpdc-Tb-60”, “ZrBTB-bzpdc-Tb-80”, “ZrBTB-bzpdc-Tb-100” and “ZrBTB-bzpdc-Tb-120”, respectively. For comparison, the same PSM process at 120 °C was also performed by replacing ZrBTB-bzpdc with ZrBTB, and the obtained material was named as “ZrBTB-Tb-120”. It should be noticed that the similar incorporation of terbium ions in ZrBTB at 120 °C has been reported in our previous work.46
3. PL experiments
A FluoroMax® spectrometer (HORIBA Scientific) was used for collecting all steady-state PL data, with excitation and emission slits of 1 nm. For PL experiments of MOF-based materials, 4.0 mg of the 2D-MOF solid was accurately weighted and ultrasonically dispersed in 10 mL of water. Thereafter, 1.5 mL of the obtained suspension was mixed with 1.5 mL of water, and the resulting 3 mL suspension was subjected to PL measurements at room temperature to collect the characteristic PL spectra of each material. For ion-sensing experiments, 1.5 mL of the concentrated suspension mentioned above was mixed with 1.5 mL of the aqueous solution containing a certain concentration of the targeted salt, and PL measurements were performed for this suspension. It should be noticed that the final concentration of the targeted salt in the 3 mL mixture was labelled for the PL data. For measuring the photoluminescence quantum yield (PLQY) of the material, the same FluoroMax® spectrometer equipped with a PLQY integrating sphere (QuantaPhi-2) was used, and the MOF powder was packed into a sample tray of QuantaPhi-2 for quantifying its PLQY at different excitation wavelengths.4. Instrumentation
Instrumental details for measurements of powder X-ray diffraction (PXRD), scanning electron microscopy (SEM), high-resolution transmission electron microscopy (HR-TEM) with energy-dispersive X-ray spectroscopy (EDS), nitrogen adsorption–desorption isotherms, NMR, ICP-OES, Fourier-transform infrared (FTIR) spectroscopy and X-ray photoelectron spectroscopy (XPS) are the same as those reported in our recent work.46 High-angle annular dark-field scanning transmission electron microscopy (HAADF-STEM) data were collected by using the same microscope for HR-TEM measurements. Protocols for preparing samples for NMR and ICP-OES measurements can also be found in the previous studies.46,54 UV–vis spectra of solid samples were collected by utilizing an UV-2600 (Shimadzu) with an integrating sphere and a powdered sample holder.Results and discussion
1. Material characterization
The PXRD patterns of all the 2D MOF-based materials are shown in Fig. 2. Diffraction peaks located at 5.1, 8.8 and 10.2 degrees, which are the major diffraction peaks of ZrBTB,47 can be observed in the experimental patterns of all the materials, indicating that the crystallinity of ZrBTB can be well preserved after both the coordination of bzpdc ligands and the subsequent installation of terbium ions. It is worth mentioning that bzpdc ligands can also be utilized as linkers to form another Zr-MOF, as reported by Behrens and coworkers.57 We thus reasoned that bzpdc ligands might bridge two adjacent molecular sheets of ZrBTB to generate a 3D network.58 But as shown in Fig. 2, no new diffraction peaks can be found after the incorporation of bzpdc, suggesting that such a 3D network with a long-range order is not observable in all materials here. This observation is similar to that for the PSM of tetrakis(4-carboxyphenyl)porphyrin in the as-synthesized ZrBTB reported previously, which was found to result in the ligand coordinated on one ZrBTB sheet along with uncoordinated carboxylic groups on the other side.49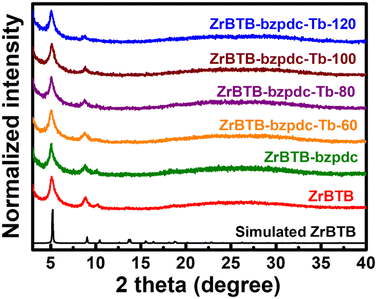 | ||
| Fig. 2 Experimental PXRD patterns of ZrBTB, ZrBTB-bzpdc and materials after the installation of terbium, along with the simulated pattern of ZrBTB. | ||
The porosity of each material was investigated by performing N2-adsorption–desorption measurements at 77 K, and the obtained isotherms are shown in Fig. S1(a).† Brunner–Emmett–Teller (BET) surface areas were then calculated from the isotherms by using the method reported previously,59–61 and the fitting results are plotted in Fig. S2.† ZrBTB possesses a low-pressure uptake and a hysteresis loop within the high-pressure region in its isotherm with a BET surface area of 316 m2 g−1, agreeing well with the reported characteristics of ZrBTB.62,63 All other materials after the installation of bzpdc and terbium have similar BET surface areas ranging from 233 to 338 m2 g−1, indicating that the major porosity of ZrBTB is not significantly altered by these PSM processes. Density functional theory (DFT) pore size distributions were thereafter extracted from the isotherms by employing the original DFT model for carbon-slit pores filled with N2 at 77 K. As shown in Fig. S1(b),† one major peak centred at around 1.2–1.3 nm can be observed for all the materials, which corresponds to the aperture on the 2D molecular sheet of ZrBTB. In addition, except for ZrBTB-bzpdc-Tb-120, all other materials reveal another peak centred at around 0.7–0.8 nm in their pore size distributions, which should originate from the inter-layer space between stacked ZrBTB sheets.47 This peak shifts to 1.0 nm in the pore size distribution of ZrBTB-bzpdc-Tb-120, which implies that the PSM at 120 °C might install more terbium ions on the sheet of ZrBTB-bzpdc, and the presence of both bzpdc ligands and more terbium ions expands the space between adjacent 2D-MOF sheets.
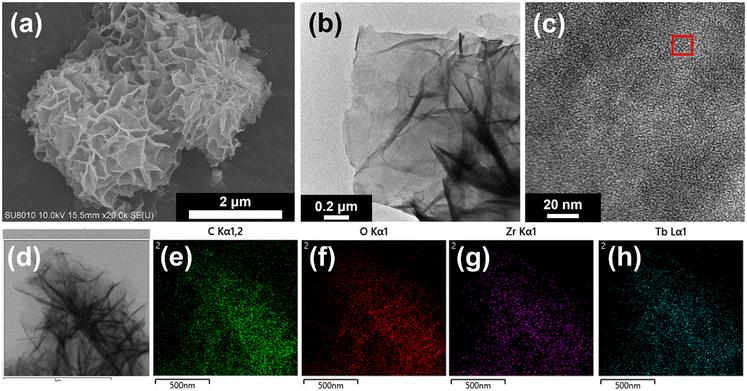
ZrBTB reveals a flower-like morphology composed of stacked 2D sheets in its SEM image (Fig. S3†), and this morphology is unchanged after the incorporation of both bzpdc and terbium (Fig. 3(a)). HR-TEM measurements were then performed to further probe the morphology of ZrBTB-bzpdc-Tb-120. A planar 2D sheet can be found in the HR-TEM image of ZrBTB-bzpdc-Tb-120 (Fig. 3(b)), and regularly aligned bright spots can be observed in the HAADF-STEM image of the 2D sheet, as indicated in Fig. 3(c). The average distance between these bright spots in the red rectangular region of Fig. 3(c) is 1.84 nm, which is consistent with the node-to-node distance present on the planar 2D sheet of ZrBTB. The result here clearly indicates that crystalline ZrBTB molecular sheets were successfully synthesized, and their structural integrity can be maintained after installing both bzpdc and terbium. EDS spectra of ZrBTB and ZrBTB-bzpdc-Tb-120 are displayed in Fig. S4,† suggesting the presence of terbium in ZrBTB-bzpdc-Tb-120. EDS elemental mapping data were then collected, and as shown in Fig. 3(d–h), uniform spatial distributions of Zr, C, O and Tb can be observed on the nanosheets of ZrBTB-bzpdc-Tb-120.
ICP-OES analysis was performed to quantify the loading of terbium in each material, and NMR spectra of digested materials were utilized to quantify the loadings of the bzpdc ligand. In addition, since Tb(OAc)3 was used as the precursor for installing terbium, acetate ligands could also be coordinated in the 2D MOF, both on the installed terbium ion to balance the charge and on the hexa-zirconium node of ZrBTB.46 Thus, NMR data were also used to quantify the loading of coordinated acetate in each terbium-functionalized material. NMR spectra are shown in Fig. S5 and S6 with detailed discussions in the ESI,† and loadings of bzpdc, terbium and acetate are listed in Tables S1 and S2† and plotted in Fig. 4. After the SALI process, there are on average 2.8 bzpdc ligands coordinated on each hexa-zirconium node of the 2D MOF, and this loading only shows a slight decrease to 2.5 ligands per node after further installations of terbium ions at all temperatures. This finding indicates that no obvious leaching of coordinated bzpdc ligands occurred during the installation of terbium. On the other hand, the loading of terbium increases significantly with increasing temperature of the second PSM. With the PSM at 60 °C, the loading is only 1.0 terbium ion per node, while performing PSM at 120 °C results in a loading of 3.3 terbium ions per node in the obtained ZrBTB-bzpdc-Tb-120. Such a tunable loading of terbium ions adjusted by the temperature of PSM was also observed for the installation of terbium in ZrBTB reported previously.46 The amount of coordinated acetate ions also increases with increasing temperature for installing terbium, while the ratio between acetate and terbium decreases with increasing temperature of PSM (see Table S2†). Since the acetate ion can be coordinated either on the installed terbium ion for charge compensation or on the hexa-zirconium cluster of the Zr-MOF,46 results here imply that a higher temperature for installing terbium may lead to a lower amount of acetate ions directly coordinated on each hexa-zirconium node of the MOF. Since most terbium ions in ZrBTB-bzpdc-Tb-120 are in the form of coordinated Tb(III) (as discussed later), which requires two acetate ions to balance the charge, the resulting acetate/Tb ratio of 2.0 implies that almost all acetate ions are not coordinated on the hexa-zirconium nodes of ZrBTB-bzpdc-Tb-120. For ZrBTB-Tb-120 without functionalizing bzpdc, an average loading of 4.4 terbium ions per node can be achieved.
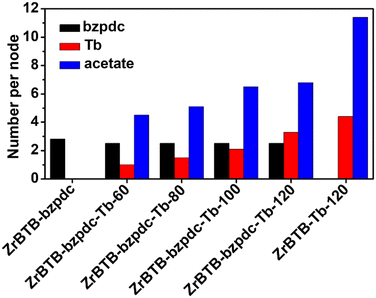 | ||
| Fig. 4 Loadings of coordinated bzpdc, terbium ions and acetate ions, summarized from NMR and ICP-OES results shown in Fig. S5 and S6 and Tables S1 and S2.† | ||
Since terbium ions might be coordinated on both the hexa-zirconium node of ZrBTB and the terminal carboxylic group of the coordinated bzpdc ligand, to probe the locations of terbium ions in the material, FTIR spectra of ZrBTB, ZrBTB-bzpdc and ZrBTB-bzpdc-Tb-120 were collected. For comparison, the spectrum of the H2bzpdc ligand was also collected, as plotted together in Fig. 5. Characteristic peaks located at 1606, 1590, 1451 and 1416 cm−1, which are associated with the coordinated carboxylate group and aromatic C![[double bond, length as m-dash]](https://www.rsc.org/images/entities/char_e001.gif) C bond of ZrBTB,46,63 can be observed in the spectra of all the MOF-based materials. The peak at 1654 cm−1 corresponds to the C
C bond of ZrBTB,46,63 can be observed in the spectra of all the MOF-based materials. The peak at 1654 cm−1 corresponds to the C![[double bond, length as m-dash]](https://www.rsc.org/images/entities/char_e001.gif) O bond in the ketone group of bzpdc,64 which can be seen in all FTIR spectra. One noticeable peak located at 1705 cm−1 belongs to the characteristic FTIR signal of the C
O bond in the ketone group of bzpdc,64 which can be seen in all FTIR spectra. One noticeable peak located at 1705 cm−1 belongs to the characteristic FTIR signal of the C![[double bond, length as m-dash]](https://www.rsc.org/images/entities/char_e001.gif) O bond present in the uncoordinated carboxylic group.54,63,65 This peak with a weak intensity can be observed in the FTIR spectrum of ZrBTB, implying the presence of BTB linkers that are not fully coordinated, either on the edge of MOF sheets or at the defective sites.63 This peak is still obvious in the FTIR spectrum of ZrBTB-bzpdc, but completely disappears in the spectrum of ZrBTB-bzpdc-Tb-120. This finding clearly indicates that during the second PSM, terbium ions were coordinated onto the uncoordinated carboxylic groups of both the installed bzpdc ligand and the edged BTB linker. Another group of notable FTIR peaks is those located at 1269, 1293 and 935 cm−1, corresponding to the –OH bond present in the carboxylic group of H2bzpdc.64 It can be observed that these peaks are well observable in both the FTIR spectra of ZrBTB-bzpdc and ZrBTB-bzpdc-Tb-120, confirming that the terbium ion was coordinated onto the carboxylic group through substituting C–O–Tb for C
O bond present in the uncoordinated carboxylic group.54,63,65 This peak with a weak intensity can be observed in the FTIR spectrum of ZrBTB, implying the presence of BTB linkers that are not fully coordinated, either on the edge of MOF sheets or at the defective sites.63 This peak is still obvious in the FTIR spectrum of ZrBTB-bzpdc, but completely disappears in the spectrum of ZrBTB-bzpdc-Tb-120. This finding clearly indicates that during the second PSM, terbium ions were coordinated onto the uncoordinated carboxylic groups of both the installed bzpdc ligand and the edged BTB linker. Another group of notable FTIR peaks is those located at 1269, 1293 and 935 cm−1, corresponding to the –OH bond present in the carboxylic group of H2bzpdc.64 It can be observed that these peaks are well observable in both the FTIR spectra of ZrBTB-bzpdc and ZrBTB-bzpdc-Tb-120, confirming that the terbium ion was coordinated onto the carboxylic group through substituting C–O–Tb for C![[double bond, length as m-dash]](https://www.rsc.org/images/entities/char_e001.gif) O rather than replacing the proton of –OH during the PSM, as illustrated in Fig. 1.
O rather than replacing the proton of –OH during the PSM, as illustrated in Fig. 1.
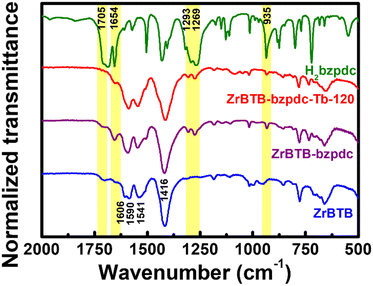 | ||
| Fig. 5 FTIR spectra of ZrBTB, ZrBTB-bzpdc, ZrBTB-bzpdc-Tb-120 and H2bzpdc. Some characteristic peaks of H2bzpdc are marked in yellow. | ||
Since the loading of terbium is higher than that of bzpdc on each hexa-zirconium node of ZrBTB-bzpdc-Tb-120, XPS spectra of ZrBTB, ZrBTB-bzpdc and ZrBTB-bzpdc-Tb-120 were collected in the region of Zr 3d in order to examine if terbium ions were also directly coordinated on the hexa-zirconium node. As shown in Fig. 6, the Zr 3d5/2 peak of ZrBTB reveals a negative shift of 0.1 eV after the installation of the bzpdc ligand; a similar observation was also reported for the incorporation of other carboxylate-based ligands in another Zr-MOF via SALI.66 On the other hand, the installation of terbium ions in the pristine ZrBTB results in a large negative shift of 0.4 eV in the Zr 3d5/2 peak, indicating that the terbium ion with a lower electronegativity can render the adjacent zirconium-based node more electron-rich after the coordination of terbium ions on the node.46 After the installation of terbium ions in ZrBTB-bzpdc, a similar negative shift of 0.2 eV is also observable in the spectrum of ZrBTB-bzpdc-Tb-120 compared to that of ZrBTB-bzpdc. This finding clearly indicates that in addition to being coordinated on the terminal carboxylic group, terbium ions were also coordinated onto the zirconium-based cluster of the 2D MOF during the second PSM process. Both FTIR and XPS data suggest that in ZrBTB-bzpdc-Tb-120, bzpdc ligands are coordinated on the hexa-zirconium node of ZrBTB, and terbium ions are coordinated on both the node of ZrBTB and the initially uncoordinated carboxylic groups of both the installed bzpdc ligand and the edged BTB linker through forming the C–O–Tb bond to replace the C![[double bond, length as m-dash]](https://www.rsc.org/images/entities/char_e001.gif) O bond; this node structure is illustrated in Fig. 1. XPS data were also collected in the region of Tb 3d, and as shown in Fig. S7,† terbium atoms present in both ZrBTB-bzpdc-Tb-120 and ZrBTB-Tb-120 are mainly composed of Tb(III) ions.
O bond; this node structure is illustrated in Fig. 1. XPS data were also collected in the region of Tb 3d, and as shown in Fig. S7,† terbium atoms present in both ZrBTB-bzpdc-Tb-120 and ZrBTB-Tb-120 are mainly composed of Tb(III) ions.
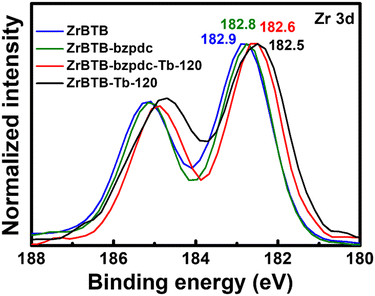 | ||
| Fig. 6 XPS spectra of ZrBTB, ZrBTB-bzpdc, ZrBTB-bzpdc-Tb-120 and ZrBTB-Tb-120, collected in the region of Zr 3d. Locations of Zr 3d5/2 peaks are marked. | ||
2. PL properties
UV-vis spectra of all the solid materials were first collected, and the data are shown in Fig. S8.† All the MOF-based materials show a strong absorption band centred at around 300 nm in their spectra, corresponding to the absorbance of the BTB linker. On the other hand, the H2bzpdc ligand reveals another obvious peak of absorption centred at around 360 nm in its spectrum, and such an absorbance can be observed as humps in the spectra of both ZrBTB-bzpdc and ZrBTB-bzpdc-Tb-120. This result indicates that MOF materials with coordinated bzpdc ligands may be excited under illumination at around 360 nm with the bzpdc ligand as the antenna to induce energy transfer to terbium ions.PL measurements were then conducted for the suspension of each 2D-MOF material in water with a concentration of 0.2 mg mL−1. Prior to collecting the emission data, excitation spectra of all the terbium-functionalized materials were first collected by probing the major emission of terbium at 543 nm. As revealed in Fig. S9,† all the materials including ZrBTB-Tb-120 can achieve the maximum emission of terbium under excitation at around 310 nm, which is attributed to the excitation of BTB linkers that can induce energy transfer to terbium. It should be noted that the energy transfer from the BTB linker to the coordinated terbium occurring in ZrBTB-Tb-120 has been studied in our recent work.46 In addition, all the four MOF materials containing bzpdc ligands show an obvious hump centred at around 355 nm in their excitation spectra; this observation again confirms that the photoluminescence of installed terbium ions can be turned on with the excited bzpdc serving as the antenna.
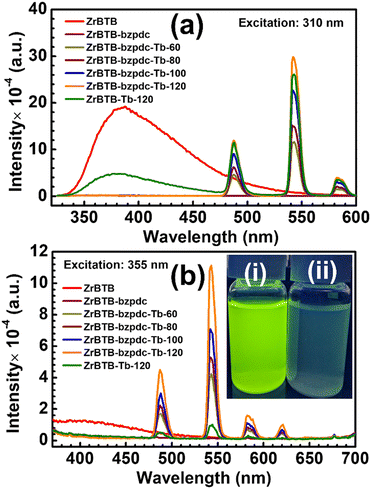
Emission spectra of all the 2D-MOF materials were then collected, under excitation at both 310 nm and 355 nm, and the data are presented in Fig. 7(a) and (b), respectively. Under excitation at 310 nm, a broad peak of emission can be observed at around 380 nm in the spectrum of ZrBTB, which corresponds to the PL characteristic of BTB linkers in the MOF.46 For ZrBTB-Tb-120, its spectrum exhibits a weaker emission from BTB linkers along with three strong peaks corresponding to the PL response of installed terbium ions. Such an energy transfer from the excited BTB linker to the installed terbium has been investigated in our previous work.46 On the other hand, the incorporation of the bzpdc ligand in the 2D MOF completely quenches the emission of BTB linkers without generating any new peak of emission, implying the possible transfer of energy from the excited BTB linker to the installed bzpdc ligand. It is worth mentioning that since the bzpdc ligand can undergo almost 100% intersystem crossing to transfer energy to its triplet state upon excitation,67,68 its resulting phosphorescence was barely observable in the aqueous solution (Fig. S10†). But owing to the highly efficient energy transfer from the bzpdc ligand to the adjacent terbium ion,55,56 after the incorporation of various amounts of terbium ions in the 2D MOF, strong PL responses of terbium can be observed in their emission spectra without any observable emission from the BTB linker. ZrBTB-bzpdc-Tb-120, possessing a lower loading of terbium ions compared to ZrBTB-Tb-120, can even achieve a stronger emission of terbium under excitation at 310 nm.
Moreover, with the installed bzpdc ligand that can induce highly efficient intramolecular energy transfer to the adjacent terbium ion upon excitation,55,56 these materials containing both terbium and bzpdc can exhibit remarkable PL properties under illumination at 355 nm (see Fig. 7(b)). The intensity of PL responses from terbium increases with increasing temperature for installing terbium ions, and ZrBTB-bzpdc-Tb-120 can achieve the strongest emission among all the materials. On the other hand, ZrBTB-Tb-120 only reveals fairly weak peaks of emission from terbium under excitation at 355 nm owing to the poor absorption of the BTB linker at this wavelength. ZrBTB-bzpdc-Tb-120 can thus exhibit a strong green fluorescence under illumination of a 365 nm handheld UV lamp, as illustrated in the inset of Fig. 7(b). The material can also exhibit a highly stable photoluminescence in water; the PL response is barely altered after keeping the aqueous suspension of ZrBTB-bzpdc-Tb-120 for 2 h (Fig. S11†).
PLQY values of ZrBTB-bzpdc-Tb-120 and ZrBTB-Tb-120 were quantified, under excitation at both 310 nm and 355 nm, respectively, and the data are displayed in Fig. S12–S15.† The resulting values are summarized in Table 1. It can be observed that by directly exciting the bzpdc ligand at 355 nm to induce the energy transfer to terbium ions, a PLQY of 5.04% can be achieved for ZrBTB-bzpdc-Tb-120, which is almost the same as that achieved by exciting the material at 310 nm (5.08%). These values are significantly higher than the PLQY values of ZrBTB-Tb-120, even though ZrBTB-Tb-120 has a higher loading of terbium ions per node. Results here indicate that the bzpdc ligand can act as a better antenna to sensitize the neighbouring terbium ions compared to the BTB linker.
| Material | Excitation wavelength (nm) | Quantum yield (%) |
|---|---|---|
| ZrBTB-bzpdc-Tb-120 | 310 | 5.08 ± 0.008 |
| 355 | 5.04 ± 0.035 | |
| ZrBTB-Tb-120 | 310 | 2.94 ± 0.008 |
| 355 | 1.37 ± 0.077 |
3. PL detection of Fe(III) ions
Since it has been widely reported that terbium-based materials can be utilized in the turn-off PL detection of Fe(III) ions,69–72 as a demonstration, ZrBTB-bzpdc-Tb-120 was applied for sensing Fe(III) ions in water under excitation at 355 nm, a more friendly wavelength compared to 310 nm. The obtained emission spectra are shown in Fig. 8(a), and it can be observed that the intensities of all the three emission peaks from terbium decrease gradually with increasing concentration of Fe(III) ions ([Fe(III)]). The intensity at 543 nm in the spectrum collected in the absence of any analyte (I0) and those collected in the presence of various [Fe(III)] (I) were recorded from the data, and the plot of (I0/I − 1) vs. [Fe(III)] is shown as the inset of Fig. 8(a). A linear relationship can be observed from 0 to 150 μM, and according to the Stern–Volmer equation, the slope in this plot, i.e., 8970 M−1, represents the Stern–Volmer constant (KSV) for turn-off PL sensing.73 By utilizing the standard deviation of PL responses at 543 nm before adding the analyte obtained from six multiple measurements and a signal-to-noise ratio of 3,46 the limit of detection (LOD) of the ZrBTB-bzpdc-Tb-120-based PL sensor for Fe(III) ions was determined as 2.8 μM. Table S3† compares the performance of the ZrBTB-bzpdc-Tb-120-based PL sensor with those of other published MOF-based PL sensors for detecting Fe(III) ions in water, which suggests that both KSV and LOD achieved by ZrBTB-bzpdc-Tb-120 are moderate among all. To gauge the selectivity of the sensor, solutions of fifteen salts with various kinds of common cations and anions in water were employed, and the obtained emission spectra of ZrBTB-bzpdc-Tb-120 are plotted in Fig. S16;† similar experimental protocols have been reported for other materials applied for the PL detection of metal ions.74–78 Values of I/I0 at 543 nm were then extracted from Fig. S16† and plotted in Fig. 8(b). The result indicates that the material shows a good selectivity toward Fe(III) ions against all interferents except Cu(II) ions. The stability of the material was also tested, and as shown in Fig. S17,† the structural integrity of the 2D MOF can be well preserved after the exposure to the aqueous solution containing Fe(III) ions.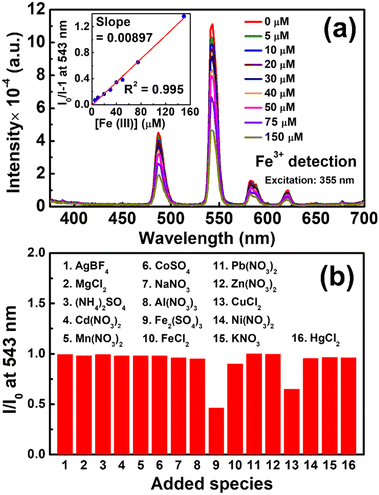 | ||
| Fig. 8 (a) Emission spectra of ZrBTB-bzpdc-Tb-120 dispersed in water with a concentration of 0.2 mg mL−1 containing various concentrations of Fe2(SO4)3, collected under excitation at 355 nm. Plot of (I0/I − 1) vs. [Fe(III)] is shown as the inset of (a). (b) I/I0 obtained from the spectra collected in the presence of 100 μM of various added species; data are presented in Fig. S16.† | ||
Conclusions
Bzpdc ligands can be coordinated on the node of a 2D Zr-MOF, ZrBTB, and terbium ions can be thereafter functionalized onto both the terminal carboxylic group of the bzpdc ligand and the hexa-zirconium node of the Zr-MOF. By performing the second PSM, i.e., the installation of terbium ions, at various temperatures, the loading of terbium ions in the MOF can be increased with increasing temperature, while the loading of bzpdc ligands remains almost the same. The crystallinity, morphology, and major porosity of the 2D Zr-MOF can be preserved after the two steps of PSM, and a uniform spatial distribution of terbium can be observed on the 2D nanosheets of ZrBTB-bzpdc-Tb-120. By utilizing the bzpdc ligand as the antenna to induce the highly efficient energy transfer to the adjacent terbium ion upon excitation, the ZrBTB-bzpdc-Tb-120 material can reveal strong PL responses of installed terbium ions under illumination at 355 nm, with a PLQY of 5.04%. On the other hand, for the direct installation of terbium ions on ZrBTB without functionalizing the photosensitizing ligand, the resulting material, ZrBTB-Tb-120, even though having a higher loading of terbium ions, requires an excitation at 310 nm to induce the energy transfer from the MOF linker to the terbium ion to achieve similar PL intensities, with a lower PLQY of 2.94%. ZrBTB-bzpdc-Tb-120 can be well dispersed in the form of aqueous suspension, and the crystalline structure and PL property of the MOF are highly stable in water. The material can be used as a PL sensor for Fe(III) ions in aqueous solutions, with a KSV of 8970 M−1, a LOD of 2.8 μM, and a good selectivity toward Fe(III) ions against most commonly seen ionic species. Findings here show that the water-stable, porous, and highly dispersible 2D Zr-MOF, ZrBTB, can be employed as a platform for dual modifications of both the photosensitizing moiety and the luminescent lanthanide ion; selections of both the photosensitizer and lanthanide are thus decoupled from the structural design of the MOF and can be implemented solely depending on the targeted application.Conflicts of interest
There are no conflicts to declare.Acknowledgements
We acknowledge the financial support from National Science and Technology Council (NSTC) of Taiwan under the grants 112-2223-E-006-003-MY3, 112-2218-E-006-022 and 112-2926-I-006-503-G. This work was also supported by Ministry of Education (MOE) of Taiwan, under both Yushan Young Scholar Program and Higher Education Sprout Project at National Cheng Kung University (NCKU). We also appreciate the help from the Core Facility Center of NCKU for XPS, HR-TEM and HAADF-STEM experiments. NMR experiments and data collection were supported by Ms. Pi-Yun Lin in the Core Facility Center of NCKU.References
- J.-C. G. Bünzli and C. Piguet, Chem. Soc. Rev., 2005, 34, 1048–1077 RSC.
- S. V. Eliseeva and J.-C. G. Bünzli, Chem. Soc. Rev., 2010, 39, 189–227 RSC.
- H. Furukawa, K. E. Cordova, M. O'Keeffe and O. M. Yaghi, Science, 2013, 341, 1230444 CrossRef PubMed.
- S. Kitagawa, R. Kitaura and S.-I. Noro, Angew. Chem., Int. Ed., 2004, 43, 2334–2375 CrossRef CAS PubMed.
- S. M. Cohen, Chem. Rev., 2012, 112, 970–1000 CrossRef CAS PubMed.
- S. Jeoung, S. Kim, M. Kim and H. R. Moon, Coord. Chem. Rev., 2020, 420, 213377 CrossRef CAS.
- U. Ryu, S. Jee, P. C. Rao, J. Shin, C. Ko, M. Yoon, K. S. Park and K. M. Choi, Coord. Chem. Rev., 2021, 426, 213544 CrossRef CAS PubMed.
- C. Y. Heo, M. L. Díaz-Ramírez, S. H. Park, M. Kang, C. S. Hong and N. C. Jeong, ACS Appl. Mater. Interfaces, 2024, 16, 9068–9077 CrossRef CAS PubMed.
- J. Lee, O. K. Farha, J. Roberts, K. A. Scheidt, S. T. Nguyen and J. T. Hupp, Chem. Soc. Rev., 2009, 38, 1450–1459 RSC.
- T. Zhang and W. Lin, Chem. Soc. Rev., 2014, 43, 5982–5993 RSC.
- A. Bavykina, N. Kolobov, I. S. Khan, J. A. Bau, A. Ramirez and J. Gascon, Chem. Rev., 2020, 120, 8468–8535 CrossRef CAS PubMed.
- A. H. Valekar, M. Lee, J. W. Yoon, J. Kwak, D.-Y. Hong, K.-R. Oh, G.-Y. Cha, Y.-U. Kwon, J. Jung, J.-S. Chang and Y. K. Hwang, ACS Catal., 2020, 10, 3720–3732 CrossRef CAS.
- X. Dong, Y. Li, D. Li, D. Liao, T. Qin, O. Prakash, A. Kumar and J. Liu, CrystEngComm, 2022, 24, 6933–6943 RSC.
- C. Altintas, I. Erucar and S. Keskin, CrystEngComm, 2022, 24, 7360–7371 RSC.
- S. H. Park, R. A. Peralta, D. Moon and N. C. Jeong, J. Mater. Chem. A, 2022, 10, 23499–23508 RSC.
- A. Sharma, S. Lee, J. Lim and M. S. Lah, Bull. Korean Chem. Soc., 2024, 45, 145–156 CrossRef CAS.
- W. P. Lustig, S. Mukherjee, N. D. Rudd, A. V. Desai, J. Li and S. K. Ghosh, Chem. Soc. Rev., 2017, 46, 3242–3285 RSC.
- I. Stassen, N. Burtch, A. Talin, P. Falcaro, M. Allendorf and R. Ameloot, Chem. Soc. Rev., 2017, 46, 3185–3241 RSC.
- M. G. Campbell and M. Dincă, Sensors, 2017, 17, 1108 CrossRef PubMed.
- C.-H. Chuang and C.-W. Kung, Electroanalysis, 2020, 32, 1885–1895 CrossRef CAS.
- T. Wu, X.-J. Gao, F. Ge and H.-G. Zheng, CrystEngComm, 2022, 24, 7881–7901 RSC.
- M. D. Allendorf, C. A. Bauer, R. K. Bhakta and R. J. T. Houk, Chem. Soc. Rev., 2009, 38, 1330–1352 RSC.
- J. Rocha, L. D. Carlos, F. A. A. Paz and D. Ananias, Chem. Soc. Rev., 2011, 40, 926–940 RSC.
- Y. Cui, Y. Yue, G. Qian and B. Chen, Chem. Rev., 2012, 112, 1126–1162 CrossRef CAS PubMed.
- Y.-X. Sun, G. Guo, W.-M. Ding, W.-Y. Han, J. Li and Z.-P. Deng, CrystEngComm, 2022, 24, 1358–1367 RSC.
- Q.-Q. He, S.-L. Yao, T.-F. Zheng, H. Xu, S.-J. Liu, J.-L. Chen, N. Li and H.-R. Wen, CrystEngComm, 2022, 24, 1041–1048 RSC.
- N. C. Burtch, H. Jasuja and K. S. Walton, Chem. Rev., 2014, 114, 10575–10612 CrossRef CAS PubMed.
- A. J. Howarth, Y. Liu, P. Li, Z. Li, T. C. Wang, J. T. Hupp and O. K. Farha, Nat. Rev. Mater., 2016, 1, 15018 CrossRef CAS.
- S. Yuan, J.-S. Qin, C. T. Lollar and H.-C. Zhou, ACS Cent. Sci., 2018, 4, 440–450 CrossRef CAS PubMed.
- S. Pal, S.-S. Yu and C.-W. Kung, Chemosensors, 2021, 9, 306 CrossRef CAS.
- Z. Hu, Y. Wang and D. Zhao, Chem. Soc. Rev., 2021, 50, 4629–4683 RSC.
- J. H. Cavka, S. Jakobsen, U. Olsbye, N. Guillou, C. Lamberti, S. Bordiga and K. P. Lillerud, J. Am. Chem. Soc., 2008, 130, 13850–13851 CrossRef PubMed.
- Z. Chen, S. L. Hanna, L. R. Redfern, D. Alezi, T. Islamoglu and O. K. Farha, Coord. Chem. Rev., 2019, 386, 32–49 CrossRef CAS.
- T. C. Wang, W. Bury, D. A. Gómez-Gualdrón, N. A. Vermeulen, J. E. Mondloch, P. Deria, K. Zhang, P. Z. Moghadam, A. A. Sarjeant, R. Q. Snurr, J. F. Stoddart, J. T. Hupp and O. K. Farha, J. Am. Chem. Soc., 2015, 137, 3585–3591 CrossRef CAS PubMed.
- L. Li, S. Shen, W. Ai, S. Song, Y. Bai and H. Liu, Sens. Actuators, B, 2018, 267, 542–548 CrossRef CAS.
- J.-F. Feng, S.-Y. Gao, T.-F. Liu, J. Shi and R. Cao, ACS Appl. Mater. Interfaces, 2018, 10, 6014–6023 CrossRef CAS PubMed.
- J. Zhang, S. B. Peh, J. Wang, Y. Du, S. Xi, J. Dong, A. Karmakar, Y. Ying, Y. Wang and D. Zhao, Chem. Commun., 2019, 55, 4727–4730 RSC.
- H. S. Jena, A. M. Kaczmarek, C. Krishnaraj, X. Feng, K. Vijayvergia, H. Yildirim, S.-N. Zhao, R. Van Deun and P. V. Der Voort, Cryst. Growth Des., 2019, 19, 6339–6350 CrossRef CAS.
- X. Zhang, W. Zhang, G. Li, Q. Liu, Y. Xu and X. Liu, Microchim. Acta, 2020, 187, 122 CrossRef CAS PubMed.
- S. Kim, J. Lee, S. Jeoung, H. R. Moon and M. Kim, Dalton Trans., 2020, 49, 8060–8066 RSC.
- K. Yi, H. Li, X. Zhang and L. Zhang, Inorg. Chem., 2021, 60, 3172–3180 CrossRef CAS PubMed.
- X. Yue, L. Fu, J. Zhou, Y. Li, M. Li, Y. Wang and Y. Bai, Food Chem., 2024, 432, 137213 CrossRef CAS PubMed.
- H.-Q. Yuan, W. Li, Y.-F. Xia, S.-Y. Liu, Y.-F. Zhong, Z.-C. Dou, X. Wei, R. Wang, P. Chen, Y.-X. Li and G.-M. Bao, Analyst, 2024, 149, 395–402 RSC.
- Z. Li, D. Zhan, A. Saeed, N. Zhao, J. Wang, W. Xu and J. Liu, Dalton Trans., 2021, 50, 8540–8548 RSC.
- H. Xu, J. Gao, X. Qian, J. Wang, H. He, Y. Cui, Y. Yang, Z. Wang and G. Qian, J. Mater. Chem. A, 2016, 4, 10900–10905 RSC.
- Y.-L. Chen, C.-H. Shen, C.-W. Huang and C.-W. Kung, Mol. Syst. Des. Eng., 2023, 8, 330–340 RSC.
- J. Ma, A. G. Wong-Foy and A. J. Matzger, Inorg. Chem., 2015, 54, 4591–4593 CrossRef CAS PubMed.
- Z. Hu, E. M. Mahdi, Y. Peng, Y. Qian, B. Zhang, N. Yan, D. Yuan, J.-C. Tan and D. Zhao, J. Mater. Chem. A, 2017, 5, 8954–8963 RSC.
- Y. Wang, L. Feng, J. Pang, J. Li, N. Huang, G. S. Day, L. Cheng, H. F. Drake, Y. Wang, C. Lollar, J. Qin, Z. Gu, T. Lu, S. Yuan and H.-C. Zhou, Adv. Sci., 2019, 6, 1802059 CrossRef PubMed.
- L. Feng, Y. Qiu, Q.-H. Guo, Z. Chen, J. S. W. Seale, K. He, H. Wu, Y. Feng, O. K. Farha, R. D. Astumian and J. F. Stoddart, Science, 2021, 374, 1215–1221 CrossRef CAS PubMed.
- P. Deria, J. E. Mondloch, E. Tylianakis, P. Ghosh, W. Bury, R. Q. Snurr, J. T. Hupp and O. K. Farha, J. Am. Chem. Soc., 2013, 135, 16801–16804 CrossRef CAS PubMed.
- T. Islamoglu, S. Goswami, Z. Li, A. J. Howarth, O. K. Farha and J. T. Hupp, Acc. Chem. Res., 2017, 50, 805–813 CrossRef CAS PubMed.
- R. Shimoni, Z. Shi, S. Binyamin, Y. Yang, I. Liberman, R. Ifraemov, S. Mukhopadhyay, L. Zhang and I. Hod, Angew. Chem., Int. Ed., 2022, 61, e202206085 CrossRef CAS PubMed.
- C.-H. Shen, Y.-N. Chang, Y.-L. Chen and C.-W. Kung, ACS Mater. Lett., 2023, 5, 1938–1943 CrossRef CAS.
- A. Beeby, L. M. Bushby, D. Maffeo and J. A. G. Williams, J. Chem. Soc., Perkin Trans. 2, 2000, 1281–1283 RSC.
- Y. Shiraishi, Y. Furubayashi, G. Nishimura and T. Hirai, J. Lumin., 2007, 126, 68–76 CrossRef CAS.
- A. Mohmeyer, M. Schäfer, A. Schaate, S. Locmelis, A. M. Schneider and P. Behrens, Chem. – Eur. J., 2020, 26, 2222–2232 CrossRef CAS PubMed.
- S. Yuan, J.-S. Qin, L. Zou, Y.-P. Chen, X. Wang, Q. Zhang and H.-C. Zhou, J. Am. Chem. Soc., 2016, 138, 6636–6642 CrossRef CAS PubMed.
- Z. Jiang, Y. Zou, T. Xu, L. Fan, P. Zhou and Y. He, Dalton Trans., 2020, 49, 3553–3561 RSC.
- T. Xu, Z. Jiang, P. Liu, H. Chen, X. Lan, D. Chen, L. Li and Y. He, ACS Appl. Nano Mater., 2020, 3, 2911–2919 CrossRef CAS.
- T. Xu, L. Fan, Z. Jiang, P. Zhou, Z. Li, H. Lu and Y. He, Dalton Trans., 2020, 49, 7174–7181 RSC.
- H. Li, K. Gao, B. Mo, Q. Meng, K. Li, J. Wu and H. Hou, Dalton Trans., 2021, 50, 3348–3355 RSC.
- M.-D. Tsai, Y.-L. Chen, J.-W. Chang, S.-C. Yang and C.-W. Kung, ACS Appl. Energy Mater., 2023, 6, 11268–11277 CrossRef CAS.
- T. Hajiashrafi, M. Sheikholeslami, M. A. Arjanaki, S. Tarighi, Z. Guo and P. C. Junk, New J. Chem., 2023, 47, 2230–2239 RSC.
- K. I. Hadjiivanov, D. A. Panayotov, M. Y. Mihaylov, E. Z. Ivanova, K. K. Chakarova, S. M. Andonova and N. L. Drenchev, Chem. Rev., 2021, 121, 1286–1424 CrossRef CAS PubMed.
- J. Liu, Z. Li, X. Zhang, K.-I. Otake, L. Zhang, A. W. Peters, M. J. Young, N. M. Bedford, S. Letourneau, D. J. Mandia, J. W. Elam, O. K. Farha and J. T. Hupp, ACS Catal., 2019, 9, 3198–3207 CrossRef CAS.
- M. Baroncini, G. Bergamini and P. Ceroni, Chem. Commun., 2017, 53, 2081–2093 RSC.
- A. M. Turek, G. Krishnamoorthy, K. Phipps and J. Saltiel, J. Phys. Chem. A, 2002, 106, 6044–6052 CrossRef CAS.
- Q. Wang and C. Tan, Anal. Chim. Acta, 2011, 708, 111–115 CrossRef CAS PubMed.
- M.-L. Han, G.-W. Xu, D.-S. Li, L. M. Azofra, J. Zhao, B. Chen and C. Sun, ChemistrySelect, 2016, 1, 3555–3561 CrossRef CAS.
- K.-Y. Wu, L. Qin, C. Fan, S.-L. Cai, T.-T. Zhang, W.-H. Chen, X.-Y. Tang and J.-X. Chen, Dalton Trans., 2019, 48, 8911–8919 RSC.
- X. Yu, A. A. Ryadun, D. I. Pavlov, T. Y. Guselnikova, A. S. Potapov and V. P. Fedin, Angew. Chem., Int. Ed., 2023, 62, e202306680 CrossRef CAS PubMed.
- H. Min, Z. Han, M. Wang, Y. Li, T. Zhou, W. Shi and P. Cheng, Inorg. Chem. Front., 2020, 7, 3379–3385 RSC.
- H. Xu, J. Gao, X. Qian, J. Wang, H. He, Y. Cui, Y. Yang, Z. Wang and G. Qian, J. Mater. Chem. A, 2016, 4, 10900–10905 RSC.
- B. Wang, Q. Yang, C. Guo, Y. Sun, L.-H. Xie and J.-R. Li, ACS Appl. Mater. Interfaces, 2017, 9, 10286–10295 CrossRef CAS PubMed.
- Q. Zhang, J. Wang, A. M. Kirillov, W. Dou, C. Xu, C. Xu, L. Yang, R. Fang and W. Liu, ACS Appl. Mater. Interfaces, 2018, 10, 23976–23986 CrossRef CAS PubMed.
- Y.-T. Yan, J. Liu, G.-P. Yang, F. Zhang, Y.-K. Fan, W.-Y. Zhang and Y.-Y. Wang, CrystEngComm, 2018, 20, 477–486 RSC.
- Z.-Y. Yang, C. Cao, X. Sang, Y.-X. Hong, H. Yu, C.-Y. Ni and J.-P. Lang, CrystEngComm, 2022, 24, 1564–1572 RSC.
Footnote |
| † Electronic supplementary information (ESI) available: Additional experimental data. See DOI: https://doi.org/10.1039/d4ce00266k |
| This journal is © The Royal Society of Chemistry 2024 |

