
 Open Access Article
 This Open Access Article is licensed under a
 Creative Commons Attribution 3.0 Unported Licence
Project M: investigating the effect of additives on calcium carbonate crystallisation through a school citizen science program†‡
Claire A.
Murray§
 *a,
Project M
Scientists
,
Laura
Holland
b,
Rebecca
O'Brien
c,
Alice
Richards
a,
Annabelle R.
Baker
a,
Mark
Basham
b,
David
Bond
a,
Leigh D.
Connor
a,
Sarah J.
Day
a,
Jacob
Filik
a,
Stuart
Fisher
d,
Peter
Holloway
a,
Karl
Levik
a,
Ronaldo
Mercado
a,
Jonathan
Potter
a,
Chiu C.
Tang
a,
Stephen P.
Thompson
a and
Julia E.
Parker§
*a
*a,
Project M
Scientists
,
Laura
Holland
b,
Rebecca
O'Brien
c,
Alice
Richards
a,
Annabelle R.
Baker
a,
Mark
Basham
b,
David
Bond
a,
Leigh D.
Connor
a,
Sarah J.
Day
a,
Jacob
Filik
a,
Stuart
Fisher
d,
Peter
Holloway
a,
Karl
Levik
a,
Ronaldo
Mercado
a,
Jonathan
Potter
a,
Chiu C.
Tang
a,
Stephen P.
Thompson
a and
Julia E.
Parker§
*a
aDiamond Light Source, Harwell Science and Innovation Campus, Didcot OX11 0DE, UK. E-mail: drclairemurray@gmail.com; julia.parker@diamond.ac.uk
bRosalind Franklin Institute, Harwell Science and Innovation Campus, Didcot OX11 0QS, UK
cWellcome Trust, Gibbs Building, 215 Euston Road, London NW1 2BE, UK
dEuropean Synchrotron Radiation Facility, 71 Avenue des Martyrs, 38043 Grenoble, France
First published on 29th January 2024
Abstract
Calcite and vaterite crystallisation is strongly influenced by the presence of additives during the reaction process, as demonstrated by organic molecules in biogenic calcium carbonate formation. The effect of additives on the lattice parameters of calcite and vaterite in syntheses are frequently reported, but only as discrete studies discussing a single polymorph. The intertwined nature of these polymorphs, due to their shared reaction pathway, is rarely discussed. In this work we report the results of a large scale citizen science project to explore the influence of amino acids and related additives on both polymorphs, highlighting their differences and commonalities in terms of the effect on the lattice parameters and polymorph selectivity.
Introduction
Crystallisation, in particular controlling and directing crystal formation, is an important process in many contexts including industrial processing for pharmaceuticals, manufacturing materials and food stuffs. Nature is already an expert in controlling crystallisation, with over 60 different biominerals produced by the activity of living things,1,2 often having exquisite hierarchical structures. Calcium carbonate is the most abundant biomineral, being produced by organisms for use as shells, skeletal supports, and even optical lenses, and is therefore extensively studied.Calcium carbonate can exist in several different polymorphic forms: calcite, aragonite and vaterite.3 There are also hydrated forms: ikaite (CaCO3·6H2O) and monohydrocalcite (CaCO3·H2O). Vaterite is described as metastable, yet is frequently stabilised in biomineral form.4 Organisms exhibit fine control over both the polymorph of calcium carbonate precipitated, and the crystal morphology via a matrix of proteins and macromolecules, frequently involving (multiple) amorphous and crystalline states as well as several polymorphs.5–7 For example, mollusc shells consist of approximately 95% CaCO3 and 1–5% organic components.8 This matrix also increases the strength of the calcium carbonate biomineral, in a similar way to a composite material, providing high fracture toughness.9,10 There is much interest in exploring the mechanism by which biominerals are formed and exploiting biomineralisation to produce improved engineering and structural materials and to control crystal growth. However, even after many diffraction, spectroscopy and imaging characterisation studies, the detailed role of the organic scaffold in directing biomineralisation is still not fully understood.1,2,11
Microstructures of biogenically different nanocrystals have been shown to exhibit anisotropic lattice distortions, attributed to the influence of macromolecules during biomineralisation.12–15 Given the complexity and large number of factors involved, it is not possible to replicate the overall effect of an organic matrix on biomineral formation in the laboratory. Instead, simplified systems are chosen – with limited variables (e.g., solution pH, additive, concentration) to try to isolate, understand and predict individual effects. ‘Doping’ crystals or using additives to tune crystal properties has therefore been widely explored in the literature,10,16–20 with much interest directed towards amino acids as simplified analogues for the protein sequences directing the organic matrix. The impact of additives on the final crystals is evident; from observations of polymorph formation and crystallisation kinetics right through to anisotropic lattice distortions on a similar scale to those observed in biogenic calcium carbonates.12,21,22
The focus on anisotropic lattice distortions in the context of amino acid-directed syntheses of calcium carbonate has raised many questions about the occlusion or incorporation of additives into the CaCO3 crystal structure(s). The reaction pathways for these polymorphs are clearly interwoven; for example, in this work the synthesis method used leads to rapid vaterite formation, via an amorphous calcium carbonate phase, followed by slower transformation to calcite.23 The question of how the additive affects polymorph selectivity is therefore pertinent. The kinetics of formation and transformation will also have implications for how the additive is distributed in the structure.24 However, these synthesis efforts have generally focused on targeting individual polymorphs with little discussion about the presence or lack of additional polymorphs. Indeed, some of these syntheses' conditions were intentionally selected to avoid vaterite formation.
The interesting question of how various amino acids and related additives differ in their ability to be occluded in calcite compared to vaterite is addressed in this work. The corresponding effects on the polymorph lattice in terms of lattice distortions can be determined using powder diffraction techniques. Mapping a large parameter space, in terms of additive and concentration, requires the synthesis of a large number of samples and the provision of high throughput analysis techniques. Synchrotron high resolution powder diffraction beamlines are well equipped for high sample throughput with fast detectors, robotic sample changers and automated data collection. The bottle neck then becomes the sample synthesis and preparation. In some cases, this can be addressed by the development of laboratory scale automated sample preparation systems, however this can be expensive and is often a tailored solution for a specific reaction of sample condition that is not always more generally applicable to other syntheses. Here we chose to view the sample bottleneck problem as an exciting opportunity for citizen science.
This study was carried out as part of Project M,25,26 a large-scale citizen science project with over 1000 scientists synthesising calcium carbonate samples. The prepared samples were then analysed using X-ray powder diffraction at Diamond Light Source using beamline I11.27 This is a high resolution powder diffraction beamline, that was used to measure all of the samples in a 24 hour period. This highlighted the beamline's high throughput capability,28 as well as the role citizen science projects can play in both chemistry and synchrotron contexts.
Chemistry projects are underrepresented in the citizen science space, which is a particular concern given the role these projects can play in developing the pathways to the United Nations sustainable development goals.29 The contribution that student citizen scientists can make to scientific research should not be underestimated and these projects frequently provide a powerful way for researchers to access volumes of data they might struggle to collect otherwise, as well as inspiring future generations of scientists.30
The key scientific results are discussed, demonstrating how the additives differently occlude in the calcite and vaterite polymorphs, in terms of the effect on the lattice. We highlight the role that citizen science projects can play in a synchrotron context, whilst discussing the importance of careful experimental design and framing of the scientific aims for such projects.
Results and discussion
The 659 samples studied in this work comprise calcium carbonate synthesised with a range of concentrations of additives, as prepared by the Project M Scientists. The initial protocol planned for 800 samples for statistical significance, with 200 sample conditions repeated 4 times across 110 schools. The full synthesis method is given in the ESI‡ and involved direct mixing of calcium chloride and sodium carbonate solutions to precipitate calcium carbonate. The nature of the project directed the experimental design. The study was designed with the following main considerations:• A simple method that could safely and easily be reproduced by secondary school students in a standard classroom environment, minimising the variables highlighted in Fig. 1.
 | ||
| Fig. 1 Graphical depiction of the reaction and the associated variables. | ||
• A method that would produce a combination of vaterite and calcite polymorphs to study the effect of the additives on the crystal structure of each phase.
• A route to achieve statistical significance for each sample, aiming for 4 repeats per sample.
The use of calcium chloride and sodium carbonate were chosen due to the familiarity of schools with these chemicals and the low risk level attached. All syntheses were carried out at room temperature (see Methods in ESI‡).
The selected additives include 19 of the most common amino acids (excluding tyrosine due to its poor solubility12,31), as well as a series of long chain carboxylic acids (CH2)n(CO2H)2 (where n = 1–5) with various concentrations. Instead of using an additive, some schools made samples with varying mixing times. The additive concentrations were selected to reflect the fact that most secondary schools only had balances to two decimal places, which corresponded to a ratio range of 0.5–2. The amino acids are commonly classified by their functional groups on their side chains and chemical properties as: hydrophobic, negatively charged, positively charged, polar uncharged and special cases. The carboxylic acids were chosen due to having similar chain lengths as the amino acids, without the amino functional group. Individual additives are coded according to Table 1.
| Additive | Abbreviation | Classification |
|---|---|---|
| a There were not enough samples with glutaric acid to be included in the analysis that follows, but the Controls from these experiments were included. | ||
| Adipic acid | AdiAci | Dicarboxylic acid |
| L-Alanine | Ala | Hydrophobic |
| L-Arginine | Arg | Positively charged |
| L-Asparagine | Asn | Polar uncharged |
| L-Aspartic acid | Asp | Negatively charged |
| L-Cysteine | Cys | Special case |
| L-Glutamine | Gln | Polar uncharged |
| L-Glutamic acid | Glu | Negatively charged |
| Glutaric acid | GltAcia | Dicarboxylic acid |
| Glycine | Gly | Special case |
| L-Histidine | His | Positively charged |
| L-Isoleucine | Ile | Hydrophobic |
| L-Leucine | Leu | Hydrophobic |
| L-Lysine | Lys | Positively charged |
| Malonic acid | MalAci | Dicarboxylic acid |
| L-Methionine | Met | Hydrophobic |
| Mixing time | Mixing | |
| L-Phenylalanine | Phe | Hydrophobic |
| Pimelic acid | PimAci | Dicarboxylic acid |
| L-Proline | Pro | Special case |
| L-Serine | Ser | Polar uncharged |
| Succinic acid | SucAci | Dicarboxylic acid |
| L-Threonine | Thr | Polar uncharged |
| L-Tryptophan | Trp | Hydrophobic |
| L-Valine | Val | Hydrophobic |
As the X-ray diffraction patterns of the samples were collected over a 24 hour period, the data were live tweeted via the Twitter account @DLSProjectMLive, to share the status of the experiment. The data were then shared directly with the Project M Scientists via a web interface. They could carry out initial analyses of the X-ray diffraction patterns using a custom online version of the DAWN software suite,32 and this showed that the samples were either calcite, or a mixture of both calcite and vaterite phases. A representative diffraction pattern and fit from LeBail analysis are shown in Fig. 2. Small fluctuations in temperature, timings and mixing speeds were known in advance to influence the final product polymorph23 hence the ratio of calcite to vaterite in an individual sample is not necessarily representative of the effect of additive on the crystallisation process. A systematic quantification of the ratio of polymorphs was not carried out in this work due to the variety of packing densities (e.g., due to transit) and sample crystallinities (e.g., varying amorphous contributions).
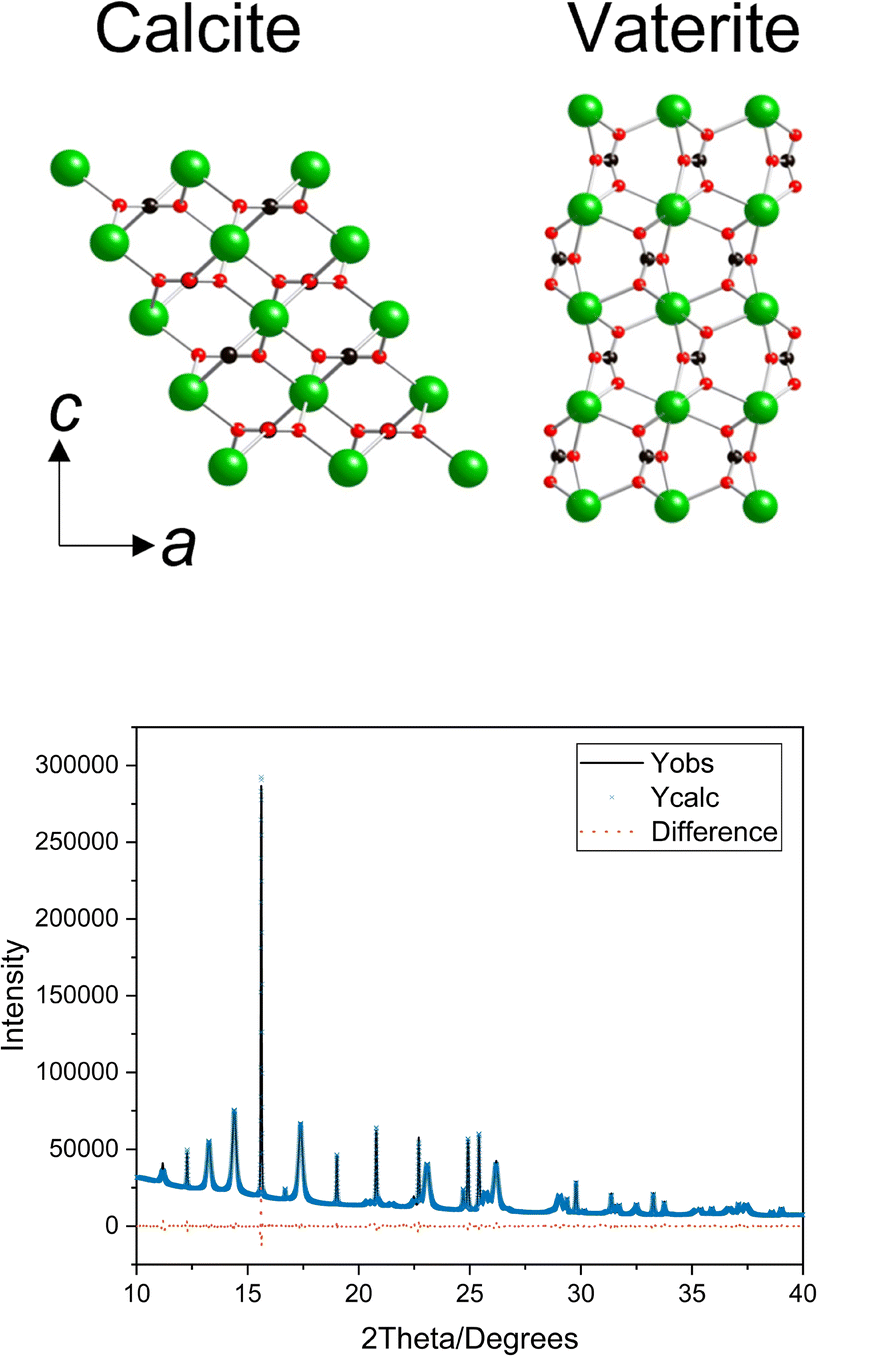 | ||
| Fig. 2 (a) Crystal structures of calcite (left) and vaterite (right), where green is calcium, black is carbon and red is oxygen. Both crystal structures are orientated in the same direction to highlight the difference between the a and c lattice parameters. The vaterite structure shown is a simplified version of the Kamhi structure,33 removing the disorder to facilitate comparison. (b) Diffraction pattern for sample 68–08 with the observed and calculated data and the difference. | ||
However, the influence of the amino acids on the polymorphs was determinable via the difference in the lattice parameters and the samples were self-consistent within each series. Accordingly, in the following analysis trends and standard deviations of the lattice parameters of the crystalline materials are discussed, and this puts less weight on the error of any specific point or individual sample.
Error analysis
The large volume of data in this experiment mean that error analysis is critical for a meaningful interpretation of the results. Therefore, the standard deviations of the corresponding lattice parameters across all control samples were calculated and are applied as the errors to the entire dataset reported herein. This is essentially the maximum error for these data and ensures any trends identified in this work are significant. These values are plotted in Fig. 3 and reported in the ESI.‡ It is notable that although there is a smaller representation of control samples for vaterite, the standard deviations are half that found for calcite for a and c. The larger lattice distortions for calcite in the c direction is related to the increased elasticity in this direction, which provides an excellent probe for the impact of various additives.10,34 The layers of calcium ions and carbonates stacked vertically in the c direction in calcite are therefore best compared with the layers of calcium and carbonate stacking in the a direction in vaterite (highlighted in Fig. 2). The occlusion of amino acids has been reported previously for calcite, where it was the sole polymorph reported.12 It is however possible in this work to compare the influence of an additive simultaneously across vaterite and calcite crystal polymorphs, and therefore gain an insight into how the additive influences the crystal formation. | ||
| Fig. 3 Standard deviations of the a and c lattice parameters for calcite and vaterite for the controls, all additives, mixing only, literature synthetic35–42 and literature biogenic13,41,43–46 samples. | ||
Calcite and vaterite lattice parameters: the effect of additives
The standard deviations of the calcite and vaterite lattice parameters over the full range of the samples made with additives or variable mixing times are very different to the controls, highlighting a fundamental difference in how the structure of the polymorph is influenced by the additive. Calcite σVolume is five times greater than the corresponding value for vaterite (see ESI‡), with calcite c contributing significantly to this difference. The broader range is evident in Fig. 4, where the flexibility in c results in two discrete populations in the calcite lattice parameters compared to the calcite control lattice parameters. | ||
| Fig. 4 Calcite lattice parameter c binned for all samples with values for the controls highlighted in dark grey (top) and vaterite lattice parameter a binned for all samples with values for the controls highlighted in black (bottom). | ||
The small spread of the vaterite crystal structure between the vaterite control and the vaterite with additives datasets presents an interesting insight into the (lack of) interactions of vaterite with additives (Fig. 4). The vaterite structure itself has been widely debated in the literature, with multiple structural interpretations reported.33,47–49 In order to test whether the choice of structural model was the dominating factor in these results, a selection of the most frequently used models were tested against all of the vaterite datasets and these all show the same trend (reported in the ESI‡). The Kamhi cell33 was selected for use in this work as it had the smallest standard deviations and the best fits across both polymorphs in the LeBail analysis of the control samples.
The high supersaturation reaction conditions used here promote the rapid formation of usually nanocrystalline vaterite. This polycrystalline nature of vaterite on fast precipitation is thought to hinder occlusion of the additive within the crystal structure. However, it is not clear how polycrystallinity would stop or impede occlusion. Trapping of the additives between crystalline blocks is reported,19 whereas calcite has been widely characterised as occluding additives (mainly amino acids) within and/or between crystallites.10,12,22 In this work under the reaction conditions reported, we see very little difference between the reactions with and without additives in terms of the standard deviations for vaterite lattice parameters, leading to questions about how available the metastable vaterite structure is for interactions with the additives.
The calcite lattice parameters are more affected, and have greater elasticity, which aligns with work published elsewhere where the lattice parameters of synthetic35–42 and biogenic13,41,43–46 calcite with additives, (including Mg, amino, polyelectrolytes) are larger. Importantly, this work also reveals the simultaneous reduced influence of additives on the vaterite structure. The first observations of lattice distortions in biogenic crystals,13,50–52 compared to synthetic and geological samples, was attributed to the occlusion of organic materials within the crystal structure. Further investigations, using heating experiments, demonstrated the loss of the organic material and relaxation of the lattice strain.13,51 Much work has followed using additives in precipitation and the observation of similar lattice distortions to biogenic crystals therefore suggested a similar occlusion method.12 While this occlusion has previously been quantified in the literature using chemical analysis, the important factor considered here is that lattice parameter changes can be attributed to additive occlusion. The lack of lattice distortions for the vaterite samples observed here could suggest that the additive is not occluded in the vaterite structure. This has implications for the role of additives during the crystallisation pathway, how and when they may be occluded into the calcite structure, and the mechanism of vaterite stabilisation, as discussed below.
Additive influence on the presence of polymorphs
The crystallisation of calcium carbonate under the reaction conditions reported in this paper is generally understood to proceed via an amorphous precursor phase with initial rapid formation of amorphous calcium carbonate (ACC) nanoparticles followed by subsequent transformation to vaterite and then calcite.53 Amorphous precursor phases have also been widely reported in biogenic systems.5,54 Additives can play a role at different points in this reaction pathway by affecting the solution pH, through binding of calcium ions or clusters in solution, and by influencing the kinetics of amorphous calcium carbonate dissolution.55–58 The action of additives may produce differing supersaturation levels, which in turn promotes the formation of one or other polymorph.23 Additives may also preferentially bind to different forming crystal faces, inhibiting their growth. In the case of calcite inhibition this has the effect of stabilising vaterite crystals.59 The exact ratios of polymorphs within individual samples will not be reported in this paper for reasons already discussed. However, the impact of additives on polymorph formation can also be considered in terms of the number of samples that contain calcite divided by the number of samples that contain vaterite for each additive (labelled the ‘polymorph indicator’), particularly when the values for controls and all additives are compared as presented in Fig. 5. An additive series with a polymorph indicator smaller than the controls (2.18919) contains proportionally more samples which have some vaterite present.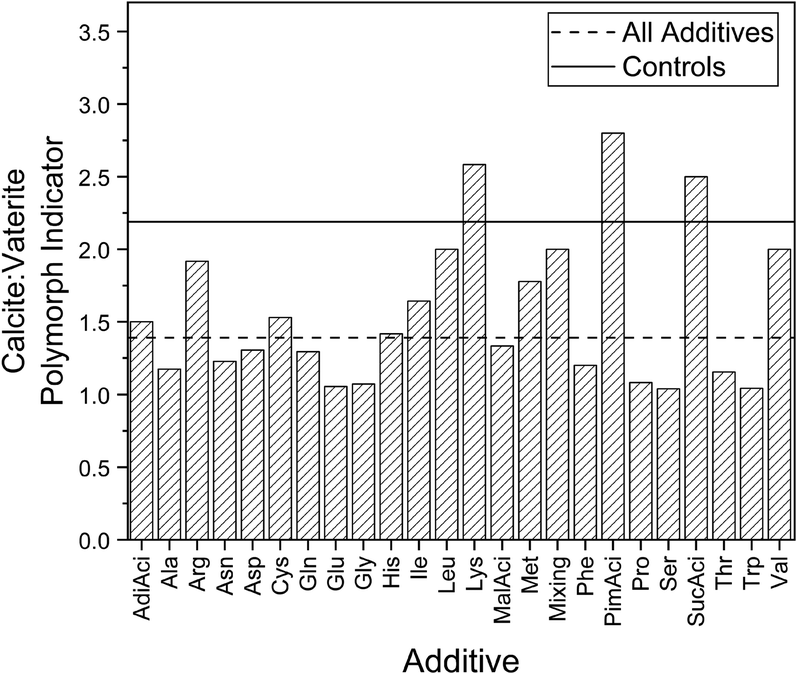 | ||
| Fig. 5 The polymorph indicator for the controls, individual additives and for all the samples with additives. | ||
The reduction in the polymorph indicator beneath the controls highlights the stabilisation of the metastable vaterite via a range of additives, particularly for the polar amino acids (Asn, Gln, Ser, Thr) which have a higher number of vaterite-containing samples. In contrast, only Lys, PimAci and SucAci are all dominated by calcite relative to the controls. Indeed, out of 659 samples, just one sample contained only the vaterite polymorph – this was a Ser sample. Note that the Ser additive series as a whole generally contain both vaterite and calcite, as indicated by a polymorph indicator of 1.06667. The remaining 658 samples all contained either a mixture of both polymorphs or only the calcite polymorph. The stabilisation of vaterite can happen in several ways: the surface absorption of additive on the vaterite lattice planes may prevent vaterite dissolution and subsequent reprecipitation into calcite or alternatively the additive could be inhibiting calcite formation.
The effect of mixing time on lattice parameters
An important consideration in the synthesis method is the mixing time as it is one variable that will dictate how far along the reaction pathway the reaction proceeds. This will impact how sensitive the respective polymorphs are to this timing and whether the lattice parameters change as a function of reaction time. The mixing time of 120 seconds chosen for this experiment was intentionally selected to ensure samples with vaterite would be produced and to make sure this experiment could be delivered within the time frame of a class (1 hour). This inherently implies that the impact of mixing on the lattice parameters of the product is negligible, so this was therefore assessed in this experiment by a subset of schools varying mixing times from 0–600 seconds instead of adding additives (in all other aspects the same sample preparation protocol was followed). The resulting standard deviations for the volume of the polymorphs are very close to the corresponding values for the controls (individual lattice parameters shown in Fig. 3), with vaterite at 0.01756 for mixing compared with 0.03634 for the controls and calcite at 0.2111 for mixing compared with 0.20184 for the controls. This highlights that the overall impact of a variation in mixing times is on par with the variations in the synthesis of the controls, indicating any experimental variability in the mixing time has a limited contribution to the lattice parameter standard deviation in this work.The effect of additives on lattice parameters; the role of individual additives
The standard deviations of the lattice parameters can be used to determine how individual additives affect the structure of the calcite and vaterite polymorphs. When considering this it is helpful to contextualise this through the various classes of additives (polarity, charge, etc.).Calcite
In the case of calcite, the negatively charged Glu and Asp and the special cases Cys and Gly, the hydrophobic Trp and the polar Ser demonstrate the largest differences in calcite c. Many of these amino acids have all been reported previously as inducing large lattice distortions for smaller concentrations.12,22 This has been attributed to the electrostatic interaction between the side chain and the mineral surfaces.60 This difference can be seen in the mean of the lattice parameters in Fig. 6 for the maximum concentration (only calculated for those additives where more than two samples were available), but the overall trends are otherwise in agreement with the standard deviations in Fig. 3. The standard deviations are calculated from a larger number of samples so are therefore those we will discuss in the rest of this work. | ||
| Fig. 6 Calcite c mean for the samples for the highest concentration of additive/longest mixing time, shown relative to the mean and standard deviation for the controls samples and all additives samples. | ||
Aspartic acid and glutamic acid are widely studied additives in the context of calcium carbonate crystallisation. This is due to the frequency of Asp and Glu residues found in biological matrices. Aspartic acid was found to have a greater influence on the calcite c lattice parameter than glutamic acid in other CaCO3 crystallisations reported. The mean standard deviation in Fig. 7 is around 50% larger for glutamic acid as for aspartic acid, which is the inverse of the trends reported elsewhere. For example Borukhin et al. found that Asp was incorporated at higher concentration into calcite crystals than Glu, giving rise to a larger lattice distortion.12 Variations in experimental parameters might explain these differences, including concentration of additives and solutions,61 pH and the method (e.g. direct mixing versus vapour diffusion or titration). There is up to 100 times more additive in our reaction solutions compared to others in the literature. This will directly influence the kinetics through the availability of the calcium ions for reaction with the carbonates due to competing binding interactions with the additive functional groups.
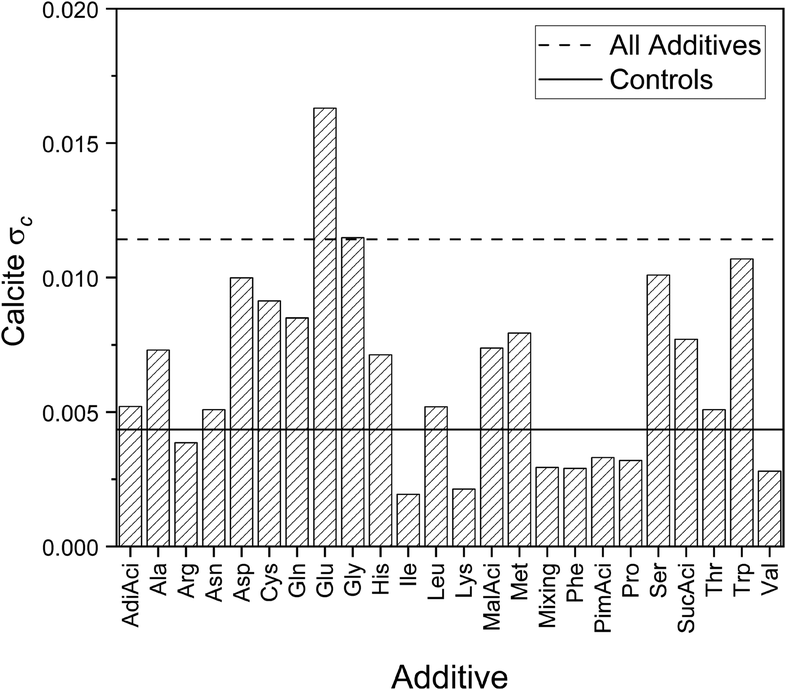 | ||
| Fig. 7 Standard deviations for calcite c for controls, individual additives, and all samples with additives. | ||
The polar amino acids give rise to a relatively large calcite c standard deviation but also have a higher polymorph indicator, as discussed above. This raises questions about whether polar additives may strongly affect the energetics of the reaction by destabilising the calcite structure. The transformation of vaterite to calcite would therefore be less favourable, which would result in a larger number of vaterite containing samples.
Vaterite
The samples containing vaterite within the individual additive groups, also part of the vaterite samples in Fig. 3 and in 4 for vaterite a, have vaterite a standard deviations that are mostly smaller than or very close to the controls as shown in Fig. 8. These consistently smaller standard deviations suggest that the additive has introduced stability and uniformity into the vaterite structure. The fact that most of the lattice parameters lie within the inherent variability raises questions about the vaterite structure itself, and the availability (or lack) of sites for the additives to interact or occlude as previously discussed here and elsewhere for calcite c. | ||
| Fig. 8 Standard deviations for vaterite a for controls, individual additives, and all samples with additives. | ||
This work identifies a few exceptions to this trend, including some additives with negatively charged (Asp and Glu) and positively charged (Arg) side chains. All have standard deviations that are greater than the standard deviation of the Controls, but these differences are 30 times smaller than for calcite c. Electrostatic interactions have been highlighted as playing a role in the occlusion of additives in calcite and this result indicates they are also important in vaterite formation. There is little literature about the impact of negatively/positively charged amino acid side chains on vaterite, apart from aspartic acid,62 although amine side-groups have been reported to stabilise vaterite through interactions with certain vaterite crystallographic planes.63–65 This would directly affect the crystal structure, although clearly these interactions are much weaker for vaterite than calcite.
Calcite and vaterite correlations
The nature of the sample preparation allows us to look at the influence of the additives on the structures of calcite and vaterite together in the same sample. This was explored by plotting the standard deviation of vaterite a against calcite c for the additives, highlighted in Fig. 9.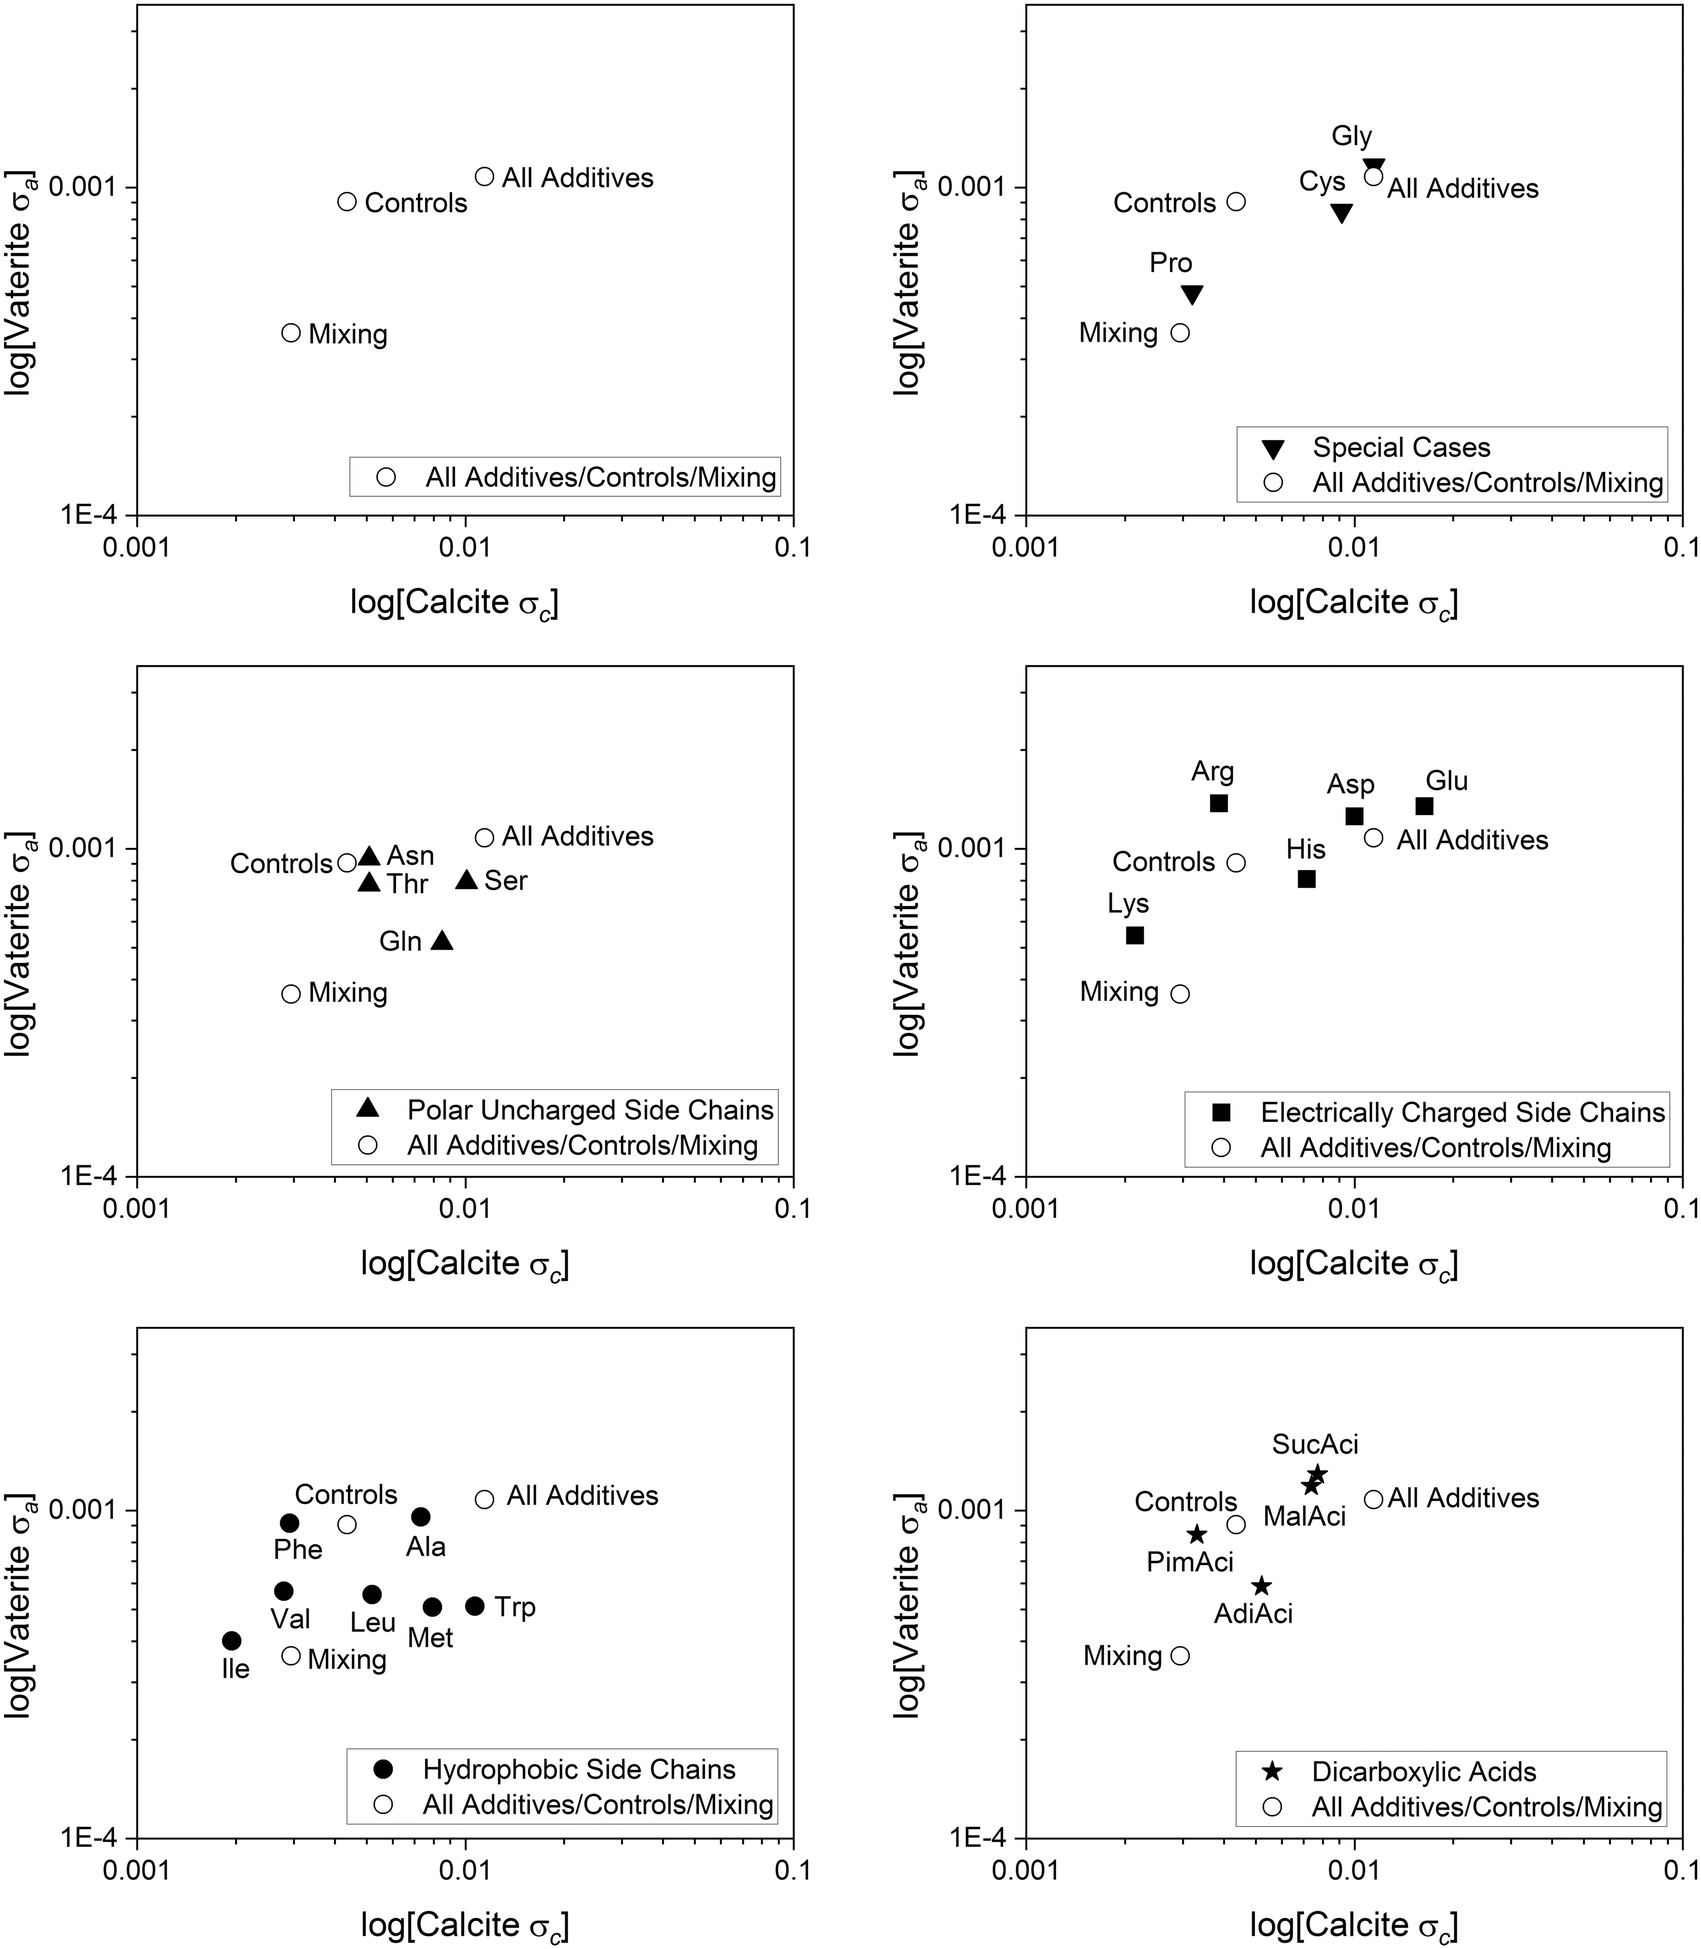 | ||
| Fig. 9 Log scale standard deviations of vaterite a and calcite c of the samples for each additive, all additives and the controls. Note the scale is a log scale and the X and Y ranges are significantly different. | ||
The smaller deviations for the hydrophobic side chains (excluding Trp) are evident here for both polymorphs, suggesting that occlusion for this grouping of additives is overall lower than for other groups. For the hydrophobic additives, Ile and Val especially show a relatively small standard deviation for calcite c and vaterite a, suggesting less variability in the structure compared to the controls. Interestingly Val samples, and to some extent Ile samples, have a lower number of vaterite samples, demonstrated by a high polymorph indicator (Fig. 5). Previous work on Val indicates that it has minimal interaction with the growth process of the calcite crystallites.12,19,22,66 However, the chemical parameters for the other hydrophobic additives are very similar, which leaves questions as to why the also hydrophobic Trp and Ala have more variability in the structure compared to Ile and Val. Areas for further investigation in this could include exploring the effect of additive size or reaction enthalpies.
There are many stages where the additive can shape the reaction pathway and become occluded in the structure(s).55,59 However, given that the reaction is occurring in water, hydrophobic additives would have less favourable interaction with ions in solution or forming solid crystal planes. This contrasts with the polar uncharged series, where the polar nature of the additive could lead to electrostatic interactions. This is reflected in the larger standard deviation for calcite c in this series.
For vaterite, the electrically charged additives (particularly Arg, Asp and Glu) have the greatest influence on vaterite a, whilst also influencing calcite c. This is perhaps highlighting the nature of the sites available in the vaterite structures for additive binding. Interestingly the dicarboxylic acid series (MalAci and SucAci) has a similar trend to the electrically charged series, suggesting the additive interactions could be similar in both cases, and the importance of charged interactions.
Additive concentration was intentionally selected in this work to give a range of additive: calcium in ratios from 0![[thin space (1/6-em)]](https://www.rsc.org/images/entities/char_2009.gif) :1 up to 2:1, and to ensure the additive was soluble in the solution. As discussed above, the standard deviations cover all the concentrations of a given additive and were used in this analysis as they summarise a large number of samples compared to only using the lattice parameters for the maximum concentration (Fig. 6 above). However, the question remains about the effect of concentration. In plotting the lattice parameter mean for each polymorph for each additive (Fig. 10), this can be compared to the size of the standard deviation. This indicates the range of lattice parameter change due to different concentrations, represented by the error bars in Fig. 10. This highlights that in this range of concentrations, the individual additive has more of an effect than the concentration. Overall, changes across additive type are bigger than changes in the concentration of the same additive. For example, changing from Lys to Asp under these conditions would have more of an impact on the lattice parameter than changing concentration of Lys.
:1 up to 2:1, and to ensure the additive was soluble in the solution. As discussed above, the standard deviations cover all the concentrations of a given additive and were used in this analysis as they summarise a large number of samples compared to only using the lattice parameters for the maximum concentration (Fig. 6 above). However, the question remains about the effect of concentration. In plotting the lattice parameter mean for each polymorph for each additive (Fig. 10), this can be compared to the size of the standard deviation. This indicates the range of lattice parameter change due to different concentrations, represented by the error bars in Fig. 10. This highlights that in this range of concentrations, the individual additive has more of an effect than the concentration. Overall, changes across additive type are bigger than changes in the concentration of the same additive. For example, changing from Lys to Asp under these conditions would have more of an impact on the lattice parameter than changing concentration of Lys.
 | ||
| Fig. 10 The mean lattice parameter of calcite c (top) and vaterite a (below), presented on the same relative scale and categorised according to the additive groupings. The error bars represent the range of lattice parameter for all concentrations of a given additive. A plot with expanded y-axis for vaterite is available in the ESI.‡ | ||
The wider context
Consideration by additive grouping has demonstrated some general trends already discussed here, but additional factors like the pKa, pI, and molecular weight were also explored to assess if they determine the ability of the molecule to interact with the surface. However, these values did not provide immediately clear trends. Size has been demonstrated in other studies to play an important role in templating or directing mineral growth, suggesting there may be an optimum molecular size for incorporation, but this was not evident, for example, when considering the increasing chain length for Ala < Val < Leu.What is clear from the results here, and in the extremely wide body of literature studies, is that the effect an additive, such as an amino acid, has on the crystal polymorph and lattice spacing is complex and depends on many interrelated factors. Nonetheless, studies such as this continue to provide important information in terms of the role of different additive functional groups on the crystal structure and help build towards a predictive model of the influence of additives, essential for being able to design and tailor material properties using biomimetic approaches.
Here we have highlighted the importance of comparing the influence of the additive on both the vaterite and calcite polymorphs to determine the nature of its role in the crystallisation process. The large sample set investigated here was extremely useful for a more statistical analysis of the datasets, and these samples were made possible through a citizen science approach. It is also important to continue to investigate the influence of the additives at different time points during the process, for example through in situ studies, to better elucidate the interactions of the additive with the solutions and forming crystals and determine how and when the occlusion into the structure occurs.
The potential of citizen science to contribute to novel chemical research
Exploring the role of amino acids in directing crystallisation with the Project M Scientists was an opportunity and an honour for the authors. The scale of this experiment would not have been possible on an individual lab basis. This laboratory procedure, equivalent to that of a professional academic research process, has been performed by secondary school students, laboratory technicians, teachers, and teaching assistants. The volume of samples produced showcased the high-throughput capability of a synchrotron diffraction facility, consequently introducing the opportunity for performing large scale statistical analysis. In addition to this, students have gained real exposure to the scientific process. It only took one day to collect the data for this experiment and there is potential for many more citizen science experiments in the future! In addition, feedback from teachers shared how the students were excited to translate their lab skills to this experiment and that the students were able to contextualise their learning from their prescribed textbooks and lab classes. Teachers also highlighted their own interest and curiosity as many of them have trained as chemists in their education. They appreciated the connection to real science for themselves and the opportunity for continued professional development.25Conclusions
High resolution powder diffraction is an extremely powerful tool to uncover the lattice distortions in calcium carbonate polymorphs arising from occlusion of additives. In this study the lattice distortions have been examined in the context of the additive type and importantly consider the effect across calcite and vaterite polymorphs. The size of parameter space explored by the Project M Scientists in this unique citizen science approach reveals differences in lattice parameter standard deviations between calcite and vaterite for the same additives which have been discussed in terms of the role of the additive during the crystallisation process as well as its interaction with and incorporation into the forming crystals. The larger lattice parameter deviations in the calcite c parameters highlight the ability of certain additives to be incorporated into the crystal structure along these directions, whilst demonstrating a lack of incorporation in the vaterite crystal structure. The lack of incorporation does not rule out the possibility of binding to crystal surfaces, indeed this may be a mechanism for vaterite stabilisation as previously discussed. The statistical analysis approach applied here also highlights several systems for further investigation, for example the difference of Trp to the other hydrophobic amino acids in the calcite structure, which may not have been evident in a smaller parameter scale synthesis.Here the high throughput capabilities of the robotic sample changing system, and fast data collection ability, of Beamline I11 at Diamond Light Source was showcased by collecting the diffraction patterns of 800 samples of calcium carbonate in 24 hours. The citizen science project to carry out this study provides a successful demonstration of the potential benefits of these types of approach to areas of synchrotron science. Rigorous analysis of citizen science produced samples has also enabled meaningful scientific conclusions to be drawn regarding the effect of amino acids on the lattice parameters of calcite and vaterite. This ability to explore a wide parameter space in sample conditions, whilst providing continued educational and scientific engagement benefits for the students and teachers involved, can we hope in future be applied to other materials synthesis investigations.
Author contributions
C. A. M. and J. E. P. conceptualised the project, analysed the data and wrote and edited the manuscript. The Project M Scientists investigated the synthesis of the calcium carbonate samples and contributed to the data analysis. A. R. performed further analysis of the diffraction data. L. H. and R. O. B. resourced the project implementation and provided input in the project administration. M. B., D. B., J. F., S. F., P. H., K. L., R. M. and J. P. developed and implemented the software and hardware for the data collection and analysis. A. B., L. D. C., S. J. D., C. C. T. and S. P. T. contributed to the preparation of the samples for the diffraction experiment, to the review and editing of the manuscript and in discussions during the project conceptualisation.Conflicts of interest
There are no conflicts to declare.Acknowledgements
The authors would like to thank the large team of people at Diamond Light Source including technical staff, goods handling, SHE group, legal team and other members of staff who provided multiple levels of support and logistics assistance, with a special mention to Anna Herlihy and Dean Ottewell for loading boxes and packing samples. Alun Ashton and Francois Cesmat are thanked for their support in building the website and interfaces. The authors would also like to specifically thank Laurent Chapon, Paul Quinn, Isabelle Boscaro-Clarke and the Diamond Communications team for their support. Becky Parker and the Institute for Research in Schools, the Scottish Schools Educational Research Centre, the UKRI Science and Technology Facilities Council, Wellcome Trust and the Royal Society of Chemistry are thanked for their efforts in promoting the project to schools throughout the UK. Teachers and students at Didcot Girls School and Camden School for Girls are particularly acknowledged for their time and effort in testing protocols. Sigma Aldrich are thanked for donating amino acids to this project. C. A. M. would like to thank Franziska Emmerling and the team at Bundesanstalt für Materialforschung und -prüfung (BAM), Berlin, Germany for hosting her during research leave to write this paper. We thank Claudia Flandoli for creating artwork for the paper. We acknowledge Diamond Light Source for time on Beamline I11 under Proposal EE15723-1.Notes and references
- H. A. Lowenstam and S. Weiner, On biomineralization, Oxford University Press, Oxford, New York, 1989 Search PubMed.
- S. Mann, Biomineralization: Principles and Concepts in Bioinorganic Materials Chemistry, Oxford University Press, 2001 Search PubMed.
- W. A. Deer, R. A. Howie and J. Zussman, An introduction to the rock-forming minerals, Wiley, New York, 1967 Search PubMed.
- G. Falini, S. Fermani, M. Reggi, B. Njegić Džakula and D. Kralj, Chem. Commun., 2014, 50, 15370–15373 RSC.
- L. Addadi, S. Raz and S. Weiner, Adv. Mater., 2003, 15, 959–970 CrossRef.
- Y. Politi, T. Arad, E. Klein, S. Weiner and L. Addadi, Science, 2004, 306, 1161 CrossRef PubMed.
- Y. U. T. Gong, C. E. Killian, I. C. Olson, N. P. Appathurai, A. L. Amasino, M. C. Martin, L. J. Holt, F. H. Wilt and P. U. P. A. Gilbert, Proc. Natl. Acad. Sci. U. S. A., 2012, 109, 6088 CrossRef CAS PubMed.
- X. Song, Z. Liu, L. Wang and L. Song, Front. Mar. Sci., 2019, 6, 41 CrossRef.
- S. J. Eichhorn, D. J. Scurr, P. M. Mummery, M. Golshan, S. P. Thompson and R. J. Cernik, J. Mater. Chem., 2005, 15, 947–952 RSC.
- Y.-Y. Kim, J. D. Carloni, B. Demarchi, D. Sparks, D. G. Reid, M. E. Kunitake, C. C. Tang, M. J. Duer, C. L. Freeman, B. Pokroy, K. Penkman, J. H. Harding, L. A. Estroff, S. P. Baker and F. C. Meldrum, Nat. Mater., 2016, 15, 903–910 CrossRef CAS PubMed.
- P. Fratzl, J. R. Soc., Interface, 2007, 4, 637–642 CrossRef CAS PubMed.
- S. Borukhin, L. Bloch, T. Radlauer, A. H. Hill, A. N. Fitch and B. Pokroy, Adv. Funct. Mater., 2012, 22, 4216–4224 CrossRef CAS.
- B. Pokroy, A. N. Fitch, F. Marin, M. Kapon, N. Adir and E. Zolotoyabko, J. Struct. Biol., 2006, 155, 96–103 CrossRef.
- C. Gilow, E. Zolotoyabko, O. Paris, P. Fratzl and B. Aichmayer, Cryst. Growth Des., 2011, 11, 2054–2058 CrossRef.
- H. Li, H. L. Xin, M. E. Kunitake, E. C. Keene, D. A. Muller and L. A. Estroff, Adv. Funct. Mater., 2011, 21, 2028–2034 CrossRef.
- H. Cölfen, Curr. Opin. Colloid Interface Sci., 2003, 8, 23–31 CrossRef.
- B. Lian, Q. Hu, J. Chen, J. Ji and H. H. Teng, Geochim. Cosmochim. Acta, 2006, 70, 5522–5535 CrossRef.
- Y.-Y. Kim, K. Ganesan, P. Yang, A. N. Kulak, S. Borukhin, S. Pechook, L. Ribeiro, R. Kröger, S. J. Eichhorn, S. P. Armes, B. Pokroy and F. C. Meldrum, Nat. Mater., 2011, 10, 890–896 CrossRef PubMed.
- B. Marzec, D. C. Green, M. A. Holden, A. S. Coté, J. Ihli, S. Khalid, A. Kulak, D. Walker, C. Tang, D. M. Duffy, Y.-Y. Kim and F. C. Meldrum, Angew. Chem., Int. Ed., 2018, 57, 8623–8628 CrossRef CAS PubMed.
- K. Liang, R. Ricco, C. M. Doherty, M. J. Styles and P. Falcaro, CrystEngComm, 2016, 18, 4264–4267 RSC.
- E. Zolotoyabko and B. Pokroy, CrystEngComm, 2007, 9, 1156–1161 RSC.
- D. C. Green, J. Ihli, Y.-Y. Kim, S. Y. Chong, P. A. Lee, C. J. Empson and F. C. Meldrum, Cryst. Growth Des., 2016, 16, 5174–5183 CrossRef CAS.
- J. D. Rodriguez-Blanco, K. K. Sand and L. G. Benning, in New Perspectives on Mineral Nucleation and Growth: From Solution Precursors to Solid Materials, ed. A. E. S. Van Driessche, M. Kellermeier, L. G. Benning and D. Gebauer, Springer International Publishing, Cham, 2017, pp. 93–111 Search PubMed.
- I. Ben Shir, S. Kababya, D. B. Zax and A. Schmidt, J. Am. Chem. Soc., 2020, 142, 13743–13755 CrossRef PubMed.
- C. A. Murray, L. Holland, R. O'Brien and J. E. Parker, Front. Commun., 2023, 8, 1229616 CrossRef.
- Project M, https://www.diamond.ac.uk/ProjectM/, (accessed 30th March, 2023).
- S. P. Thompson, J. E. Parker, J. Potter, T. P. Hill, A. Birt, T. M. Cobb, F. Yuan and C. C. Tang, Rev. Sci. Instrum., 2009, 80, 075107 CrossRef.
- S. P. Thompson, J. E. Parker, J. Marchal, J. Potter, A. Birt, F. Yuan, R. D. Fearn, A. R. Lennie, S. R. Street and C. C. Tang, J. Synchrotron Radiat., 2011, 18, 637–648 CrossRef PubMed.
- D. Fraisl, J. Campbell, L. See, U. Wehn, J. Wardlaw, M. Gold, I. Moorthy, R. Arias, J. Piera, J. L. Oliver, J. Masó, M. Penker and S. Fritz, Sustain. Sci., 2020, 15, 1735–1751 CrossRef.
- G. A. Weyhenmeyer, M. Mackay, J. D. Stockwell, W. Thiery, H.-P. Grossart, P. B. Augusto-Silva, H. M. Baulch, E. de Eyto, J. Hejzlar, K. Kangur, G. Kirillin, D. C. Pierson, J. A. Rusak, S. Sadro and R. I. Woolway, Sci. Rep., 2017, 7, 43890 CrossRef PubMed.
- C. Held, L. F. Cameretti and G. Sadowski, Ind. Eng. Chem. Res., 2011, 50, 131–141 CrossRef.
- M. Basham, J. Filik, M. T. Wharmby, P. C. Y. Chang, B. El Kassaby, M. Gerring, J. Aishima, K. Levik, B. C. A. Pulford, I. Sikharulidze, D. Sneddon, M. Webber, S. S. Dhesi, F. Maccherozzi, O. Svensson, S. Brockhauser, G. Naray and A. W. Ashton, J. Synchrotron Radiat., 2015, 22, 853–858 CrossRef PubMed.
- S. Kamhi, Acta Crystallogr., 1963, 16, 770–772 CrossRef.
- J. Ihli, J. N. Clark, N. Kanwal, Y.-Y. Kim, M. A. Holden, R. J. Harder, C. C. Tang, S. E. Ashbrook, I. K. Robinson and F. C. Meldrum, Chem. Sci., 2019, 10, 1176–1185 RSC.
- S. Mijowska, I. Polishchuk, A. Lang, E. Seknazi, C. Dejoie, S. Fermani, G. Falini, N. Demitri, M. Polentarutti, A. Katsman and B. Pokroy, Chem. Mater., 2020, 32, 4205–4212 CrossRef.
- A. Ieviņš and M. Straumanis, Z. Phys., 1940, 116, 194–206 CrossRef.
- H. E. Swanson and R. K. Fuyat, National Bureau of Standards, 1953, Circular No. 539, pp. 52–53 Search PubMed.
- D. L. Graf, Am. Mineral., 1961, 46, 1283–1316 Search PubMed.
- H. Chessin, W. C. Hamilton and B. Post, Acta Crystallogr., 1965, 18, 689–693 CrossRef.
- W. W. Schmahl and E. Salje, Phys. Chem. Miner., 1989, 16, 790–798 CrossRef.
- E. Zolotoyabko, E. N. Caspi, J. S. Fieramosca, R. B. Von Dreele, F. Marin, G. Mor, L. Addadi, S. Weiner and Y. Politi, Cryst. Growth Des., 2010, 10, 1207–1214 CrossRef.
- M. Merlini, W. A. Crichton, J. Chantel, J. Guignard and S. Poli, Mineral. Mag., 2018, 78, 225–233 CrossRef.
- S. M. Antao, I. Hassan, W. H. Mulder, P. L. Lee and B. H. Toby, Phys. Chem. Miner., 2009, 36, 159–169 CrossRef.
- S. Frølich, H. O. Sørensen, S. S. Hakim, F. Marin, S. L. S. Stipp and H. Birkedal, Cryst. Growth Des., 2015, 15, 2761–2767 CrossRef.
- M. A. Hood, H. Leemreize, A. Scheffel and D. Faivre, J. Struct. Biol., 2016, 196, 147–154 CrossRef PubMed.
- M. Albéric, E. N. Caspi, M. Bennet, W. Ajili, N. Nassif, T. Azaïs, A. Berner, P. Fratzl, E. Zolotoyabko, L. Bertinetti and Y. Politi, Cryst. Growth Des., 2018, 18, 2189–2201 CrossRef.
- H. J. Meyer, Z. Kristallogr. - Cryst. Mater., 1969, 128, 183–212 CrossRef.
- R. Demichelis, P. Raiteri, J. D. Gale and R. Dovesi, Cryst. Growth Des., 2013, 13, 2247–2251 CrossRef.
- J. Wang, F. Zhang, J. Zhang, R. C. Ewing, U. Becker and Z. Cai, J. Cryst. Growth, 2014, 407, 78–86 CrossRef.
- B. Pokroy, J. P. Quintana, E. a. N. Caspi, A. Berner and E. Zolotoyabko, Nat. Mater., 2004, 3, 900–902 CrossRef PubMed.
- B. Pokroy, A. N. Fitch, P. L. Lee, J. P. Quintana, E. a. N. Caspi and E. Zolotoyabko, J. Struct. Biol., 2006, 153, 145–150 CrossRef PubMed.
- J. Stolarski, R. Przenioslo, M. Mazur and M. Brunelli, J. Appl. Crystallogr., 2007, 40, 2–9 CrossRef.
- J. D. Rodriguez-Blanco, S. Shaw, P. Bots, T. Roncal-Herrero and L. G. Benning, Geochim. Cosmochim. Acta, 2014, 127, 204–220 CrossRef.
- L. B. Gower, Chem. Rev., 2008, 108, 4551–4627 CrossRef PubMed.
- D. Gebauer, Minerals, 2018, 8(5), 179 CrossRef.
- S. Teychené, I. Rodríguez-Ruiz and R. K. Ramamoorthy, Curr. Opin. Colloid Interface Sci., 2020, 46, 1–19 CrossRef.
- D. Gebauer, H. Cölfen, A. Verch and M. Antonietti, Adv. Mater., 2009, 21, 435–439 CrossRef.
- D. J. Tobler, J. D. R. Blanco, K. Dideriksen, K. K. Sand, N. Bovet, L. G. Benning and S. L. S. Stipp, Procedia Earth Planet. Sci., 2014, 10, 143–148 CrossRef.
- M. A. Hood, K. Landfester and R. Muñoz-Espí, Cryst. Growth Des., 2014, 14, 1077–1085 CrossRef.
- L. Štajner, J. Kontrec, B. Njegić Džakula, N. Maltar-Strmečki, M. Plodinec, D. M. Lyons and D. Kralj, J. Cryst. Growth, 2018, 486, 71–81 CrossRef.
- S. Elhadj, E. A. Salter, A. Wierzbicki, J. J. De Yoreo, N. Han and P. M. Dove, Cryst. Growth Des., 2006, 6, 197–201 CrossRef.
- E. Seknazi, S. Mijowska, I. Polishchuk and B. Pokroy, Inorg. Chem. Front., 2019, 6, 2696–2703 RSC.
- B. Cantaert, Y.-Y. Kim, H. Ludwig, F. Nudelman, N. A. J. M. Sommerdijk and F. C. Meldrum, Adv. Funct. Mater., 2012, 22, 907–915 CrossRef.
- A.-W. Xu, M. Antonietti, H. Cölfen and Y.-P. Fang, Adv. Funct. Mater., 2006, 16, 903–908 CrossRef.
- L. Dupont, F. Portemer and M. Figlarz, J. Mater. Chem., 1997, 7, 797–800 RSC.
- Y. Guo, F. Wang, J. Zhang, L. Yang, X. Shi, Q. Fang and X. Ma, Res. Chem. Intermed., 2013, 39, 2407–2415 CrossRef.
Footnotes |
| † The full diffraction dataset is available on Zenodo: https://doi.org/10.5281/zenodo.7871450 |
| ‡ Electronic supplementary information (ESI) available: Methods, tables of structural data, data for the additional vaterite cells, plots of the mean values for calcite a and vaterite c, the Project M Scientist's Methodology, alternative text for the figures and the full list of Project M Scientist names are available as supplementary material. See DOI: https://doi.org/10.1039/d3ce01173a |
| § Both authors contributed equally to the manuscript. |
| This journal is © The Royal Society of Chemistry 2024 |