DOI:
10.1039/D3CE01070H
(Paper)
CrystEngComm, 2024,
26, 1022-1031
Effects of solution height and crystal rotation on the solution flow behavior in the top-seeded solution growth of SiC single crystals
Received
26th October 2023
, Accepted 10th January 2024
First published on 11th January 2024
Abstract
Top-seeded solution growth (TSSG) is a crucial technique for producing high-quality SiC crystals, with the quality of the crystal being significantly influenced by the temperature, flow, and carbon concentration in the solution. A global numerical simulation has been performed to investigate the effects of solution height and crystal rotation in SiC crystal growth. The simulation results indicate that as the solution height increases, there are two distinct flow patterns: single-vortex pattern and double-vortex pattern. Because of the change in the flow pattern, the flow field beneath the seed crystal and free surface will undergo a significant change. The varying effects of seed crystal rotation are also demonstrated under different solution height scenarios. Increasing the rotational speed of the seed crystal will enhance the stability of the solution flow field and crystal growth rate for the single-vortex pattern. Increasing the rotational speed or solution height appropriately is beneficial for enhancing the crystal growth rate in the double-vortex pattern. Excessively high rotational speeds or solution heights, however, will reduce the rate of crystal growth.
1. Introduction
Silicon carbide (SiC) exhibits promising potential in power electronic devices owing to its excellent physical and electrical properties.1,2 The primary method used in industry for the SiC single crystal preparation is physical vapor transport (PVT).3,4 Despite ongoing advancements in PVT, this method still encounters high dislocation densities and the challenge of crystal diameter enlargement. The development and widespread application of SiC crystals have been significantly constrained by these limitations.5–7 Top-seeded solution growth (TSSG) is a method of SiC crystal growth that can be carried out under thermal equilibrium conditions, enabling the lateral propagation of defects within the crystal. Therefore, SiC single crystals grown by TSSG present superior quality.8–10 In the future, it has the potential to become the primary method for SiC single crystal preparation.
However, SiC crystal grown by the TSSG method also faces numerous challenges. Firstly, the internal forces acting on the solution are complex in TSSG, including electromagnetic force, forced convection, thermal buoyancy, and Marangoni force. Secondly, the growth rate of TSSG is still low compared to other methods. It is crucial to establish a more suitable temperature field and flow field in the solution to increase the crystal growth rate.11 An appropriate temperature and flow field can facilitate the transport of carbon from the graphite crucible wall to the SiC growth interface, enhance the concentration gradient of carbon at the growth interface, and effectively increase the growth rate of SiC crystals.12,13
Various attempts have been made by researchers in this direction: Horiuchi et al. found that as the crucible diameter decreases, there is an upward flow at the corners of the crucible solution, resulting in a more uniform growth rate distribution.14 However, this also increases the risk of impurities being incorporated into the crystal. Minh-Tan Ha et al. highlights the significant impact of electromagnetic convection on the melt flow in SiC crystal growth. It was also demonstrated that the proposed structural flow modifier effectively determines the growth rate of SiC crystals.15 Mukaiyama et al. revealed the impact of crucible shape changes on heat transfer, solution flow, mass transport, and growth rate during the seed crystal growth process.16 Yamamoto et al. discovered that surface force and electromagnetic force play a crucial role in driving solution flow, while Marangoni convection can induce a deceleration in growth rate. Additionally, surface deformation has a negligible impact on temperature distribution, growth rate, and transport structures of the solution.17 The establishment of a uniform upward flow beneath the seed through the selection of an appropriate immersion guide (IG) shape was observed by Kusunoki et al., which demonstrates the potential to enhance growth morphology by promoting more uniform mass transfer.18 Li et al. investigated the effect of the crystal rotation rate on the thermal field, carbon distribution, and crystal growth rate in the TSSG method for SiC crystal growth. It has been demonstrated that precise control over carbon transport in the solution and crystal growth rate can be achieved by adjusting the rotation rate of the crystal.19 Extensive studies have shown that modifying parameters such as crystal rotation, and crucible shape, and adding new structures can significantly affect the temperature and flow field in the high-temperature solution, thus improving the crystal growth rate.
To the best of our knowledge, there has been no detailed discussion of the effect of the solution height on the internal flow field and crystal growth rates. In this study, numerical calculations have been conducted to simulate the growth of SiC single crystals by TSSG. This simulation involves varying the solution height from 50 to 140 mm and the crystal rotational speed from 0 to 30 rpm. This study aims to elucidate the influence of different solution heights on internal temperature and flow fields, as well as investigate the impact of varying solution heights with different crystal rotational speeds on SiC single crystal growth.
2. Modeling and numerical analysis
2.1 Geometric model
The TSSG model is shown in Fig. 1, with a schematic of the TSSG growth furnace model on the left and the temperature distribution in the furnace on the right. The external environment is filled with argon. The rod, the seed crystal holder, the crucible, and the susceptor are all made of graphite. Both the seed and the seed crystal holder have a diameter of 100 mm. Below the SiC holder, a 2 mm thick SiC single crystal is fully immersed in the solution. The external induction coils of the model are made of copper and are supplied with alternating current at a frequency of 30 kHz. The outer crucible is heated directly by the induction coils, while the inner crucible is heated primarily by radiation from the outer crucible. The crucible is insulated with graphite felt. The solution inside the inner crucible is a Si–Cr solution with the parameters given in Table 1. In this study, the inner crucible has a diameter of 200 mm and the height of the crucible is 200 mm. Variations in the solution height range from 40 to 140 mm in this model. Firstly, the electromagnetic field generated by the induction coils is calculated to determine the heat generation density and Lorentz force density, thereby establishing the temperature distribution of the entire system. Subsequently, the flow and concentration fields have been calculated transiently. In this study, we used the COMSOL Multiphysics package (version 6.1).
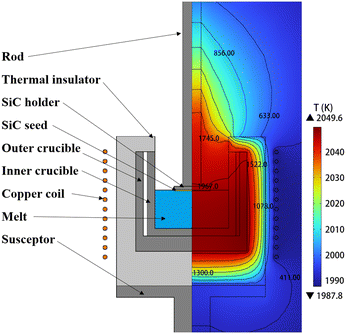 |
| | Fig. 1 TSSG model schematic (left) and temperature distribution (right). | |
Table 1 Physical properties used in the calculations20–22
| Materials |
Properties |
Value |
Unit |
| Si-40 mol% Cr |
Thermal conductivity |
−68.28 + 5.40 × 10⁻²T |
W m−1 K−1 |
| Electrical conductivity |
2.21 × 10⁶–2.80 × 10⁹/T |
S m−1 |
| Viscosity |
1.266 × 10⁻³ exp(1982/T) |
Pa s |
| Density |
5199–0.552 T |
kg m−3 |
| Heat capacity |
1196 |
J kg−1 K−1 |
| Surface tension |
1.195–1.23 × 10⁻⁴T |
N m−1 |
| Emissivity |
0.28 |
— |
| Graphite |
Thermal conductivity |
150 × 300/T |
W m−1 K−1 |
| Electrical conductivity |
7.54 × 10⁴ |
S m−1 |
| Emissivity |
0.6 |
— |
| Thermal insulator |
Thermal conductivity |
0.336 |
W m−1 K−1 |
| Electrical conductivity |
430 |
S m−1 |
| Emissivity |
0.6 |
— |
| Seed |
Thermal conductivity |
30 |
W m−1 K−1 |
| Density |
3216 |
kg m−3 |
| Heat capacity |
1290 |
J kg−1 K−1 |
2.2 Electromagnetic field
The governing equation to solve the time-harmonic equation can be written as follows:| | | ∇ × (μ0−1∇ × A) + σ∇V + jωσA = Je | (1) |
where A is the magnetic vector potential, σ is the electrical conductivity, and μ0 is the vacuum magnetic permeability and its value is 1.2566 × 10⁻⁶ H m−1. V is the electric potential, j is an imaginary unit, ω is the angular frequency, and Je is the externally generated current density.
2.3 Fluid flow in the solution
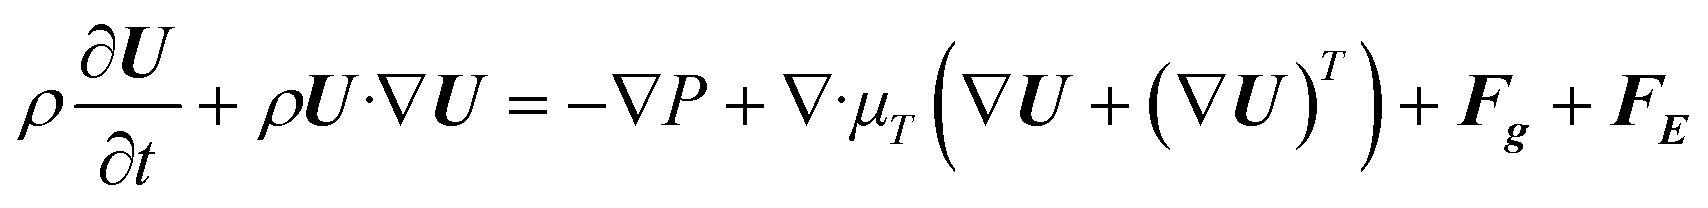
The governing equations in the fluid are as follows, including continuity, momentum, and heat and mass transfer equations:| | 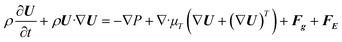 | (3) |
| |  | (4) |
| |  | (5) |
| |  | (6) |
| |  | (7) |
| |  | (8) |
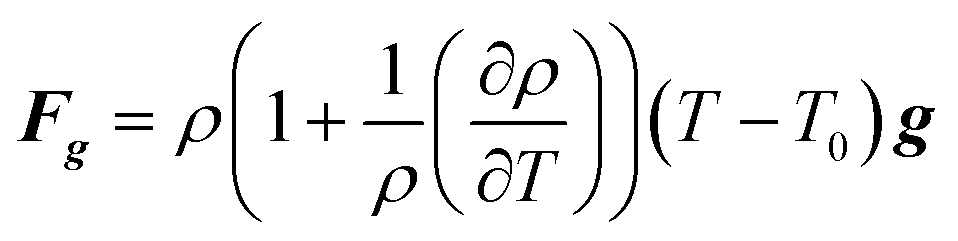
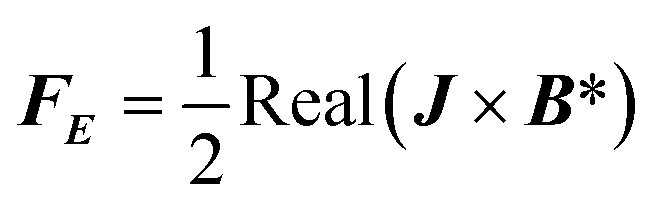
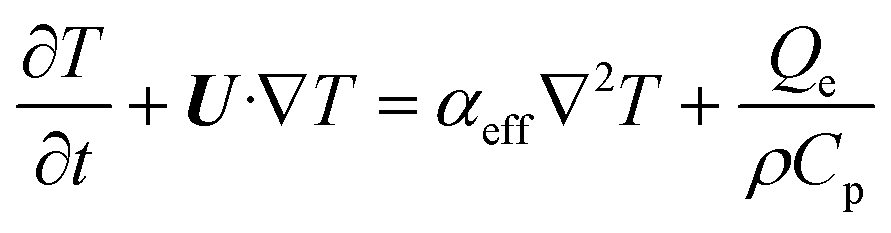
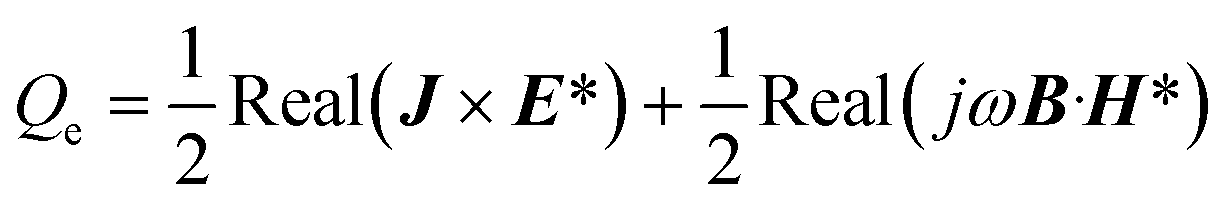
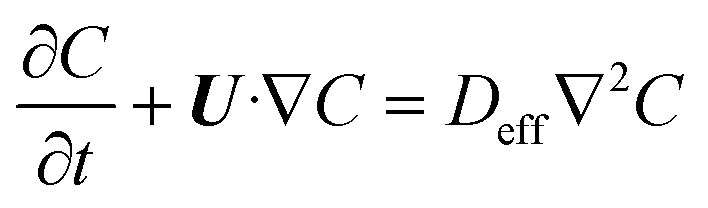
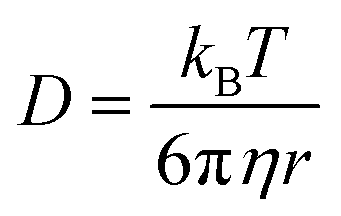
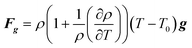
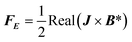
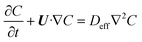
where U is the velocity vector, ρ is the density of solution, t is time, ⊗ is the outer vector product, u′ is the vortical component of velocity, indicating the rotational part of the velocity field, P is the pressure, μT is the turbulent kinematic viscosity, Fg is the thermal buoyancy, FE is the electromagnetic force, T is the temperature, T0 is the reference temperature, g is the gravitational acceleration, “real” stands for taking the real part operation, J is the current density, B is the magnetic flux density, αeff is the thermal diffusivity and its expression is λ + μT/PrT, λ is the thermal conductivity, PrT is the Prandtl number, Qe is the Joule heat generation density, Cp is the specific heat, E is the electric field intensity, H is the magnetic field intensity, C is the carbon concentration, Deff is the diffusion coefficient of carbon in the solution and its expression is D + μT/ST, ST is the Stanton number, and D is the diffusion coefficient, which can be determined as follows through the Stokes–Einstein equation:| |  | (9) |
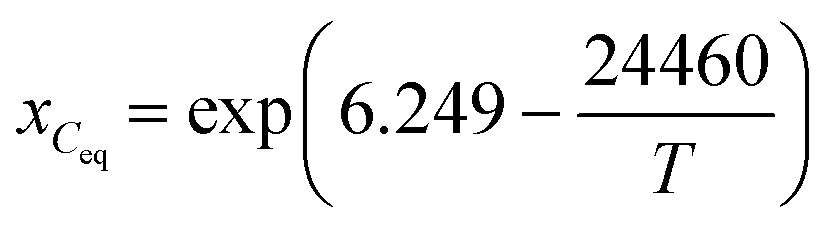
where kB is the Boltzmann constant, η is the dynamic viscosity, and r is the radius of the carbon atom. In the above equation, the solution is assumed as an incompressible fluid, allowing for the application of the Boussinesq approximation. The initial concentration of carbon in the solution is 100 mol m−3. Considering that the maximum Reynolds number is Re ≈ 1.12 × 10⁵, the calculations have employed the Reynolds-averaged Navier–Stokes (RANS) turbulence model. Considering that the calculation of crystal growth requires high accuracy in the calculation of concentration at the boundary, the SST turbulence model is used in this study. The boundary conditions of the concentration at the interface between the solution–seed and the solution–crucible are defined as the carbon equilibrium concentration, which can be expressed as follows:| |  | (10) |
| |  | (11) |
where Ceq is the carbon equilibrium concentration, ρSi is the liquid silicon density, MSi is the molar weight of silicon, and xCeq is the carbon molar fraction. The growth rate of the SiC crystal is determined by the diffusion of carbon to the surface of the seed crystal.| |  | (12) |
where MSiC is the molar weight of SiC, ρSiC is the density of SiC, and n is the unit vector perpendicular to the crystal surface. In order to elucidate the dissolution or precipitation of carbon in the solution, a supersaturation parameter has been defined as S, which can be expressed by eqn (10). A positive value of S indicates the carbon precipitation, while a negative value suggests continued carbon dissolution.| |  | (13) |
3. Results and discussion
3.1 Temperature distribution
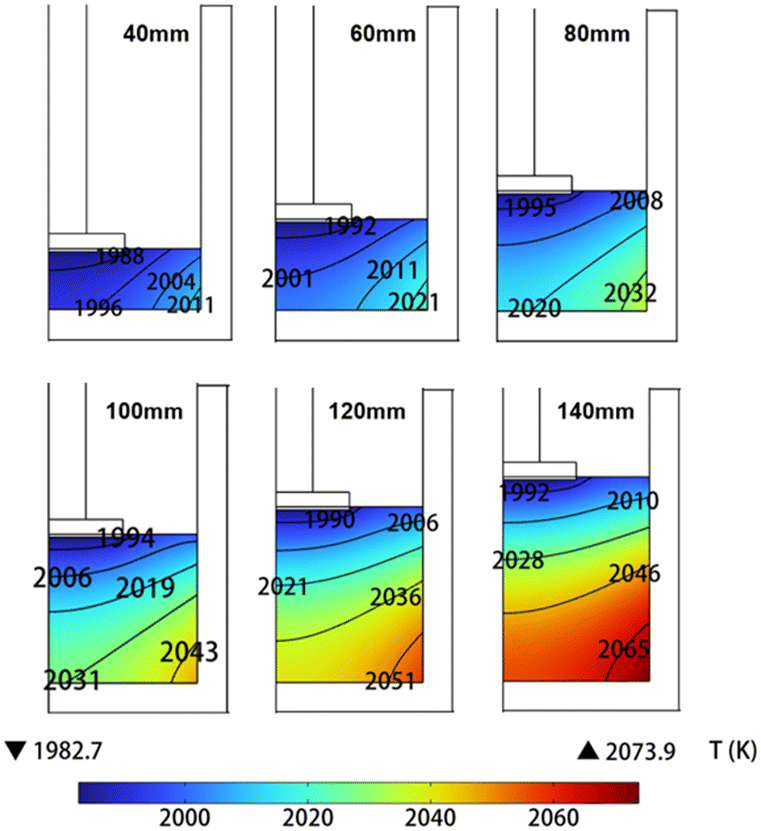
The solution height was adjusted based on the model shown in Fig. 2. Subsequently, a steady-state temperature distribution in the solution was calculated. In this step, by precisely regulating the current in the induction coil, a controlled temperature of approximately 1985 K was maintained beneath the seed crystal. Fig. 2 shows the temperature distribution in the solution for various solution heights (H ∈ [40–140 mm]). The temperature distribution in the solution at different heights presents a highly regular pattern due to the absence of solution flow. The lowest temperature is observed beneath the seed crystal, while the highest temperature is located in the lower right corner of the crucible. With an increase in solution height, there is a gradual rise in its maximum temperature, while the minimum temperature remains constant.
 |
| | Fig. 2 The temperature distribution of the solution at different solution heights. | |
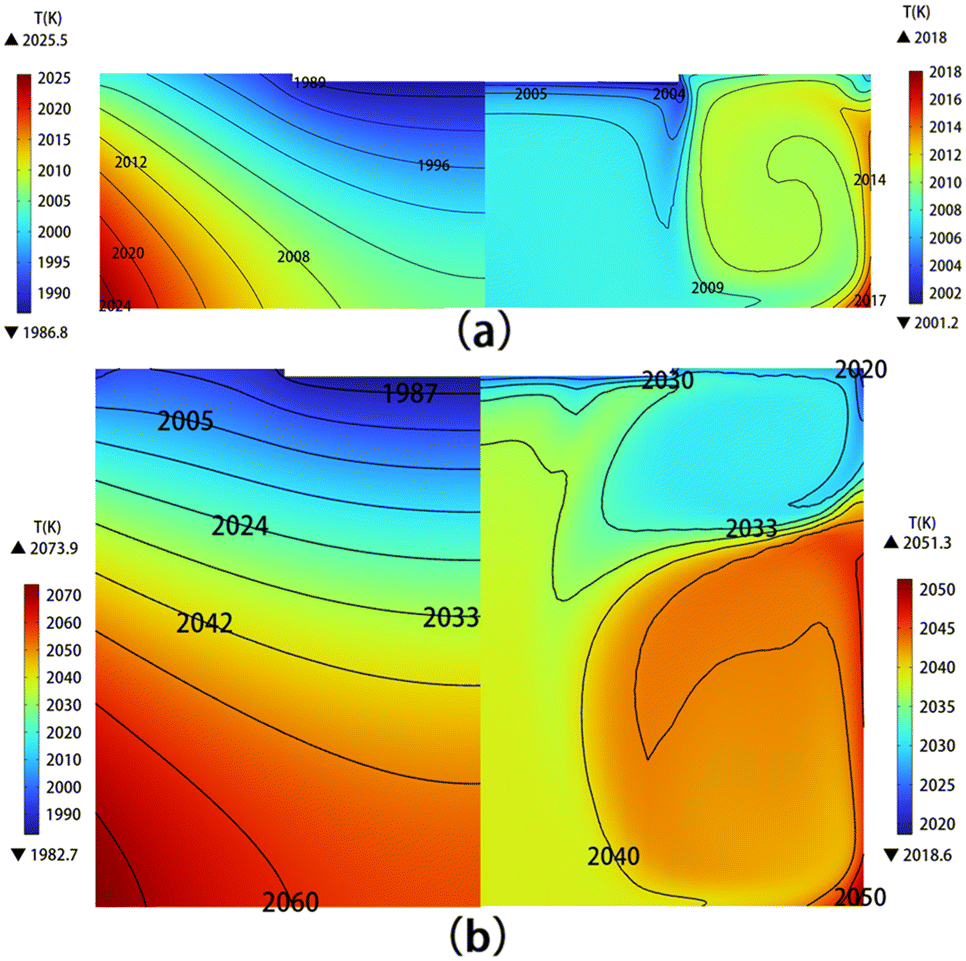
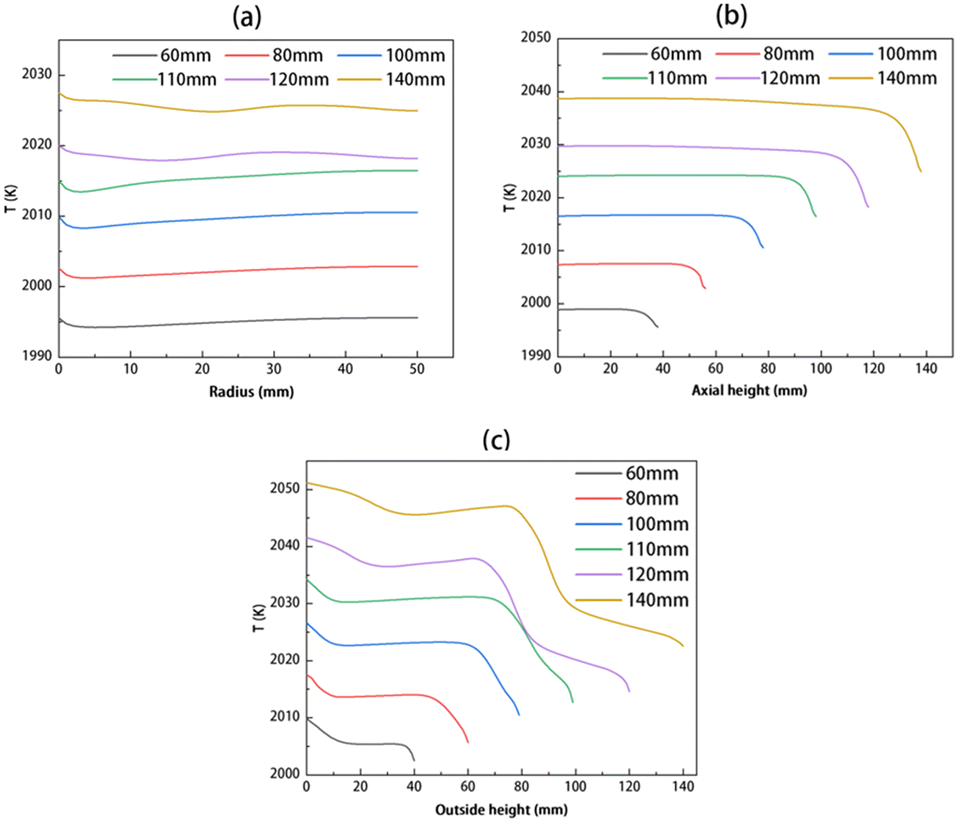
The temperature distribution of the solution has been calculated, taking into account the flow field. Fig. 3 shows the temperature of the solution without the flow field (left) and one with the flow field (right) for solution heights of 60 and 140 mm, respectively. It is evident that after the formation of a stable flow field in the solution, the temperature distribution becomes more uniform, and there is a significant reduction in temperature differences. With the increase in solution height, the overall temperature in the solution rises. For example, when the solution height increases from 60 to 140 mm, the highest temperature increases from 2018 to 2051 K. Fig. 4 shows the temperature along the seed-solution contact surface, the center axis, and the crucible outer wall–solution contact surface considering the flow field for different solution heights. It can be observed that as the solution height increases, the temperatures at all three contact surfaces rise, and the temperature distribution patterns are generally similar.
 |
| | Fig. 3 Temperature distribution in the solution without the flow field (left) and with the flow field (right) for (a) H = 60 mm and (b) H = 140 mm. | |
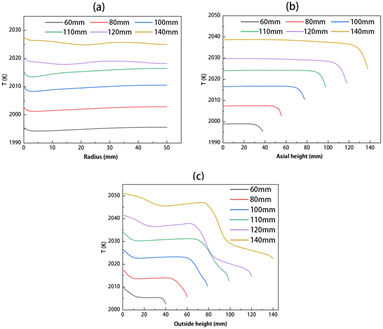 |
| | Fig. 4 Temperature distribution along (a) the seed–solution contact surface, (b) the center axis, and (c) the crucible outer wall–solution contact surface. | |
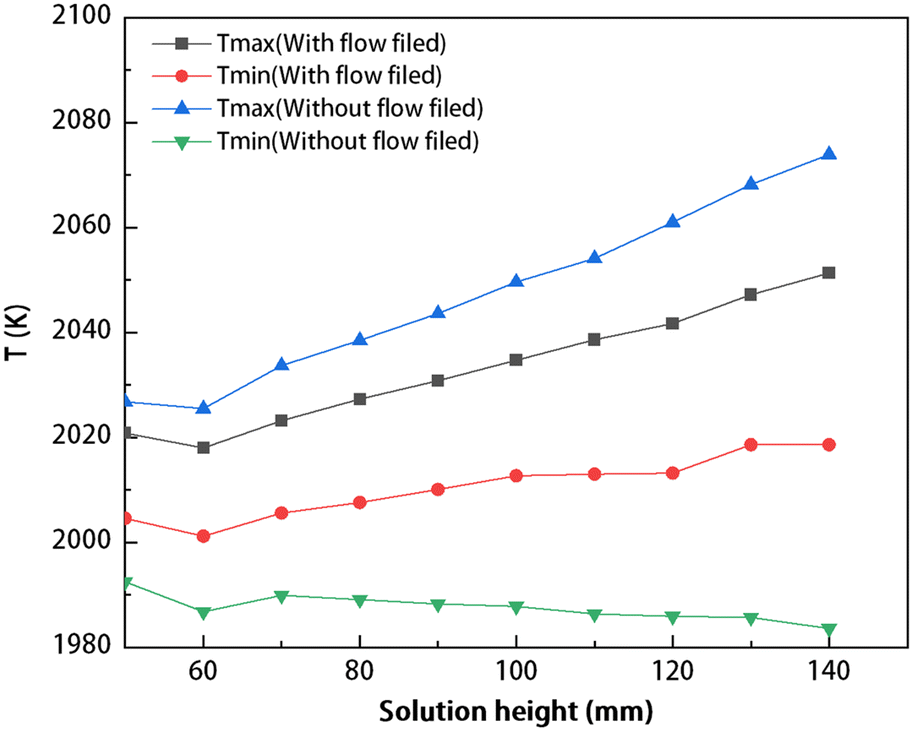
The temperature extremum distribution in the solution for different solution heights under two conditions: without the flow field and with the flow field is shown in Fig. 5. As illustrated in Fig. 5, in the absence of the flow field, the lowest temperature in the solution remains approximately constant at 1985 K, while as the solution height increases, there is a continuous rise in maximum temperature. After considering the flow field in the solution, the maximum temperature increases proportionally with the increase in solution height. Compared to the conditions without the flow field, there is a decrease in maximum temperature differences. As shown in Fig. 5, the temperature range spans from 1980 K to 2080 K in the solution. Upon application of the flow field, a temperature difference of approximately 20–30 K is achieved in the solution, thereby ensuring the requisite temperature gradient for carbon transport.
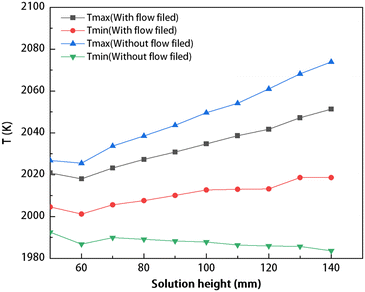 |
| | Fig. 5 The maximum and minimum temperatures in the solution at different solution heights (with the flow field and without the flow field). | |
3.2 Effects of solution height and crystal rotation on the flow field
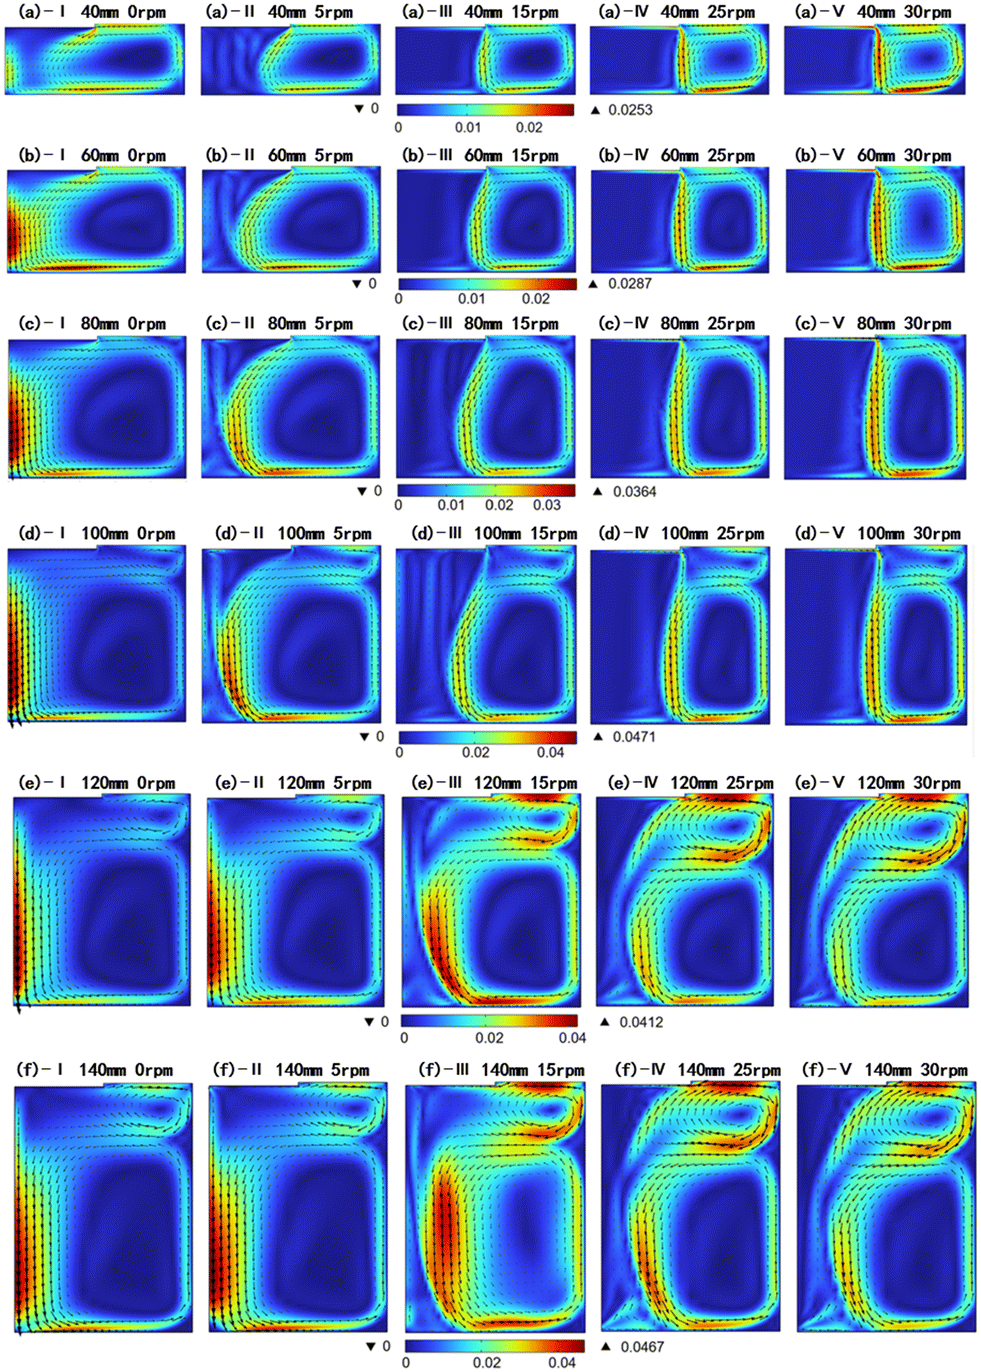
In the simulations conducted for various solution heights and crystal rotational speeds, seven different crystal rotational speeds ranging from 0 to 30 rpm with intervals of 5 rpm, and eleven different solution heights ranging from 40 to 140 mm with intervals of 10 mm have been selected. A total of 77 different combinations have been calculated. Due to space limitations, only some of these cases have been discussed here. Fig. 6 shows the solution flow field for different solution heights and crystal rotational speeds. The labels a–f represent distinct solution heights in the range of 40 to 140 mm, while the labels I–V represent varying crystal rotational speeds in the range of 0 to 30 rpm. As shown in Fig. 6, at a seed crystal speed of 0 rpm, the flow field is dominated by thermal buoyancy, electromagnetic force, and Marangoni force. At lower solution heights, a large counterclockwise vortex forms in the solution, with a strong downward flow beneath the seed crystal. This flow pattern is considered unfavorable for carbon transport from the crucible bottom to the crystal seed.23 As the solution height increases, a small clockwise vortex appears in the upper right corner of the solution, whose size is amplified with higher solution height. For instance, in Fig. 6(a–f)-I, no vortex is observed in the upper right corner at H = 40 mm; however, when the solution height increases to 80 mm or higher, a distinct small vortex becomes noticeable. It is noted that introducing crystal rotation into the solution has varying effects on the flow field under different solution height conditions. For comparison, the cases have been categorized into two groups: low solution heights (H ∈ [40 mm, 80 mm]) and high solution heights (H ∈ [100 mm, 140 mm]). Subsequently, the effects of solution height and crystal rotation on the solution flow field in these two categories will be investigated.
 |
| | Fig. 6 Summary of the solution flow field for different solution heights and crystal rotational speeds. The color represents the velocity magnitude of the solution, I–V indicate different rotational speeds, (a)–(f) indicate different solution height and the arrow represents the velocity direction (unit: m s−1). | |
Under low solution height conditions (H ∈ [40 mm, 80 mm]), the crystal rotation induces an upward flow perpendicular to the seed surface due to centrifugal force. As the rotational speed increases, this upward flow becomes more pronounced and compresses the original counterclockwise large vortex, as shown in Fig. 6(a–c). The heights of the original vortex remain largely unchanged with a further increase in crystal rotational speed, while its width gradually narrows and shifts toward the outer side of the crucible. The original vortex is almost completely displaced towards the outer half of the crucible at a crystal rotational speed of 30 rpm. Under high solution height conditions (H ∈ [100 mm, 140 mm]), as shown in Fig. 6(d–f), there is a noticeable clockwise small vortex even at 0 rpm rotational speed. In the research conducted by Yifan Dang et al. on the solution growth of SiC crystals, we also observed similar flow patterns.24 Moreover, the crystal rotation significantly affects the size of the upper vortex: higher crystal rotational speeds enhance the upper clockwise vortex. For instance, at H = 120 mm and crystal rotational speeds ranging from 0–15 rpm, as shown in Fig. 6(e), minimal changes are observed in the solution and size of the upper vortex compared to the low solution height situation. However, when the rotation of the seed crystal reaches 25 rpm or above, crystal rotation will facilitate the expansion of the upper clockwise vortex leading to a rapid enlargement of the upper clockwise vortex, as shown in Fig. 6(e)-IV and V. As a result, the formation of a flow field consisting of both a clockwise vortex and a counterclockwise large vortex occurs in the solution. Similar variations are also evident for solution heights at both 130 mm and 140 mm.
Observations reveal that at low solution heights, the dominant flow direction along the free surface is inward due to the absence or small scale of a clockwise vortex in the upper right corner, indicating the solution flow from the crucible towards the seed crystal. In the case of high solution height, there is a change in the direction of the flow along the free surface due to the enhancement of the clockwise vortex in the upper right corner. As shown in Fig. 6(d), influenced by the upper vortex, the flow direction of the solution at the free surface changes to an outward flow at H = 100 mm. An analysis of the free surface velocity was conducted for different solution heights, with the positive direction defined as outward. When the dominant flow direction along the free surface is inward, indicating a small upper right vortex, the flow pattern in the solution consists primarily of a counterclockwise large vortex and an upward flow below the seed induced by the crystal rotation. We refer to this flow pattern as the single-vortex pattern. Similarly, when the dominant flow direction along the free surface is outward, indicating a relatively large upper right vortex, the influence of the upper right vortex becomes significant. The flow pattern mainly consists of counterclockwise large vortex, crystal rotation-induced flows, and additional clockwise upper vortices. We refer to this flow pattern as the double-vortex pattern.
Fig. 7 shows the diameters of the upper vortex in the solution and the average velocity along the free surface for various conditions. The left Y-axis represents the diameter of the upper vortex, while the right Y-axis indicates the average velocity along the free surface. The X-axis corresponds to the radius. The green and yellow areas respectively indicate single-vortex and double-vortex patterns. The flow field shown in this figure indicates typical flow fields for these two patterns. The solid-colored line is the upper vortex diameters in the solution for different conditions, while the yellow dashed line is the average velocity of the free surface at a crystal rotational speed of 30 rpm. Outward is defined as the positive direction in our study, negative values of average velocity indicate an inward primary flow direction at the free surface, corresponding to a single-vortex pattern; meanwhile positive values of average velocity represent an outward primary flow direction at the free surface, corresponding to a double-vortex pattern.
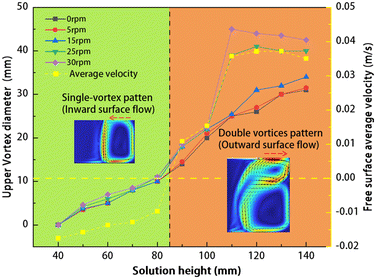 |
| | Fig. 7 The solid-colored line is the upper vortex diameters for different conditions, while the yellow dashed line is the average velocity of the free surface at a seed crystal rotational speed of 30 rpm (outward direction is positive). The green and yellow areas respectively indicate single-vortex and double-vortex patterns. The flow field depicted in this diagram shows typical flow fields for these two patterns. | |
The upper vortex is relatively small under low solution height conditions. As shown in Fig. 7, at H = 40 mm, no vortex is observed in the upper right corner of the solution, resulting in a diameter of 0 mm. As the solution height increases to 50 mm, a vortex with diameters less than 5 mm starts to form in the upper right corner. These vortices gradually grow larger as the solution height increases and present nearly linear growth. The size of the upper vortex remains largely unaffected by crystal rotation under these low solution height conditions. Under high solution height (H > 100 mm) and low crystal rotational speed (0–15 rpm) conditions, the trend of changes in the upper vortex is similar to low solution height, the vortex diameter increases as the solution height increases. However, at crystal rotational speeds of 25 and 30 rpm, the diameter of the upper vortex undergoes a sudden increase. This phenomenon can be attributed to the outward flow induced by the rotation of the seed crystal at high solution height. The vortex in the upper right corner exists independently due to its smaller diameter under the low solution conditions, thereby preventing these vortices from being influenced by the outward flow caused by seed crystal rotation. At high solution height, an enlarged upper vortex is present in the solution, with the left side of the vortex positioned adjacent to the edge of the seed crystal. Consequently, the upper vortex is susceptible to the outward flow induced by crystal rotation, leading to an amplification of the upper vortex. Due to the inadequate upward flow beneath the seed at low rotational speeds, which fails to induce the right-to-left flow at the interface between the seed and solution, the upper vortex was not significantly influenced. Consequently, there is a small size of the upper vortex when the seed rotational velocity is slow. This elucidates the consistent growth trend of the upper vortex observed at low crystal rotational speeds in Fig. 7.
3.2.1 Single-vortex pattern.
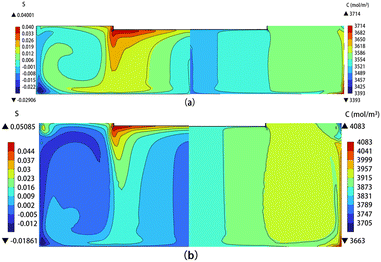
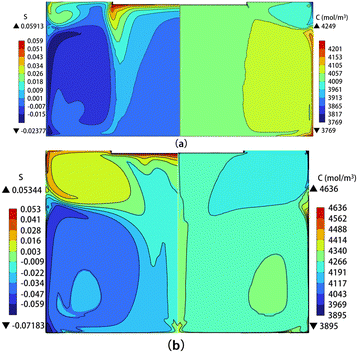
In this section, two cases have been selected, H = 40 and 80 mm, to represent the single-vortex pattern and discuss the distribution of carbon concentration and crystal growth. Fig. 8(a) and (b) show the distribution of carbon supersaturation (left) and carbon concentration (right) in the solution when the crystal rotational speed is 30 rpm for solution heights of 40 and 80 mm, respectively. The figures reveal that regions where carbon dissolves are primarily concentrated on the sidewalls and the bottom of the crucible. Comparatively, in the case of H = 80 mm, higher supersaturation (S) beneath the seed crystal results in increased crystal growth rates. Moreover, due to a clockwise small vortex present in the upper right corner at H = 80 mm as shown in Fig. 6(c)-V, the lower temperature and the absence of high-carbon solution flow in this area have resulted in the formation of an elliptical region with low carbon concentration but high carbon supersaturation, as shown in Fig. 8(b).
 |
| | Fig. 8 The carbon supersaturation (left) and carbon concentration distribution (right) in the solution at (a) H = 40 mm and (b) H = 80 mm. | |
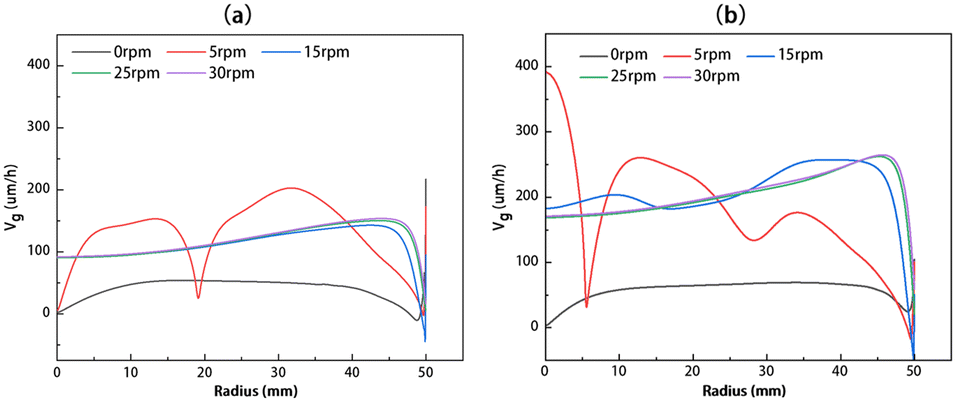
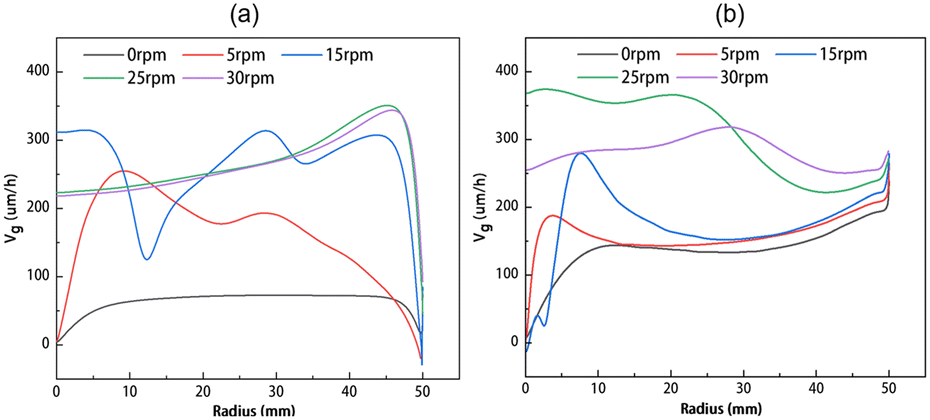
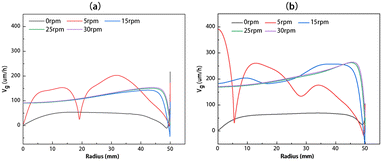
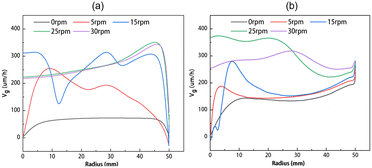
The crystal growth rates at different crystal rotational speeds are shown in Fig. 9, for solution heights of 40 and 80 mm, respectively. The corresponding flow fields are shown in Fig. 6(a) and (c). Fig. 9 shows that at a crystal rotational speed of 0 rpm, the growth rates present a lower and uniform level. As the crystal rotational speed gradually increases, continuous changes occur in the flow field beneath the seed crystal, resulting in fluctuations in the curve. When the crystal rotational speed reaches 15 rpm and above, the flow field becomes essentially stable. At this point, the growth rate remains constant and the crystal growth rate is around 100 μm h−1, highly consistent with the growth rates observed in previous work of Dang et al.24 Notably, at 50 mm from the center, there is a significant decrease in growth rate primarily attributed to the downward flow near the edge of the seed crystal which reduces the carbon concentration gradient in this region.
 |
| | Fig. 9 The growth rate distributions along the radius at different rotational speeds for (a) H = 40 mm and (b) H = 80 mm. | |
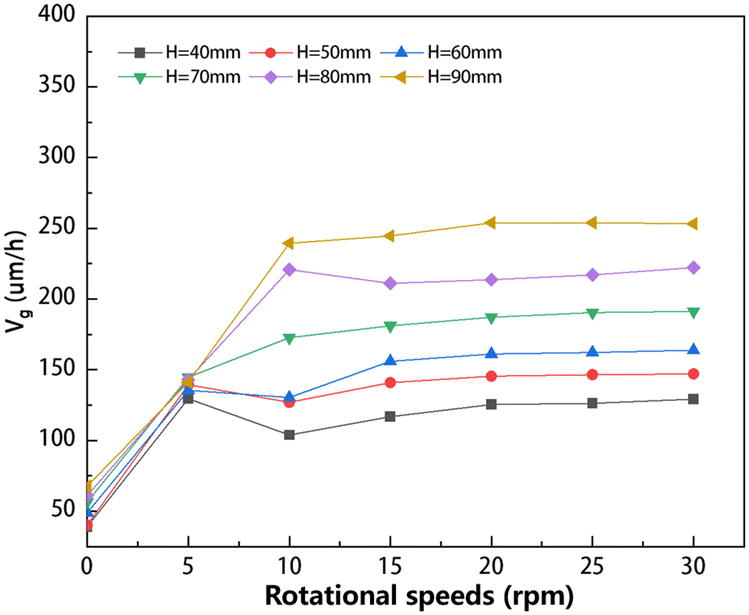
To better illustrate the variations in crystal growth rate, the average crystal growth rate for all cases of the single-vortex pattern was calculated as shown in Fig. 10. This figure demonstrates a clear regularity in the average growth rate. As the crystal rotational speed increases from 0 rpm, there is a rapid initial increase followed by stabilization in the crystal growth rate. In the case of low solution height, a lower seed crystal rotational speed is sufficient to achieve a stable growth rate; as the solution height increases, attaining the same state necessitates a higher crystal rotational speed. For instance, when the solution heights range from 40 to 60 mm, a crystal rotational speed of approximately 5 rpm is sufficient to attain a stable crystal growth rate state. However, when the solution height increases to 60–90 mm, a seed crystal rotational speed of at least 10 rpm is required to achieve a stable crystal growth rate. This indicates that when the solution is low, the influence of crystal rotation is large, and the stable flow field is easy to establish. When the crystal rotational speed exceeds 10 rpm, the average growth rates become nearly identical due to the gradual stabilization of flow patterns under single-vortex conditions. Additionally, by increasing the solution height while maintaining a constant crystal rotational speed, the crystal growth rate can be enhanced under the low solution height conditions. As shown in Fig. 10, under the stable flow conditions with the same crystal rotational speed, there is an increase in the average growth rate from approximately 120 μm h−1 at 40 mm to 250 μm h−1 at 90 mm.
 |
| | Fig. 10 Summary of average crystal growth rate at different solution heights and crystal rotational speeds under the single-vortex pattern conditions. | |
3.2.2 Double-vortex pattern.
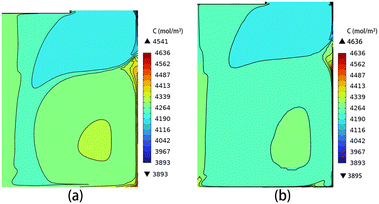
For the double-vortex pattern, two cases have been selected for discussion: the solution heights of 100 and 140 mm. The flow fields corresponding to these cases are shown in Fig. 6(d) and (f), respectively. Fig. 11 shows the distribution of the carbon supersaturation (left) and the carbon concentration (right) for these two conditions at a crystal rotational speed of 30 rpm. Similar to the single-vortex pattern, the carbon concentration is higher in the bottom and sidewall regions of the crucible, and the region of high carbon supersaturation is mostly concentrated below the seed crystal. In the case of high solution, both the regions with lower and higher carbon supersaturation increases as the upper vortex expands.
 |
| | Fig. 11 Distribution of carbon supersaturation (left) and carbon concentration (right) in the solution for (a) H = 100 mm and (b) H = 140 mm. | |
The crystal growth rates at different rotational speeds of the crystal for solution heights of 100 and 140 mm are shown in Fig. 12(a) and (b), respectively. It can be observed that the crystal growth rate presents continuous variation with increasing rotational speed of the crystal. At a rotational speed of 25 rpm, the crystal growth rate becomes constant. In contrast to the case of 100 mm, it is evident that at H = 140 mm, there is an increase in the crystal growth rate on the outer edge of the seed crystal. This phenomenon can be attributed to the effect of the clockwise vortex in the upper right corner, especially when higher rotational speeds of the crystal are applied. The clockwise vortex increases an upward flow near the seed crystal, enhancing carbon transport and resulting in a larger carbon concentration gradient near the seed crystal edge, thereby causing an increased crystal growth rate near the edge.
 |
| | Fig. 12 The growth rate at different rotational speeds for (a) H = 100 mm and (b) H = 140 mm. | |
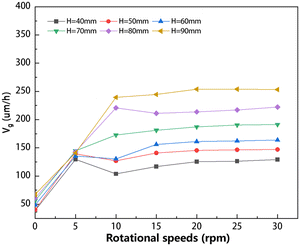
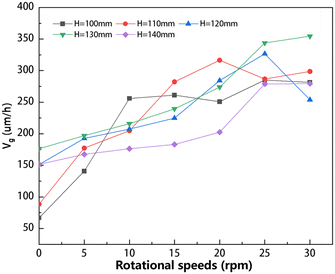
The average crystal growth rate of the double-vortex pattern is also summarized and shown in Fig. 13. In contrast to a single-vortex pattern, where the growth rate stabilizes rapidly with increasing rotational speed, the average crystal growth rate presents continuous variation in a double-vortex pattern. Before reaching a rotational speed of 15 rpm, there is an increase in the average crystal growth rate with increasing speed. When the rotational speed exceeds 15 rpm, the average growth rate demonstrates variations across diverse circumstances. Each specific solution height requires a different rotational speed to achieve the maximum growth rate. As shown in Fig. 13, the optimal rotational speeds for achieving the highest average growth rates are 15, 20, 25, and 30 rpm, respectively, for the solution heights of 100, 110, 120, and 130 mm. However, when the solution height increased to 140 mm, the average growth rates at different speeds are lower than those of low solution height. Therefore, it is inferred that excessive solution height may be detrimental to crystal growth.
 |
| | Fig. 13 Summary of average crystal growth rate at different solution heights and rotational speeds under the double-vortex pattern conditions. | |
3.3 Effects of the solution height and rotational speed on the growth rate
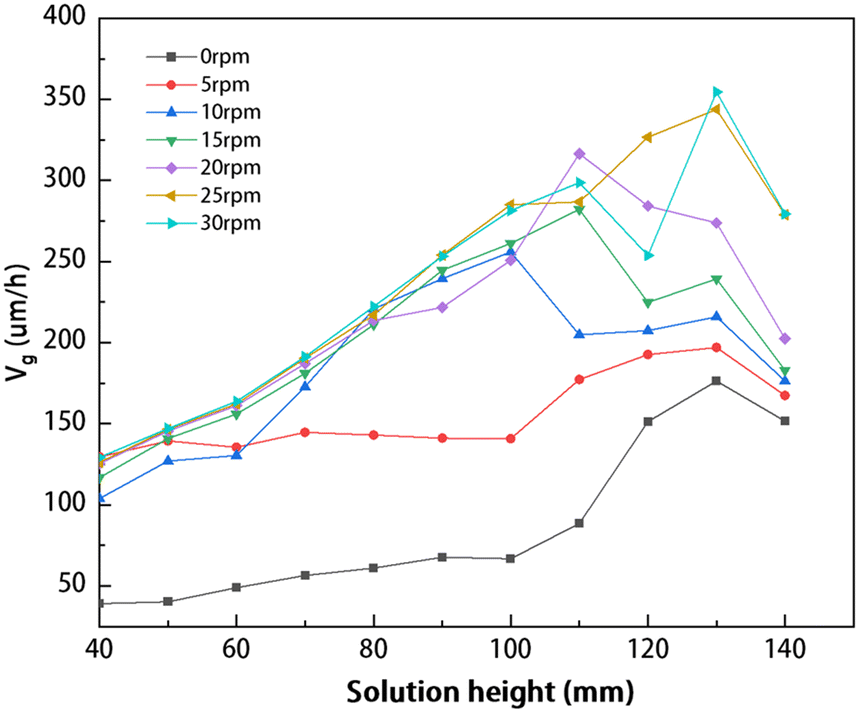
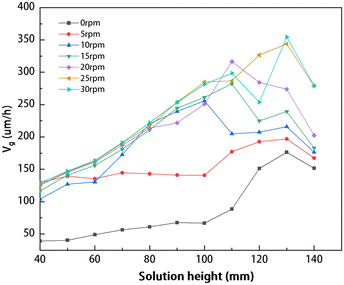
The average growth rates of single crystals at different solution heights and rotational speeds are shown in Fig. 14. The results demonstrate that, for solution heights below 100 mm, the average growth rate presents a consistent increase as the rotational speed is increased. A positive correlation between the average growth rate and the rotational speed has disappeared when the solution height exceeds 110 mm. In the range of the rotational speed of 0–20 rpm, the crystal growth rate increases proportionally to the rotational speed. However, exceeding a rotational speed of 20 rpm may result in a decline in the growth rate. For instance, at H = 110 mm and a rotational speed of 20 rpm, further increasing the rotational speed results in decreasing crystal growth rates.
 |
| | Fig. 14 The average rate of crystal growth at various solution heights and rotational speeds. | |
In Fig. 14, the average growth rate presents a noticeable decrease when the solution height reaches 140 mm, in comparison to other solution heights at the same crystal rotational speed. This phenomenon can be attributed to the hindered carbon transport due to the increased height. Fig. 15(a) and (b) show the distribution of carbon concentration in the solution at a rotational speed of 30 rpm for H = 130 mm and 140 mm, respectively. The figures show that at a solution height of 140 mm, the distribution of carbon concentration in the solution becomes more uniform compared to 130 mm. Increasing the solution height to 140 mm results in a significant reduction in the carbon concentration below the seed crystal and a reduction in the size of the high-carbon concentration region compared to the case of the solution height of 130 mm. The observed phenomenon can be attributed to the increased height of the solution, resulting in larger outer vortices that hinder the upward flow beneath the seed crystal.
 |
| | Fig. 15 The distribution of carbon concentration in the solution for (a) H = 130 mm and (b) H = 140 mm. | |
Conclusions
Global numerical calculations have been conducted on the growth of SiC single crystals by TSSG. Through the calculations, the effects of the solution height and crystal rotation on the flow field pattern, temperature distribution, and crystal growth rate have been investigated. The rotation of the seed crystal triggers an upward flow in the solution beneath it, which facilitates the efficient transport of carbon from the bottom of the crucible to the crystal growth interface, leading to a significant increase in the growth rate. As the solution height increases, a gradual temperature increase is observed in the solution, which is accompanied by a transition in the flow field from a single-vortex to a double-vortex pattern.
The rotation of the crystal has varying effects on each pattern. In the single-vortex pattern, the flow field exhibits a high level of responsiveness to seed crystal rotation. As the speed of crystal rotation increases, there is a rapid increase in the rate of crystal growth, which is then followed by stabilization. Increasing the height of the solution at this stage reveals a further increase in the growth rate. In the double-vortex pattern, if the solution height exceeds 100 mm, the rotation of the crystal significantly amplifies the upper vortex.
To obtain optimal growth rates, it is advisable to choose crystal rotational speeds that correspond to specific solution heights. A suitable increase in solution height amplifies the crystal growth rate, whereas an excessive solution height will additionally intensify the vortices in the solution, leading to a reduction in the upward flow induced by the seed crystal rotation. As a result, carbon transport is hindered, and crystal growth is impeded. In this study, it was discovered that a higher average crystal growth rate can be obtained by rotating the crystal at a speed of 20–30 rpm in a double-vortex pattern.
Conflicts of interest
There are no conflicts to declare.
Acknowledgements
This work was supported by the National Natural Science Foundation of China (No. 52202189, 61704154, 61721005, 62274143), the “Pioneer” and “Leading Goose” R&D Program of Zhejiang (Grant No. 2022C01021, 2023C01010), the National Key Research and Development Program of China (Grant No. 2018YFB2200101), the Natural Science Foundation of Zhejiang Province (No. LY20F040006), Joint Funds of the Zhejiang Provincial Natural Science Foundation of China (LHZSD24E020001), and the Open Fund of Zhejiang Provincial Key Laboratory of Power Semiconductor Materials and Devices, Hangzhou Global Scientific and Technological Innovation Center, Zhejiang University.
References
- H. Okumura, Jpn. J. Appl. Phys., 2006, 45(10R), 7565 CrossRef CAS.
- J. Biela, M. Schweizer and S. Waffler, IEEE Trans. Ind. Electron., 2010, 58(7), 2872–2882 Search PubMed.
- Y. M. Tairov and V. F. Tsvetkov, J. Cryst. Growth, 1978, 43(2), 209–212 CrossRef CAS.
- N. Yang, B. Song and W. Wang, CrystEngComm, 2022, 24(18), 3475–3480 RSC.
- T. Kimoto, Jpn. J. Appl. Phys., 2015, 54(4), 040103 CrossRef.
-
K. Yamamoto, M. Nagaya and H. Watanabe, Materials Science Forum, Trans Tech Publications Ltd, 2012, vol. 717, pp. 477–480.
- T. Kimoto, Prog. Cryst. Growth Charact. Mater., 2016, 62(2), 329–351 CrossRef CAS.
- T. Ujihara, R. Maekawa and R. Tanaka, J. Cryst. Growth, 2008, 310(7–9), 1438–1442 CrossRef CAS.
- Y. Yamamoto, S. Harada and K. Seki, Appl. Phys. Express, 2012, 5(11), 115501 CrossRef.
- Y. Yamamoto, S. Harada and K. Seki, Appl. Phys. Express, 2014, 7(6), 065501 CrossRef CAS.
- G. Wang, D. Sheng and H. Li, CrystEngComm, 2023, 25(4), 560–566 RSC.
- J. Lefebure, J. M. Dedulle and T. Ouisse, Cryst. Growth Des., 2012, 12(2), 909–913 CrossRef CAS.
- T. Umezaki, D. Koike and S. Harada, Jpn. J. Appl. Phys., 2016, 55(12), 125601 CrossRef.
- T. Horiuchi, L. Wang and A. Sekimoto, Cryst. Res. Technol., 2019, 54(5), 1900014 CrossRef.
- M. T. Ha, Y. J. Yu and Y. J. Shin, RSC Adv., 2019, 9(45), 26327–26337 RSC.
- Y. Mukaiyama, M. Iizuka and A. Vorob'ev, J. Cryst. Growth, 2017, 475, 178–185 CrossRef CAS.
- T. Yamamoto, Y. Okano and T. Ujihara, J. Cryst. Growth, 2017, 470, 75–88 CrossRef CAS.
- K. Kusunoki, N. Okada and K. Kamei, J. Cryst. Growth, 2014, 395, 68–73 CrossRef CAS.
- F. Li, L. He and Z. Yan, J. Cryst. Growth, 2023, 607, 127112 CrossRef CAS.
- H. Daikoku, S. Kawanishi and T. Ishikawa, J. Chem. Thermodyn., 2021, 160, 106476 CrossRef CAS.
- F. Mercier, J. M. Dedulle and D. Chaussende, J. Cryst. Growth, 2010, 312(2), 155–163 CrossRef CAS.
- B. Liu, Y. Yu and X. Tang, J. Cryst. Growth, 2020, 533, 125406 CrossRef CAS.
- T. Horiuchi, L. Wang and A. Sekimoto, J. Cryst. Growth, 2019, 517, 59–63 CrossRef CAS.
- Y. Dang, C. Zhu and M. Ikumi, CrystEngComm, 2021, 23(9), 1982–1990 RSC.
|
| This journal is © The Royal Society of Chemistry 2024 |
Click here to see how this site uses Cookies. View our privacy policy here. 
 Open Access Article
 This Open Access Article is licensed under a
  ab,
Lingbo
Xu
ab,
Lingbo
Xu