 Open Access Article
An unusual ionic cocrystal of ponatinib hydrochloride: characterization by single-crystal X-ray diffraction and ultra-high field NMR spectroscopy†
Alexander J.
Stirk‡
 a,
Sean T.
Holmes‡
 bc,
Fabio E. S.
Souza
a,
Ivan
Hung
 c,
Zhehong
Gan
 c,
James F.
Britten
d,
Allan W.
Rey
a and
Robert W.
Schurko
 *bc
*bc
aApotex Pharmachem Inc., Brantford, ON N3T 6B8, Canada
bDepartment of Chemistry & Biochemistry, Florida State University, Tallahassee, FL 32306, USA. E-mail: rschurko@fsu.edu
cNational High Magnetic Field Laboratory, Tallahassee, FL 32310, USA
dMAX Diffraction Facility, McMaster University, Hamilton, ON L8S 4M1, Canada
First published on 30th January 2024
Abstract
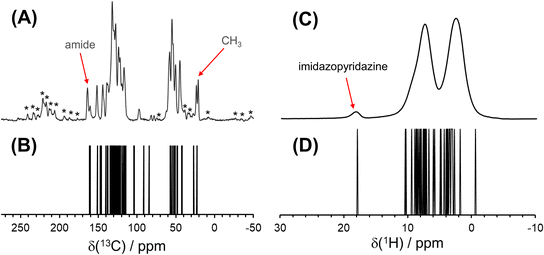
This study describes the discovery of a unique ionic cocrystal of the active pharmaceutical ingredient (API) ponatinib hydrochloride (pon·HCl), and characterization using single-crystal X-ray diffraction (SCXRD) and solid-state NMR (SSNMR) spectroscopy. Pon·HCl is a multicomponent crystal that features an unusual stoichiometry, with an asymmetric unit containing both monocations and dications of the ponatinib molecule, three water molecules, and three chloride ions. Structural features include (i) a charged imidazopyridazine moiety that forms a hydrogen bond between the ponatinib monocations and dications and (ii) a chloride ion that does not feature hydrogen bonds involving any organic moiety, instead being situated in a “square” arrangement with three water molecules. Multinuclear SSNMR, featuring high and ultra-high fields up to 35.2 T, provides the groundwork for structural interpretation of complex multicomponent crystals in the absence of diffraction data. A 13C CP/MAS spectrum confirms the presence of two crystallographically distinct ponatinib molecules, whereas 1D 1H and 2D 1H–1H DQ–SQ spectra identify and assign the unusually deshielded imidazopyridazine proton. 1D 35Cl spectra obtained at multiple fields confirm the presence of three distinct chloride ions, with density functional theory calculations providing key relationships between the SSNMR spectra and H⋯Cl− hydrogen bonding arrangements. A 2D 35Cl → 1H D-RINEPT spectrum confirms the spatial proximities between the chloride ions, water molecules, and amine moieties. This all suggests future application of multinuclear SSNMR at high and ultra-high fields to the study of complex API solid forms for which SCXRD data are unavailable, with potential application to heterogeneous mixtures or amorphous solid dispersions.
1. Introduction
A significant body of research has been devoted to relating the crystal structures of active pharmaceutical ingredients (APIs) to their physicochemical properties.1–4 Various classes of solid forms of APIs exist, including polymorphs, salts, hydrates/solvates, cocrystals, amorphous phases (including amorphous solid dispersions), and various combinations of these forms. Each solid form of an API can have divergent physicochemical properties, and can sometimes be marketed as distinct pharmaceutical products.5,6 Because of the integral relationship between molecular-level structure and the properties of each solid form, there is significant interest in developing methods for the structural characterization of APIs. Full structural characterization provides useful information for rational design of novel solid forms, which can lead to improvements in drug efficacy, safety, and protection of intellectual property.7,8Two common ways of modifying the physicochemical properties of an API are through the synthesis of salts (i.e., solids exhibiting complete charge transfer between two or more molecular components) and cocrystals (i.e., solids that are composed of two or more molecular and/or ionic components in the same crystal lattice, which are neither solvates or simple salts). Consequently, there is significant interest in studying the salt/cocrystal continuum,9–11 especially as it relates to multicomponent crystals that are difficult to classify.12 One uncommon group of API solid forms is those that contain an API with mixed charges on the counterion/coformer molecules. An example of this is the oxalate/oxalic acid salt cocrystal of escitalopram.13 The crystal structure contains two escitalopram cations balanced by an oxalate dianion. Also included in the structure, hydrogen bonded to each side of the oxalate, are neutral molecules of oxalic acid, which produce linear supramolecular chains. Other examples include the hydrogen oxalate salt of ritonavir that cocrystallizes with oxalic acid,14 and the tiotropium fumarate salt that cocrystallizes with fumaric acid,15 both of which feature linear hydrogen oxalate/oxalic acid and/or fumarate/fumaric acid supramolecular chains. To the authors' knowledge, there are no examples of solid forms featuring mixed charges on API molecules. Although some progress has been made in the study of these materials, a more complete understanding of the structures of materials falling within the salt/cocrystal continuum would benefit from the advancement of spectroscopic methods for the structural characterization of API solid forms.8,16–21
Solid-state NMR (SSNMR) spectroscopy is a powerful technique for the structural characterization of APIs, as it can greatly augment the understanding of molecular-level structure obtained by other methods such as X-ray diffraction (XRD).22 In this regard, NMR crystallography has the potential to provide insight into crystal structures in the absence of high-quality diffraction data,23–34 making the analysis of NMR spectra in terms of structural features a topic of considerable recent investigation.35–40 1D and/or 2D 13C SSNMR experiments are among the most commonly used, that when paired with quantum chemical calculations using density functional theory (DFT), provide site-specific chemical information that can be linked directly to molecular-level structure.38,41 However, these methods have limited applications for large molecules with many carbon atoms, where definitive spectral assignments often cannot be made. Furthermore, measurement of the isotropic chemical shifts alone may not provide rich structural information related to intermolecular bonding arrangements (although this could be obtained through measurement of the principal values of chemical shift tensors or through other 2D techniques).2213C SSNMR also has limited applicability for the study of API dosage forms where interfering signals arise from excipient molecules (especially for those of low API wt%). 1H SSNMR techniques also suffer from similar disadvantages, which are compounded by the smaller chemical shift range and the common presence of strong homonuclear dipolar coupling, which broadens spectral lines, even under conditions of moderate or fast magic angle spinning (MAS).42
When an API is formulated as a hydrochloride (HCl) salt (which accounts for nearly half of oral dosage forms),4335Cl (nuclear spin, I = 3/2) SSNMR spectroscopy is invaluable for characterizing the local hydrogen bonding environments of chloride ions.44–55 This sensitivity results from the fact that electric field gradients (EFGs) at the chlorine nucleus are extremely sensitive to ground-state electron density, as reflected in the appearance of the corresponding 35Cl SSNMR central transition (CT, +1/2 ↔ −1/2) powder patterns, which are typically influenced by the second-order quadrupolar interaction. Furthermore, the number of magnetically distinct chloride ions in an API solid form is typically small, meaning that spectra can be readily assigned and interpreted in terms of their local H⋯Cl− hydrogen bonding environments.44–5035Cl SSNMR methods also have the ability to identify chemical changes that occur within dosage forms (e.g., the uptake of atmospheric water or the disproportionation of ions due to interactions with excipients),56,57 quantify the wt% API in dosage forms,46,56 and even characterize static and/or dynamic disorder in solids.58 Various 2D SSNMR techniques that exploit (ultra)fast MAS and indirect detection of low-γ nuclides have been developed in recent years,59–63 which could enhance understanding of H⋯Cl− hydrogen bonding arrangements and their complex relationships with 35Cl EFG tensors. Finally, the advent of ultra-high field NMR (e.g., using fields up to 35.2 T), possibly augmented through use of MQMAS techniques,64–66 is expected to advance applications of 35Cl SSNMR spectroscopy for the study of complex API solid forms with multiple overlapping patterns, including heterogeneous mixtures and amorphous solid dispersions.
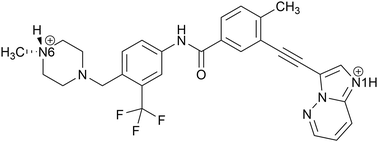
This study focuses on a novel solid form of the API ponatinib hydrochloride, 3-[2-(imidazo[1,2-b]pyridazin-3-yl)ethynyl]-4-methyl-N-{4-[(4-methylpiperazin-1-yl)methyl]-3-(trifluoromethyl)phenyl}benzamide hydrochloride (Scheme 1), a tyrosine-kinase inhibitor used for the treatment of leukemia.67,68 At least eight different solid forms of ponatinib have been reported,69–71 including one form that is used in the branded drug product Iclusig.72–74 We report the synthesis and characterization of a ionic cocrystal of ponatinib HCl, (hereafter referred to as pon·HCl),75 which features an unusual stoichiometry with an asymmetric unit containing both a monocation and a dication of the ponatinib molecule, three water molecules, and three chloride ions. The crystal structure is obtained through single-crystal X-ray diffraction, and the uncommon structural features are verified through multinuclear and multidimensional SSNMR spectroscopy, with an emphasis on 35Cl NMR spectra acquired at fields up to 35.2 T. DFT calculations are used to refine the crystal structure, assign peaks in the complex 1H and 13C SSNMR spectra, and provide relationships between the molecular-level structure and 35Cl SSNMR spectra. We emphasize that this is the only solid form of ponatinib to be characterized by either XRD or SSNMR methods to date. Finally, we discuss the significance of the discovery of this unusual ionic cocrystal, its wider implications to the crystal engineering and pharmaceutical communities, and the utility of high-field SSNMR spectroscopy for the characterization of such materials.
2. Experimental
2.1. Synthesis
2.2. Single crystal X-ray diffraction
SCXRD studies were conducted at the MAX facility at McMaster University (Hamilton, ON, Canada). A suitable crystal fragment was selected and frozen on a MiTeGen loop using n-paratone oil on a Bruker APEX-II CCD diffractometer with a Mo Kα radiation source. The temperature was kept at 100 K during data collection. Using OLEX2,76 the structure was solved with the XT77 structure solution program using intrinsic phasing and refined with the XL78 refinement package using least squares minimization. The structure has been deposited in the Cambridge Structural Database under the deposition number 2302285 with database identifier PONLOX.2.3. Solid-state NMR spectroscopy
All spectra were processed and fit using the ssNake v1.3 software package.80 Uncertainties in the EFG and chemical shift tensor parameters and Euler angles were assessed via bidirectional variation of each parameter, and visual comparison of experimental and simulated spectra.
2.4. Additional characterization techniques
Additional characterization techniques, including powder XRD (PXRD), thermal gravimetric analysis (TGA), differential scanning calorimetry (DSC), potentiometric titrations, and solution-state 1H NMR spectroscopy, are described in the ESI† S1.2.5. Density functional theory calculations
35Cl EFG and magnetic shielding tensors were calculated through a single periodic calculation using CASTEP. In contrast, 1H and 13C magnetic shielding tensors were obtained from three separate calculations: (i) a RPBE calculation in CASTEP using the periodic crystal lattice as a structural model; (ii) a RPBE calculation in CASTEP using only an isolated molecule, which was approximated using a P1 unit cell with a size of 25 × 25 × 25 Å; and (iii) a final PBE0 calculation in AMS using an isolated molecule as the structural model. The difference between the first two calculations provides the intermolecular contributions to the 1H and 13C chemical shifts, which are added to the higher level PBE0 calculation performed in AMS. The advantage of this method rests on the fact that magnetic shielding is largely a local phenomenon, meaning that the influences of weak noncovalent interactions on magnetic shielding tensors can be calculated at a tractable lower level.
1H, 13C, and 35Cl magnetic shielding constants were converted to their respective chemical shift scales through additional calculations on small organic molecules and comparison with previously published experimental chemical shifts (ESI† S2).62,117–120 Euler angles describing the relative orientation of the chemical shift and EFG tensors, according to the ZY′Z′′ convention for rotation, were extracted from the CASTEP output files using EFGShield 4.1.121
3. Results and discussion
3.1. Synthesis and preliminary characterization
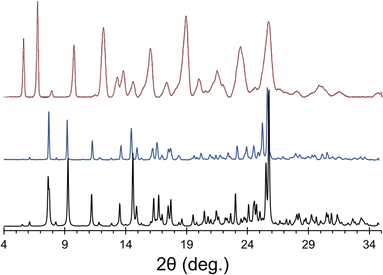
A novel solid form of the API ponatinib hydrochloride (pon·HCl) was synthesized from both ponatinib monohydrochloride and freebase ponatinib as reagents, with the former yielding powder samples, and the latter yielding either powders or large crystals, depending on the experimental conditions. All three synthetic pathways led to formation of the same novel product, as indicated by PXRD (Fig. 1). It was initially assumed that pon·HCl was simply a novel polymorph or hydrate of ponatinib monohydrochloride; however, subsequent analyses demonstrated that this was not the case.The structure of pon·HCl was determined by SCXRD, and found to be a complex multicomponent crystal featuring a ponatinib monocation, a ponatinib dication, three chloride ions, and three water molecules (vide infra). However, prior to the determination of the crystal structure and the precise establishment of the stoichiometry of various molecular and ionic components, several analytical techniques indicated that pon·HCl is a hydrate, and does not feature the anticipated 1.0 eq. of Cl− to 1.0 eq. of ponatinib for a monohydrochloride salt. Powder samples of pon·HCl appear to be stable under ambient conditions and are unaffected by humidity. The DSC thermogram shows a broad, major endotherm with an onset at 175.4 °C, further indicating the stability of pon·HCl near RT (Fig. S1†). Analysis by TGA indicates a gradual reduction in mass of 4.4% during heating from ca. 30–175 °C, which is consistent with a loss of 1.5 eq. of H2O relative to the 1.0 eq. of ponatinib (Fig. S2†). A potentiometric titration for Cl− ions showed 8.50% Cl− in the material, which is close to the 8.66% that would indicate 1.5 eq. of Cl− with respect to the 1.0 eq. of ponatinib. The 1H NMR (acetic acid-d3) spectrum showed that ca. 0.06 wt% formic acid was retained in the final solid products (Fig. S3†) (N.B.: the role of formic acid in crystal nucleation is unknown, except for the fact that without it, pon·HCl is not formed. It may be that interactions involving formic acid, ponatinib, and other constituents play key roles in pre-organization, nucleation, and/or crystallization).
The consistent observation of 1.5 eq. of Cl− (indicated by potentiometric titrations) and 1.5 eq. of H2O (indicated by TGA) relative to the 1.0 eq. of ponatinib that would be anticipated for a monohydrochloride salt led us to reconsider the optimal synthetic conditions for preparing pon·HCl. To rule out the possibility that the excess Cl− arises from interstitial sources (e.g., aqueous HCl), additional efforts were made to remove the excess chloride. Syntheses using <1.5 eq. of Cl− resulted in lower yields, but still with 1.5 eq. of Cl−. Attempts to dry the material further using higher temperatures and stronger vacuum resulted in a reduction to 1.3 eq. of Cl− in the final solid product, but with significant decreases in crystallinity (as indicated by PXRD). In the end, it was clear that the excess 0.5 eq. of chloride could not be removed without compromising the crystallinity of the solid form, and that a novel solid form had been produced with a stoichiometry distinct from that of a monohydrochloride salt. Therefore, an effort was made to characterize pon·HCl through the combination of SCXRD and multinuclear SSNMR spectroscopy.
3.2. Crystal structure and refinement
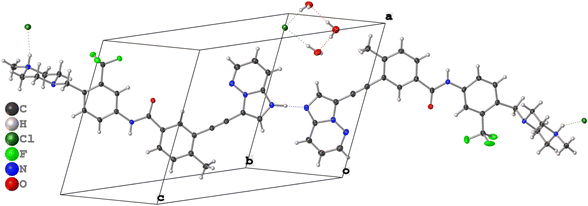
Pon·HCl crystallizes in the triclinic space group P![[1 with combining macron]](https://www.rsc.org/images/entities/char_0031_0304.gif) (Table 1) with a structure that is composed of one ponatinib monocation, one ponatinib dication, three chloride anions, and three water molecules in the asymmetric unit (Fig. 2; see Fig. S4† for an overlay of the two ponatinib molecules), which is consistent with the preliminary observations made through TGA and potentiometric titrations. Both the mono- and dications of the ponatinib molecule are protonated on the methyl piperazine nitrogens (N6B and N6A, respectively), each forming a hydrogen bond with the nearby chloride ions (Cl1B and Cl1A, respectively). The dication molecule features an additional protonated nitrogen atom (N1A) within the imidazopyridazine moiety, with the associated hydrogen atom (H1A) found to be hydrogen bonded to the equivalent nitrogen atom (N1B) in the monocation (Fig. 3A). H1A was located in the difference map with a strong diffraction peak and refined as an isotropic hydrogen atom, causing a subsequent R1 drop, casting no doubt as to which nitrogen atom is protonated (N1A).
(Table 1) with a structure that is composed of one ponatinib monocation, one ponatinib dication, three chloride anions, and three water molecules in the asymmetric unit (Fig. 2; see Fig. S4† for an overlay of the two ponatinib molecules), which is consistent with the preliminary observations made through TGA and potentiometric titrations. Both the mono- and dications of the ponatinib molecule are protonated on the methyl piperazine nitrogens (N6B and N6A, respectively), each forming a hydrogen bond with the nearby chloride ions (Cl1B and Cl1A, respectively). The dication molecule features an additional protonated nitrogen atom (N1A) within the imidazopyridazine moiety, with the associated hydrogen atom (H1A) found to be hydrogen bonded to the equivalent nitrogen atom (N1B) in the monocation (Fig. 3A). H1A was located in the difference map with a strong diffraction peak and refined as an isotropic hydrogen atom, causing a subsequent R1 drop, casting no doubt as to which nitrogen atom is protonated (N1A).
| CCDC no. | 2302285 | V (Å3) | 2907.9(3) |
| Formula | C58H63Cl3F6N12O5 | Z | 2 |
| Formula weight (g mol−1) | 1228.55 | ρ calc (g cm−3) | 1.403 |
| Crystal system | Triclinic | μ (mm−1) | 0.237 |
| Space group |
P![[1 with combining macron]](https://www.rsc.org/images/entities/char_0031_0304.gif) (no. 2) (no. 2) |
Reflections collected | 97![[thin space (1/6-em)]](https://www.rsc.org/images/entities/char_2009.gif) 752 752 |
| T (K) | 100.0(1) | Independent reflections | 14![[thin space (1/6-em)]](https://www.rsc.org/images/entities/char_2009.gif) 060 (Rint = 0.0692, Rσ = 0.0588) 060 (Rint = 0.0692, Rσ = 0.0588) |
| a (Å) | 12.4408(7) | Restraints/parameters | 0/790 |
| b (Å) | 15.1905(8) | R 1[I > 2σ(I)] | 0.0599 |
| c (Å) | 16.5411(9) | R 1 (all data) | 0.0894 |
| α (°) | 92.864(3) | wR1 (all data) | 0.1724 |
| β (°) | 102.624(3) | GoF on F2 | 1.096 |
| γ (°) | 106.246(3) | Largest diff. peak/hole (e Å−3) | 0.67/−0.40 |
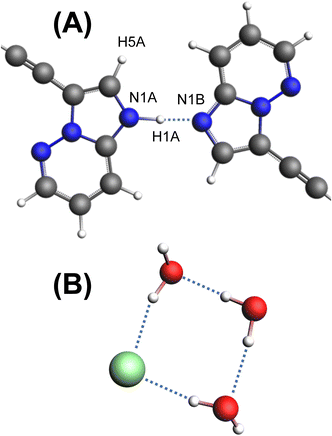 | ||
| Fig. 3 (A) The hydrogen bonding motif of the two imidazopyridazine rings, with atom labels indicated. (B) The hydrogen bonding motif of Cl1 and three H2O molecules. | ||
Unusually, the third chloride ion (Cl1) was not located in the vicinity of hydrogen atoms associated with the positively charged protonated imidazopyridazine, charged amine, or amide moieties. In fact, Cl1 does not form hydrogen bonds with any organic moiety within the ponatinib molecules, with only a weak noncovalent interaction involving the aromatic proton H1AA at r(CH⋯Cl−) = 2.573 Å. However, Cl1 forms hydrogen bonds with two of the H2O molecules, which each hydrogen bond with a third H2O molecule, forming a “square” arrangement (Fig. 3B). The hydrogen atoms of the H2O molecules were added in calculated positions, with the rigid H2O groups oriented as indicated by the difference map peaks. The final electron density difference map gave no indication that any of the three H2O molecules are protonated to form H3O+ ions.
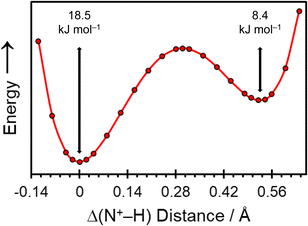
The crystal structure of pon·HCl was subjected to a dispersion-corrected plane-wave DFT geometry optimization in which all atomic positions were refined in a two-step process (vide supra), with the unit cell parameters fixed at their experimental values. All interatomic distances and calculated NMR interaction tensors reported in this work are determined from this refined crystal structure. Additionally, double-hybrid PBE0-2/D3(BJ) DFT calculations were used to confirm the position of H1A by varying its position along the bonding axis of the intermolecular NH+⋯N hydrogen bond (Fig. 4). These calculations indicate a double-well potential energy surface, with an activation barrier of 18.5 kJ mol−1 with respect to the global energy minimum.
3.3. SSNMR spectroscopy
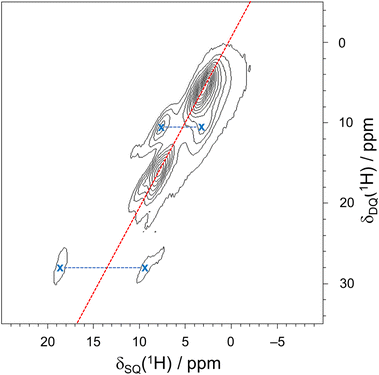
A 1H–1H DQ–SQ spectrum, acquired at 18.8 T with νrot = 50 kHz and one rotor period of BABA recoupling, provides some additional resolution of 1H spectral peaks (Fig. 6). In such an experiment, the 1H–1H homonuclear dipolar coupling is recoupled during the double quantum excitation and reconversion periods, leading to the observation of correlations between spatially proximate 1H spins. Because the recoupling time is short, only the strongly coupled sites appear in the 2D spectrum. Peaks appear along the δDQ = 2δSQ diagonal line when (i) two crystallographically equivalent protons are close enough to produce through-space dipolar correlations or (ii) short-range correlations are observed between two nearby protons with the same chemical shift.122 Correlations between protons with different chemical shifts manifest as pairs of peaks that are equidistant from the diagonal line with a value of δDQ equal to the sum of the two distinct values of δSQ. The spectrum has clear off-diagonal peaks (marked with X) that demonstrate correlations between the well-resolved imidazopyridazine proton (H1A) and its nearest neighbor, H5A (δiso(1H) = 10.6 ppm), which is predicted by DFT calculations to have the highest shift of the remaining protons. Additional off-diagonal peaks suggest correlations involving protons in the charged amine moieties, water molecules, and various species of aliphatic protons; however, clear features are not present that lend further insight into these relationships.
| C Q | η Q | δ iso | Ω | κ | α | β | γ | ||
|---|---|---|---|---|---|---|---|---|---|
| (MHz) | (ppm) | (ppm) | (°) | (°) | (°) | ||||
| a Theoretical EFG and chemical shift tensor parameters were obtained from calculations on XRD-derived structures and structures refined at the RPBE-D2* level. b The experimental uncertainties in the last digit for each value are indicated in parentheses. c The principal components of the EFG tensors are defined such that |V33| ≥ |V22| ≥ |V11|. The quadrupolar coupling constant and asymmetry parameter are given by CQ = eQV33/h, and ηQ = (V11 − V22)/V33, respectively. The sign of CQ cannot be determined from the experimental 35Cl spectra. d The principal components of the chemical shift tensors are defined using the frequency-ordered convention, with δ11 ≥ δ22 ≥ δ33. The isotropic chemical shift, span, and skew are given by δiso = (δ11 + δ22 + δ33)/3, Ω = δ11 − δ33, and κ = 3(δ22 − δiso)/Ω, respectively. e The Euler angles α, β, and γ define the relative orientation of the EFG and chemical shift tensors using the ZY′Z′′ convention for rotation. The experimental angles derived from ssNake (which uses the ZX′Z′′ convention) are adjusted to match the calculated values extracted by EFGShield. f This parameter is not reported since has little effect on the appearance of simulated powder patterns. | |||||||||
| Cl1 | Exp. | 2.21(4) | 0.70(4) | 52(2) | 30(10) | —f | —f | 100(20) | —f |
| DFT-D2* | 2.51 | 0.47 | 84 | 26 | 0.65 | 181 | 80 | 98 | |
| ClA | Exp. | 5.13(6) | 0.40(5) | 25(2) | 80(10) | 0.2(2) | 90(10) | 0(15) | 10(5) |
| DFT-D2* | −4.79 | 0.70 | 42 | 90 | 0.0 | 70 | 7 | 0 | |
| ClB | Exp. | 5.66(6) | 0.71(5) | 70(2) | 70(10) | —f | —f | 0(5) | —f |
| DFT-D2* | −5.85 | 0.61 | 93 | 88 | −0.10 | 98 | 40 | 1 | |
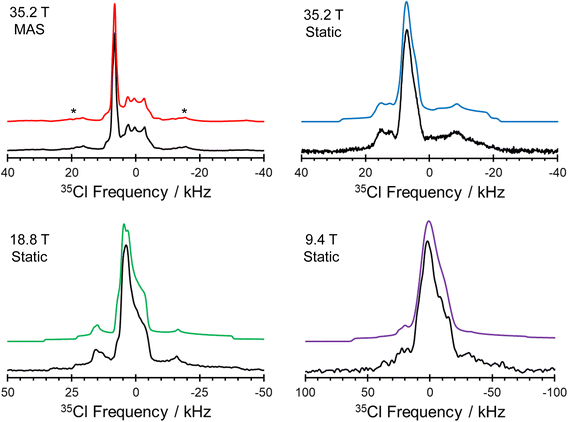
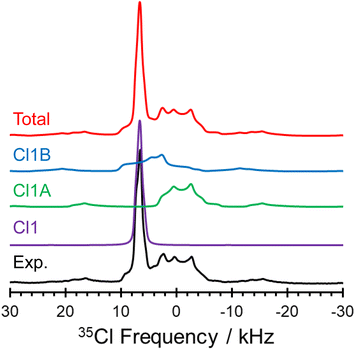
The 1D 35Cl SSNMR spectra indicate the presence of three overlapping patterns, corresponding to the three crystallographically and magnetically distinct chloride ions in the crystal lattice of pon·HCl (see Fig. 8 for a deconvolution of the 35.2 T MAS spectrum and Table 2 for NMR tensor parameters). The three overlapping patterns in the 35Cl SSNMR spectra are readily assigned to their respective crystallographic sites through use of plane-wave DFT calculations due to the substantial differences in the EFG and chemical shift tensors (vide infra). In the 35.2 T MAS spectrum, the three patterns have relative integrated intensities of 1.0![[thin space (1/6-em)]](https://www.rsc.org/images/entities/char_2009.gif) :
:![[thin space (1/6-em)]](https://www.rsc.org/images/entities/char_2009.gif) 1.0
1.0![[thin space (1/6-em)]](https://www.rsc.org/images/entities/char_2009.gif) :
:![[thin space (1/6-em)]](https://www.rsc.org/images/entities/char_2009.gif) 0.9, which is close to the anticipated ratio of 1
0.9, which is close to the anticipated ratio of 1![[thin space (1/6-em)]](https://www.rsc.org/images/entities/char_2009.gif) :
:![[thin space (1/6-em)]](https://www.rsc.org/images/entities/char_2009.gif) 1
1![[thin space (1/6-em)]](https://www.rsc.org/images/entities/char_2009.gif) :
:![[thin space (1/6-em)]](https://www.rsc.org/images/entities/char_2009.gif) 1 (Cl1
1 (Cl1![[thin space (1/6-em)]](https://www.rsc.org/images/entities/char_2009.gif) :
:![[thin space (1/6-em)]](https://www.rsc.org/images/entities/char_2009.gif) Cl1A
Cl1A![[thin space (1/6-em)]](https://www.rsc.org/images/entities/char_2009.gif) :
:![[thin space (1/6-em)]](https://www.rsc.org/images/entities/char_2009.gif) Cl1B). The spectra show no evidence of impurity phases, including the products of disproportionation reactions; this conclusion is further supported by the absence of any sharp peaks in Bloch decay spectra acquired at 9.4 T, using relaxation delays of 1.0 and 8.0 s (Fig. S5†).
Cl1B). The spectra show no evidence of impurity phases, including the products of disproportionation reactions; this conclusion is further supported by the absence of any sharp peaks in Bloch decay spectra acquired at 9.4 T, using relaxation delays of 1.0 and 8.0 s (Fig. S5†).
The comparison of 35Cl static Hahn-echo spectra acquired at 9.4, 18.8, and 35.2 T demonstrates a striking example of the utility of ultra-high field SSNMR for the analysis and structural characterization of APIs with unusual crystal structures and correspondingly complex SSNMR spectra. Only the spectra acquired at 18.8 and 35.2 T have patterns of high enough quality from which EFG and chemical shift tensor parameters could be derived (Fig. 7). In contrast, the spectrum acquired at 9.4 T shows clear evidence of the narrow feature corresponding to the chloride ion Cl1, but only low signal-to-noise features with no apparent discontinuities corresponding to the broader patterns of Cl1A and Cl1B.
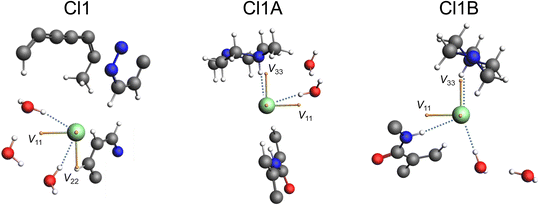
The local environments of chloride ions, especially number, types, and spatial arrangements of H⋯Cl− hydrogen bonds, influence 35Cl EFG tensors, with the strongest effects exerted by those featuring r(H⋯Cl−) of 2.2 Å or less.44–47 Our previous work on qualitatively identifying these relationships is briefly summarized in ESI† S3. The three 35Cl patterns for pon·HCl can be definitively assigned from DFT calculations of the 35Cl chemical shift and EFG tensors on a model of the refined crystal structure (Fig. 9, Table 3). Of the three overlapping patterns evident in the 35Cl spectra, the narrow pattern (CQ = 2.21 MHz; ηQ = 0.70) corresponds to Cl1; this is one of only a handful of examples of a chloride ion in an organic crystalline solid that forms hydrogen bonds exclusively with water molecules to be characterized by 35Cl SSNMR spectroscopy.123 This site features two hydrogen bonds with water molecules at distances of r(H⋯Cl−) = 2.234 and 2.235 Å. DFT calculations demonstrate that the sign of CQ is positive, and V33 is not oriented in the direction of any hydrogen bonding axis and does not appear to be constrained by any obvious symmetry or pseudo-symmetry element. However, V11 and V22 reside approximately within the plane of the three water molecules, indicating positive EFGs within this plane and negative EFGs perpendicular to the plane. The two broader patterns correspond to chloride ions that form hydrogen bonds with both water molecules and the charged tertiary amine moieties, and have correspondingly larger magnitudes of CQ. Cl1A (CQ = 5.16 MHz; ηQ = 0.41) features hydrogen bonds with a charged amine moiety at r(H⋯Cl−) = 2.151 Å and a water molecule at r(H⋯Cl−) = 2.208 Å. Similarly, Cl1B (CQ = 5.66 MHz; ηQ = 0.71) features hydrogen bonds with a water molecule at r(H⋯Cl−) = 2.327 Å, a charged amine moiety at r(H⋯Cl−) = 2.335 Å, and an amide contact at r(H⋯Cl−) = 2.507 Å. For both sites, DFT calculations predict the sign of CQ to be negative, with V33 oriented in the general direction of charged tertiary amine moiety, and approximately perpendicular to the hydrogen bond with the water molecule.
| Chloride site | Contact typea | H⋯Cl− distanceb | X⋯Cl− distancec | X–H⋯Cl− angled |
|---|---|---|---|---|
| (Å) | (Å) | (°) | ||
| a Indicates the functional group contributing to the H⋯Cl− contacts (i.e., HOH⋯Cl− signifies a water contact, RR′R′′NH+⋯Cl− signifies a charged tertiary amine contact, and CH⋯Cl− signifies an aromatic contact). b The shortest H⋯Cl− hydrogen bonds (<2.6 Å, X = N, O) as determined via energy minimization and geometry optimization with DFT plane wave calculations. c Distance between the chloride ion and the hydrogen-bond donor atom (X = N, O). d Angle between the hydrogen-bond donor atom (X = N, O), the hydrogen atom, and the chloride atom. | ||||
| Cl1 | HOH⋯Cl− | 2.234 | 3.142 | 164.4 |
| HOH⋯Cl− | 2.235 | 3.152 | 167.6 | |
| CH⋯Cl− | 2.574 | 3.548 | 148.3 | |
| Cl1A | RR′R′′NH+⋯Cl− | 2.151 | 3.124 | 166.4 |
| HOH⋯Cl− | 2.208 | 3.122 | 165.9 | |
| Cl1B | HOH⋯Cl− | 2.327 | 3.255 | 177.3 |
| RR′R′′NH+⋯Cl− | 2.335 | 3.228 | 150.8 | |
| RR'NH⋯Cl− | 2.507 | 3.452 | 166.3 | |
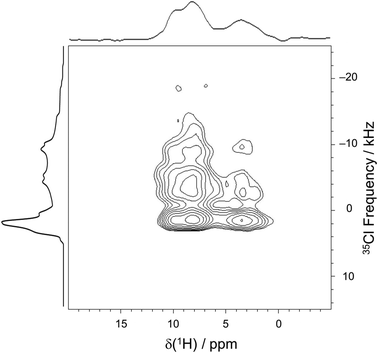
In order to confirm the assignment of the chloride ions and their proximities with neighboring protons, a 2D 35Cl → 1H D-RINEPT spectrum was acquired with a spinning speed of νrot = 50 kHz and five rotor periods of SR412 recoupling (Fig. 10). Similar to the 1D 35Cl MAS spectrum acquired at 35.2 T, the f1 projection (i.e., the 35Cl dimension) of the 2D D-RINEPT spectrum has an overall appearance that results from three overlapping 35Cl patterns, corresponding to the three crystallographically distinct chloride ions. The f2 projection (i.e., the 1H dimension) features three groupings of peaks, resulting in a spectrum with more detail than observed in the 1D 1H MAS spectrum. The 2D D-RINEPT spectrum features several cross peaks that result from dipolar interactions between the chloride ions and nearby protons. For instance, the strong peaks that occur at δiso(1H) = 8.5 ppm for a broad range of 35Cl frequencies are indicative of interactions between Cl1A and Cl1B and the hydrogen-bond donating charged tertiary amine moieties (H6A and H6B, respectively). The cross peak at δiso(1H) = 3.8 ppm likely corresponds to water molecules that form hydrogen bonds with each of the chloride ion sites. Finally, the peak at δiso(1H) = 9.9 ppm, which corresponds to the aromatic proton H1AA, has a cross peak indicating correlation to Cl1; this is in accordance with the crystal structure, where r(H1AA⋯Cl1−) = 2.507 Å.
4. Conclusion
The structure of a novel ionic cocrystal of ponatinib hydrochloride was determined by single crystal X-ray diffraction, and further characterized by SSNMR and DFT methods. The crystal structure contains both ponatinib monocations and dications, along with three chloride ions and three water molecules. The use of a variety of solid-state analytical techniques, including SCXRD and SSNMR in the present case, can uncover the nature of the noncovalent bonding interactions between the API molecules and other molecular or ionic components that constitute this multicomponent crystal, providing a detailed understanding of the key hydrogen bonds that serve to stabilize the structure.SSNMR spectroscopy is invaluable for confirming the unusual crystal structure of pon·HCl. 1D 35Cl spectra obtained at multiple fields confirm the presence of three distinct chloride ions, which were assigned using plane-wave DFT calculations of their respective 35Cl EFG and chemical shift tensors. The 2D 35Cl → 1H D-RINEPT spectrum confirms the spatial proximities between all three chloride ions and water molecules, amine protons, and even an aromatic proton. The 1H → 13C{1H} CP/MAS NMR spectrum confirms the presence of two crystallographically distinct ponatinib molecules in the asymmetric unit. 1D 1H and 2D 1H–1H DQ–SQ spectra identify an unusually deshielded 1H peak, which is assigned to the imidazopyridazine moiety that forms an intermolecular hydrogen bond from the ponatinib dication to the monocation. This all suggests future applications of multinuclear SSNMR spectroscopy at high and ultra-high fields to the study of complex HCl API materials for which SCXRD data is unavailable, including those exhibiting complex 1H, 13C, and/or 35Cl SSNMR spectra with overlapping patterns, with low wt% chlorine, and comprising heterogeneous mixtures or amorphous solid dispersions.
Conflicts of interest
There are no conflicts to declare.Acknowledgements
The authors thank the Florida State University and the National High Magnetic Field Laboratory for funding this research (materials, computers, spectrometer time, and NMR hardware). In addition, R. W. S and S. T. H. thank the U.S. Department of Energy, Office of Science, Office of Basic Energy Sciences, under Award Number DE-SC0022310, for support of personnel involved in this work. The National High Magnetic Field Laboratory is supported by the National Science Foundation through NSF/DMR-1644779 and NSF/DMR-2128556, and the State of Florida. The Development of the 36 T Series-Connected Hybrid magnet and NMR instrumentation was supported by NSF (DMR-1039938 and DMR-0603042) and NIH (GM122698 and GM148766). The authors acknowledge the use of the MAX Diffraction Facility, McMaster University. The authors also thank the Natural Sciences and Engineering Research Council of Canada (NSERC Discovery grant 2016-06642), the Canadian Foundation for Innovation, the Ontario Innovation Trust, the Ontario Research Fund, and the University of Windsor for supporting the initial stages of this project.References
- S. Datta and D. J. W. Grant, Crystal structures of drugs: advances in determination, prediction and engineering, Nat. Rev. Drug Discovery, 2004, 3, 42–57 CrossRef CAS PubMed.
- A. M. Healy, Z. A. Worku, D. Kumar and A. M. Madi, Pharmaceutical solvates, hydrates and amorphous forms: a special emphasis on cocrystals, Adv. Drug Delivery Rev., 2017, 117, 25–46 CrossRef CAS PubMed.
- E. Pindelska, A. Sokal and W. Kolodziejski, Pharmaceutical cocrystals, salts and polymorphs: advanced characterization techniques, Adv. Drug Delivery Rev., 2017, 117, 111–146 CrossRef CAS PubMed.
- G. P. Stahly, Diversity in single- and multiple-component crystals. the search for and prevalence of polymorphs and cocrystals, Cryst. Growth Des., 2007, 7, 1007–1026 CrossRef CAS.
- N. K. Duggirala, M. L. Perry, Ö. Almarsson and M. J. Zaworotko, Pharmaceutical cocrystals: along the path to improved medicines, Chem. Commun., 2016, 52, 640–655 RSC.
- A. T. M. Serajuddin, Salt formation to improve drug solubility, Adv. Drug Delivery Rev., 2007, 59, 603–616 CrossRef CAS PubMed.
- S. R. Byrn, R. R. Pfeiffer, G. Stephenson, D. J. W. Grant and W. B. Gleason, Solid-state pharmaceutical chemistry, Chem. Mater., 1994, 6, 1148–1158 CrossRef CAS.
- D. E. Bugay, Characterization of the solid-state: spectroscopic techniques, Adv. Drug Delivery Rev., 2001, 48, 43–65 CrossRef CAS PubMed.
- S. L. Childs, G. P. Stahly and A. Park, The salt−cocrystal continuum: the influence of crystal structure on ionization state, Mol. Pharmaceutics, 2007, 4, 323–338 CrossRef CAS PubMed.
- P. Stainton, E. Nauha, T. Grecu, J. F. McCabe, T. Munshi, I. Scowen, H. C. S. Chan, S. Nilsson and N. Blagden, Chameleon behavior of a new salt of 3-(aminocarbonyl) pyridinium malonate and implications for polymorphism on the salt/cocrystal continuum, Cryst. Growth Des., 2022, 22, 1665–1679 CrossRef CAS.
- A. O. F. Jones, N. Blagden, G. J. McIntyre, A. Parkin, C. C. Seaton, L. H. Thomas and C. C. Wilson, Tuning proton disorder in 3,5-dinitrobenzoic acid dimers: the effect of local environment, Cryst. Growth Des., 2013, 13, 497–509 CrossRef CAS.
- S. Aitipamula, R. Banerjee, A. K. Bansal, K. Biradha, M. L. Cheney, A. R. Choudhury, G. R. Desiraju, A. G. Dikundwar, R. Dubey and N. Duggirala, et al., Polymorphs, salts, and cocrystals: what's in a name?, Cryst. Growth Des., 2012, 12, 2147–2152 CrossRef CAS.
- W. T. A. Harrison, H. S. Yathirajan, S. Bindya, H. G. Anilkumar and Devaraju, Escitalopram oxalate: co-existence of oxalate dianions and oxalic acid molecules in the same crystal, Acta Crystallogr., Sect. C: Cryst. Struct. Commun., 2007, 63, o129–o131 CrossRef CAS PubMed.
- C. Wang, T. D. Turner, C. Y. Ma, C. M. Pask, I. Rosbottom, R. S. Hong, A. Y. Sheikh, Q. Yin and K. J. Roberts, A quaternary solid-form of ritonavir: an oxalate salt oxalic acid co-crystal acetone solvate, CrystEngComm, 2023, 25, 1782–1791 RSC.
- M. Pop, P. Sieger and P. W. Cains, Tiotropium fumarate: an interesting pharmaceutical co-crystal, J. Pharm. Sci., 2009, 98, 1820–1834 CrossRef CAS PubMed.
- M. Li, W. Xu and Y. Su, Solid-state NMR spectroscopy in pharmaceutical sciences, TrAC, Trends Anal. Chem., 2021, 135, 116152 CrossRef CAS.
- R. K. Harris, NMR studies of organic polymorphs & solvates, Analyst, 2006, 131, 351–373 RSC.
- R. T. Berendt, D. M. Sperger, E. J. Munson and P. K. Isbester, Solid-state NMR spectroscopy in pharmaceutical research and analysis, TrAC, Trends Anal. Chem., 2006, 25, 977–984 CrossRef CAS.
- M. Geppi, G. Mollica, S. Borsacchi and C. A. Veracini, Solid-state NMR studies of pharmaceutical systems, Appl. Spectrosc. Rev., 2008, 43, 202–302 CrossRef CAS.
- F. G. Vogt, Evolution of solid-state NMR in pharmaceutical analysis, Future Med. Chem., 2010, 2, 915–921 CrossRef CAS PubMed.
- F. G. Vogt, Solid-State NMR in Drug Discovery and Development, in New Applications of NMR in Drug Discovery and Development, The Royal Society of Chemistry, 2013, pp. 43–100 Search PubMed.
- D. Massiot, F. Fayon, M. Capron, I. King, S. Le Calvé, B. Alonso, J.-O. Durand, B. Bujoli, Z. Gan and G. Hoatson, Modelling one- and two-dimensional solid-state NMR spectra, Magn. Reson. Chem., 2002, 40, 70–76 CrossRef CAS.
- J. K. Harper and D. M. Grant, Enhancing crystal-structure prediction with NMR tensor data, Cryst. Growth Des., 2006, 6, 2315–2321 CrossRef CAS.
- J. K. Harper, J. A. Doebbler, E. Jacques, D. M. Grant and R. B. Von Dreele, A combined solid-state NMR and synchrotron X-ray diffraction powder study on the structure of the antioxidant (+)-catechin 4.5-hydrate, J. Am. Chem. Soc., 2010, 132, 2928–2937 CrossRef CAS PubMed.
- J. K. Harper, D. M. Grant, Y. Zhang, P. L. Lee and R. Von Dreele, Characterizing challenging microcrystalline solids with solid-state NMR shift tensor and synchrotron X-ray powder diffraction data: structural analysis of ambuic acid, J. Am. Chem. Soc., 2006, 128, 1547–1552 CrossRef CAS PubMed.
- J. K. Harper, D. H. Barich, E. M. Heider, D. M. Grant, R. R. Franke, J. H. Johnson, Y. Zhang, P. L. Lee, R. B. Von Dreele and B. Scott, et al., A combined solid-state NMR and X-ray powder diffraction study of a stable polymorph of paclitaxel, Cryst. Growth Des., 2005, 5, 1737–1742 CrossRef CAS.
- C. J. H. Smalley, H. E. Hoskyns, C. E. Hughes, D. N. Johnstone, T. Willhammar, M. T. Young, C. J. Pickard, A. J. Logsdail, P. A. Midgley and K. D. M. Harris, A structure determination protocol based on combined analysis of 3D-ED data, powder XRD data, solid-state NMR data and DFT-D calculations reveals the structure of a new polymorph of l-tyrosine, Chem. Sci., 2022, 13, 5277–5288 RSC.
- C. E. Hughes, G. N. M. Reddy, S. Masiero, S. P. Brown, P. A. Williams and K. D. M. Harris, Determination of a complex crystal structure in the absence of single crystals: analysis of powder X-ray diffraction data, guided by solid-state NMR and periodic DFT calculations, reveals a new 2′-deoxyguanosine structural motif, Chem. Sci., 2017, 8, 3971–3979 RSC.
- A. E. Watts, K. Maruyoshi, C. E. Hughes, S. P. Brown and K. D. M. Harris, Combining the advantages of powder X-ray diffraction and NMR crystallography in structure determination of the pharmaceutical material cimetidine hydrochloride, Cryst. Growth Des., 2016, 16, 1798–1804 CrossRef CAS.
- E. Salager, R. S. Stein, C. J. Pickard, B. Elena and L. Emsley, Powder NMR crystallography of thymol, Phys. Chem. Chem. Phys., 2009, 11, 2610–2621 RSC.
- E. Salager, G. M. Day, R. S. Stein, C. J. Pickard, B. Elena and L. Emsley, Powder crystallography by combined crystal structure prediction and high-resolution 1H solid-state NMR spectroscopy, J. Am. Chem. Soc., 2010, 132, 2564–2566 CrossRef CAS PubMed.
- M. Baias, J.-N. Dumez, P. H. Svensson, S. Schantz, G. M. Day and L. Emsley, De novo determination of the crystal structure of a large drug molecule by crystal structure prediction-based powder NMR crystallography, J. Am. Chem. Soc., 2013, 135, 17501–17507 CrossRef CAS PubMed.
- E. A. Engel, A. Anelli, A. Hofstetter, F. Paruzzo, L. Emsley and M. Ceriotti, A Bayesian approach to NMR crystal structure determination, Phys. Chem. Chem. Phys., 2019, 21, 23385–23400 RSC.
- M. Balodis, M. Cordova, A. Hofstetter, G. M. Day and L. Emsley, De novo crystal structure determination from machine learned chemical shifts, J. Am. Chem. Soc., 2022, 144, 7215–7223 CrossRef CAS PubMed.
- A. S. Tatton, H. Blade, S. P. Brown, P. Hodgkinson, L. P. Hughes, S. O. N. Lill and J. R. Yates, Improving confidence in crystal structure solutions using NMR crystallography: the case of β-piroxicam, Cryst. Growth Des., 2018, 18, 3339–3351 CrossRef CAS.
- S. T. Holmes, W. D. Wang, G. Hou, C. Dybowski, W. Wang and S. Bai, A new NMR crystallographic approach to reveal the calcium local structure of atorvastatin calcium, Phys. Chem. Chem. Phys., 2019, 21, 6319–6326 RSC.
- N. Variankaval, R. Wenslow, J. Murry, R. Hartman, R. Helmy, E. Kwong, S.-D. Clas, C. Dalton and I. Santos, Preparation and solid-state characterization of nonstoichiometric cocrystals of a phosphodiesterase-IV inhibitor and L-tartaric acid, Cryst. Growth Des., 2006, 6, 690–700 CrossRef CAS.
- S. T. Holmes, O. G. Engl, M. N. Srnec, J. D. Madura, R. Quiñones, J. K. Harper, R. W. Schurko and R. J. Iuliucci, Chemical shift tensors of cimetidine form A modeled with density functional theory calculations: implications for NMR crystallography, J. Phys. Chem. A, 2020, 124, 3109–3119 CrossRef CAS PubMed.
- M. Dudek, P. Paluch and E. Pindelska, Crystal structures of two furazidin polymorphs revealed by a joint effort of crystal structure prediction and NMR crystallography, Acta Crystallogr., Sect. B: Struct. Sci., Cryst. Eng. Mater., 2020, 76, 322–335 CrossRef CAS PubMed.
- W. D. Wang, X. Gao, M. Strohmeier, W. Wang, S. Bai and C. Dybowski, Solid-state NMR studies of form I of atorvastatin calcium, J. Phys. Chem. B, 2012, 116, 3641–3649 CrossRef CAS PubMed.
- J. K. Harper, R. Iuliucci, M. Gruber and K. Kalakewich, Refining crystal structures with experimental 13C NMR shift tensors and lattice-including electronic structure methods, CrystEngComm, 2013, 15, 8693–8704 RSC.
- S. P. Brown, Applications of high-resolution 1H solid-state NMR, Solid State Nucl. Magn. Reson., 2012, 41, 1–27 CrossRef CAS PubMed.
- G. S. Paulekuhn, J. B. Dressman and C. Saal, Trends in active pharmaceutical ingredient salt selection based on analysis of the orange book database, J. Med. Chem., 2007, 50, 6665–6672 CrossRef CAS PubMed.
- H. Hamaed, J. M. Pawlowski, B. F. T. Cooper, R. Fu, S. H. Eichhorn and R. W. Schurko, Application of solid-state 35Cl NMR to the structural characterization of hydrochloride pharmaceuticals and their polymorphs, J. Am. Chem. Soc., 2008, 130, 11056–11065 CrossRef CAS PubMed.
- M. Hildebrand, H. Hamaed, A. M. Namespetra, J. M. Donohue, R. Fu, I. Hung, Z. Gan and R. W. Schurko, 35Cl solid-state NMR of HCl salts of active pharmaceutical ingredients: structural prediction, spectral fingerprinting and polymorph recognition, CrystEngComm, 2014, 16, 7334–7356 RSC.
- S. T. Holmes, J. M. Hook and R. W. Schurko, Nutraceuticals in bulk and dosage forms: analysis by 35Cl and 14N solid-state NMR and DFT calculations, Mol. Pharmaceutics, 2022, 19, 440–455 CrossRef CAS PubMed.
- A. A. Peach, D. A. Hirsh, S. T. Holmes and R. W. Schurko, Mechanochemical syntheses and 35Cl solid-state NMR characterization of fluoxetine HCl cocrystals, CrystEngComm, 2018, 20, 2780–2792 RSC.
- A. M. Namespetra, D. A. Hirsh, M. P. Hildebrand, A. R. Sandre, H. Hamaed, J. M. Rawson and R. W. Schurko, 35Cl solid-state NMR spectroscopy of HCl pharmaceuticals and their polymorphs in bulk and dosage forms, CrystEngComm, 2016, 18, 6213–6232 RSC.
- S. T. Holmes, C. S. Vojvodin, N. Veinberg, E. M. Iacobelli, D. A. Hirsh and R. W. Schurko, Hydrates of active pharmaceutical ingredients: A 35Cl and 2H solid-state NMR and DFT study, Solid State Nucl. Magn. Reson., 2022, 122, 101837 CrossRef CAS PubMed.
- A. A. Peach, S. T. Holmes, L. R. MacGillivray and R. W. Schurko, The formation and stability of fluoxetine HCl cocrystals investigated by multicomponent milling, CrystEngComm, 2023, 25, 213–224 RSC.
- D. A. Hirsh, A. J. Rossini, L. Emsley and R. W. Schurko, 35Cl dynamic nuclear polarization solid-state NMR of active pharmaceutical ingredients, Phys. Chem. Chem. Phys., 2016, 18, 25893–25904 RSC.
- L. M. Abdulla, A. A. Peach, S. T. Holmes, Z. T. Dowdell, L. K. Watanabe, E. M. Iacobelli, D. A. Hirsh, J. M. Rawson and R. W. Schurko, Synthesis and characterization of xylazine hydrochloride polymorphs, hydrates, and focrystals: a 35Cl solid-state NMR and DFT study, Cryst. Growth Des., 2023, 23, 3412–3426 CrossRef CAS.
- C. S. Vojvodin, S. T. Holmes, L. K. Watanabe, J. M. Rawson and R. W. Schurko, Multi-component crystals containing urea: mechanochemical synthesis and characterization by 35Cl solid-state NMR spectroscopy and DFT calculations, CrystEngComm, 2022, 24, 2626–2641 RSC.
- F. G. Vogt, G. R. Williams, M. Strohmeier, M. N. Johnson and R. C. B. Copley, Solid-state NMR analysis of a complex crystalline phase of ronacaleret hydrochloride, J. Phys. Chem. B, 2014, 118, 10266–10284 CrossRef CAS PubMed.
- F. G. Vogt, G. R. Williams and R. C. B. Copley, Solid-state NMR analysis of a boron-containing pharmaceutical hydrochloride salt, J. Pharm. Sci., 2013, 102, 3705–3716 CrossRef CAS PubMed.
- D. A. Hirsh, Y. Su, H. Nie, W. Xu, D. Stueber, N. Variankaval and R. W. Schurko, Quantifying disproportionation in pharmaceutical formulations with 35Cl solid-state NMR, Mol. Pharmaceutics, 2018, 15, 4038–4048 CrossRef CAS PubMed.
- D. A. Hirsh, S. T. Holmes, P. Chakravarty, A. A. Peach, A. G. DiPasquale, K. Nagapudi and R. W. Schurko, In situ characterization of waters of hydration in a variable-hydrate active pharmaceutical ingredient using 35Cl solid-state NMR and X-ray diffraction, Cryst. Growth Des., 2019, 19, 7349–7362 CrossRef CAS.
- P. M. J. Szell, Z. Rehman, B. P. Tatman, L. P. Hughes, H. Blade and S. P. Brown, Exploring the potential of multinuclear solid-state 1H, 13C, and 35Cl magnetic resonance to characterize static and dynamic disorder in pharmaceutical hydrochlorides, ChemPhysChem, 2023, 24, e202200946 CrossRef.
- M. K. Pandey, H. Kato, Y. Ishii and Y. Nishiyama, Two-dimensional proton-detected 35Cl/1H correlation solid-state NMR experiment under fast magic angle sample spinning: application to pharmaceutical compounds, Phys. Chem. Chem. Phys., 2016, 18, 6209–6216 RSC.
- A. Venkatesh, M. P. Hanrahan and A. J. Rossini, Proton detection of MAS solid-state NMR spectra of half-integer quadrupolar nuclei, Solid State Nucl. Magn. Reson., 2017, 84, 171–181 CrossRef CAS PubMed.
- A. V. Wijesekara, A. Venkatesh, B. J. Lampkin, B. VanVeller, J. W. Lubach, K. Nagapudi, I. Hung, P. L. Gor'kov, Z. Gan and A. J. Rossini, Fast acquisition of proton-detected HETCOR solid-state NMR spectra of quadrupolar nuclei and rapid measurement of NH bond lengths by frequency selective HMQC and RESPDOR pulse sequences, Chem. – Eur. J., 2020, 26, 7881–7888 CrossRef CAS PubMed.
- D. Iuga, E. K. Corlett and S. P. Brown, 35Cl-1H heteronuclear correlation MAS NMR experiments for probing pharmaceutical salts, Magn. Reson. Chem., 2021, 59, 1089–1100 CrossRef CAS PubMed.
- I. Hung and Z. Gan, Satellite-transition double cross-polarization HETCOR under fast MAS, J. Magn. Reson., 2023, 348, 107380 CrossRef CAS PubMed.
- L. Frydman and J. S. Harwood, Isotropic spectra of half-integer quadrupolar spins from bidimensional magic-angle spinning NMR, J. Am. Chem. Soc., 1995, 117, 5367–5368 CrossRef CAS.
- A. Medek, J. S. Harwood and L. Frydman, Multiple-quantum magic-angle spinning NMR: a new method for the study of quadrupolar nuclei in solids, J. Am. Chem. Soc., 1995, 117, 12779–12787 CrossRef CAS.
- I. Hung and Z. Gan, Pushing the limit of MQMAS for low-γ quadrupolar nuclei in pharmaceutical hydrochlorides, J. Magn. Reson., 2023, 107423 CrossRef CAS PubMed.
- W.-S. Huang, C. A. Metcalf, R. Sundaramoorthi, Y. Wang, D. Zou, R. M. Thomas, X. Zhu, L. Cai, D. Wen and S. Liu, et al., Discovery of 3-[2-(omidazo[1,2-b]pyridazin-3-yl)ethynyl]-4-methyl-N-{4-[(4-methylpiperazin-1-yl)methyl]-3-(trifluoromethyl)phenyl}benzamide (AP24534), a potent, orally active pan-inhibitor of breakpoint cluster region-Abelson (BCR-ABL) kinase including the T315I gatekeeper mutant, J. Med. Chem., 2010, 53, 4701–4719 CrossRef CAS PubMed.
- T. O'Hare, W. C. Shakespeare, X. Zhu, C. A. Eide, V. M. Rivera, F. Wang, L. T. Adrian, T. Zhou, W.-S. Huang and Q. Xu, et al., AP24534, a pan-BCR-ABL inhibitor for chronic myeloid leukemia, potently inhibits the T315I mutant and overcomes mutation-based resistance, Cancer Cell, 2009, 16, 401–412 CrossRef PubMed.
- M. Stefinovic, H. Reece and A. Sunkara, Crystalline forms of ponatinib hydrochloride, WO/2015/001098, 2015.
- C. K. Murray, L. W. Rozamus, J. J. Chaber and P. Sharma, Crystalline forms of 3-(imidazo[1,2-B] pyridazin-3-ylethynyl)-4-methyl-N-{4-[(4-methylpiperazin-1-yl) methyl]-3-(trifluoromethyl)phenyl}benzamide and its mono hydrochloride salt, WO/2014/093579, 2014.
- V. Kiss, E. Tieger, L. Ridvan, M. Tkadlecova, O. Dammer and L. Krejcik, Modification of 3-(imidazo[1,2-B] pyridazin-3-ylethynyl)-4-methyl-N-(4-[(4-methylpiperazin-1-yl) methyl]-3-(trifluoromethyl)phenyl) benzamide hydrochloride salt, WO/2015/085973, 2015.
- J. H. Lipton, C. Chuah, A. Guerci-Bresler, G. Rosti, D. Simpson, S. Assouline, G. Etienne, F. E. Nicolini, P. le Coutre and R. E. Clark, et al., Ponatinib versus imatinib for newly diagnosed chronic myeloid leukaemia: an international, randomised, open-label, phase 3 trial, Lancet, 2016, 17, P612–P621 CrossRef PubMed.
- F. H. Tan, T. L. Putoczki, S. S. Stylli and R. B. Luwor, Ponatinib: a novel multi-tyrosine kinase inhibitor against human malignancies, OncoTargets Ther., 2019, 12, 635–645 CrossRef CAS PubMed.
- Experts in Chronic Myeloid Leukemia, The price of drugs for chronic myeloid leukemia (CML) is a reflection of the unsustainable prices of cancer drugs: from the perspective of a large group of CML experts, Blood, 2013, 121, 4439–4442 CrossRef PubMed.
- F. E. S. Souza, B. Khalili, K. A. Rantanen, J. L. Gerster, A. Bhattacharyya, B. Gorin and A. W. Rey, Crystalline forms of ponatinib hydrochloride, US11072620B2, 2018.
- O. V. Dolomanov, L. J. Bourhis, R. J. Gildea, J. A. K. Howard and H. Puschmann, OLEX2: a complete structure solution, refinement and analysis program, J. Appl. Crystallogr., 2009, 42, 339–341 CrossRef CAS.
- G. M. Sheldrick, SHELXT - integrated space-group and crystal-structure determination, Acta Crystallogr., Sect. A: Found. Adv., 2015, 71, 3–8 CrossRef PubMed.
- G. M. Sheldrick, A short history of SHELX, Acta Crystallogr., Sect. A: Found. Crystallogr., 2008, 64, 112–122 CrossRef CAS PubMed.
- Z. Gan, I. Hung, X. Wang, J. Paulino, G. Wu, I. M. Litvak, P. L. Gor'kov, W. W. Brey, P. Lendi and J. L. Schiano, et al., NMR spectroscopy up to 35.2 T using a series-connected hybrid magnet, J. Magn. Reson., 2017, 284, 125–136 CrossRef CAS PubMed.
- S. G. J. van Meerten, W. M. J. Franssen and A. P. M. Kentgens, ssNake: a cross-platform open-source NMR data processing and fitting application, J. Magn. Reson., 2019, 301, 56–66 CrossRef CAS PubMed.
- A. Pines, J. S. Waugh and M. G. Gibby, Proton-enhanced nuclear induction spectroscopy. 13C chemical shielding anisotropy in some organic solids, Chem. Phys. Lett., 1972, 15, 373–376 CrossRef CAS.
- J. Schaefer and E. O. Stejskal, Carbon-13 nuclear magnetic resonance of polymers spinning at the magic angle, J. Am. Chem. Soc., 1976, 98, 1031–1032 CrossRef CAS.
- O. B. Peersen, X. L. Wu, I. Kustanovich and S. O. Smith, Variable-amplitude cross-polarization MAS NMR, J. Magn. Reson., Ser. A, 1993, 104, 334–339 CrossRef CAS.
- G. Metz, X. L. Wu and S. O. Smith, Ramped-amplitude pross Polarization in magic-angle-spinning NMR, J. Magn. Reson., Ser. A, 1994, 110, 219–227 CrossRef CAS.
- B. M. Fung, A. K. Khitrin and K. Ermolaev, An improved broadband decoupling sequence for liquid crystals and solids, J. Magn. Reson., 2000, 142, 97–101 CrossRef CAS PubMed.
- S. R. Hartmann and E. L. Hahn, Nuclear double resonance in the rotating frame, Phys. Rev., 1962, 128, 2042–2053 CrossRef CAS.
- R. E. Taylor, Setting up 13C CP/MAS experiments, Concepts Magn. Reson., Part A, 2004, 22, 37–49 CrossRef.
- W. Sommer, J. Gottwald, D. E. Demco and H. W. Spiess, Dipolar heteronuclear multiple-quantum NMR spectroscopy in rotating solids, J. Magn. Reson., 1995, 113, 131–134 CrossRef CAS.
- I. Schnell, A. Lupulescu, S. Hafner, D. E. Demco and H. W. Spiess, Resolution enhancement in multiple-quantum MAS NMR spectroscopy, J. Magn. Reson., 1998, 133, 61–69 CrossRef CAS PubMed.
- J. Trebosc, B. Hu, J. P. Amoureux and Z. Gan, Through-space R3-HETCOR experiments between spin-1/2 and half-integer quadrupolar nuclei in solid-state NMR, J. Magn. Reson., 2007, 186, 220–227 CrossRef CAS PubMed.
- A. Brinkmann and A. P. M. Kentgens, Proton-selective 17O−1H distance measurements in fast magic-angle-spinning solid-state NMR spectroscopy for the determination of hydrogen bond lengths, J. Am. Chem. Soc., 2006, 128, 14758–14759 CrossRef CAS PubMed.
- Z. Gan, Rotary resonance echo double resonance for measuring heteronuclear dipolar coupling under MAS, J. Magn. Reson., 2006, 183, 235–241 CrossRef CAS PubMed.
- M. Goswami and P. K. Madhu, Sensitivity enhancement of the central-transition signal of half-integer spin quadrupolar nuclei in solid-state NMR: Features of multiple fast amplitude-modulated pulse transfer, J. Magn. Reson., 2008, 192, 230–234 CrossRef CAS PubMed.
- H.-T. Kwak, S. Prasad, T. Clark and P. J. Grandinetti, Enhancing sensitivity of quadrupolar nuclei in solid-state NMR with multiple rotor assisted population transfers, Solid State Nucl. Magn. Reson., 2003, 24, 71–77 CrossRef CAS PubMed.
- S. J. Clark, M. D. Segall, C. J. Pickard, P. J. Hasnip, M. J. Probert, K. Refson and M. C. Payne, First principles methods using CASTEP, Z. Kristallogr., 2005, 220, 567–570 CAS.
- B. Hammer, L. B. Hansen and J. K. Nørskov, Improved adsorption energetics within density-functional theory using revised Perdew-Burke-Ernzerhof functionals, Phys. Rev. B: Condens. Matter Mater. Phys., 1999, 59, 7413–7421 CrossRef.
- J. R. Yates, C. J. Pickard and F. Mauri, Calculation of NMR chemical shifts for extended systems using ultrasoft pseudopotentials, Phys. Rev. B, 2007, 76, 024401 CrossRef.
- H. J. Monkhorst and J. D. Pack, Special points for Brillouin-zone integrations, Phys. Rev. B, 1976, 13, 5188–5192 CrossRef.
- B. G. Pfrommer, M. Côté, S. G. Louie and M. L. Cohen, Relaxation of crystals with the quasi-Newton method, J. Comput. Phys., 1997, 131, 233–240 CrossRef CAS.
- S. Grimme, Semiempirical GGA-type density functional constructed with a long-range dispersion correction, J. Comput. Chem., 2006, 27, 1787–1799 CrossRef CAS PubMed.
- E. R. McNellis, J. Meyer and K. Reuter, Azobenzene at coinage metal surfaces: role of dispersive van der Waals interactions, Phys. Rev. B, 2009, 80, 205414 CrossRef.
- S. T. Holmes, R. J. Iuliucci, K. T. Mueller and C. Dybowski, Semi-empirical refinements of crystal structures using 17O quadrupolar-coupling tensors, J. Chem. Phys., 2017, 146, 064201 CrossRef PubMed.
- S. T. Holmes and R. W. Schurko, Refining crystal structures with quadrupolar NMR and dispersion-corrected density functional theory, J. Phys. Chem. C, 2018, 122, 1809–1820 CrossRef CAS.
- S. T. Holmes, C. S. Vojvodin and R. W. Schurko, Dispersion-corrected DFT methods for applications in nuclear magnetic resonance crystallography, J. Phys. Chem. A, 2020, 124, 10312–10323 CrossRef CAS PubMed.
- J.-D. Chai and S.-P. Mao, Seeking for reliable double-hybrid density functionals without fitting parameters: The PBE0-2 functional, Chem. Phys. Lett., 2012, 538, 121–125 CrossRef CAS.
- S. Grimme, S. Ehrlich and L. Goerigk, Effect of the damping function in dispersion corrected density functional theory, J. Comput. Chem., 2011, 32, 1456–1465 CrossRef CAS PubMed.
- L. Goerigk and S. Grimme, Double-hybrid density functionals, WIREs Comput. Mol. Sci., 2014, 4, 576–600 CrossRef CAS.
- A. D. Becke, A multicenter numerical integration scheme for polyatomic molecules, J. Chem. Phys., 1988, 88, 2547–2553 CrossRef CAS.
- M. Franchini, P. H. T. Philipsen and L. Visscher, The Becke fuzzy cells integration scheme in the Amsterdam Density Functional program suite, J. Comput. Chem., 2013, 34, 1819–1827 CrossRef CAS PubMed.
- C. J. Pickard and F. Mauri, All-electron magnetic response with pseudopotentials: NMR chemical shifts, Phys. Rev. B, 2001, 63, 245101 CrossRef.
- R. Ditchfield, Self-consistent perturbation theory of diamagnetism, Mol. Phys., 1974, 27, 789–807 CrossRef CAS.
- K. Wolinski, J. F. Hinton and P. Pulay, Efficient implementation of the gauge-independent atomic orbital method for NMR chemical shift calculations, J. Am. Chem. Soc., 1990, 112, 8251–8260 CrossRef CAS.
- A. Rodriguez-Fortea, P. Alemany and T. Ziegler, Density functional calculations of NMR chemical chifts with the inclusion of spin−orbit coupling in tungsten and lead compounds, J. Phys. Chem. A, 1999, 103, 8288–8294 CrossRef CAS.
- M. Krykunov, T. Ziegler and E. van Lenthe, Implementation of a hybrid DFT method for calculating NMR shieldings using Slater-type orbitals with spin−orbital coupling included. applications to 187Os, 195Pt, and 13C in geavy-metal complexes, J. Phys. Chem. A, 2009, 113, 11495–11500 CrossRef CAS PubMed.
- M. Krykunov, T. Ziegler and E. V. Lenthe, Hybrid density functional calculations of nuclear magnetic shieldings using Slater-type orbitals and the zeroth-order regular approximation, Int. J. Quantum Chem., 2009, 109, 1676–1683 CrossRef CAS.
- C. Adamo and V. Barone, Toward reliable density functional methods without adjustable parameters: The PBE0 model, J. Chem. Phys., 1999, 110, 6158–6170 CrossRef CAS.
- P. Moutzouri, B. Simões de Almeida, D. Torodii and L. Emsley, Pure isotropic proton solid state NMR, J. Am. Chem. Soc., 2021, 143, 9834–9841 CrossRef CAS PubMed.
- M. Strohmeier, D. Stueber and D. M. Grant, Accurate 13C and 15N chemical shift and 14N quadrupolar coupling constant calculations in amino acid crystals: zwitterionic, hydrogen-bonded systems, J. Phys. Chem. A, 2003, 107, 7629–7642 CrossRef CAS PubMed.
- O. Socha, P. Hodgkinson, C. M. Widdifield, J. R. Yates and M. Dracinsky, Exploring systematic discrepancies in DFT calculations of chlorine nuclear quadrupole couplings, J. Phys. Chem. A, 2017, 4103–4113 CrossRef CAS PubMed.
- I. Lopes, L. Piao, L. Stievano and J.-F. Lambert, Adsorption of amino acids on oxide supports: a solid-state NMR study of glycine adsorption on silica and alumina, J. Phys. Chem. C, 2009, 113, 18163–18172 CrossRef CAS.
- S. Adiga, D. Aebi and D. L. Bryce, EFGShield — a program for parsing and summarizing the results of electric field gradient and nuclear magnetic shielding tensor calculations, Can. J. Chem., 2007, 85, 496–505 CrossRef CAS.
- B. Elena, G. Pintacuda, N. Mifsud and L. Emsley, Molecular structure determination in powders by NMR crystallography from proton spin diffusion, J. Am. Chem. Soc., 2006, 128, 9555–9560 CrossRef CAS PubMed.
- D. A. Safin, P. M. J. Szell, A. Keller, I. Korobkov, D. L. Bryce and M. Murugesu, Interaction of 2,4,6-tris(2-pyrimidyl)-1,3,5-triazine (TPymT) with CoX2 (X = Cl, Br) in water: trapping of new self-assembled water–chloride/bromide clusters in a [Co(bpca)2]+ host (bpca = bis(2-pyrimidylcarbonyl)amidate anion), New J. Chem., 2015, 39, 7147–7152 RSC.
Footnotes |
| † Electronic supplementary information (ESI) available. CCDC 2302285. For ESI and crystallographic data in CIF or other electronic format see DOI: https://doi.org/10.1039/d3ce01062g |
| ‡ These authors have contributed equally. |
| This journal is © The Royal Society of Chemistry 2024 |

