
 Open Access Article
 This Open Access Article is licensed under a Creative Commons Attribution-Non Commercial 3.0 Unported Licence
Regio selective deposition of conducting polymers using wireless electropolymerisation†
Áine
Brady
 a,
Michal
Wagner
a and
Robert J.
Forster
*ab
a,
Michal
Wagner
a and
Robert J.
Forster
*ab
aSchool of Chemical Sciences, Dublin City University, Dublin 9, Ireland. E-mail: Robert.Forster@dcu.ie
bFutureNeuro, SFI Research Centre for Chronic and Rare Neurological Diseases, Dublin City University, Dublin 9, Ireland
First published on 12th September 2024
Abstract
The ability to induce different potentials in different regions of a (bipolar) electrode could transform applications such as on-demand drug delivery, the electrostimulation of biological cells, the development of advanced electroceuticals, and multi-analyte detection devices where different analytes could be wirelessly detected in different regions of a single sensing surface dramatically simplifying the device design. Here, we demonstrate the use of multiple feeder electrodes to control the electric field distribution in solution thus changing the potential induced in different regions of the bipolar electrode depending on the feeder voltage, polarity and feeder electrode position. The principle is demonstrated for the deposition of films of the conducting polymer, Poly(3,4-EthyleneDiOxyThiophene) (PEDOT), without the need for a physical template to control the regions in which polymer deposits.
Bipolar, or wirefree, (BP) electrochemistry1–3 uses feeder or driving electrodes to create an electric field in solution that can induce a potential within a conductor.4 This approach enables many applications such as the creation of Janus particles, conducting polymers, nanoscale interconnects and the on demand electrical, electrochemical and chemical stimulation of biological cells which is vital for the emerging field of electroceuticals.5,6 Typically, a conducting bipolar electrode (BPE) is placed between a pair of feeder electrodes and the voltage induced varies approximately linearly across the BPE. The magnitude of the voltage depends on the voltage applied to the feeder electrodes, the electrolyte concentration, and the dimensions of the BPE.4,7
Using a pair of feeder electrodes allows the potential induced in the bipolar electrode to be controlled, but only in one-dimension, e.g., the voltage changes along the axis perpendicular to the feeders (left to right) but it does not change along the axis parallel to the feeders (top to bottom). The ability to control the potential in 2- or even 3-D would represent a significant step forward, e.g., enabling different regions of the bipolar electrode to be functionalised with different materials. One approach to achieving this objective is to change the geometry of the bipolar electrode, e.g., using 3D pin arrays8,9 or nanocavity arrays10 so that the induced potential varies in 2D or 3D depending on the location on the surface. This requires complex fabrication, e.g., 3D metal printing, and, for example does not allow “Brahma” (4 different faces) rather than “Janus” (2 faces) particles to be created. To the best of our knowledge, for the first time we demonstrate that the electric field distribution in solution, and hence the potential induced in different regions of the BPE, can be shaped using more than two feeder electrodes (Fig. 1(a)).
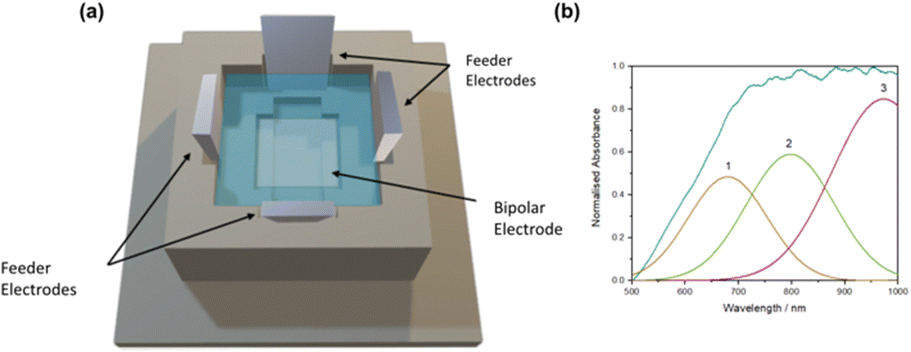 | ||
| Fig. 1 (a) Schematic of the 3D printed BP cell printed in ABS with four titanium feeder electrodes (H: 2 cm × L: 1 cm × D: 2 mm) and an FTO BPE (1.5 cm × 1.5 cm). (b) UV-Vis spectrum of the wirelessly polymerised BP film at 10 V cm−1 for 20 minutes in 10 mM EDOT in Milli-Q water solution. | ||
The use of multiple feeder electrodes allows the induced voltage to be controlled in 2D, and ultimately in 3D, driving different redox reactions in different regions of the BPE. This ability is highly attractive for diverse applications, e.g., to drive different electrochemiluminescent reactions (due to the different induced voltages) at different locations enabling multianalyte detection at a single unstructured electrode, to release encapsulated drugs at different rates across a conducting surface or to rapidly identify the optimum electrostimulation conditions for biological cells.5,11–14 Here, the electrodeposition of PEDOT is used to probe the electric field in two four-feeder configurations, that give unique polymerisation patterns on the BPE. This regioselective electrodeposition is intended to ultimately enable template-free patterning of the polymer film.4
While electrophoretic mass transport processes may be important at high field strengths, PEDOT deposition can be used to map the electric field distribution since the voltage dependent rate of heterogeneous electron transfer impacts the polymerisation rate and hence the quantity of polymer deposited.15 The four-feeder setup consisted of four titanium feeder electrodes (H: 2 cm × L: 1 cm × D: 2 mm) which were connected to an EA PS 5200-02A power supply (field strength of 10 V cm−1) and a fluorine-doped tin oxide (FTO) BPE (1.5 cm × 1.5 cm). The solution contained 10 mM EDOT in Milli-Q water in the absence of deliberately added electrolyte. The acrylonitrile butadiene styrene (ABS) BP cell was designed using FreeCAD and printed using an Ultimaker S5 3D printer. Fig. 1(a) shows the four-feeder BP setup.
The absence of deliberately added electrolyte maximises the voltage available to generate an electric field in solution and opens the possibility of creating low doped or even undoped PEDOT films. UV-Vis spectroscopy was performed on the wirelessly deposited films to provide information on the band gaps and chemical composition (Fig. 1(b)). Significantly, the experimental spectrum can be fitted with three Gaussian peaks and the likely presence of polaronic absorption peaks at 680 nm, 800 nm, and 1000 nm suggests that the PEDOT is in fact ‘doped’.16,17 This is particularly interesting considering that conductivity measurements of the solution is in the μS cm−1 range and increase by less than 25% after the electric field is applied at 10 V cm−1 for 20 minutes. This suggests that relatively few ions are produced during electrodeposition. The conductivity of the solution after film deposition is approximately equivalent to that found for a 1 nM solution of a monovalent salt and is most likely due to the release of protons as the EDOT polymerises, e.g. the formation of an EDOT dimer releases two protons.
The four-feeder BP system (two positive and two negative feeder electrodes) modifies the expected linear potential profile across the BPE when only two feeders are used. Fig. 2 shows the impact of two different configurations of the four feeder electrodes on the electropolymerisation of EDOT. Fig. 2(a) has the two pairs of positive and negative feeder electrodes directly opposite one another and shows a photograph of the resulting film. Finite Element Modelling (FEM) was performed using Elmer software and the corresponding solution potential distribution is shown in Fig. 2(b). In sharp contrast to the wedge-like deposition pattern found for a single pair of feeder electrodes, PEDOT is deposited in an arc centred at the corner opposite the two negative feeder electrodes demonstrating the ability to shape the PEDOT deposition in a regio selective manner without the need for a template. The analysis of the SEM images, shows that, not only is the film structured in 2D, but the deposition occurs in a gradient with the film being thickest in the corner where the induced voltage is highest and tapering down as the centre of the BPE is approached.
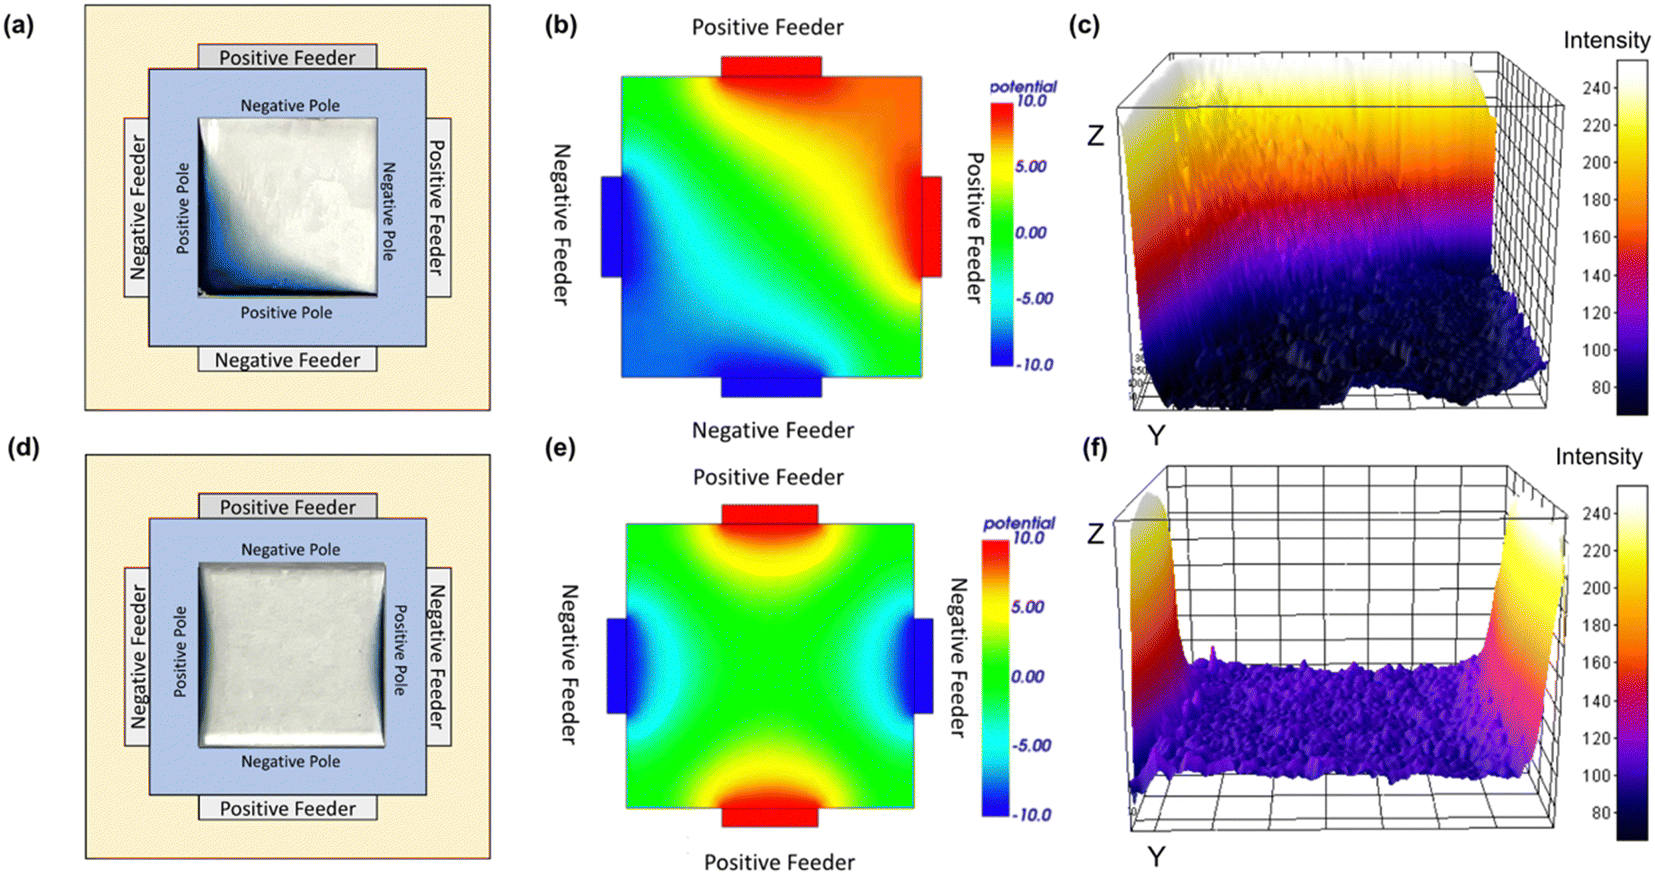 | ||
| Fig. 2 FTO BPE polymerised in 10 mM EDOT Milli-Q water solution at V cm−1 for 20 minutes. (a)–(c) Configuration 1: (a) positive and negative feeders oppose each other (b) FEM model of the potential distribution (blue −10 V, red +10 V) (c) 3D representation of PEDOT deposition (d)–(f) configuration 2: positive and negative feeder electrodes are adjacent to one another (e) FEM model of the potential distribution (f) 3D representation of PEDOT deposition. | ||
Fig. 2(d) and (f) demonstrate the high degree of control that can be exerted over the deposition region by simply changing the position of the feeder electrodes. Here, the pairs of positive and negative feeder electrodes are positioned adjacent rather than opposite one another. PEDOT deposition now occurs in two separate locations taking the form of two shallow arcs at the two positive poles of the BPE. From both the photograph and the SEM image analysis, it is clear that there is a gradient in the thickness of the deposited film, i.e., thickest at the edge and becoming thinner towards the centre of the BPE. Moreover, the microstructure of the PEDOT film reflects the deposition rate as influenced by the induced voltage, i.e., where the voltage and deposition rate are highest, the films’ structure is porous, while close to the centre of the BPE where deposition occurs more slowly, the film is significantly smoother and more compact. For both feeder electrode configurations, the deposition pattern is highly reproducible in terms of deposition areas. Significantly, these results show that through a simple change in the feeder configuration, a completely different electric field is generated, enabling electrodeposition in different regions of the BPE. The structuring of the PEDOT film correlates strongly with the FEM modelling allowing the configuration of a set of feeders to be identified a priori in order to give a conducting polymer film with the required topography. In general terms, the film thickness correlates well with the behaviour expected for PEDOT potential dependent nucleation and growth kinetics, i.e., a more positive induced potential drives nucleation at a higher rate which leads to a thicker film. The relative thickness of the PEDOT film across the electrode reflects the calculated potential distribution, but other processes such as migration of the cation radicals across the BPE due to the voltage gradient are also likely to influence the film thickness. It is perhaps important to note that the specific region over which the redox reaction (PEDOT deposition) proceeds depends on the induced voltage which is influenced by factors including the electrolyte concentration and the cell geometry, e.g., the separation of the feeder electrodes. However, these factors can be included in the FEM model, enhancing the general practical applicability of the approach. The approach can be applied to more intricate/complex bipolar electrodes and the deposition region can be further refined by changing the number of feeder electrodes, their size, and their relative positions. However, the ultimate resolution that could be achieved is limited by the cell volume and the intrinsic tendency of electric fields to dissipate over space.
To quantify the amount of PEDOT deposited on the BPE, a scan rate study (5 ≤ ν ≤100 mV s−1) was performed. Fig. 3(a) and (c) show the flat and featureless cyclic voltammograms are observed for both configurations 1 and 2, which is consistent with the capacitive behaviour of PEDOT. The capacitance was calculated by plotting the current at 0.2 V versus scan rate and obtaining the slope of the best fit line. The calculated film capacitance for configuration 1 was 2.33 mF cm−2 and 0.58 mF cm−2 for configuration 2. The observation that the number of moles of PEDOT deposited is significantly lower (approximately 4-fold) for configuration 2 than configuration 1 is expected on the basis of the FEM modelling. The FEM model predicts that the fractional area of the BPE that will achieve a sufficiently positive potential to oxidise EDOT is smaller for configuration 2 than for 1.
 | ||
| Fig. 3 (a) Scan rate dependent voltammetry (bottom to top, 5 to 100 mV s−1) where the working electrode in a 3-electrode cell is the PEDOT coated BPE deposited using configuration 1. (b) SEM imaging of PEDOT film formed using configuration 1. (c) Scan rate dependent voltammetry (bottom to top, 5 to 100 mV s−1) where the working electrode in a 3-electrode cell is the PEDOT coated BPE deposited using configuration 2. (d) SEM imaging of PEDOT formed in configuration 2. In both (a) and (c) the supporting electrolyte is 0.1 M LiClO4 and the films were formed using 10 mM EDOT in Milli-Q water solution at 10 V cm−1 for 20 minutes. | ||
In configuration 1, PEDOT is deposited at the corner of the two positive poles on the BPE and Fig. 3(b) shows an SEM image. (At the edge, the film consists of globular aggregates due to higher deposition rates associated with a more positive induced potential. Significantly, there is a rather abrupt transition between the thick film at the corner and the thinner, more smooth and dense film toward the centre of the FTO). The cracks present are consistent with drying induced stress.18 A change in film thickness is expected on the basis of the FEM potential distribution mapping, as the potential decreases from the two positive BPE poles to the diagonal centre of the BPE (Fig. 2(b)). The ImageJ generated 3D deposition (from photographs) also correlates with the SEM imaging as the film thickness is decreasing toward the centre of the BPE (Fig. 2(c)). Fig. 3(d) shows the wirelessly polymerised PEDOT film using the second four-feeder setup (configuration 2). Consistent with the smaller number of moles deposited (approximately 4-fold) and correspondingly lower deposition rate, this film has a substantially smoother morphology, with a film thickness gradient from the edge of the FTO slide (positive pole). The gradient arc deposition can be seen as the film thickness decreases toward the centre of the BPE.
In summary, this work successfully demonstrates that (i) multiple feeder electrodes can be used to wirelessly induce different potentials at different locations at a bipolar electrode in a regio selective manner, (ii) the potentials can be modelled using FEM, (iii) the controlled induced potentials can be used for regio selective, wirefree, electrodeposition of patterned PEDOT films without the use of a physical template. These patterned films, created using the shaped electric fields generated using multiple, purposefully positioned feeder electrodes, could enable multi-analyte detection devices, spatially controlled on-demand drug delivery, and the stimulation of biological cells toward 3D electroceuticals.
Áine Brady: writing, visualisation, methodology, investigation, formal analysis, data curation. Michal Wagner: methodology. Robert Förster: conceptualisation, writing (review & editing), supervision and funding acquisition. All authors read the manuscript and approved the submitted version.
The financial; support of Science Foundation Ireland (SFI) under grant number 21/FFP-P/10255 and the European Union under MSCA Doctoral network Horizon Europe programme Grant Agreement Number 101119951 (ECLectic) is gratefully acknowledged. This publication has emanated from research supported in part by a research grant from Science Foundation Ireland (SFI) under grant number 21/RC/10294_P2 and co-funded under the European Regional Development Fund and by FutureNeuro industry partners.
Data availability
The data supporting the findings of this study are available within the article.Conflicts of interest
There are no conflicts to declare.Notes and references
- L. Koefoed, S. U. Pedersen and K. Daasbjerg, Curr. Opin. Electrochem., 2017, 2, 13–17 CrossRef CAS.
- R. M. Crooks, ChemElectroChem, 2016, 3, 357–359 CrossRef CAS.
- S. E. Fosdick, K. N. Knust, K. Scida and R. M. Crooks, Angew. Chem., Int. Ed., 2013, 52, 10438–10456 CrossRef CAS PubMed.
- R. J. Forster, Curr. Opin. Electrochem., 2023, 39, 101297 CrossRef CAS.
- A. Jain, J. Gosling, S. Liu, H. Wang, E. Stone, S. Chakraborty, P.-S. Jayaraman, S. Smith, D. Amabilino, M. Fromhold, Y.-T. Long, L. Pérez-García, L. Turyanska, R. Rahman and F. Rawson, Nat. Nanotechnol., 2024, 19, 106–114 CrossRef CAS PubMed.
- A. Robinson, A. Jain, H. Sherman, R. Hague, R. Rahman, P. Sanjuan Alberte and F. Rawson, Adv. Ther., 2021, 4, 2000248 CrossRef CAS.
- C. A. C. Sequeira, D. S. P. Cardoso and M. L. F. Gameiro, Chem. Eng. Commun., 2016, 203, 1001–1008 CrossRef CAS.
- S. F. Douman, M. Ruiz De Eguilaz, L. R. Cumba, S. Beirne, G. G. Wallace, Z. Yue, E. I. Iwuoha and R. J. Forster, Front. Chem., 2021, 9, 662810 CrossRef CAS PubMed.
- S. F. Douman, D. Collins, L. R. Cumba, S. Beirne, G. G. Wallace, Z. Yue, E. I. Iwuoha, F. Melinato, Y. Pellegrin and R. J. Forster, Chem. Commun., 2021, 57(38), 4642–4645 RSC.
- L. Cumba, Y. Pellegrin, F. Melinato and R. J. Forster, Sens. and Actuat. Rep., 2022, 4, 100082 Search PubMed.
- C. Qin, Z. Yue, Y. Chao, R. J. Forster, F. Ó. Maolmhuaidh, X.-F. Huang, S. Beirne, G. G. Wallace and J. Chen, Appl. Mater. Today, 2020, 21, 100804 CrossRef.
- E. Villani, N. Shida and S. Inagi, Electrochim. Acta, 2021, 389, 138718 CrossRef CAS.
- K. Krukiewicz, A. Kruk and R. Turczyn, Electrochim. Acta, 2018, 289, 218–227 CrossRef CAS.
- B. Alshammary, F. C. Walsh, P. Herrasti and C. Ponce de Leon, J. Solid State Electrochem., 2016, 20, 839–859 CrossRef CAS.
- N. Shida and S. Inagi, Chem. Commun., 2020, 56, 14327–14336 RSC.
- I. Zozoulenko, A. Singh, S. K. Singh, V. Gueskine, X. Crispin and M. Berggren, ACS Appl. Polym. Mater., 2019, 1, 83–94 CrossRef CAS.
- J. Edberg, D. Iandolo, R. Brooke, X. Liu, C. Musumeci, J. W. Andreasen, D. T. Simon, D. Evans, I. Engquist and M. Berggren, Adv. Funct. Mater., 2016, 26, 6950–6960 CrossRef CAS.
- B. S. Tomar, A. Shahin and M. S. Tirumkudulu, Soft Matter, 2020, 16, 3476–3484 RSC.
Footnote |
| † Electronic supplementary information (ESI) available. See DOI: https://doi.org/10.1039/d4cc03996c |
| This journal is © The Royal Society of Chemistry 2024 |