
Geometrically twisted intra–inter-molecular cooperative interactions for an enhanced photo-response in an ORMOSIL-based host–guest system†
Moumita
Chandra
,
Alpana
Sahu
,
Nitul
Kalita
and
Mohammad
Qureshi
 *
*
Materials Science Laboratory, Department of Chemistry, Indian Institute of Technology Guwahati, Guwahati, India. E-mail: mq@iitg.ac.in
First published on 8th July 2024
Abstract
In situ encapsulation of the 2-(2′-hydroxylphenyl)benzothiazole (HBT) fluorophore into organically modified silica (ORMOSIL) is recognized as a potential approach to increase the photocurrent conversion efficiency. Encapsulation resulted in a twisted geometrical configuration of HBT with an efficient charge transfer and increased carrier density, resulting in a 246% photo-response enhancement.
In the field of photo-electrochemistry, the design and development of photoactive materials have emerged as a crucial research task due to their wide applications in photocatalysis, photovoltaics, and sensing.1,2 Photoactive materials serve as transducers that convert electrochemical energy to chemical energy in the presence of solar light.3
There has been great interest in structurally diverse organic fluorescent materials due to their ability to be customized through chemical modifications, which results in extending their large-scale applications in photovoltaic cells, light-emitting diodes and fluorescent probes.4 Among these, the fluorophore HBT is notable for its well-studied photosensitivity, photostability and bioimaging driven by intramolecular hydrogen bonding responsible for facilitating the excited-state intramolecular proton transfer (ESIPT) process, where a hydrogen bond donor and hydrogen bond acceptor co-exist in a single molecule.5,6 However, the fluorescence properties of HBT could suffer from self-absorption and strong intramolecular interactions primarily due to ESIPT and intrinsic radiative decay.7
To overcome these limitations, various research groups have focused on fine-tuning the fluorophore material by blocking the ESIPT process and enhancing fluorophore performance by incorporating various functional groups. A recent emerging approach consists of an HBT fluorophore moiety embedded within functionalized silica, enabling significant performance enhancement.8 This strategy offers several advantages, such as mitigating charge recombination, enhancing stability and expanding the range of applications through synergistic interactions between the fluorophore and host material. This composite design has the potential to unlock new possibilities in fluorescence-based technologies by combining the unique properties of fluorophores with those of other materials.
Silica nanoparticles are one of the most preferred materials due to their non-toxicity, thermal stability, chemical inertness, and biocompatibility.9 However, silica nanoparticles lack a high surface area and are unsuitable for guest–host interactions. Therefore, the use of organic precursors such as alkyl-substituted silicon alkoxides introduces performance-enhancement properties inside inorganic silane, and this modified material is known as organically modified silica (ORMOSIL).10
The covalent bonding between organic and inorganic components in ORMOSIL creates a cross-linked organic porous network viable for host–guest interactions.11 There are numerous applications for this modified form in bioimaging, gas sensing, lasers, and many others. Palmisano et al. reported a TiO2/ORMOSIL thin film doped with phthalocyanine dyes for the application of photocatalytic devices under solar light irradiation.12 ORMOSIL acted as a host-cage material, and when phthalocyanine dyes were incorporated inside the cage, large improvements were subsequently observed in the performance. Mishra et al. reported carbon nanodots incorporated inside ORMOSIL for the fabrication of fluorescent coatings on glass.13 Therefore, chemical modification of ORMOSIL matrices can effectively replace traditional materials, particularly in the field of photochemistry.
In this context, encapsulating HBT into an ORMOSIL matrix offers significant advantages to chronoamperometry applications in the presence of light. However, to the best of our knowledge, there are no reports describing the fabrication of HBT on an ORMOSIL matrix employed for photoresponse purposes. Herein, we propose a convenient one-pot synthesis for creating an HBT–ORMOSIL composite for photocurrent measurements, where intermolecular charge transfer occurs instead of ESIPT by virtue of the twisted geometry of HBT, which promotes the intermolecular charge transfer, as described in Scheme 1. We conducted extensive studies to demonstrate the inhibition of ESIPT, and the introduction of the intermolecular charge transfer within the HBT–ORMOSIL framework served as the driving force for enhancing the photo-current response.
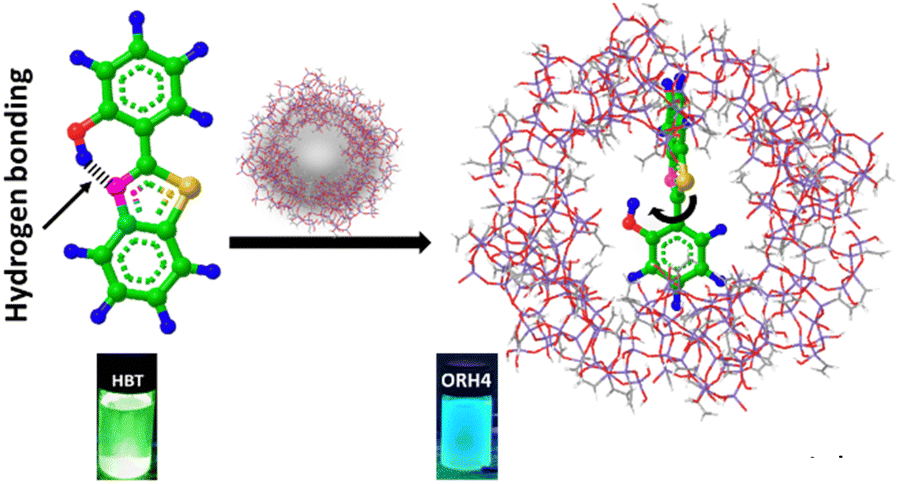 | ||
| Scheme 1 Schematic representation of the interactions between HBT and ORMOSIL, which is a host–guest system. The digital photograph of HBT under ultraviolet radiation and the composite show the incorporation of HBT in the ORMOSIL matrix, with the wavelength blue-shifted in the composite. | ||
ORMOSIL was synthesized via the hydrolysis–condensation method14 (the detailed experimental procedure is given in the ESI†), where tetraethyl orthosilicate (TEOS) is mixed with vinyl trimethoxy silane (VTMOS), followed by hydrolysis and condensation using NaOH. The condensation reaction proceeds, and ORMOSIL is formed, which was confirmed by physicochemical characterizations. The obtained thick white-coloured liquid was further stirred for 1 h and further dried in an oven at 60 °C for 12 h. The synthesis process of the composite is the same, with the addition of HBT before hydrolysis to trap HBT inside the ORMOSIL-caged framework. The hydrolysis and condensation reaction mechanisms of the precursors for the formation of ORMOSIL are explained in the ESI.†![[thin space (1/6-em)]](https://www.rsc.org/images/entities/char_2009.gif) 14 Various compositions of ORMOSIL-HBT composite were synthesized by varying the amount of HBT, and composites were designated as ORH2 (2 mmol HBT), ORH4 (4 mmol HBT), and ORH6 (6 mmol HBT). A diagram of the interactions between HBT and ORMOSIL is shown in Scheme 1.
14 Various compositions of ORMOSIL-HBT composite were synthesized by varying the amount of HBT, and composites were designated as ORH2 (2 mmol HBT), ORH4 (4 mmol HBT), and ORH6 (6 mmol HBT). A diagram of the interactions between HBT and ORMOSIL is shown in Scheme 1.
Field emission transmission electron microscopy (FETEM) analysis was carried out for the detection of microstructure, and Fig. 1a shows the spherical morphology of ORMOSIL, with HBT showing a relatively smaller morphological structure (Fig. 1b). The FETEM image of the ORH4 composite in Fig. 1c depicts the interconnected network structure of the composite, with HBT uniformly distributed throughout the ORMOSIL matrix. This interconnected structure is advantageous for enhancing the efficiency of charge transfers via the caged network. To determine the elemental distribution within the material, energy-dispersive X-ray (EDX) analysis was conducted, and it was found that all elements were homogeneously distributed in the composite (Fig. S2, ESI†).
 | ||
| Fig. 1 FETEM images of (a) ORMOSIL, (b) HBT and (c) ORH4; FT-IR spectra of (d) TEOS and VTMOS, and (e) the synthesized materials in the stretching frequency region of Si–O–Si and the hydroxyl group. (f) N2 adsorption–desorption isotherm of ORMOSIL and ORH4 shows that after incorporation of HBT in ORMOSIL, the surface area decreased. | ||
Fourier transform-infrared (FT-IR) spectroscopy is an essential tool for effectively identifying functional groups within the material. There were typical peaks for TEOS between 2975 and 2880 cm−1, representing the C–H stretching vibration of the ester group (Fig. 1d and Fig. S3a, ESI†), whereas the peaks between 1443 and 1296 cm−1 were related to the asymmetric bending or wagging of C–H bonds.15 The peaks at around 1167 and 968 cm−1 corresponded to C–H rocking. The Si atom bound to the ethoxy group (Si–OCH2CH3) is represented by the peaks at around 1100 cm−1. In VTMOS (Fig. 1d and Fig. S3a, ESI†), the spectra recorded at 1078 cm−1 and 1188 cm−1 were attributed to the methoxy group, whereas the vinyl group appeared at 1008 cm−1 and 966 cm−1.16
After the formation of ORMOSIL, the most prominent absorption peak appearing at 1037 cm−1 corresponded to the asymmetric stretching of the Si–O–Si bonds, and the peak at 758 cm−1 was due to the Si–O stretching vibration, which implies the hydrolysis of TEOS and VTMOS under basic conditions and successful synthesis of ORMOSIL (Fig. 1e and Fig. S3b, ESI†).17–19 The weak signal at 966 cm−1 was attributed to the overlap of signals arising from Si–OH stretching and vinyl CH2 wagging. The band for the bending vibration of the surface-adsorbed hydroxyl group appears at 3368 cm−1. The characteristic bands of HBT are shown in Fig. S3b (ESI†). After the formation of the composite, the FT-IR spectra showed the characteristic bands of ORMOSIL and HBT. However, a shift in the Si–O–Si stretching vibration was observed for the composites, as shown in Fig. 1e, which implies intermolecular interactions between HBT and ORMOSIL instead of a new chemical bond formation. The peak corresponding to the hydroxyl group in ORMOSIL broadened, and the peak intensity decreased, as shown in Fig. 1e, indicating the interaction of hydroxyl groups in the composite.
The nuclear magnetic resonance (NMR) study of HBT and ORH4 revealed that intramolecular hydrogen bonding in HBT was disrupted in the composite as the intensity of the OH proton diminished, and the peak position shifted in the composite as discussed in later stages. Therefore, the FT-IR and NMR analyses indicate that HBT and ORMOSIL are attached in a single framework. Moreover, encapsulation of HBT in the ORMOSIL matrix was further validated from a Brunauer–Emmett–Teller (BET) isotherm, as shown in Fig. 1f. Pure ORMOSIL shows a higher BET surface area of 137 m2 g−1 as compared to ORH4 (104 m2 g−1). A decreased value in the BET surface area indicated that a network structure resulted when HBT was incorporated inside the porous matrix of ORMOSIL due to a decrease in the surface area of the composite as compared to pure ORMOSIL.
HBT emits in the green light region via its enol–keto form, which occurs through ESIPT, where intramolecular hydrogen bonding facilitates the tautomerization to the keto form.20 Well-resolved UV absorption spectra of pure HBT exhibit a maximum absorbance in the range of 380 nm (Fig. S4, ESI†). After the formation of composite, the absorbance shifted towards the lower wavelength region (339 nm for ORH4), as indicated by the arrow mark in the normalized absorption spectra in Fig. S4b (ESI†). Intramolecular hydrogen bonding is responsible for the ESIPT process because the proton transfer takes place between the phenyl group and N-atom of the benzothiazole ring of HBT. However, the intermolecular interactions between HBT and the Si–OH group in the ORMOSIL framework impedes the ESIPT process and results in geometrical twisting of HBT, which is the key factor for the charge transfer in the HBT–ORMOSIL composite.
Additionally, in photoluminescence (PL) spectra (Fig. 2a), the emission of ORH4 is blue-shifted to 450 nm, as compared with the emission at 510 nm for pure HBT and indicates changes in the neighbouring environment involving HBT in the excited state, resulting in facile charge transfers in the composite.21 The emission colour changing from green to blue (as shown in the digital photograph in Scheme 1) indicates the inhibition of the ESIPT process,22–24 where the HBT molecule is trapped inside the ORMOSIL matrix through intermolecular interaction.
 | ||
| Fig. 2 (a) Steady-state photoluminescence spectra indicate that the emission wavelength was blue-shifted after the formation of the HBT–ORMOSIL composite. (b) TRPL plot, (c) EIS spectra, (d) Mott–Schottky plot, (e) photocurrent measurements and (f) IPCE study of the materials. | ||
To further investigate the charge transfer dynamics of synthesized materials, time-resolved photoluminescence (TRPL) analysis was carried out and is shown in Fig. 2b. TRPL decay was fitted with a bi-exponential decay model according to the following equation:25
| I = A1et/τ1 + A2et/τ2 | (1) |
Electrochemical impedance spectroscopy (EIS) analysis also validated the charge transfer mechanism in ORH4, as given by the smaller semicircle in the EIS analysis (Fig. 2c). Mott–Schottky measurements were carried out to further elucidate carrier concentrations (ND). As shown in Fig. 2d, ORH4 gives a smaller slope in the Mott–Schottky plot as compared to pure ORMOSIL, which indicates higher carrier concentration in the composite (the details appear in the ESI†).
The chronoamperometry analysis was carried out using as-synthesized catalysts in a solution of 0.5 M Na2SO4 under 1 Sun illumination at 20 s chopping interval. A fast photocurrent response was observed, and the highest photocurrent density of 0.65 mA cm−2 was obtained from ORH4 as compared to ORH2 and ORH6, as shown in Fig. S5 (ESI†) at a fixed potential 0.7 V (vs. Ag/AgCl), which is 21 and 5 times greater than ORMOSIL and HBT, respectively, as shown in Fig. 2e. There was a significant decrease in photocurrent anodic spikes for ORH4 as compared to pure materials, indicating that the charge recombination was suppressed, and the photocurrent response was stable for the composite. To quantify the efficiency, incident photon-to-current conversion efficiency (IPCE) measurements were carried out and are shown in Fig. 2f. The photoconversion efficiency of ORH4 increased by ∼246% as compared to HBT. The enhancement in IPCE is related to the reduced recombination of charge carriers by virtue of the intermolecular interactions between HBT and ORMOSIL.
NMR spectroscopy analysis was carried out to elucidate the inherent twisted molecular geometry involved in governing the charge transfers between caged molecules. Fig. S6a (ESI†) shows the NMR spectra of pure HBT. The peaks in the range of δ = 6.5 to 8.5 ppm were attributed to protons attached to the aromatic ring (Ar–H) and are seen as singlet, doublet, doublet–doublet and triplet peaks.8 The singlet peak observed at δ = 11.55 ppm was attributed to the (–OH) proton, which is due to the intramolecular hydrogen bonding between the phenolic proton and nitrogen atom of the thiazole ring.28
After the formation of the HBT–ORMOSIL matrix, a significant reduction in the singlet peak intensity corresponding to –OH, as well as peak shifting towards the de-shielded region, was observed (Fig. S6b, ESI†). This indicated the disruption of intramolecular hydrogen bonding in HBT and the intermolecular interactions in the caged structure of the ORMOSIL matrix with the –OH group of HBT. Additionally, a significant shift in the NMR spectra of the aromatic region implies that the interaction of HBT with the ORMOSIL matrix in the composite and benzothiazole ring occurred in a different chemical environment in the composite (Fig. S6c and d, ESI†).
In the FT-IR spectra, we observed a shift in the Si–O–Si stretching vibration towards a higher wavenumber region, which is indicative of guest–host interactions of HBT and the ORMOSIL matrix. Furthermore, the peak intensity at 3368 cm−1 of the hydroxyl group in the composite decreased and broadened. The NMR study also indicates peak shifting of HBT, and changes in the neighbouring environment around it established the intermolecular interactions between HBT and the ORMOSIL matrix. Fig. 3 shows the inhibition of the ESIPT process in HBT in the presence of the ORMOSIL matrix. Additionally, the Mott–Schottky analysis provided an estimate of carrier concentration in the materials, which elucidated the higher carrier concentration in the composite (ORH4), and the charge transfers from HBT to ORMOSIL increased the photocurrent response in the caged ORMOSIL-HBT matrix under illumination.
 | ||
| Fig. 3 ESIPT in HBT and inhibition of the ESIPT process in the presence of ORMOSIL in the caged framework are shown. | ||
In summary, this work showcases host–guest interactions between HBT and ORMOSIL, where a fluorophore embedded within an organically modified silica matrix results in heightened photocurrent performance. Host–guest type interactions lead to geometry twisting, which results in effective charge transfers and subsequent photo-current response.
M. C. contributed to the ideation, experiments, data analysis, and drafting of the manuscript. M. Q. contributed the initial ideation, manuscript writing and supervised the overall work and funding. A. S. and N. K. contributed equally to the analysis and manuscript writing.
M. C. acknowledges IIT Guwahati for the Institute Post-Doctoral Fellowship. Anjana Singha is acknowledged for BET measurements. M. Q. thanks DST-SERB for financial support through project no: SERB/CRG/2020/00211. The authors are thankful to the Department of Chemistry and Central Instruments Facility (CIF) at IIT Guwahati for the instrumental support.
Data availability
The data supporting this article have been included as a part of the ESI.† and the instruments used in the experiments were mentioned in the experimental section.Conflicts of interest
There are no conflicts to declare.References
- Y. Peng, C. H. Mak, J.-J. Kai, M. Du, L. Ji, M. Yuan, X. Zou, H.-H. Shen, S. P. Santoso, J. C. Colmenares and H.-Y. Hsu, J. Mater. Chem. A, 2021, 9, 26628–26649 RSC.
- K. Yan, P. K. Kannan, D. Doonyapisut, K. Wu, C. Chung and J. Zhang, Adv. Funct. Mater., 2021, 31, 2008227 CrossRef CAS.
- J. Lv, J. Xie, A. G. A. Mohamed, X. Zhang and Y. Wang, Chem. Soc. Rev., 2022, 51, 1511–1528 RSC.
- Z. Wang, Q. Jingjing, X. Wang, Z. Zhang, Y. Chen, X. Huang and W. Huang, Chem. Soc. Rev., 2018, 47, 6128–6174 RSC.
- S. Pijeau, D. Foster and E. G. Hohenstein, J. Phys. Chem. B, 2017, 121, 4595–4605 CrossRef CAS.
- P. Majumdar and J. Zhao, J. Phys. Chem. B, 2015, 119, 2384–2394 CrossRef CAS.
- A. C. Sedgwick, L. Wu, H.-H. Han, S. D. Bull, X.-P. He, T. D. James, J. L. Sessler, B. Z. Tang, H. Tian and J. Yoon, Chem. Soc. Rev., 2018, 47, 8842–8880 RSC.
- M. Güçoğlu and N. Şatıroğlu, J. Mol. Liq., 2022, 348, 118388 CrossRef.
- A. A. Nayl, A. I. Abd-Elhamid, A. A. Aly and S. Bräse, RSC Adv., 2022, 12, 13706–13726 RSC.
- S. Dash, S. Mishra, S. Patel and B. K. Mishra, Adv. Colloid Interface Sci., 2008, 140, 77–94 CrossRef CAS PubMed.
- F. Selvestrel, et al. , Nanoscale, 2013, 5, 6106–6116 RSC.
- G. Palmisano, M. C. Gutiérrez, M. L. Ferrer, M. D. Gil-Luna, V. Augugliaro, S. Yurdakal and M. Pagliaro, J. Phys. Chem. C, 2008, 112, 2667–2670 CrossRef CAS.
- M. K. Mishra, A. Chakravarty, K. Bhowmik and G. De, J. Mater. Chem. C, 2015, 3, 714–719 RSC.
- M. Pagliaro, R. Ciriminna, M. W. C. Man and S. Campestrini, J. Phys. Chem. B, 2006, 110, 1976–1988 CrossRef CAS PubMed.
- A. Hadela, M. Lakić, M. Potočnik, A. Košak, A. Gutmaher and A. Lobnik, Adsorpt. Sci. Technol., 2020, 38, 168 CrossRef CAS.
- S. S. Abbas, G. J. Rees, N. L. Kelly, C. E. J. Dancer, J. V. Hanna and T. McNally, Nanoscale, 2018, 10, 16231–16242 RSC.
- T. K. Sahu, S. Arora, A. Banik, P. K. Iyer and M. Qureshi, ACS Sustainable Chem. Eng., 2017, 5, 5912–5921 CrossRef CAS.
- C. Odenwald and G. Kickelbick, J. Sol-Gel Sci. Technol., 2019, 89, 343–353 CrossRef CAS.
- X. Zhang, W. Lin, J. Zheng, Y. Sun, B. Xia, L. Yan and B. Jiang, J. Phys. Chem. C, 2018, 122, 596–603 CrossRef CAS.
- V. S. Padalkar and S. Seki, Chem. Soc. Rev., 2016, 45, 169–202 RSC.
- Y. Ren, L. Zhou and X. Li, Front. Chem., 2021, 9, 807433 CrossRef CAS.
- I. Kaur, R. Shivani, P. Kaur and K. Singh, Dyes Pigm., 2020, 176, 108198 CrossRef CAS.
- X. Yang, R. Lu, H. Zhou, P. Xue, F. Wang, P. Chen and Y. Zhao, J. Colloid Interface Sci., 2009, 339, 527–532 CrossRef CAS PubMed.
- Z. Wu, J. Dou, K.-U. Nguyen, J. C. Eppley, K. Siwawannapong, Y. Zhang and J. S. Lindsey, Molecules, 2022, 27, 8682 CrossRef CAS PubMed.
- T. R. Chetia, D. Barpuzary and M. Qureshi, Phys. Chem. Chem. Phys., 2014, 16, 9625–9633 RSC.
- M. J. Mayoral, P. Ovejero, M. Cano and G. Orellana, Dalton Trans., 2011, 40, 377–383 RSC.
- W. Yang, S. Lee, H. C. Kwon, J. Tan, H. Lee, J. Park, Y. Oh, H. Choi and J. Moon, ACS Nano, 2018, 12, 11088–11097 CrossRef CAS PubMed.
- S. Sahana, G. Mishra, S. Sivakumar and P. K. Bharadwaj, Dalton Trans., 2015, 44, 20139–20146 RSC.
Footnote |
| † Electronic supplementary information (ESI) available: Experimental section, FESEM, EDX, FT-IR, XRD, UV-DRS, photocurrent study, TRPL, Mott–Schottky, and NMR analysis. See DOI: https://doi.org/10.1039/d4cc03071k |
| This journal is © The Royal Society of Chemistry 2024 |