
 Open Access Article
 This Open Access Article is licensed under a
 Creative Commons Attribution 3.0 Unported Licence
A solution NMR methodology enabling the elucidation of small molecule phospholipid membrane adhesion and passive permeation parameters†
Angela
Serrano-Sanchez‡
a,
Matthew
Rice‡
a,
Joseph
Cassar
a,
Lisa J.
White
b,
Precious I. A.
Popoola
 b,
Gary S.
Thompson
a,
Jennifer R.
Hiscock
b and
Jose L.
Ortega-Roldan
*a
b,
Gary S.
Thompson
a,
Jennifer R.
Hiscock
b and
Jose L.
Ortega-Roldan
*a
aSchool of Biosciences, University of Kent, Canterbury, CT2 7NJ, UK. E-mail: j.l.ortega-roldan@kent.ac.uk
bSchool of Chemistry and Forensic Science, University of Kent, Canterbury, CT2 7NH, UK
First published on 9th September 2024
Abstract
Quantifying small molecule uptake across a biological membrane of a target cell is crucial for the development of efficacious and selective drugs. However, current methods to obtaining such data are not trivial. Herein, we present an accessible, higher-throughput (20 minutes), 1H NMR spectroscopy assay, which enables the quantification of small molecule phospholipid passive membrane permeation and membrane adhesion parameters.
To elicit a therapeutic response, the active agents must often interact with, or permeate, a target cell's phospholipid membrane. Several in vitro experimental models exist to evaluate the transport of pharmaceutical candidates across cellular membranes, such as the (i) parallel artificial membrane permeability assay (PAMPA),1 and (ii) live cell Caco-2 permeability assay.2 However, the use of these methods is limited by long incubation times (10–16 h),3 multiple steps, use of a specific phospholipid membrane system, requirements for specialised personnel and equipment and operation at a comparatively high price point.
In addition, these models focus on the study of eukaryotic over prokaryotic systems. The phospholipid composition of membranes of bacterial cells is known to not only differ greatly from mammalian cells, but also between strains and species.4 Antimicrobial resistance (AMR) is one of the greatest global health threats,5 with resistance now having been identified against every antimicrobial agent currently marketed. This is caused, in part, by changes in microbial membrane composition preventing the permeation of antimicrobial agents to either elicit their mode of action or reach an intracellular target.6,7 Thus, high-throughput assays to monitor small molecule uptake in both eukaryotic and bacterial systems are required for the evaluation of drug efficacy, the identification of resistance mechanisms and the production of novel therapeutic agents to treat AMR infections.
To enable the removal of these roadblocks, we present an accessible, low-cost approach that enables comparative quantification of passive permeability and membrane adhesion properties of NMR active molecules, using vesicles composed of heterogenous/homogenous synthetic or naturally derived phospholipids and conventional solution NMR spectroscopy methods. As a proof-of-principle, we apply this methodology to a set of 6 compounds with known permeation factors for validation, and to new candidates from a class of supramolecular self-associating amphiphiles (SSA), members of which have been shown to interact with biological phospholipid membranes and elicit an antimicrobial effect, allowing the determination and comparison of their membrane permeability and adhesion properties. We have tested this methodology with a set of five structurally diverse compounds (Fig. S1, ESI†) selected from over 120 currently in the SSA library.8,9
Lipid vesicles mimic the structure and properties of cellular membranes. Permeation through the vesicle bilayer causes molecules to exist in dynamic equilibrium, as they move between the intra- and extravesicular environments. Therefore, by modulating the chemical composition inside and outside the vesicle, molecules with different permeation rates will experience different chemical environments, which will modulate their spectroscopic properties. This assay is designed to take advantage of these differences, enabling the comparison of the intensity of a target molecule 1H NMR resonances in the presence of vesicles, using two complimentary experiments, one with, and one without, a solvent paramagnetic relaxation enhancement (PRE) reagent like MnCl2 or gadodiamide.10 Through comparative analyses of the resulting spectra, a membrane adhesion factor (MAF) and a permeability factor (PF) can be elucidated for a target molecule–biological membrane combination. This process has been summarised in Fig. 1.
 | ||
| Fig. 1 Cartoon summarizing the NMR permeation assay. Three types of molecules are represented by a colored sphere (red – membrane interacting molecule, blue – fully membrane-permeable molecule) (e.g. indole or C60), and green – non-membrane permeable molecule (e.g. glucose). (A) In the first experiment (A)(i), drug(s) are mixed with vesicles, and 1D 1H CPMG NMR spectra are collected. The predicted spectra are shown for each type of molecule (A)(ii). (B) A second experiment is collected with the same drug(s) and vesicle composition, but in the presence of a solvent PRE (B)(i), with the expected spectra for each type of molecule shown in (B)(ii). (C) Quantification of membrane adhesion and permeability. The 1H NMR intensities of each drug are normalised using a control experiment without vesicles. Finally, the membrane adhesion (C)(i) and permeation factors (C)(ii) of each drug can be calculated. | ||
This assay functions through the exploitation of the differences in small molecule relaxation rates, dependent on their location within the phospholipid membranes or intravesicular/extravesicular solvent environment. Proton NMR T1 and T2 relaxation rates of the molecules under investigation depend on, amongst other parameters, their rotational correlation time. Small molecules that spend time bound to lipid vesicles exhibit longer T1 times than unbound small molecules free in solution. The longer T1 times will modulate the intensity of the 1H NMR signals if the sum of the acquisition time and the relaxation delay in a multi transient NMR experiment is not long enough to allow a return to equilibrium during the relaxation delay. However, the addition of solvent PRE reagents will reverse this effect, reducing both the T1 and T2 values, with a much larger reduction of T1 than T2 values for small molecules.11
In the presence of vesicles, the addition of a solvent PRE to vesicle-associated small molecules induces a reduction of T1, resulting in an increase of the intensity of its 1H NMR resonances. Conversely, the effect of solvent PRE on T2 on water-exposed small molecules leads to a decrease in their 1H signal intensities (Fig. S191 and S210, ESI†). This intensity reduction can be maximized employing CPMG pulse sequences,12 and can be exploited to distinguish between small molecules with different levels of membrane association/permeation.
To establish this methodology and provide a reference/control dataset, we selected a range of compounds with known membrane permeability coefficients (glucose, glycerol, tryptophan, hydrochlorothiazide (HCT), ethanol and indole). We measured 1H 1D CPMG spectra with 150 ms spin-lock times of these control compounds in the absence and presence of vesicles prepared with Gram negative bacteria E. coli lipids with and without the PRE reagent MnCl2 or gadodiamide (Fig. S6–S185, ESI†). The non- or low-permeating molecules like glucose and tryptophan show a significant drop of intensity of their 1H NMR resonances in the presence of Mn2+ or Gd3+, with and without lipid vesicles, consistent with PRE-induced broadening of the signals. Membrane permeating molecules like indole and ethanol, and to a lower extent glycerol and HCT, on the other hand, showed the opposite. While in the absence of vesicles Mn2+ or Gd3+ induced line broadening, in the presence of vesicles we saw a lower decrease or a relative increase in the signal intensities upon the addition of Mn2+ or Gd3+ (Fig. 2(A)–(F)).
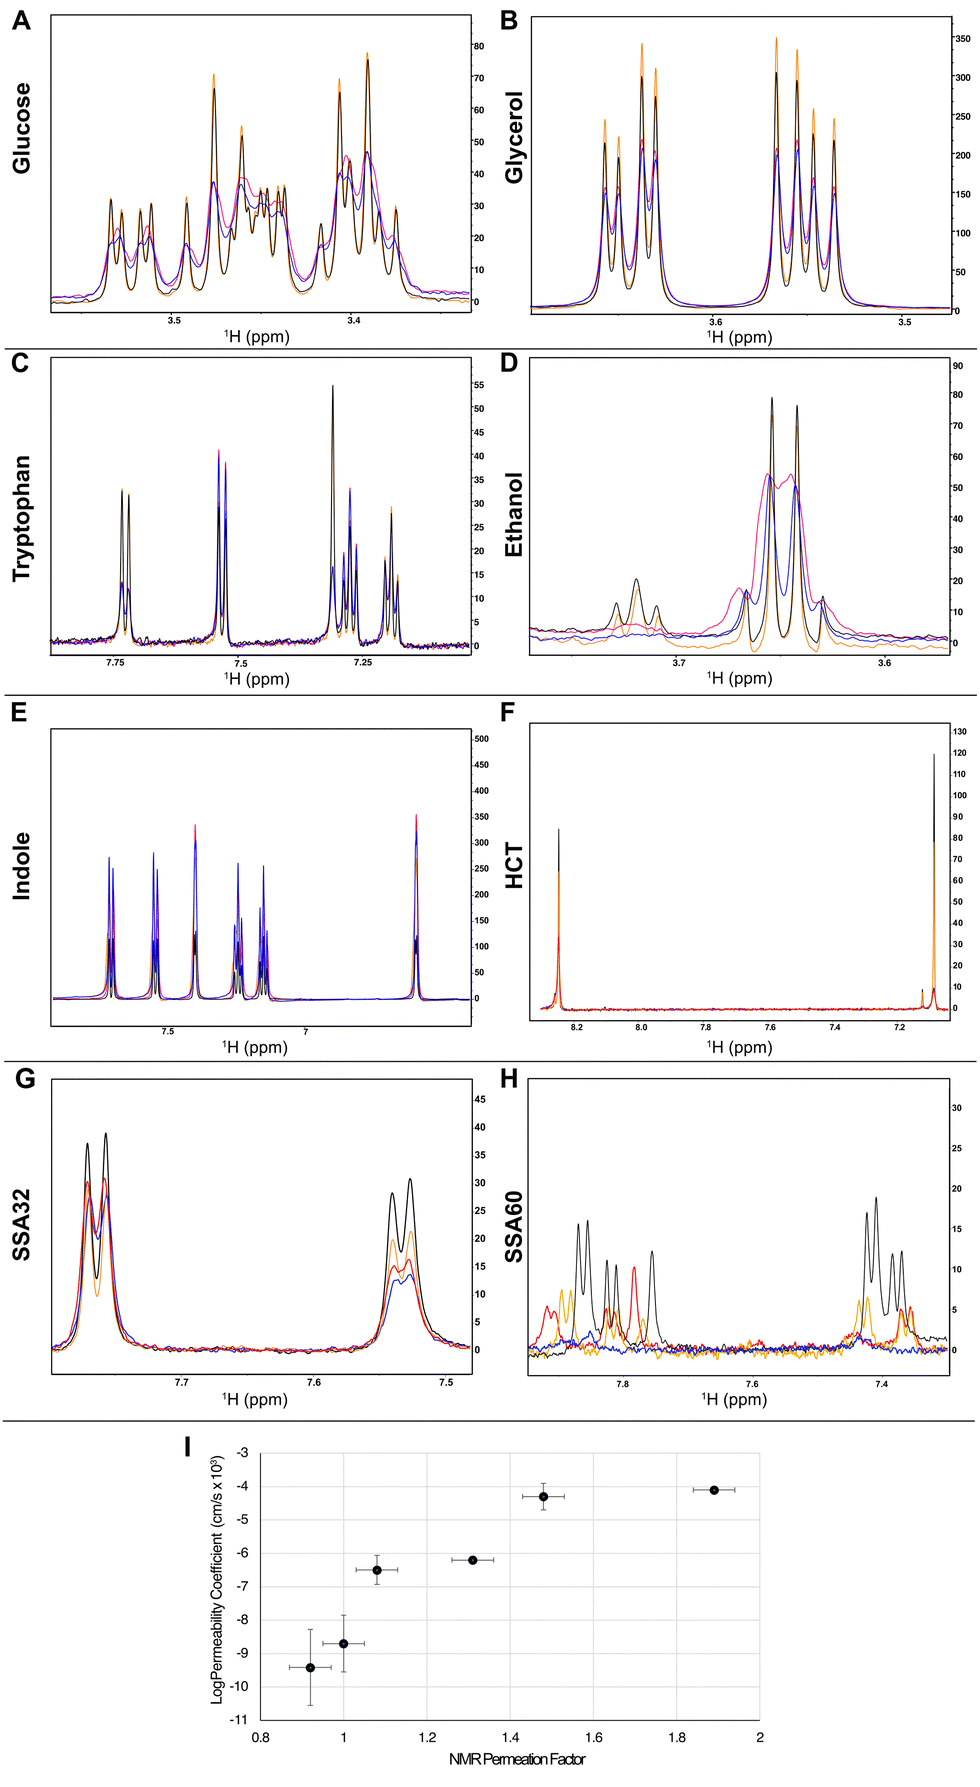 | ||
Fig. 2 Proton 1D CPMG NMR spectra collected with a spin-lock time of 150 ms in the absence (black, blue) and presence (orange, red) of 1.1 mg mL−1E. coli lipid vesicles without (black, orange) and with (blue, red) the addition of 0.5 mM MnCl2 for the control compounds glucose (A), glycerol (B), tryptophan (C), ethanol (D), indole (E), hydrochlorothiazide (HCT) (F), and the compounds SSA32 (G) and SSA60 (H). Samples contained 200 μM of the SSA compounds ±1.1 mg mL−1 vesicles ±0.5 mM MnCl2 (0.5 mM gadodiamide for HCT). (I) Correlation plot between the NMR PF and average log![[thin space (1/6-em)]](https://www.rsc.org/images/entities/char_2009.gif) P values in the literature.13–16 Error bars represent the standard deviation between logP values in the literature and the spectrum noise. Only a single logP value was found for indole. P values in the literature.13–16 Error bars represent the standard deviation between logP values in the literature and the spectrum noise. Only a single logP value was found for indole. | ||
The effect of permeation rates on the PRE modulation of 1H intensities can be parametrised by comparing the intensity ratios of 1H resonances in 1H 1D NMR spectroscopy CPMG experiments with the same spin lock times with and without the solvent PRE in the presence and absence of lipid vesicles. A value of 1 implies no detectable permeation through the vesicles, and values higher than one imply the opposite (eqn (1) and Fig. 1(C)(ii)).
 | (1) |
This PF can be used to compare the permeability of different small molecules in vesicles of the same composition or to assess the permeability of a single small molecule in vesicles with different lipid compositions (i.e. extracted from different cell strains), see Table 1. Since the PF reports on the degree of passive permeation through individual vesicles, PF measurements are not dependent on the incubation times of compounds and vesicles, as seen in Tables S1 and S2 (ESI†), speeding up the total assay time (Fig. S2–S5, ESI†).
Similarly, the intensity ratio between 1H resonances in 1H 1D NMR spectroscopy CPMG experiments with the same spin lock times in the presence and absence of lipid vesicles reports on the degree of adhesion between small molecules and the membrane. A value of 1 signifies no detectable membrane adhesion and a value below 1 indicates detectable membrane adhesion (eqn (2) and Fig. 1(C)(i)), with the affinity being related to the CPMG spin-lock time at which the deviation from 1 is observed (Table 1).
 | (2) |
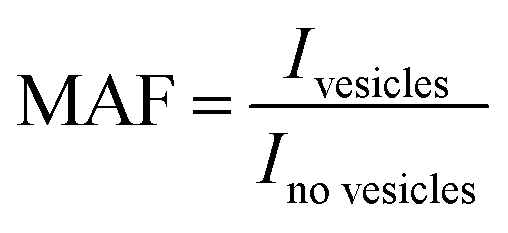
The membrane adhesion factor (MAF) depends on the intensity ratio of the 1H 1D CPMG NMR signals of small molecules in the presence and absence of vesicles.
It is important to note that the PF and MAF values rely on intensities extracted from the unbound ligand in the 1H 1D NMR CPMG spectra, and therefore the molecules studied must not fully self-associate in solution at the concentrations used for the assay. The degree of molecular self-association can be obtained easily through comparing the intensity ratio between the 1H 1D NMR CPMG spectra collected at 150 ms and 20 ms spin-lock times, with a value of 1 indicating no self-association and a value less than 1 indicating self-association (Fig. S186–S190, ESI†). In addition, elevations of the 1H 1D CPMG signal intensities for small molecules can result from both permeation and from membrane interactions, likely with the phospholipid headgroup region. Therefore, a comparison between the MAF, which is obtained in the absence of PRE, and the PF is needed.
We subsequently used this methodology to assess and classify the permeation rates and membrane-adhesion affinities of the control substances and a set of five SSA molecules (Fig. S1, ESI†), using vesicles prepared with the same E. coli lipids as those used previously for the control experiments (Fig. 2).
The intensity ratios of all aromatic peaks of indole and SSA compounds and the aliphatic peaks of glucose, collected in the absence or presence of lipid vesicles and solvent PRE, were used for the permeability analysis. The permeability and membrane adhesion factors for these molecules were calculated using eqn (1) and (2) (Table 1). Indole showed high PF and low MAF, indicative of high permeability and high membrane adhesion affinity. Glucose showed PFs below 1, consistent with its lack of membrane permeability, and MAF of 0.8, indicating a weak membrane adhesion affinity consistent with previous findings.17 Tryptophan, glycerol, HCT and ethanol showed PF values between those of glucose and indole, showing a good correlation with their published logP values (Fig. 2(I)), although the correlation between these data is impacted by differences in lipid composition between the assays conducted.
SSAs are amphiphilic compounds that present surfactant properties.18 Significant differences can be observed in the permeability of these SSA compounds. C60 shows the highest PF and MAF, resembling the properties of indole. C32 shows a PF 4-fold lower than that of C60, similar to glycerol, and no detectable membrane adhesion. C29, C30 and C57 show no detectable membrane permeation or adhesion. Previous studies18 revealed that C60 presented moderate lysis properties against phospholipid membranes extracted from E. coli, while C30 presented minimal lytic properties under analogous experimental conditions. These data support the results presented herein, C30 shows no evidence of membrane permeability properties, while the reverse is true for C60. This not only further validates the use of this methodology but also supports the hypotheses that the increased antimicrobial efficacy of SSAs correlates with their ability to disrupt cell membranes.
In conclusion, we present a new assay using solution NMR, a methodology accessible to most chemistry and biological laboratories, able to determine the membrane permeability and the degree of membrane adhesion of any mixture of small molecules with non-overlapping 1H NMR signals in as little as 20 minutes, providing simple structure–activity relationships.
The assay can be used with vesicles of any lipid composition, including lipids extracted from natural sources such as clinical isolates, and as a result support the generation of novel molecular weapons in the fight against AMR.
J. Hiscock would like to thank UKRI for the funding of her Future Leaders Fellowship (MR/T020415/1). J. Ortega-Roldan would also like to thank The Royal Society for funding (RGS\R1\191414) and Lorena Varela (University of Kent) for manuscript revision.
Data availability
The data supporting this article have been included as part of the ESI.†Conflicts of interest
There are no conflicts to declare.Notes and references
- M. Kansy, F. Senner and K. Gubernator, J. Med. Chem., 1998, 41(7), 1007–1010 CrossRef CAS PubMed.
- R. B. Van Breemen and Y. Li, Expert Opin. Drug Metab. Toxicol., 2005, 1, 175–185 CrossRef CAS PubMed.
- S. He, A. Zhiti, A. Barba-Bon, A. Hennig and W. M. Nau, Front. Chem., 2020, 8, 597927 CrossRef CAS PubMed.
- K. L. F. Hilton, C. Manwani, J. E. Boles, L. J. White, S. Ozturk, M. D. Garrett and J. R. Hiscock, Chem. Sci., 2021, 12(40), 13273–13282 RSC.
- C. J. Murray, K. S. Ikuta, F. Sharara, L. Swetschinski, G. Robles Aguilar, A. Gray, C. Han, C. Bisignano, P. Rao, E. Wool, S. C. Johnson, A. J. Browne, M. G. Chipeta, F. Fell, S. Hackett, G. Haines-Woodhouse, B. H. Kashef Hamadani, E. A. P. Kumaran, B. McManigal, R. Agarwal, S. Akech, S. Albertson, J. Amuasi, J. Andrews, A. Aravkin, E. Ashley, F. Bailey, S. Baker, B. Basnyat, A. Bekker, R. Bender, A. Bethou, J. Bielicki, S. Boonkasidecha, J. Bukosia, C. Carvalheiro, C. Castañeda-Orjuela, V. Chansamouth, S. Chaurasia, S. Chiurchiù, F. Chowdhury, A. J. Cook, B. Cooper, T. R. Cressey, E. Criollo-Mora, M. Cunningham, S. Darboe, N. P. J. Day, M. De Luca, K. Dokova, A. Dramowski, S. J. Dunachie, T. Eckmanns, D. Eibach, A. Emami, N. Feasey, N. Fisher-Pearson, K. Forrest, D. Garrett, P. Gastmeier, A. Z. Giref, R. C. Greer, V. Gupta, S. Haller, A. Haselbeck, S. I. Hay, M. Holm, S. Hopkins, K. C. Iregbu, J. Jacobs, D. Jarovsky, F. Javanmardi, M. Khorana, N. Kissoon, E. Kobeissi, T. Kostyanev, F. Krapp, R. Krumkamp, A. Kumar, H. H. Kyu, C. Lim, D. Limmathurotsakul, M. J. Loftus, M. Lunn, J. Ma, N. Mturi, T. Munera-Huertas, P. Musicha, M. M. Mussi-Pinhata, T. Nakamura, R. Nanavati, S. Nangia, P. Newton, C. Ngoun, A. Novotney, D. Nwakanma, C. W. Obiero, A. Olivas-Martinez, P. Olliaro, E. Ooko, E. Ortiz-Brizuela, A. Y. Peleg, C. Perrone, N. Plakkal, A. Ponce-de-Leon, M. Raad, T. Ramdin, A. Riddell, T. Roberts, J. V. Robotham, A. Roca, K. E. Rudd, N. Russell, J. Schnall, J. A. G. Scott, M. Shivamallappa, J. Sifuentes-Osornio, N. Steenkeste, A. J. Stewardson, T. Stoeva, N. Tasak, A. Thaiprakong, G. Thwaites, C. Turner, P. Turner, H. R. van Doorn, S. Velaphi, A. Vongpradith, H. Vu, T. Walsh, S. Waner, T. Wangrangsimakul, T. Wozniak, P. Zheng, B. Sartorius, A. D. Lopez, A. Stergachis, C. Moore, C. Dolecek and M. Naghavi, Lancet, 2022, 399, 629–655 CrossRef CAS PubMed.
- D. Benedetto Tiz, D. Kikelj and N. Zidar, Expert Opin. Drug Discovery, 2018, 13, 497–507 CrossRef CAS PubMed.
- R. J. Ferreira and P. M. Kasson, ACS Infect. Dis., 2019, 5, 2096–2104 CrossRef CAS PubMed.
- J. E. Boles, G. T. Williams, N. Allen, L. J. White, K. L. F. Hilton, P. I. A. Popoola, D. P. Mulvihill and J. R. Hiscock, Adv. Ther., 2022, 5(5), 2200024 CrossRef CAS.
- N. Allen, L. J. White, J. E. Boles, G. T. Williams, D. F. Chu, R. J. Ellaby, H. J. Shepherd, K. L. Kendrick, L. R. Blackholly, B. Wilson, D. P. Mulvihill and J. R. Hiscock, ChemMedChem, 2020, 15(22), 2193–2205 CrossRef CAS PubMed.
- J. T. Davis, P. A. Gale, O. A. Okunola, P. Prados, J. C. Iglesias-Sánchez, T. Torroba and R. Quesada, Nat. Chem., 2009, 1, 138–144 CrossRef CAS PubMed.
- F. A. A. Mulder, L. Tenori and C. Luchinat, Angew. Chem., Int. Ed., 2019, 58, 15283–15286 CrossRef CAS PubMed.
- H. Y. Carr and E. M. Purcell, Phys. Rev., 1954, 94(3), 630 CrossRef CAS.
- A. Finkelstein, J. Gen. Physiol., 1980, 75, 427–436 CrossRef.
- W. D. Stein and W. R. Lieb, Transport and diffusion across cell membranes, Academic Press, 1986 Search PubMed.
- S. Paula, A. G. Volkov, A. N. Van Hoek, T. H. Haines and D. W. Deamer, Biophys. J., 1996, 70, 339 CrossRef CAS PubMed.
- R. C. Bean, W. C. Shepherd and H. Chan, J. Gen. Physiol., 1968, 52, 495 CrossRef CAS PubMed.
- H. D. Andersen, C. Wang, L. Arleth, G. H. Peters and P. Westh, Proc. Natl. Acad. Sci. U. S. A., 2011, 108, 1874–1878 CrossRef CAS PubMed.
- J. E. Boles, C. Bennett, J. Baker, K. L. F. Hilton, H. A. Kotak, E. R. Clark, Y. Long, L. J. White, H. Y. Lai, C. K. Hind, J. M. Sutton, M. D. Garrett, A. Cheasty, J. L. Ortega-Roldan, M. Charles, C. J. E. Haynes and J. R. Hiscock, Chem. Sci., 2022, 13, 9761–9773 RSC.
Footnotes |
| † Electronic supplementary information (ESI) available. See DOI: https://doi.org/10.1039/d4cc01515k |
| ‡ These authors contributed equally to this work. |
| This journal is © The Royal Society of Chemistry 2024 |