 Open Access Article
On-line generated ozone as a reactive cell gas for tandem quadrupole inductively coupled plasma mass spectrometry†
Yanbei
Zhu
 *
*
National Metrology Institute of Japan, National Institute of Advanced Industrial Sciences and Technology, 1-1-1 Umezono, Tsukuba, Ibaraki 305-8563, Japan. E-mail: yb-zhu@aist.go.jp
First published on 13th March 2024
Abstract
On-line generated ozone was introduced as the cell gas of tandem quadrupole inductively coupled plasma mass spectrometry. Product ions of the ozone reaction showed that the formation of singly charged monoxide ions and dioxide ions was apparently improved for most elements, resulting in maximum improvement of the signal intensity by over 1000 times.
Tandem quadrupole inductively coupled plasma mass spectrometry (ICP-QMS/QMS) has excellent capability for separating spectral interferences with the sensitivity independent of mass resolution. Oxygen is usually used as the reaction gas for measuring Si, Se, P, S, As, and rare earth elements at so-called mass-shift modes.1–7 In these measurements, an ion of interest mM+ was permitted to pass through the first quadruple and to enter the reaction cell. After reaction with oxygen, a monoxide ion mM16O+ was obtained and permitted to pass through the second quadruple and counted by the detector. For these elements, oxygen reaction is sufficient for the mass-shift of mM+ → mM16O+ for the elements mentioned above due to the exothermic reaction. However, application of the oxygen reaction to other elements is quite limited due to the endothermic reaction for their mass-shift.
As a more reactive cell gas for ICP-QMS/QMS, nitrous oxide was investigated for the measurement of various elements, such as rare earth elements, Cl, P, Ra, S, Si, and Sr.8–13 There are also reports of using other gases to improve reactions in the reaction cell of ICP-QMS/QMS; for example, carbonyl sulfide and carbon dioxide, respectively.14,15 These works showed that selecting a more reactive cell gas helps in improving spectral interferences. In the present work, on-line generated ozone was introduced as a new reactive cell gas for ICP-QMS/QMS, aiming to improve the chemical reactions in the cell and to avoid using poisonous nitrous oxide gas.
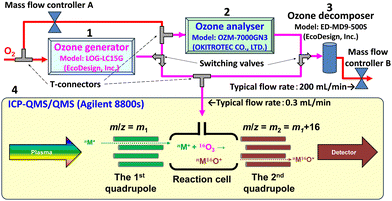
The system established in the present work is illustrated in Fig. 1. Notably, switching of the values in Fig. 1 is shown for the introduction of ozone gas to the ICP-QMS/QMS system, and the positions of the switching valves for ozone analysis can be found in Fig. S1 (ESI†). For all the instruments (1 to 4), the switching valves (made of perfluoroalkoxy alkanes (PFA)), connectors (made of PFA), and mass flow controllers (O2, 2 L min−1) are commercially available. Tubes connecting the instruments are made of PFA with 1.0 mm inner diameter and 3.0 mm outer diameter. Mass flow controller A is used to dilute the high concentration ozone prior to the measurement by the ozone analyser (2), while mass flow controller B is used to control the flow rate of O2 supplied to the ozone generator (1). Mass flow controller B is set downstream of the ICP-QMS/QMS system (4) to keep the gas pressure supplied to the reaction cell. The ozone decomposer (3) at the upper stream of mass flow controller B protects it from corrosion by ozone. In the present system, on-line generated ozone was introduced to the ICP-QMS/QMS system as a reaction gas at a typical flow rate of 0.3 mL min−1 through the 4th cell gas line initially used for introducing oxygen. Extra ozone was discharged as oxygen after decomposition.
The dependence of ozone concentration on the flow rate of oxygen supplied to the ozone generator was investigated to achieve high concentration ozone gas, for which the results are plotted in Fig. 2a. It can be seen that reproducible and high concentration of ozone (approximately 450 g m−3, gauge pressure 0.1 MPa) can be achieved at an oxygen flow rate of 200 mL min−1.
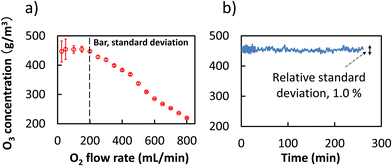 | ||
| Fig. 2 (a) Dependence of ozone concentration on oxygen flow rate, and (b) stability of the concentration of ozone, O2 flow rate 200 mL min−1. | ||
When the flow rate of oxygen exceeded 200 mL min−1, the concentration of ozone decreased in negative correlation with the flow rate of oxygen. This can be attributed to the dilution effect of overdosed oxygen supply. The instability (large standard deviation) of ozone concentration at lower oxygen flow rate under 200 mL min−1 might be attributed to the mismatching of the flow rate with that of the ozone analyser rather than the instability of the ozone generator at a lower oxygen flow rate. Since the flow rate for the cell gas to an ICP-QMS/QMS system is usually under 10 mL min−1, optimization of ozone generation at 200 mL min−1 O2 flow rate was sufficient for the present work.
The results of a stability test covering 250 min showed a relative standard deviation under 1.0% (Fig. 2b). This is sufficiently stable for use as a cell gas in the ICP-QMS/QMS system, which usually provides a measurement with a relative standard deviation of approximately 1% or higher. On-line generated ozone was separated into two branches with a T-connector, one of which was introduced to the reaction cell of the ICP-QMS/QMS system, while the other was connected to a catalytic ozone decomposition device. The flow rate of ozone to the reaction cell of the ICP-QMS/QMS system was controlled using a built-in mass flow controller, while the flow rate to the decomposition device was controlled using mass flow controller B at the under stream. It is notable that the ozone gas used in the present work is approximately 10.5% O3 (v/v) in an O2 matrix, simply referred to as “ozone” in the following text. In addition, the excess ozone gas was transferred to oxygen by the decomposer and discharged as oxygen, providing a green and reactive cell gas for the ICP-QMS/QMS system.
Operating conditions for the ICP-QMS/QMS system were optimized using a tuning solution (Li, Co, Y, Ce, and Tl, 1.0 ng mL−1 each in 2% HNO3). Typical parameters are as follows: radio frequency power, 1500 W; sampling depth, 8.0 mm from the load coil; plasma gas flow rate, 14.0 L min−1 argon; carrier gas flow rate, 0.80 L min−1 argon; makeup gas flow rate, 0.45 L min−1 argon; extraction l lens, −1.8 V; extraction 2 lens, −205 V; omega bias lens, −165 V; omega lens, 23.5 V; cell gas flow rate, 0.3 mL min−1; octopole reaction cell inlet, −50 V; octopole reaction cell outlet, −70 V; octopole bias, −5.0 V; deflecting lens, 3.8 V; energy discrimination, −7.0 V; and integration time, 0.1 s.
The signal intensity of 66Zn was representatively monitored to confirm the shifting of the reaction gas from oxygen to ozone, for which the results are plotted in Fig. 3. It can be seen that the signal intensity of 66Zn+ → 66Zn+ (the mass to charge ratio values, i.e. m/z, of both quadruples set to 66) decreased apparently with the shifting from oxygen to ozone. By contrast, the signal intensity of 66Zn+ → 66Zn16O+ (m/z values set to 66 and 82, respectively, for the first quadrupole and the second one) increased significantly by approximately 100 times. These results showed that the introduction of ozone as the reaction gas improved the signal intensity for measuring Zn at mass-shift mode to monoxide ion.
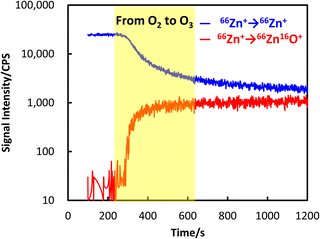 | ||
| Fig. 3 Transient signal intensities of zinc measured by ICP-QMS/QMS during switching the reaction gas from oxygen to ozone. Cell gas flow rate, 0.3 mL min−1; test sample, 1.0 ng mL−1 Zn in 2% HNO3. | ||
Furthermore, a comprehensive investigation about product ions was conducted for most natural elements in the periodic table, with oxygen and ozone, respectively, as the reaction gases.
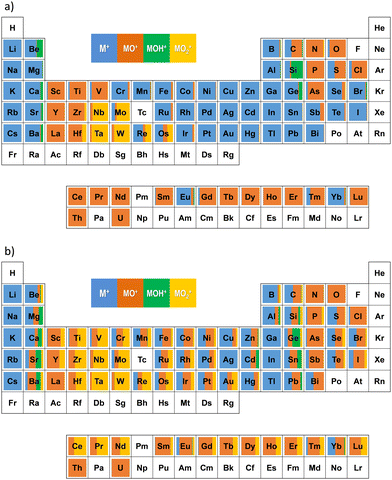
The results obtained with oxygen and ozone are illustrated in Fig. 4a and b, respectively. As indicated in the figures, the shares of M+, MO+, MOH+, and MO2+ are obtained and plotted in blue, orange, green, and yellow, respectively. The percentages of the product ions are also summarized in Table S1 (ESI†).
It can be seen from Fig. 4a and b that MO+ can be achieved for much more elements with ozone as the cell gas than those obtained with oxygen. Notably MO+ and MO2+ can be achieved for each alkaline earth metal with ozone reaction, capable of applications in separating spectral interferences with neighbouring alkali metals, for example, 87Sr16O+ from 87Rb+ and 137Ba16O+ from 137Cs+.
With ozone reaction, MO+ and MO2+ can be achieved for most transition metals, double the number achievable with oxygen reaction (treating lanthanides as a group). The shares of EuO+ and YbO+ were improved significantly with ozone reaction, too.
As shown in the right side of the periodic table, ozone reaction also improved the shares of MO+ and MO2+ for Si, Ge, Sn, Pb, Sb, Bi, Se, Te, Br, and I, respectively. These results indicate that mass-shift measurement (M+ → MO+) can be applied to these elements when ozone was used as the cell gas.
It is notable that the results for the mass-shift measurements obtained with ozone as the cell gas in the present work roughly showed similar trends of the reactions in the periodic table to those observed with N2O as the cell gas reported by Lancaster et al.8 It can be expected that on-line generated ozone can be an alternative of N2O as the cell gas, free from the management of a poisonous gas. In addition, because ozone is a pure substance of oxygen, while N2O is a compound of nitrogen and oxygen, it can be expected that the reaction between an ion and ozone will be better controlled with much less multi-atomic clusters, resulting in relatively higher sensitivity for the measurement.
The ratios of signal intensities for the mass-shift measurements obtained with ozone to those with oxygen are plotted in Fig. 5a and b, for (M+ → MO+) and (M+ → MO2+), respectively.
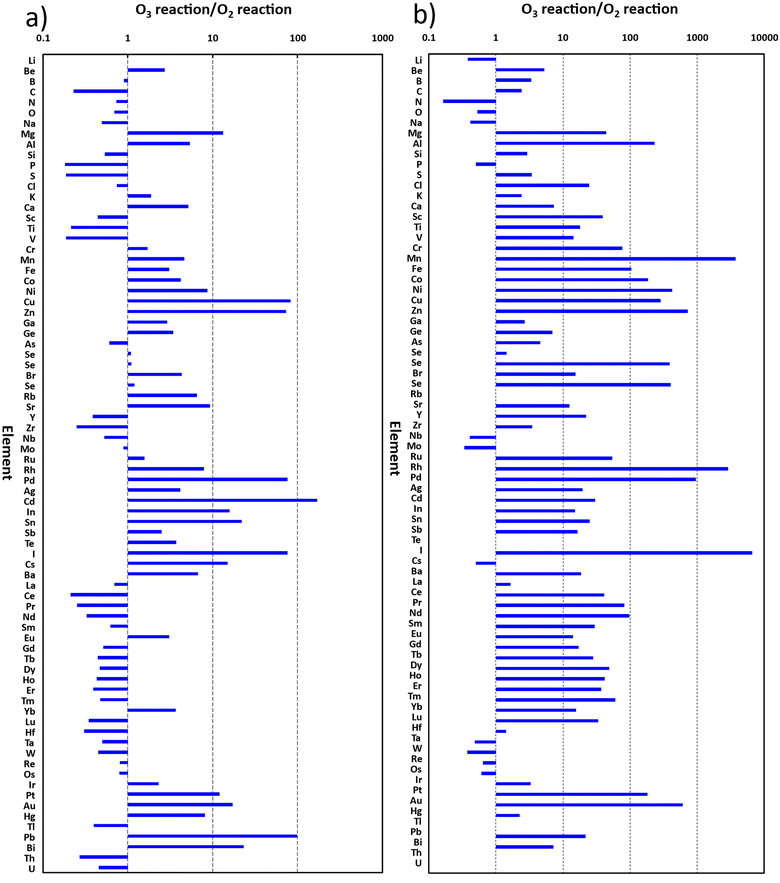 | ||
| Fig. 5 Ratios of signal intensities obtained with ozone reaction to those with oxygen reaction. (a) Measurement of M+ → MO+; (b) measurement of M+ → MO2+. | ||
It can be seen from Fig. 5a that 40 elements have ratios over 1.0, indicating better sensitivities for the measurements of (M+ → MO+) with ozone reaction than those with oxygen reaction. Especially for Mg, Cu, Zn, Pd, Cd, In, Sn, I, Cs, Pt, Au, Pb and Bi, the ratios were over 10, indicating substantial improvement of sensitivity. Notably, the ratio for Cd even exceeded 100.
Meanwhile, the results plotted in Fig. 5b show that 61 elements have ratios over 1.0 for the measurements of (M+ → MO2+), while 44 and 14 of them are over 10 and 100, respectively. Notably the ratios for Mn, Rh, and I were even over 1000.
These results showed that ICP-QMS/QMS with on-line generated ozone as the cell gas has great potential for measurements of (M+ → MO+) and (M+ → MO2+) at much higher sensitivity than can be achieved with oxygen as the cell gas.
It is notable that the improvement of (M+ → MO+) and (M+ → MO2+) means the suppression of (M+ → M+), i.e. the so-called on-mass measurements of the elements will result in a decrease in signal intensity. Nevertheless, the elements that showed rare reactions with ozone can be measured with on-mass mode at a signal intensity comparable to those obtained with oxygen as the reaction gas.
The present work just showed results for a comprehensive investigation on elements in the periodic table, while the operating conditions were optimized for general analysis but not for each single element of interest. The signal to background ratio perhaps is not proportional to the results of signal intensity given in Fig. 5.
Further and systematic studies on specific elements are in progress and will be presented soon, including but not limited to the separation of 40Ca+ from 40Ar+, 87Sr+ from 87Rb+, 137Cs+ from 137Ba+, 129I+ from 129Xe+, and so on.
This work was supported by JSPS KAKENHI (grant number 22K05181).
Conflicts of interest
There are no conflicts to declare.Notes and references
- N. Kroepfl, T. A. Marschall, K. A. Francesconi, T. Schwerdtle and D. Kuehnelt, J. Anal. At. Spectrom., 2017, 32, 1571–1581 RSC.
- A. Gourgiotis, T. Ducasse, E. Barker, P. Jollivet, S. Gin, S. Bassot and C. Cazala, Anal. Chim. Acta, 2017, 954, 68–76 CrossRef CAS PubMed.
- D. P. Bishop, D. Clases, F. Fryer, E. Williams, S. Wilkins, D. J. Hare, N. Cole, U. Karst and P. A. Doble, J. Anal. At. Spectrom., 2016, 31, 197–202 RSC.
- B. P. Jackson, J. Anal. At. Spectrom., 2015, 30, 1405–1407 RSC.
- D. P. Bishop, D. J. Hare, F. Fryer, R. V. Taudte, B. R. Cardoso, N. Cole and P. A. Doble, Analyst, 2015, 140, 2842–2846 RSC.
- N. Kroepfl, K. A. Francesconi, T. Schwerdtle and D. Kuehnelt, J. Anal. At. Spectrom., 2019, 34, 127–134 RSC.
- Y. B. Zhu, Talanta, 2020, 209, 120536 CrossRef CAS PubMed.
- S. T. Lancaster, T. Prohaska and J. Irrgeher, J. Anal. At. Spectrom., 2023, 38, 1135–1145 RSC.
- L. Fu, G. S. Huang, Y. B. Hu, X. H. Chen, J. F. Wang and F. S. Pan, Anal. Chem., 2023, 95, 4950–4956 CrossRef CAS PubMed.
- Y. B. Zhu, Front. Chem., 2022, 10, 912938 CrossRef CAS PubMed.
- K. Harouaka, C. Allen, E. Bylaska, R. M. Cox, G. C. Eiden, M. L. di Vacri, E. W. Hoppe and I. J. Arnquist, Spectrochim. Acta, Part B, 2021, 186, 106309 CrossRef CAS.
- D. T. Murphy, C. M. Allen, O. Ghidan, A. Dickson, W. P. Hu, E. Briggs, P. W. Holder and K. F. Armstrong, Rapid Commun. Mass Spectrom., 2020, 34, e8604 CrossRef CAS PubMed.
- F. M. Wærsted, K. A. Jensen, E. Reinoso-Maset and L. Skipperud, Anal. Chem., 2018, 90, 12246–12252 CrossRef PubMed.
- A. D. French, K. M. Melby, R. M. Cox, E. Bylaska, G. C. Eiden, E. W. Hoppe, I. J. Arnquist and K. Harouaka, Spectrochim. Acta, Part B, 2023, 207, 106754 CrossRef CAS.
- M. Matsueda, J. Aoki, K. Koarai, M. Terashima and Y. Takagai, Anal. Sci., 2022, 38, 1371–1376 CrossRef CAS PubMed.
Footnote |
| † Electronic supplementary information (ESI) available: Fig. S1 and Table S1 are provided as supporting information. See DOI: https://doi.org/10.1039/d4cc00636d |
| This journal is © The Royal Society of Chemistry 2024 |

