
 Open Access Article
 This Open Access Article is licensed under a Creative Commons Attribution-Non Commercial 3.0 Unported Licence
An NIR-emitting cyanine dye with pyridinium groups: the impact of regio-bond connection on the photophysical properties†
Yonghao
Li
a,
Matthew A.
Tuttle
b,
Qin
Liu
b and
Yi
Pang
 *a
*a
aDepartment of Chemistry, University of Akron, Akron, Ohio 44325, USA. E-mail: yp5@uakron.edu
bDepartment of Biology, University of Akron, Akron, Ohio 44325, USA
First published on 2nd February 2024
Abstract
Two ESIPT-based isomeric cyanines were synthesized with significant bathochromic shift in the optical absorption λabs and emission λem, along with a very large Stokes shift. Probe 2 exhibited a longer conjugation and better photostability. Both compounds exhibited good selectivity for labeling the plasma membrane of prokaryotic cells and the hair cells of zebrafish.
Hearing disorders or deafness are common diseases that can be age-related, or noise- or certain ototoxic drug-induced.1,2 In the U.S., about 1 in every 8 individuals in the working population have hearing difficulty.3 Most hearing loss is related to the irreversible damage of sensory hair cells in the inner ear,4,5 which is often induced by exposure to loud noises6 or certain chemicals/drugs that can kill the hair cells in the inner ear. Management of hearing loss requires identification of methods that can stimulate hair cell regeneration in mammals. Due to the limited ability for mammals to regenerate sensory hair cells,7 there is significant interest in studying the sensory hair cells of non-mammalian vertebrates such as zebrafish, whose hair cells can be readily regenerated after damage.8–14 Recently, zebrafish have been recognized as an excellent animal model to study hair cell development and regeneration, as the zebrafish lateral line opens the gate to identifying the complex signaling events triggered by injury and regeneration.4,5,7,15–17
Zebrafish lateral line hair cells are located in the center of a mechanosensory organ known as the neuromast, where the hair cells are surrounded by inner support cells and an outer ring of mantle cells4,5,18 (Fig. 1). Neuromasts can be marked by specific fluorescent dyes such as 4-Di-2-ASP.19–21 Development of improved imaging methods is desirable to aid these studies.
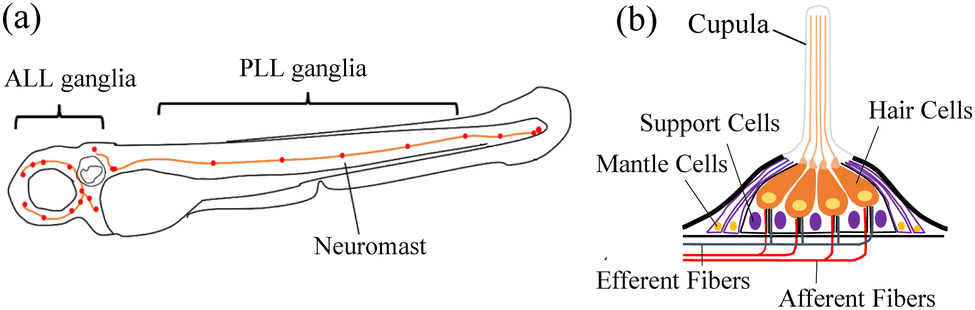 | ||
| Fig. 1 Zebrafish lateral line neuromasts. (a) Schematic depicting a larval zebrafish. Red patches indicate the location of neuromasts in the lateral line (LL) system. Orange patches represent the location of the anterior (ALL) and posterior (PLL) LL ganglia. (b) A side view of a single LL neuromast structure. | ||
Excited state intramolecular proton transfer (ESIPT) has emerged to be a powerful strategy in designing fluorescent molecular probes, as they often exhibit unusually large Stokes shifts (Δλ ≥ 150 nm) and dual emission for ratiometric sensing. However, the majority of known ESIPT-based sensors give green-red emission, with very few giving near-infrared emission (NIR-I, 650–950 nm) that is desirable for imaging applications (especially for in vivo). Despite recent progress, it remains a challenge to tune the emission of this class of materials to well above 700 nm. In an effort to search for new dyes with improved optical characteristics, we recently reported that probe 1 with a pyridinium terminal group can label neuromast hair cells on wild type zebrafish.22,23 Due to the presence of excited state intramolecular proton transfer (ESIPT), probe 1 exhibits a large Stokes shift (Δλ ∼ 260 nm) and a good quantum yield. In comparison with the styryl dye 4-Di-2-ASP (λem ≈ 590–610 nm, depending on the solvents), the emission of probe 1 occurs at a longer wavelength (λem ≈ 684 nm in CH2Cl2).22,23 We now report an improved version by synthesis of 2 and 3 that includes a furan group in the styryl pyridinium segment for extended π-conjugation (Scheme 1). Inclusion of the furan group effectively tunes the emission towards an even longer wavelength (to well above 700 nm) while retaining their cellular selectivity, making them even more attractive for imaging applications (e.g. neuromast labeling and staining of E. coli membranes).
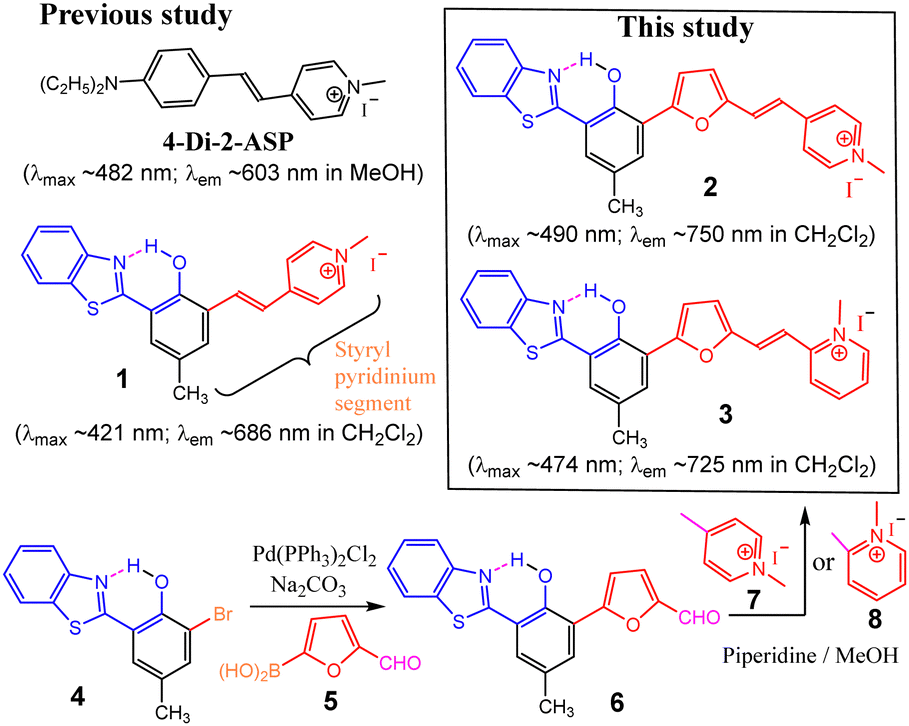 | ||
| Scheme 1 The structures of commercial styryl dye and ESIPT compounds, along with their absorption and fluorescence. | ||
Synthesis. Compounds 2 and 3 were synthesized via Suzuki coupling reaction in good yields. The products were characterized by 1H-NMR and 13C-NMR spectroscopy, and ESI-MS (see ESI,† Fig. S1–S9 for details).
Photophysical properties. In comparison with the styryl dye (4-Di-2-ASP) that has a small Stokes shift (Δλ ∼ 21 nm in CH2Cl2), the ESIPT dyes (1–3) revealed a quite large Stokes shift (Δλ > 250 nm in CH2Cl2) (Table 1).22–24 As a consequence of including the furan ring in the structure, the absorption and emission of 2 (λmax ∼ 490 nm, λem ∼ 750 nm in CH2Cl2) exhibited a significant bathochromic shift (by ∼70 nm) from 1 (λmax ∼ 421 nm, λem ∼ 686 nm in CH2Cl2). Interestingly, both 2 and 3 maintained reasonably high fluorescence (e.g. ϕfl ∼ 0.26 for 1 in CH2Cl2), which makes them suitable for imaging. In addition, the fluorescence quantum yield of 2 decreased dramatically in an aqueous medium (e.g., ϕfl ∼ 0.003 for 2), showing a large solvent effect (ESI,† Fig. S10–S13). Drastic fluorescence quenching in H2O would be useful for minimizing fluorescence background.
| DCM | DMSO | MeOH | H2O | MeCN | ||
|---|---|---|---|---|---|---|
| 1 | λ abs/nm | 421 | 395 | 401 | 392 | 397 |
| ε/M−1 cm−1 | 28![[thin space (1/6-em)]](https://www.rsc.org/images/entities/char_2009.gif) 133 133 |
35249 |
32984 |
29683 |
26103 |
|
| λ em/nm | 686 | 701 | 695 | 697 | 690 | |
| Φ fl | 0.34 | 0.25 | 0.18 | 0.06 | 0.19 | |
| 2 | λ abs/nm | 490 | 447 | 457 | 450 | 448 |
| ε/M−1 cm−1 | 42957 |
39128 |
65417 |
15410 |
41851 |
|
| λ em/nm | 750 | 790 | 770 | 770 | 770 | |
| Φ fl | 0.266 | 0.115 | 0.109 | 0.003 | 0.115 | |
| 3 | λ abs/nm | 474 | 437 | 445 | 440 | 436 |
| ε/M−1 cm−1 | 35445 |
36679 |
41811 |
25075 |
38521 |
|
| λ em/nm | 725 | 759 | 743 | 770 | 738 | |
| Φ fl | 0.183 | 0.180 | 0.165 | 0.009 | 0.172 | |
Interestingly, compounds 2 and 3 exhibit a minor fluorescence peak at 570–590 nm, especially in CH2Cl2 (Fig. 2), which is not present in compound 1.22,24 In addition, the relative intensity of the minor peak has no significant change over a wide concentration range (2–10 μM) (ESI,† Fig. S14 and S15). This minor fluorescence peak was not associated with H-aggregation, as its content was not increased in less concentrated solution.
In order to understand the origin of the observed minor fluorescence peaks, time-dependent density functional theory (TD-DFT) was used to calculate their UV-Vis and fluorescence spectra in CH2Cl2 (ESI,† Fig. S16–S19). The calculated absorption peaks from the enol forms of 2 and 3 were at 490 nm and 474 nm (ESI,† Fig. S16 and S18), respectively, which matched well with their experimental values (λabs = 490 nm and 483 nm). The calculation also showed that the fluorescence of the enol forms of 2 and 3 were at 588 and 583 nm, respectively. The results thus pointed to the fact that the minor emission peaks observed at 570–590 nm (Fig. 2) could be attributed to the enol tautomer. The major emission peaks at ∼700 nm could be attributed to the keto form, in agreement with the ESIPT mechanism.23,25 The fluorescence spectra (Fig. 2) thus suggested that ESIPT remained to be a predominant process for new probes 2 and 3, giving major emission from their keto tautomer while having minor emission from the enol forms.
 | ||
| Fig. 2 UV-vis absorption (dotted line) and fluorescence spectra (solid line) of fluorescent dyes 2 (black), 3 (red) and 1 (blue) in DCM with a large Stokes shift. | ||
It should be noticed that the emission wavelength is dependent on the extent of intramolecular charge transfer (ICT) in their respective keto tautomer, which is enabled by ESIPT (Scheme 2).23,24 Thus, the emission of 2 would occur at a longer wavelength than that of its isomer 3, as the keto tautomer of the former (2′) had a more extended ICT interaction (involving two C![[double bond, length as m-dash]](https://www.rsc.org/images/entities/char_e001.gif) C bonds in the pyridinium ring, Scheme 2). This was further supported by a computational study, which revealed that 2 had a lower HOMO–LUMO energy gap than 3 (ESI,† Fig. S20), consistent with the experimental observation.
C bonds in the pyridinium ring, Scheme 2). This was further supported by a computational study, which revealed that 2 had a lower HOMO–LUMO energy gap than 3 (ESI,† Fig. S20), consistent with the experimental observation.
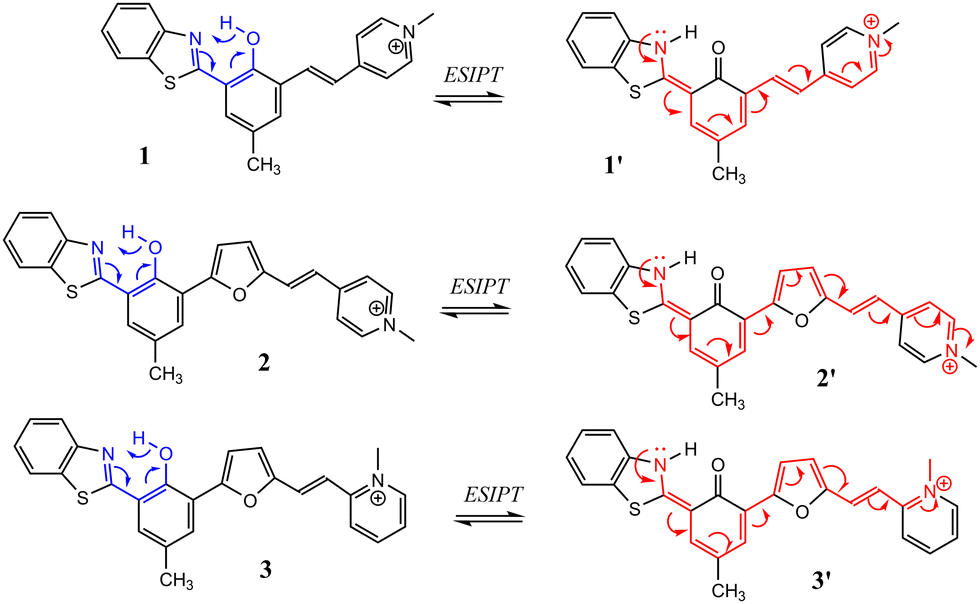 | ||
| Scheme 2 Schematic illustration of the formation of the keto form via excited state intramolecular proton transfer (ESIPT). And the intramolecular charge transfer. | ||
Compounds 2 and 3 generated a new peak at 550–580 nm and became non-fluorescent in the NIR range when pH > 7 (ESI,† Fig. S21–S25), as the deprotonation occurred to give aromatic anion Ar–OH → Ar–O−. With Boltzmann's fitting, the pKa values of 2 and 3 were determined to be similar at 6.6 and 6.5, respectively (ESI,† Fig. S23 and S26), which is notably different from that of 1 (pKa = 8.26). The phenolic proton in 2 and 3 becomes more acidic, induced by the furan group, which is in good agreement with the observed 1H NMR (δ = 13.31 ppm for the phenolic proton in DMSO).
In order to evaluate the photostability, the solution of 2 and 3 in CH2Cl2 was irradiated with a blue LED light (455–465 nm, 7000–8000 mcd), while the absorption spectrum was monitored at different time intervals. Interestingly, compound 2 exhibited significantly better stability than its isomer 3 (Fig. 3), under the same conditions. This result showed a large impact of regio-bond connection (ESI,† Fig. S27 and S28).
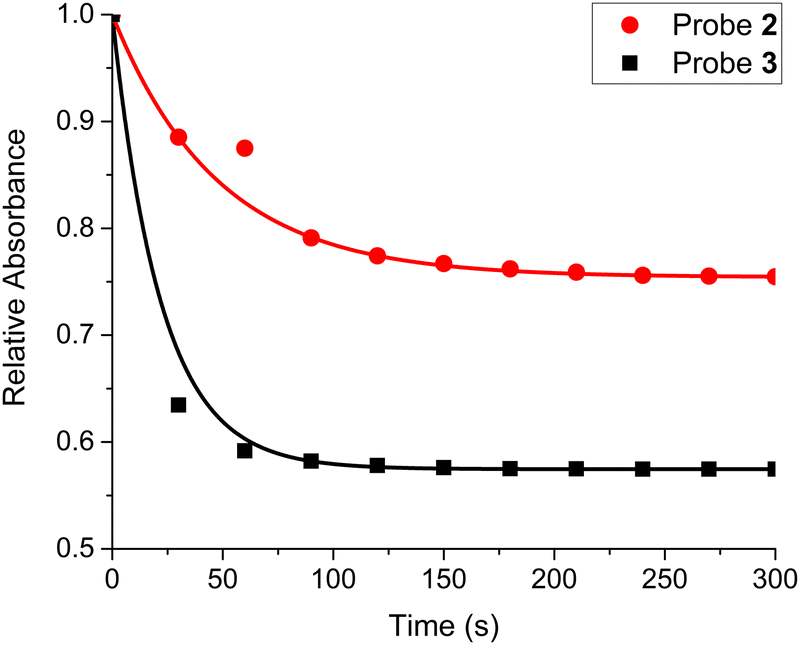 | ||
| Fig. 3 Comparison of photostability for 2 and 3 in DCM (10 μM), by monitoring the decay of λabs. | ||
The response of 2 and 3 to anionic and cationic species was also examined. Common metal cations such as Na+, K+, Co3+, Al3+, Ag+, Hg+, Pd2+, Zn2+, Mg2+, and Ni2+ exhibited basically no interference in both absorption and emission (ESI,† Fig. S29, S30, S33, S34). Biologically important anions, such as ATP, ADP, AMP, Br−, I−, HPO42− and citrate, were found not to interfere with the emission of probe 2. Although basic anions (e.g. PO43−, CO32− and acetate (OAc−)) were found to cause a significant change in absorption and fluorescence spectra (ESI,† Fig. S31 and S32), due to deprotonation of phenol, and they would have little impact on the potential imaging applications due to their low abundance in biological systems.
Bioimaging study. The presence of similar terminal groups as 1 encouraged us to examine new probes 2 and 3 for potential labeling of the E. coli cell membrane and hair cells on zebrafish (see ESI† for details, All animal related procedures were approved by the Institutional Animal Care and Use Committee at The University of Akron (D16-00501)).22,24 Thus, these new probes were used to stain E. coli cells. Clear fluorescence signals could be observed with low concentration of dye (1 μM) (Fig. 4(b) and (e)), showing that both probes exhibited good selectivity to stain the plasma membrane (Fig. 4(c) and (f)). In order to compare their relative stability, the stained E. coli cells (with 1 μM of 2 and 3) were continuously irradiated for two minutes (ESI,† Fig. S37). Interestingly, the cells stained with 2 retained 77% average fluorescence intensity, while those stained with 3 only have 56% intensity remaining. The observation indicated that 2 had better photostability than 3, which was consistently observed in CH2Cl2 (Fig. 3) and in H2O (ESI,† Fig. S39).
 | ||
| Fig. 4 Fluorescent confocal microscope images of E. coli cells stained with 1 μM compound 2 (a)–(c) and 3 (d)–(f) in TD (a) and (d), excitation/emission = 488/700 nm (b) and (e) and overlap (c) and (f) under magnification of 100× and digitally enhanced by 10 times. | ||
Compounds 2 and 3 were further used to investigate their potential imaging applications in zebrafish. When the probes were used to stain zebrafish embryos, nonuniform fluorescence signals were observed on the fish's body, indicating selective labeling (Fig. 5 and ESI,† Fig. S38). The labeling pattern by using 2 or 3 was comparable to that using 4-Di-2-ASP (Fig. 5(a)–(d) and ESI,† Fig. S38(a), (d)), showing selective labeling of neuromasts. Although the new probes were used in a lower concentration (10 μM) in comparison with 4-Di-2-ASP (50 μM), they gave comparable fluorescence intensity during the imaging study (Fig. 5 and ESI,† Fig. S38).26 Both probes labeled the central region of the neuromasts where hair cells are located. In summary, both 2 and 3 labeling were nearly identical with the commercial dye 4-Di-2-ASP (Fig. 5(d)–(f)). Probes 2 and 3 would be an attractive alternative to the commercial 4-Di-2-ASP for hair cell labeling, due to their attractive photophysical properties (e.g. large Stokes shift and NIR emission).
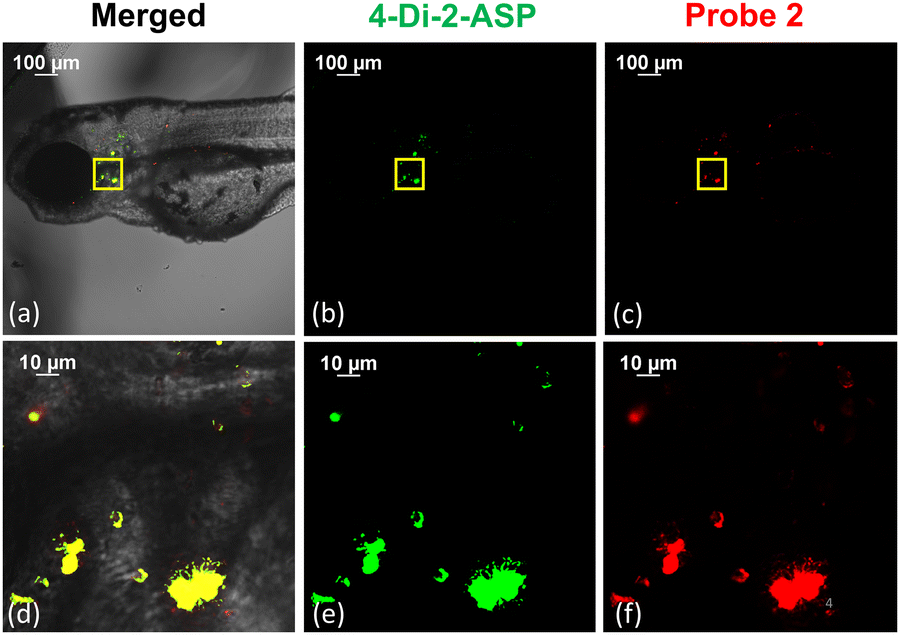 | ||
| Fig. 5 Confocal images of zebrafish embryos (72 hpf) labeled with 4-Di-2-ASP (b) and (e) and probe 2 (c) and (f), merged (a) and (d) under 10× (first row) and 100× (second raw) magnification. Excitation/emission = 488/595 nm for 4-Di-2-ASP, and excitation/emission = 488/700 nm for probe 2. | ||
Two NIR-emitting (>700 nm) ESIPT dyes 2 and 3 were synthesized in high yield, to examine the impact of a furan group in the styryl pyridinium segment. Inclusion of a furan ring in the styryl segment is found to extend π-conjugation effectively, while retaining the desired cellular selectivity for zebrafish neuromasts and E. coli membrane. The attractive optical properties of 2 (λabs ≈ 490 nm, λem ≈ 770 nm) make it a rare example of a NIR-emitting fluorophore that exhibits very large Stokes shift and high fluorescence (ϕfl ≈ 0.26 in CH2Cl2). Optical comparison between 2 and 3 reveals a moderate difference in the absorption and emission wavelengths, attributed to the impact of regio-bond connection on the pyridinium ring. This finding is further supported by the TD-DFT calculation.
Molecular imaging studies show that both probes 2 and 3 are useful for labeling the plasma membrane of prokaryotic cells and hair cells of zebrafish with good selectivity, although the former is found to be more photolytically stable. The study thus successfully demonstrates that new probe 2 could be an attractive candidate for imaging hair cells, due to its good cellular selectivity, NIR emission (λem ≈ 770 nm) with large Stokes shift, and improved photostability. Such an imaging tool could play an important role to aid the study of the regeneration of hair cells and screening/evaluation of ototoxic drugs.
Conceptualization, Y. P., methodology, Y. P., Y. L., formal analysis, Y. L. and Y. P., investigation, Y. L. and M. T., resources, Y. L. M. T. and Q. L., data curation, Y. L. Q. L. and Y. P., writing – original draft preparation, Y. L., writing – review and editing, Q. L. and Y. P., supervision, Y. P., funding acquisition, Y. P. All authors have read and agreed to the published version of the manuscript.
This research was financed by NIH (Grant no. 1R15GM126438-01A1). Y. P. also acknowledges partial support from Coleman Endowment from The University of Akron.
Conflicts of interest
There are no conflicts to declare.Notes and references
- N. Oishi and J. Schacht, Expert Opin. Emerging Drugs, 2011, 16, 235–245 CrossRef CAS PubMed.
- J. G. Yorgason, J. N. Fayad and F. Kalinec, Expert Opin. Drug Saf., 2006, 5, 383–399 CrossRef CAS PubMed.
- E. Kerns, E. A. Masterson, C. L. Themann and G. M. Calvert, Am. J. Ind. Med., 2018, 61, 477–491 CrossRef PubMed.
- M. E. Lush and T. Piotrowski, Dev. Dyn., 2014, 243, 1187–1202 CrossRef PubMed.
- L. Jiang, A. Romero-Carvajal, J. S. Haug, C. W. Seidel and T. Piotrowski, Proc. Natl. Acad. Sci. U. S. A., 2014, 111, E1383–E1392 CAS.
- S. W. Tak, R. R. Davis and G. M. Calvert, Am. J. Ind. Med., 2009, 52, 358–371 CrossRef PubMed.
- E. W. Rubel, S. A. Furrer and J. S. Stone, Hear. Res., 2013, 297, 42–51 CrossRef PubMed.
- M. E. Warchol, Hear. Res., 2011, 273, 72–79 CrossRef PubMed.
- B. C. Cox, R. Chai, A. Lenoir, Z. Liu, L. L. Zhang, D. H. Nguyen, K. Chalasani, K. A. Steigelman, J. Fang, A. G. Cheng and J. Zuo, Development, 2014, 141, 816–829 CrossRef CAS PubMed.
- J. C. Burns, B. C. Cox, B. R. Thiede, J. Zuo and J. T. Corwin, J. Neurosci., 2012, 32, 6570–6577 CrossRef CAS PubMed.
- J. C. Burns and J. T. Corwin, Hear. Res., 2013, 297, 52–67 CrossRef PubMed.
- O. Bermingham-McDonogh and E. W. Rubel, Curr. Opin. Neurobiol., 2003, 13, 119–126 CrossRef CAS PubMed.
- H. López-Schier and A. J. Hudspeth, Proc. Natl. Acad. Sci. U. S. A., 2006, 103, 18615–18620 CrossRef PubMed.
- E. Y. Ma, E. W. Rubel and D. W. Raible, J. Neurosci., 2008, 28, 2261–2273 CrossRef CAS PubMed.
- J. Liang, D. Wang, G. Renaud, T. G. Wolfsberg, A. F. Wilson and S. M. Burgess, J. Neurosci., 2012, 32, 10662–10673 CrossRef CAS PubMed.
- H. R. Brignull, D. W. Raible and J. S. Stone, Brain Res., 2009, 1277, 12–23 CrossRef CAS PubMed.
- K. N. Owens, D. E. Cunningham, G. Macdonald, E. W. Rubel, D. W. Raible and R. Pujol, J. Comp. Neurol., 2007, 502, 522–543 CrossRef CAS PubMed.
- E. Y. Ma and D. W. Raible, Curr. Biol., 2009, 19, R381–R386 CrossRef CAS PubMed.
- S. W. Chou, Z. Chen, S. Zhu, R. W. Davis, J. Hu, L. Liu, C. A. Fernando, K. Kindig, W. C. Brown, R. Stepanyan and B. M. McDermott, Nat. Commun., 2017, 8, 1–16 CrossRef CAS PubMed.
- P. P. Hernández, V. Moreno, F. A. Olivari and M. L. Allende, Hear. Res., 2006, 213, 1–10 CrossRef PubMed.
- A. B. Coffin, H. Brignull, D. W. Raible and E. W. Rubel, In The Laterial Line System, S. Coombs, H. Bleckmann, R.R. Fay, A. N. Popper, Eds., Springer New York, NY, 2014, pp. 313–347 Search PubMed.
- L. McDonald, D. Dahal, M. Konopka, Q. Liu and Y. Pang, Bioorg. Chem., 2019, 89, 103040 CrossRef CAS PubMed.
- Y. Li, D. Dahal, C. S. Abeywickrama and Y. Pang, ACS Omega, 2021, 6, 6547–6553 CrossRef CAS PubMed.
- D. Dahal, K. R. Ojha, N. Alexander, M. Konopka and Y. Pang, Sens. Actuators, B, 2018, 259, 44–49 CrossRef CAS.
- A. C. Sedgwick, L. Wu, H.-H. Han, S. D. Bull, X.-P. He, T. D. James, J. L. Sessler, B. Z. Tang, H. Tian and J. Yoon, Chem. Soc. Rev., 2018, 47, 8842–8880 RSC.
- L. Magrassi, D. Purves and J. W. Lichtman, J. Neurosci., 1987, 7, 1207–1214 CrossRef CAS PubMed.
Footnote |
| † Electronic supplementary information (ESI) available. See DOI: https://doi.org/10.1039/d3cc06189b |
| This journal is © The Royal Society of Chemistry 2024 |