
Structure prediction from spectra amidst dynamical heterogeneity in melanin†
Arpan
Choudhury
 a,
Raghunathan
Ramakrishnan
*b and
Debashree
Ghosh
*a
a,
Raghunathan
Ramakrishnan
*b and
Debashree
Ghosh
*a
aSchool of Chemical Sciences, Indian Association for the Cultivation of Science, Kolkata 700032, India. E-mail: pcdg@iacs.res.in
bTata Institute of Fundamental Research Hyderabad, Hyderabad 500046, India. E-mail: ramakrishnan@tifrh.res.in
First published on 18th January 2024
Abstract
Melanin is a biopolymer pigment that plays a central role in skin photoprotection. Its extensive chemical and dynamical heterogeneity imparts this property through a broad featureless ultraviolet/visible absorption spectrum. Conventionally, the rational design of synthetic photoprotective pigments revolves around establishing the structure-spectra correlation and developing biomimetic materials with desired optical properties. This approach fails to explain the mechanistic details of melanin's absorption spectrum because it arises from an ensemble of structures rather than a local minimum on the potential energy surface. Here, we propose an inverse design approach to elucidate the contributions of dominant chromophoric units in various wavelength domains of the melanin spectrum.
Melanin is a heterogeneous biological polymer with photoprotection as one of its major properties.1 There are various forms of melanin, among which eumelanin is the most effective photoprotective agent.2,3 It is composed of dihydroxyindole (DHI), dihydroxyindole carboxylic acid (DHICA) and their oxidized counterparts: mono-keto indole (MKI), di-keto indole (DKI), mono-keto indole carboxylic acid (MKICA) and di-keto indole carboxylic acid (DKICA) (Fig. 1a).4–6 These variations in constituents, oxidation states, oligomerization sites, and configurational diversity lead to an extensive heterogeneity rendering its electronic spectra featureless and broad with high quantum yields to absorb solar radiation across a wide range of wavelengths.7,8
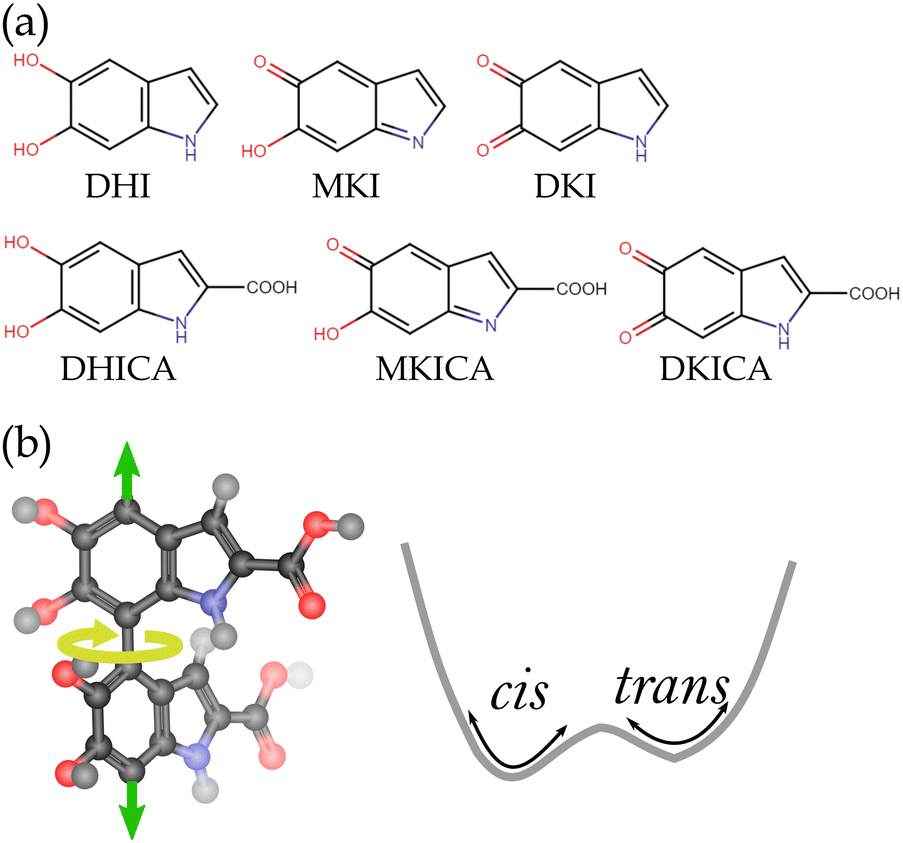 | ||
| Fig. 1 (a) Monomeric units of DHI melanin (upper panel) and DHICA melanin (lower panel). (b) Two adjacent monomers in DHICA melanin oligomers form cis–trans atropisomers due to hindered rotation about the marked (yellow arrow) dihedral angle. The green arrows indicate further oligomerization to form a linear chain. | ||
However, this heterogeneity presents a significant challenge in establishing individual constituents’ roles in skin photoprotection in various spectral regions. The conventional spectroscopic technique, used for structure determination, becomes prohibitive due to the absence of any localized features in the spectra. Furthermore, low solubility and difficulty in handling the material make experimental structure determination of melanin highly challenging.6,9–11 Given these challenges, one resorts to computational techniques. Kaxiras proposed a porphyrin-like tetrameric motif for DHI melanin.12 Chen constructed diverse model structures to simulate the broad nature of the eumelanin spectra.13,14 Furthermore, a few dimeric forms of DHICA melanin have been proposed.15 But there has yet to be a consensus about the size of the oligomers and the exact structural motifs responsible for absorption in different regions of the UV/visible spectra.
While the aforelisted computational studies have taken the direct approach of calculating the spectra given the structural motifs, the question relevant in melanin chemistry is to predict the structure given an absorption spectrum. Therefore, establishing a structure–property correlation in melanin is inherently an inverse design problem, i.e., prediction of structures from the spectra - which is the subject of this study. While there are some studies on DHI melanin, studies on DHICA melanin have been very few. In this work, we have therefore predicted the most critical chromophoric units of DHICA melanin and their three-dimensional structures, which are responsible for absorption in different wavelength ranges. We envisage this novel strategy to be helpful in engineering biomimetic materials with desired spectroscopic properties, i.e., strong absorption at the selected wavelength.
DHICA melanin is characterized by long strands due to linear oligomerization, whereas DHI melanin has lamellar structures.11 These long strands of DHICA have non-planar adjacent monomers leading to atropisomerism (Fig. 1b), unlike the planar oligomers of DHI.16,17 The presence of these atropisomers widens the conformational space making the spectral assignment difficult, but it also facilitates the reduction of chromophore length due to the localized electron density at the excited states. Finding the exact structural motifs in the vast conformational space remains outside the scope of traditional computational methods while being quite apt as a machine learning (ML) inverse design problem.18,19 However, the absorption in DHICA melanin not only arises from non-local structures but also different structural motifs which are active in various wavelength regions. Therefore, the problem addressed in this study is solving the inverse design problem of mapping electronic absorption spectra (a non-local property) to a heterogeneous chemical and conformational space of DHICA melanin. Here, the chemical space diversity arises from the monomers; different oxidation states and structural isomers form the oligomeric strands, while atropisomers span the conformational space.
The synergistic potential of ML and computational chemistry is utilized to uncover the heterogeneity in the spectra. By producing a detailed spectral map, we demonstrate how the various structures contribute to the different parts of the spectra within a 10 nm resolution. To achieve this, we used kernel-based ML models for their ability to learn sufficiently within the limited dataset available. The entire workflow for the data generation along with various steps involved in our modeling are depicted in Fig. 2 and the details are described in the Methods section of the ESI.†
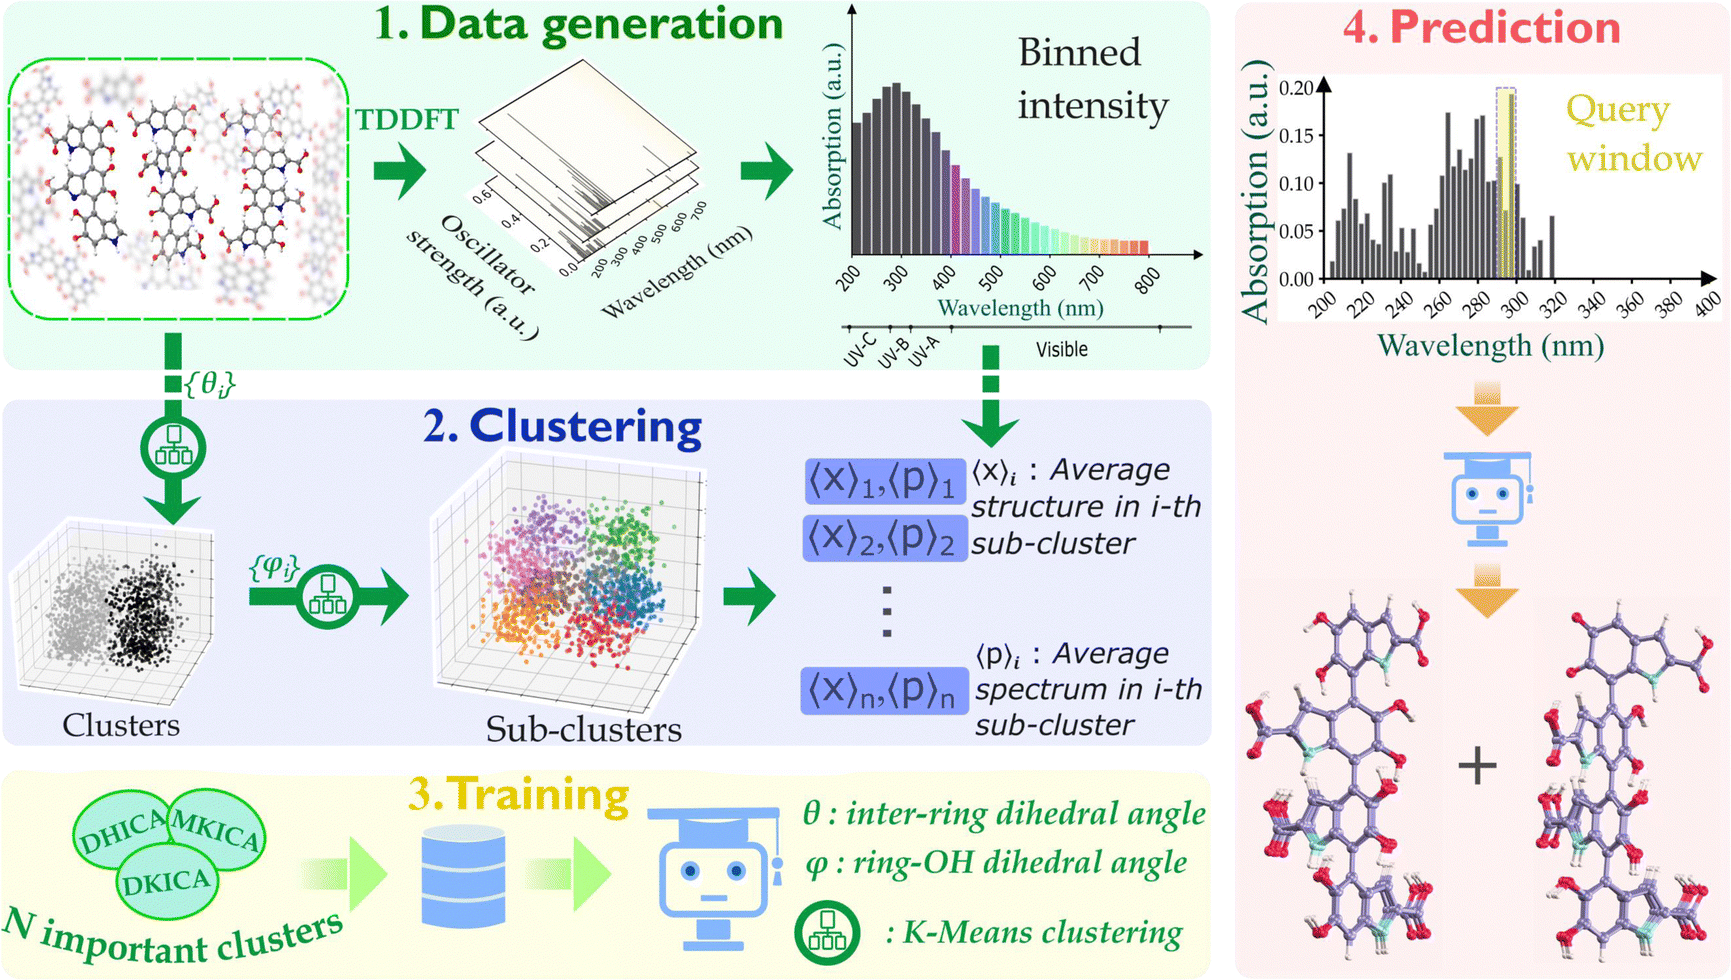 | ||
| Fig. 2 The dynamical structures of DHICA, MKICA, and DKICA were generated through molecular dynamics simulations (NVT, 300 K) and time-dependent density functional theory calculations of their UV-visible absorption spectra were performed. K-means clustering was used to identify unique configurations based on structural parameters: {θ}, the inter-monomer dihedral angle, and {ϕ}, the deviation of hydroxy (OH) groups from the ring plane. These are referred to as clusters and sub-clusters, respectively. The structural parameters of each sub-cluster are represented by the vector 〈X〉i and the absorption spectrum by 〈P〉i. The spectra of mixtures with different compositions and configurations were sampled and used to train ML models, allowing for the prediction of structural parameters of individual configurations. | ||
Eumelanin consists of oligomers of size 4 to 8 units20,21 and these oligomers further form aggregates at a much longer time scale. The change in absorption spectra with time is observed due to the start of aggregations between individual oligomers.22–24 To understand which structural motifs are present in the biopolymer, it is important to predict the exact structures of the oligomers before aggregation. To this end, we introduce a database of thermal ensembles of structures for various conformers of DHICA monomers, dimers and trimers up to octamers, along with their computed electronic absorption spectra.
Thermal ensembles of the structures are generated by sampling configurations from classical molecular dynamics (MD) trajectories, which were run for various initial configurations of DHICA oligomers (initial configurations of DHICA tetramers are shown in supplementary Fig. S1–S3, ESI†). Time-dependent density functional theory (TDDFT) calculations are carried out for the sampled configurations to compute the lowest singlet excitation energies (S0 → S1) of the octamers as well as their constituent smaller oligomers.
Fig. 3a shows the distribution of the excitation energies for the octamers and the corresponding smaller oligomers. It is observed that the distributions of the monomers and other small oligomers are quite shifted from the octamers. But the spectral distribution starts to converge from tetramers onwards. Eventually, a very high correlation (r = 0.92) of excitation energies between octamers and tetramers is seen (Fig. 3b). The reason for this converged distribution is the localization of the excited state electron density over a few oligomers (around 4-mers). The localization occurs in the DHICA oligomers due to the non-planarity between adjacent monomer units, which reduces the effective length of the chromophore involved in absorption. This is further corroborated by plotting the attachment/detachment density of the S1 state of an octamer geometry in Fig. 3c.
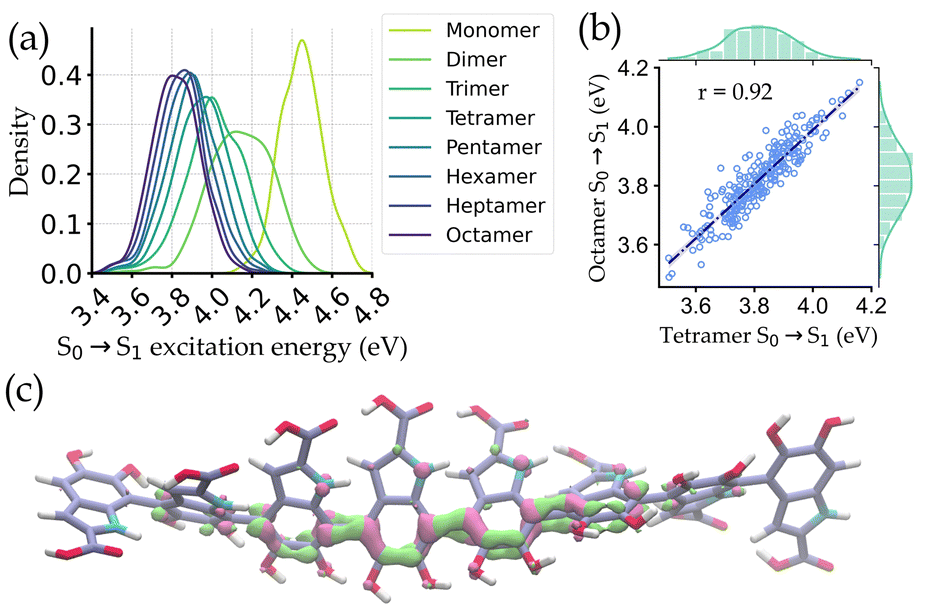 | ||
| Fig. 3 Localized character of valence electronic excitations of DHICA oligomers. (a) Distribution of the S0 → S1 excitation energy in configurations from MD simulation for DHICA octamers and their smaller analogs. (b) Correlation between excitation energies of octamer and tetramer structures. (c) To showcase the net transfer of electrons during the S0 → S1 transition, an attachment/detachment density plot is shown for a representative octamer structure. | ||
Based on these findings, we have identified the tetrameric units as the spectroscopically active region of DHICA melanin and built our ML models with the tetramers. It is also important to note that in the presence of oxidized forms, i.e., MKICA and DKICA, the excited state electron density is even more localized.25
After ascertaining the effective chromophore length, we commence with the model building and prediction on tetrameric units (as shown in Fig. 2). The database for building our model consists of the different structures of DHICA, MKICA, and DKICA tetramers and their excitation energies with the corresponding transition intensities across the wavelength (200–800 nm). First, the molecular structures, which are collected from MD trajectories, are clustered based on similarity comparison. Then kernel ridge regression (KRR)-based ML models are trained that take the mean spectrum of several clusters as input and predict the important structural parameters of every cluster.
Since we aim to predict the most important chromophore structures in specific regions of the spectra, we train different models for each 10 nm width in the spectra. It is also noticed that the populations of the clusters are very similar. Hence, the most important few clusters in a 10 nm range can be chosen based on their average intensities in that range. For a chosen number of clusters, the percentage contribution of each cluster is calculated from the ratio of individual intensity to the total intensity in a given spectral width. These clusters are then used in the training step.
The learning curves (given in ESI†) show good convergence for inter-monomer and ring-OH dihedrals with increasing training data size. In the UV-vis spectral range, we finally selected the 5 most important clusters for each 10 nm window. Regression models for each 10 nm range were then employed to train the structural parameters for these clusters.
After validating the model's performance on hold-out data and an arbitrary artificial spectrum (see supplementary Section S1, ESI†), we use the approach to predict the structure of DHICA melanin (reduced and oxidized). Our ML-based spectral assignment workflow was used on the experimental spectra of DHICA melanin obtained from ref. 23 recorded over a period spanning 5 min to 2 hours from the start of the reaction when both oxidized and reduced forms were present. The spectra recorded at even higher time scales (hours to days) correspond to the start of aggregation between oligomers and are, therefore, excluded. This ensures that we determine the spectral assignment of the effective chromophores before aggregation.
The model was tested for two different spectral ranges (280–290 nm and 560–570 nm) and the predicted most important 5 clusters of each reduced and oxidized form are shown in Fig. 4 along with the inter-monomer dihedral angles and standard deviations within each cluster. A full list of structural parameters predicted by the model to assign the experimental spectra of DHICA melanin is provided in supplementary Tables S5 and S6 (ESI†).
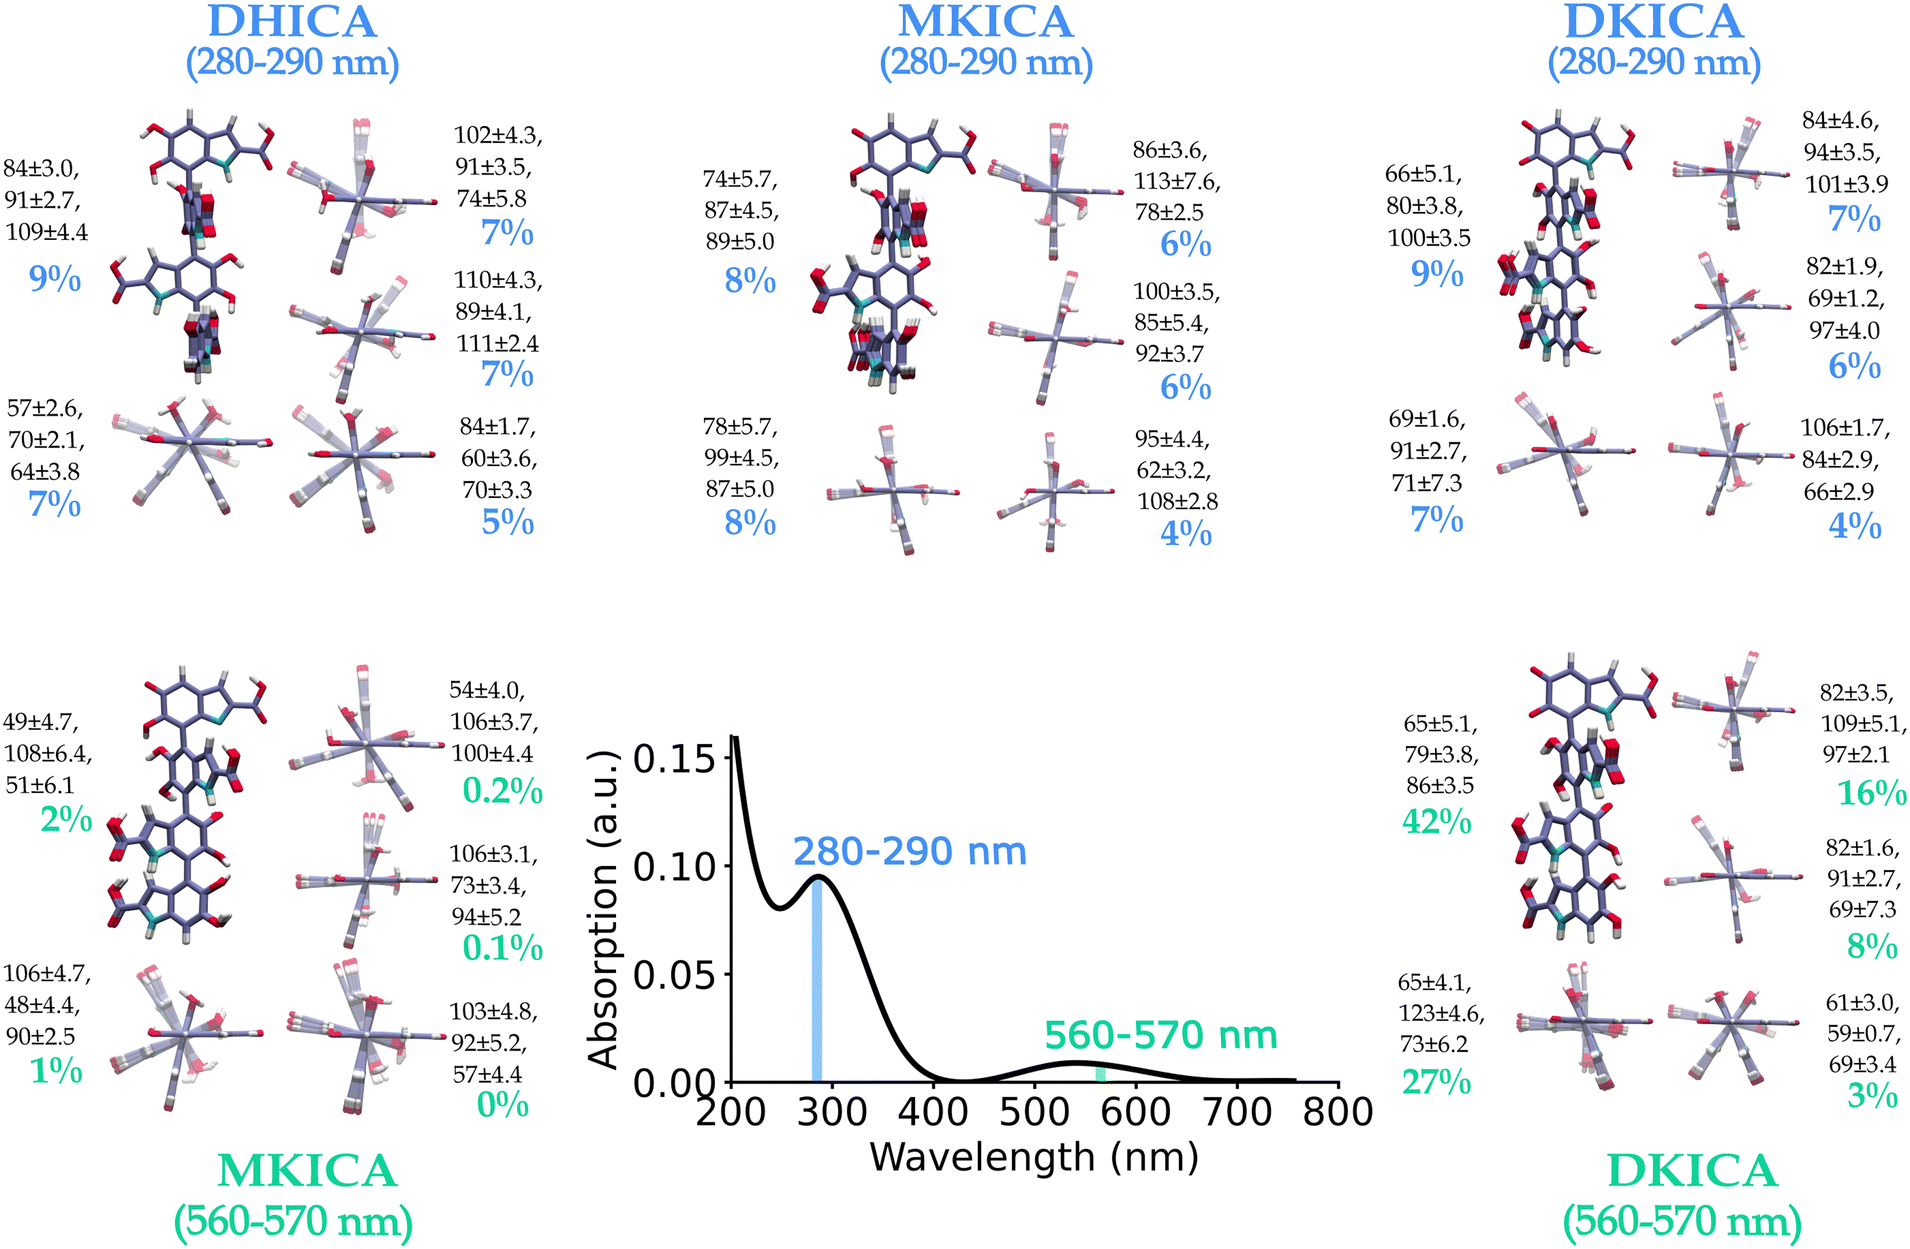 | ||
| Fig. 4 ML-predicted DHICA melanin structures for an experimental spectrum23 in the 280–290 nm and 560–570 nm wavelength regions. The predicted structures with their percentage contribution to the input spectrum are shown. The ML-predicted dihedral angles and their uncertainty determined by the K-means clustering of the training set are also provided. | ||
The clusters and the predicted structures in a spectral range are quite distinct in the configuration space. This highlights the immense diversity of melanin structure that is responsible for the spectrum and quite surprisingly shows up even within a narrow range of the spectrum. This is comparable to the results obtained from ultrafast vibrational fingerprinting where Kohler and co-workers observed that over different wavelength ranges of UV excitation, the vibrational fingerprints did not change significantly.26 This indicates the presence of diverse electronic absorbers. However, their observation was for DHI melanin, while we ascertained that similar diversity is also present in DHICA melanin.
Therefore, we have been able to predict the structure of the most efficient absorbers in the UV-vis range with a 10 nm resolution. While earlier works have proposed structural motifs or degrees of heterogeneity, the aim was always to assign exact structures to the spectra. Kohler and co-workers showed the presence of diverse absorbers in DHI-melanin, while the difference between these absorbers in different spectral regions could not be distinguished based on vibrational fingerprinting.26 Our results in a wavelength range of 10 nm corroborate their observation of multiple absorbers while being able to distinguish the identity of these absorbers in different wavelength regions.
It highlights the potential of combining machine learning with TDDFT to rapidly and accurately assign the spectral characteristics of melanin mixtures which display extensive heterogeneity. Our approach reveals the intricate role played by the structural and compositional variations of DHICA melanin in its skin photoprotection property. This novel method can also assign experimental spectra of melanin acquired through different techniques26–28 which is crucial for enhancing our comprehension of melanin and its impact on various biological processes.
We acknowledge insightful discussions with Prof. William Goddard III, Prof. Roald Hoffmann and Prof. Garnet K. Chan. R. R. acknowledges the DAE, Government of India RTI 4007. D. G. acknowledges SERB-POWER Fellowship SPF/2021/000194. A. C. thanks the DST-INSPIRE program for the senior research fellowship.
Conflicts of interest
There are no conflicts to declare.Notes and references
- G. Prota, Melanins and Melanogenesis, Academic Press, 2012 Search PubMed.
- J.-P. Ortonne, Br. J. Dermatol., 2002, 146, 7–10 CrossRef CAS PubMed.
- M. Brenner and V. J. Hearing, Photochem. Photobiol., 2008, 84, 539–549 CrossRef CAS PubMed.
- K. Bochenek and E. Gudowska-Nowak, Chem. Phys. Lett., 2003, 373, 532–538 CrossRef CAS.
- A. A. Watt, J. P. Bothma and P. Meredith, Soft Matter, 2009, 5, 3754–3760 RSC.
- M. d’Ischia, A. Napolitano, V. Ball, C.-T. Chen and M. J. Buehler, Acc. Chem. Res., 2014, 47, 3541–3550 CrossRef PubMed.
- F. Solano, Polym. Int., 2016, 65, 1276–1287 CrossRef CAS.
- J. J. Riesz, The Spectroscopic Properties of Melanin, University of Queensland, 2007 Search PubMed.
- W. Cao, X. Zhou, N. C. McCallum, Z. Hu, Q. Z. Ni, U. Kapoor, C. M. Heil, K. S. Cay, T. Zand and A. J. Mantanona, et al. , J. Am. Chem. Soc., 2021, 143, 2622–2637 CrossRef CAS PubMed.
- M. d’Ischia, A. Napolitano, A. Pezzella, P. Meredith and M. Buehler, Angew. Chem., Int. Ed., 2020, 59, 11196–11205 CrossRef PubMed.
- M. d’Ischia, A. Napolitano, A. Pezzella, P. Meredith and T. Sarna, Angew. Chem., Int. Ed., 2009, 48, 3914–3921 CrossRef PubMed.
- E. Kaxiras, A. Tsolakidis, G. Zonios and S. Meng, Phys. Rev. Lett., 2006, 97, 218102 CrossRef PubMed.
- C.-T. Chen, C. Chuang, J. Cao, V. Ball, D. Ruch and M. J. Buehler, Nat. Commun., 2014, 5, 1–10 Search PubMed.
- C.-T. Chen, F. J. Martin-Martinez, G. S. Jung and M. J. Buehler, Chem. Sci., 2017, 8, 1631–1641 RSC.
- M. L. Tran, B. J. Powell and P. Meredith, Biophys. J., 2006, 90, 743–752 CrossRef CAS PubMed.
- M. Matta, A. Pezzella and A. Troisi, J. Phys. Chem. Lett., 2020, 11, 1045–1051 CrossRef CAS PubMed.
- A. Choudhury and D. Ghosh, Chem. Commun., 2020, 56, 10481–10484 RSC.
- B. Sridharan, S. Mehta, Y. Pathak and U. D. Priyakumar, J. Phys. Chem. Lett., 2022, 13, 4924–4933 CrossRef CAS PubMed.
- A. Gupta, S. Chakraborty, D. Ghosh and R. Ramakrishnan, J. Chem. Phys., 2021, 155, 244102 CrossRef CAS PubMed.
- J. Cheng, S. C. Moss and M. Eisner, Pigm. Cell Res., 1994, 7, 263–273 CrossRef CAS PubMed.
- G. Zajac, J. Gallas, J. Cheng, M. Eisner, S. Moss and A. Alvarado-Swaisgood, Biochim. Biophys. Acta, Gen. Subj., 1994, 1199, 271–278 CrossRef CAS PubMed.
- S. J. Orlow, M. P. Osber and J. M. Pawelek, Pigm. Cell Res., 1992, 5, 113–121 CrossRef CAS PubMed.
- R. Micillo, L. Panzella, M. Iacomino, G. Prampolini, I. Cacelli, A. Ferretti, O. Crescenzi, K. Koike, A. Napolitano and M. d’Ischia, Sci. Rep., 2017, 7, 1–12 CrossRef PubMed.
- M. Portillo, M. Mataix, M. Alonso-Juarranz, S. Lorrio, M. Villalba, A. Rodrguez-Luna and S. González, Antioxidants, 2021, 10, 400 CrossRef CAS PubMed.
- M. Mandal, T. Das, B. K. Grewal and D. Ghosh, J. Phys. Chem. B, 2015, 119, 13288–13293 CrossRef CAS PubMed.
- C. Grieco, F. R. Kohl, A. T. Hanes and B. Kohler, Nat. Commun., 2020, 11, 4569 CrossRef CAS PubMed.
- A. Thompson, F. E. Robles, J. W. Wilson, S. Deb, R. Calderbank and W. S. Warren, Sci. Rep., 2016, 6, 36871 CrossRef CAS PubMed.
- F. R. Kohl, C. Grieco and B. Kohler, Chem. Sci., 2020, 11, 1248–1259 RSC.
Footnote |
| † Electronic supplementary information (ESI) available. See DOI: https://doi.org/10.1039/d3cc06137j |
| This journal is © The Royal Society of Chemistry 2024 |