
 Open Access Article
 This Open Access Article is licensed under a Creative Commons Attribution-Non Commercial 3.0 Unported Licence
Magnetic nanoparticle-facilitated rapid mass production of high affinity polymeric materials (nanoMIPs) for protein recognition and biosensing†
Subrayal M.
Reddy‡
 *,
Andrei N.
Stephen‡
,
Mark A.
Holden
,
William J.
Stockburn
and
Sarah R.
Dennison
*,
Andrei N.
Stephen‡
,
Mark A.
Holden
,
William J.
Stockburn
and
Sarah R.
Dennison
Department of Chemistry, Institute of Materials and Investigative Sciences, UCLan Centre for Smart Materials, School of Pharmacy and Biomedical Sciences, University of Central Lancashire, Preston, PR1 2HE, UK. E-mail: smreddy@uclan.ac.uk
First published on 10th October 2024
Abstract
Molecularly imprinted polymers (MIPs) have been investigated extensively for broad applications in diagnostics, imaging and therapeutics due to their antibody-like specificity, high stability, and low-cost and rapid production when compared with biological antibodies. Yet, their wide-scale adoption and commercial viability are limited due to low yields and relatively lengthy preparations of current methods. We report the novel application of protein-functionalised magnetic nanoparticles (MNPs) to enable the rapid mass production of nanoMIPs for protein recognition. An aldehyde-functionalised MNP (MNP@CHO) precursor was synthesised using a one-pot microwave method in less than 20 minutes, resulting in 330 mg yield for a 30 mL reaction volume. The MNP@CHO precursor (10 mg) was subsequently functionalised with 600 μg of a target template protein, giving MNP@protein. In the presence of an N-hydroxymethylacrylamide (NHMA) functional monomer and N,N′-methylene bisacrylamide as a crosslinker, the MNP@protein particles served as nucleants for the mass production of nanoMIPs in a 20–30 minute synthesis process. Subsequently, the nanoMIPs could be harvested with sonication and then retrieved using a magnet, leaving the MNP@protein particles to be recycled and re-used at least 5 times for further nanoMIP production cycles. In general, 10 mg of MNP@protein produced 10 mg of nanoMIP with a 20% decrease in the yield over the 5 synthesis cycles. For the bovine haemoglobin nanoMIP, the KD was determined to be 3.47 × 10⁻¹¹ M, a binding affinity rivalling values found for monoclonal antibodies. We also demonstrate that the methodology is generic by producing high-affinity nanoMIPs for other proteins including albumin, lysozyme and SARS-CoV-2 recombinant protein. We therefore present a facile route to produce nanoMIPs in large industrially relevant quantities (hundreds of mg) and at short timescales (within a day). Our method offers realistic opportunities for the industry to adopt such materials as an antibody replacement technology in diagnostics, biological extraction and therapeutics.
1. Introduction
The immunodiagnostic sector is a multi-billion-dollar industry, relying on the ready availability and use of either animal-derived monoclonal and/or polyclonal antibodies. Protein and viral biomarkers are of great diagnostic interest for the determination of disease states. Whilst antibodies show high specificity and selectivity for their target molecules, there are distinct disadvantages such as the use of immunised animals and long production times. Opportunities are opening in the sector for synthetic receptor technologies that can mimic antibody function. In this vein, molecularly imprinted polymers (MIPs) constitute a rapidly evolving class of synthetic antigen-recognition materials that act as synthetic antibodies. MIPs comprise cavities (or ghost sites) capable of selectively re-binding a biomolecule of interest, e.g. a protein antigen or virus. Being synthetically produced, nanoscale MIPs (nanoMIPs) offer an alternative, stable, ethically produced and economical alternative to antibodies.Acrylamide-based polymer hydrogels have been extensively researched as protein-selective MIPs.1–6 They can be produced with cheap reagents, in less than a day, in a one-pot synthesis. Recently, we evaluated virus-imprinted MIPs to selectively capture and neutralise an animal virus,7 developed a novel microwave method to rapidly produce monodisperse functionalised iron oxide magnetic nanoparticles (MNPs),8 and demonstrated a working MIP-based electrochemical sensor strategy for the antibody-free determination of SARS-CoV-2 in saliva.9 Electrochemically produced MIP (E-MIP) technology has also been demonstrated for sub-nanomolar determination of proteins.10
MIPs can be micron-sized particles,2,3,11 thin-films12–16 and nanoscale particles (50–200 nm).17–22 The traditional method of MIP synthesis has been to use monomers such as acrylamide and acrylic acid, resulting in monolithic (bulk) MIP polymeric hydrogels. The polymer gel monolith is then laboriously broken down by manual sieving or grinding to produce micron-sized particles exposing target-specific cavities on the surface of each particle. Due to the crude nature of the grinding process, there has been little control in the physical features of the final particles, leading to random nanoscale features in addition to the desired cavities. MIPs produced in this way, therefore, have very little homogeneity and are prone to non-specific binding, resulting in lower binding affinities in the micromolar range for the target. More recent methods have looked at forming nanoscale MIPs (nanoMIPs), which make use of a bottom-up approach to form particles of MIPs that are similar in dimension to the target. This results in a MIP in the nanomolar range with higher affinity as binding sites are ‘one-to-one’ with the target protein. There is still, however, a knowledge gap in the scaling-up of production of functional MIPs for commercial applications in, for example, diagnostics, biological extraction, protein crystallization23 and general research applications.7,24 To date, only one group has successfully addressed a solid-phase method for the manufacture of nanoMIPs17 but with limited capability for timely industrial scaling. These high-affinity MIPs are currently produced on the surface of silanised micrometre-sized glass beads upon which the target template is pre-immobilised,17 and subsequently in the presence of an appropriate monomer the nanoMIP is formed on the functionalised glass beads in a core–shell fashion. The nanoMIP can be released with gentle heating, potentially allowing the template tethered to the glass beads to be recycled and re-used after the nanoMIP has been harvested. However, the reported nanoMIP yields are very low (0.3 mg MIP per g of glass beads) per batch to produce only 18 mg of MIP and taking 2–3 days. This low and slow yield appears to be a limitation of the derivatized glass-bead method used for the manufacture of the MIP, with low MIP yield directly related to bead instability and its small surface area (particle diameter: 75 μm), with beads being packed into a column that are not free to move, thereby impacting reaction kinetics and subsequent yields of the nanoMIP. There is still, therefore, a gap in economically scaling-up the mass production of nanoMIPs. To rival scaling with that of the antibody industry, small-scale (0.1–1 mg), medium-scale (1.0–10.0 mg) and large-scale (gram) manufacturing of nanoMIPs needs to be addressed.25,26
We address this issue using our patent-pending proprietary bioreactor-type approach, where the protein template is re-usable because it is tethered to bespoke (size-tuned) microwave-synthesised MNPs with radically higher surface area to volume ratios compared with the aforementioned micron-sized glass beads and presenting a 3-D solution to a 3-D production problem. In our recent work,8 we demonstrated a rapid and facile microwave method to reliably produce aldehyde-functionalised MNPs in a one-pot synthesis within 20 minutes. The MNPs have high stability, small size, and rapid reaction kinetics; in addition, surface modification of the MNPs with a range of functional groups allowing the tethering of proteins is easily achieved. Our MNPs are free to move around in an agitated reactor vessel. In our method, MIPs are formed in solution around each MNP in the reactor in less than 1 hour. Because of the exponential increase in the surface area to volume ratio of MNPs compared with that of the glass-bead approach, we demonstrate that there is a corresponding increased yield of MIP. We demonstrate a facile one-day method to produce five batches of up to 10 mg mL−1 of high-affinity nanoMIPs using our protein-functionalised MNP solid-phase process. Crucially, protein-functionalised MNPs can be regenerated for subsequent cycles of nanoMIP synthesis with no deterioration in nanoMIP affinity between the cycles, thereby reducing the cost burden on template requirement and offering a sustainable approach for scaling the synthesis of these antibody replacement materials to gram-scale quantities within a day. Fig. 1 provides a schematic of the process followed.
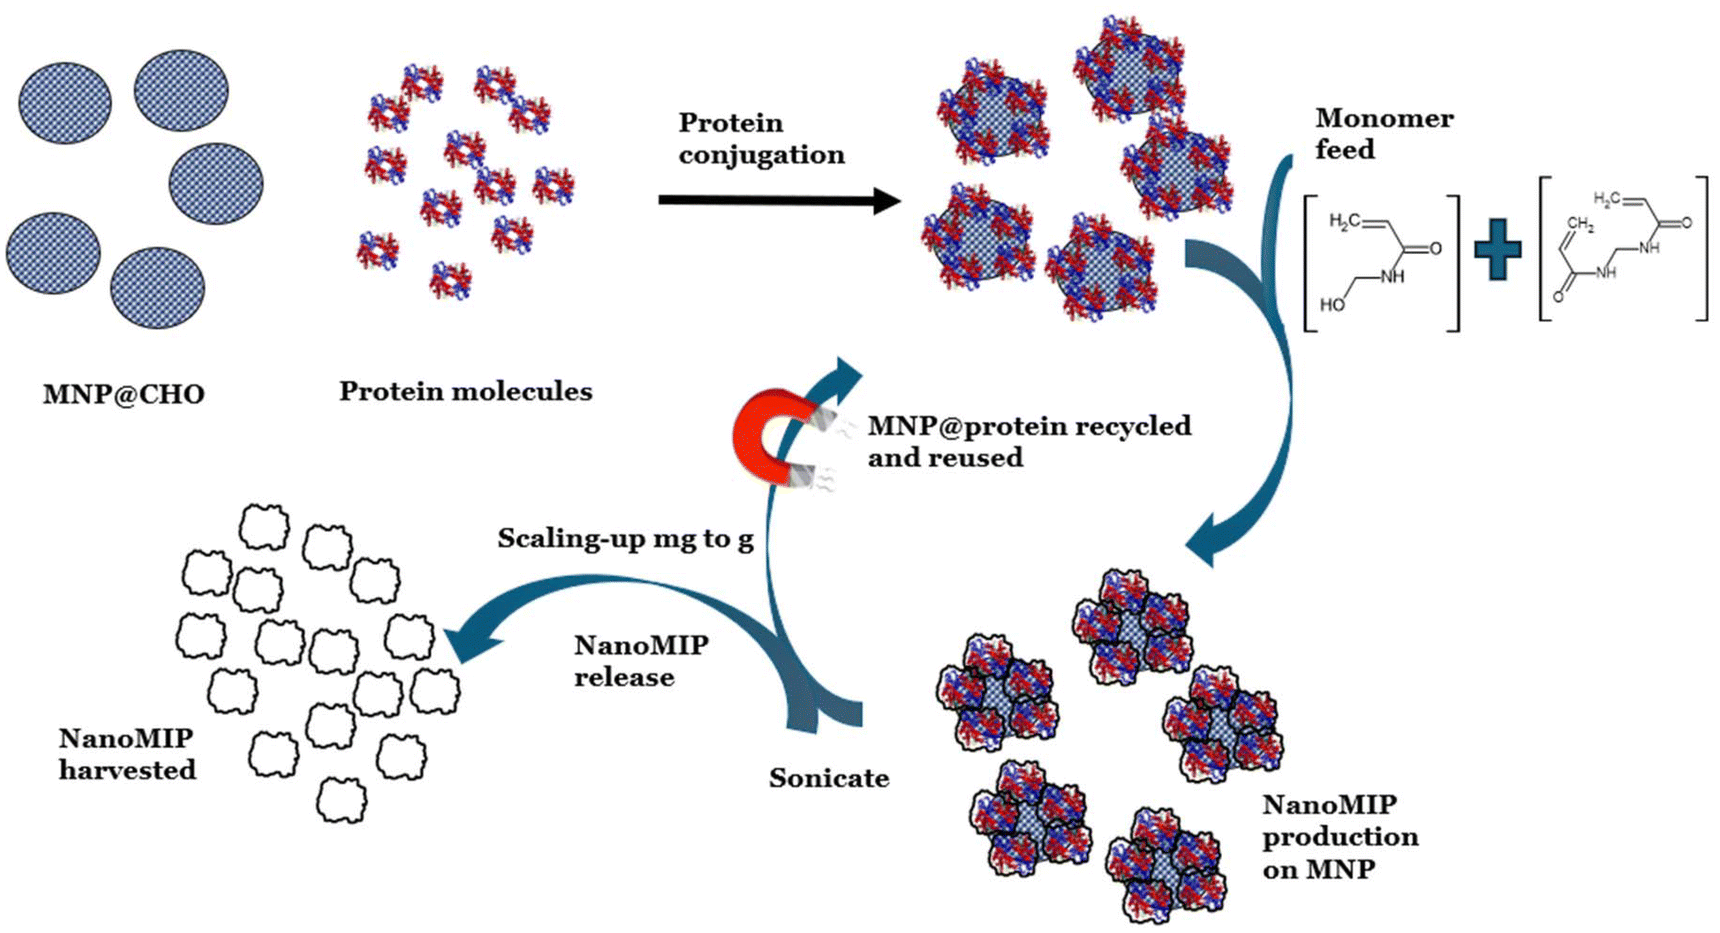 | ||
| Fig. 1 Strategy for scaling the mass production of nanoMIPs by recycling and re-using protein-functionalised magnetic nanoparticles. | ||
2. Methods
2.1 Materials
N-Hydroxymethylacrylamide (NHMA, 48% w/v), N,N′-methylenebisacrylamide (MBAm), ethylene glycol, iron chloride (FeCl3·6H2O), methylhydroquinone, sodium acetate (NaOAc), phosphate-buffered saline tablets (PBS, 10 mM, pH 7.4 ± 0.2), potassium ferricyanide (K3Fe(CN)6), potassium chloride (KCl), sodium nitrate (NaNO3), ammonium persulphate (APS), potassium peroxydisulfate (KPS), sodium dodecyl sulphate (SDS), haemoglobin from bovine blood (BHb), bovine serum albumin (BSA), chicken egg lysozyme (Lys) and glutaraldehyde (25% v/v) were used as received from Merck. The recombinant nucleocapsid protein for SARS-CoV-2 was purchased from BioservUK Ltd (Rotherham, UK). Buffers were prepared in MilliQ water (resistivity 18.2 ± 0.2 MΩ cm). DropSens disposable screen-printed electrodes (Au-BT) comprising a gold working electrode (0.4 cm diameter), a platinum counter electrode and a silver reference electrode were purchased from Metrohm (Runcorn, Cheshire, UK).2.2 Instrumentation
A BioDrop μLITE UV/visible spectrometer was purchased from Biochrom Ltd Cambridge, UK. A Nicolet AVATAR 330 FTIR spectrophotometer with a Pike MIRacle accessory and an FEI Tecnai 12 TEM at 100 kV with a Tietz F214 2k × 2k CCD camera were purchased from Thermo Fisher Scientific, Loughborough, UK. An Anton Paar monowave 200 microwave oven was purchased from Anton Paar Ltd Hertfordshire, UK. An SLS Lab Basics centrifuge was purchased from Scientific Laboratory Supplies, Nottingham, UK.2.3 MNP production
Bare and aldehyde-functionalised magnetic particles were produced following our previously published solvothermal microwave method.20 Briefly, 0.5 g of FeCl3·6H2O and 1.8 g of NaOAc were dissolved in 15 mL of ethylene glycol in a 30 mL Anton Parr G30 microwave reaction vial (MRV). Glutaraldehyde (3.5 mL) was then added to the resulting solution with stirring for a further 5 min. The stirrer bar was then removed and the MRV was placed into an Anton Paar monowave 200 microwave oven and the reaction mixture was heated up to a temperature of 200 °C with a ramp time of 18 °C min−1 (over 10 min). The reaction was held at 200 °C for 20 min under pressure (9 bar). The resulting composite products were allowed to cool for 10 min, washed five times with deionised water, followed by washing with ethanol twice, and then isolated with a neodymium magnet and then resuspended in deionised water and stored at 4 °C. An aliquot (10 mL) of the MNP suspension was oven-dried (110 °C for 2 days) for use in TEM analysis. The MNP production method was repeated, but in the absence of glutaraldehyde, to give bare MNPs.2.4 Protein functionalization of MNPs
A suspension (1 mL) equivalent to 10 mg of the produced aldehyde-functionalised magnetic nanoparticles (MNP@CHO) was placed in an Eppendorf centrifuge tube. A neodymium magnet was placed on the side of the tube to rapidly pull the magnetic nanoparticles from the solution (10 minutes). The supernatant was removed and replaced with 1 mL of a 1 mg mL−1 PBS solution of bovine haemoglobin (BHb). The Eppendorf tube was then sonicated for 2 minutes, followed by vigorous shaking and vortexing to ensure that the nanoparticles were fully dispersed. The reaction mixture was left undisturbed at room temperature (22 °C) for 30 minutes, allowing the protein to conjugate with MNP@CHO. After 30 minutes, the particles were once again separated from the solution and the supernatant was replaced with fresh buffer in triplicate to remove any non-conjugated protein. The amount of protein conjugated with the MNPs (functionalized and bare) was calculated through comparing the initial and final concentrations of protein remaining in the supernatant. The concentration of the non-adsorbed protein was measured by spectrophotometry (405 nm for haemoglobin) using a BioDrop μLITE UV/visible spectrometer. The resulting MNP@BHb particles thus produced were stored in PBS at 4 °C until further use.2.5 NanoMIP production on MNP@protein particles
With sonication followed by vigorous shaking and vortex mixing, the protein-functionalised magnetic nanoparticles (10 mg) were resuspended in 906 μL of PBS (pH7.4) and transferred to a 15 mL Falcon tube. The tube was then placed into a thermo-mixer and mixed at 400 rpm at room temperature. The sample was then degassed using nitrogen for 15 minutes with stirring. 37 mg of NHMA monomer (77 μL of 48% w/v solution) and MBAm (6 mg) along with SDS (0.4 mg) were immediately added to the reaction mixture, followed by 20 μL each of 5% (v/v) TEMED and 10% (w/v) APS both prepared in e-pure water, giving a total reaction volume 1.023 mL. A nitrogen headspace was then established, and the Falcon tube was sealed with the cap and then wrapped in parafilm. The solution was left to mix at 400 rpm for 15 minutes to allow nanoMIP particles to be synthesised on the surface of the MNP@BHb particles.At 15 minutes, the reaction was rapidly quenched with 1 mL of 10 mM methylhydroquinone (MHQ). The reaction solution was exchanged three times with fresh PBS (1 mL) to remove any unreacted monomers and quencher. The solution was then resealed, and the tube placed on its side on a neodymium magnet (2 minutes) to collect the MNP@BHb∼nanoMIP. The supernatant was then removed. The MNP@BHb∼nanoMIP particles were then redispersed in 1 mL of e-pure water and placed in a sonicator using a VWR ultrasonicator (600 W, 45 kHz) for 5 minutes at 37 °C. The Falcon tube was then once again placed on a neodymium magnet and the supernatant now containing the released nanoMIP particles was placed in a 1.5 mL volume Eppendorf tube and stored at 4 °C until further use. The preparation was repeated by using MNP@CHO instead of MNP@BHb to produce non-imprinted control polymer (nanoNIP).
2.6 Lyophilisation of nanoMIP and yield determination
The nanoMIP solution within the Eppendorf microfuge was first flash frozen using liquid nitrogen prior to using a CHRIST Alpha 2-4 LDplus freeze-dryer. With the cap open on the Eppendorf tube, Parafilm® was placed over the Eppendorf mouth and pierced to allow the water to escape during the freeze-drying process. The Eppendorf tube was then placed in the freeze dryer at −90 °C and at low pressure (0.011 mbar) for a minimum of 16 h until a fine fluffy off-white powder was produced, which was stored at 4 °C until further use. The nanoNIP particles produced were also taken through the same process.2.7 DLS and CD spectroscopy characterization of MNPs and nanoMIPs
The size distribution of the nanoparticles was characterized using a Zetasizer Nano ZS. The produced MNPs/nanoMIPs/nanoNIPs were suspended in 1 mL of PBS. The sample was loaded into a disposable cuvette with the refractive index set to 1.32. The solution was equilibrated for 60 seconds before the measurement was performed. Measurements were performed in triplicate.Circular dichroism (CD) measurements were carried out using a J-815 spectropolarimeter (Jasco, UK) at 20 °C, which was stabilised using a Peltier temperature controller unit as previously described.27 The magnetic nanoparticles functionalised with BHb (MNP@BHb) were prepared as described above and analysed using a CD spectrometer. The MNP@BHb samples were collected after each cycle of nanoMIP synthesis each after sonication for 5 minutes and measured as described below in PBS (pH 7.4). A sample of BHb in solution and freshly prepared MNP@BHb were also run as a control. The samples were suspended in 1× PBS (pH 7.4) to a final haemoglobin concentration of 0.006 mg mL−1. The samples were placed individually into a 10 mm path-length quartz cuvette. The scan speed was set to 50 nm min−1 and the bandwidth was 1.0 nm. The resolution was 0.1 nm with 1 s response. In all measurements, the controls were manually subtracted from the sample spectra. To obtain the final CD spectra, the average of a series of ten CD scans was accumulated for each sample. The circular dichroic absorption value was used to calculate the molar ellipticity, θ. The secondary structure analysis was performed using the CDSSTR method (protein reference set 3) from the DichroWeb server.28–30 These experiments were repeated three times and the percentage of the secondary structure was averaged.
2.8 Transmission electron microscopy of MNPs
The aldehyde-functionalized MNPs (MNP@CHO) were suspended in ultra-pure water (0.1 g in 50 μL of water) and a 5 μL droplet was deposited onto a Formvar/carbon-coated 200 mesh copper TEM grid (Agar Scientific, UK). After 1 min, the grid was blotted, washed for 30 s in ultra-pure water, blotted again and allowed to dry. Images were collected using an FEI Tecnai 12 TEM at 100 kV with a Tietz F214 2k × 2k CCD camera.2.9 Electrochemical deposition and analysis of nanoMIPs
All electrochemical experiments were performed using a Metrohm Autolab PGSTAT204 potentiostat and NOVA2.1.4 software. The nanoMIP particles were then entrapped within an electropolymerized layer (E-layer). E-Layers were fabricated directly onto BT-Au screen-printed electrodes (SPEs; Metrohm) using cyclic voltammetry (CV) largely following the procedure given in ref.10. Briefly, a 50 μL solution in PBS comprising 0.1 mg of nanoMIP, 1.33 M NHMA as the functional monomer, 41.5 mM MBAm as the cross-linker, 0.29 M NaNO3, and 48.15 mM KPS was deposited onto the SPE. The potential was then cycled between −0.2 V and −1.4 V for 7 cycles at 50 mV s−1 (10 min, RT, 22 ± 2 °C) to produce the E-layer with entrapped nanoMIP (see Fig. S1a†). E-layers in the absence of nanoMIP were also produced as a control.The E-layer comprising entrapped nanoMIP islands (E-NMI) or control E-layer was exposed to varying concentrations of target protein (haemoglobin) template solutions over a wide concentration range (100 fM to 100 μM) for a period of 5 minutes at each concentration. Post-rebinding at each concentration and subsequent PBS rinsing, we determined the degree of target protein rebound to the nanoMIP islands.
Selective protein binding was tracked using electrochemical impedance spectroscopy (EIS) of an external 5 mM potassium ferricyanide solution in PBS containing 0.5 M KCl as supporting electrolyte. Electrochemical impedance spectroscopy (EIS) measurements were conducted at a standard potential of 0.1 V (±0.01 V) with 10 scans of frequencies, and a sinusoidal potential peak-to-peak with an amplitude of 0.01 V in the 0.1–100![[thin space (1/6-em)]](https://www.rsc.org/images/entities/char_2009.gif) 000 Hz frequency range. A Randles equivalent circuit was fitted for all EIS experiments using the FRA32 module (Fig. S1b†). The rebinding process was repeated with fresh nanoMIP E-layer using BSA as a non-target protein instead of BHb.
000 Hz frequency range. A Randles equivalent circuit was fitted for all EIS experiments using the FRA32 module (Fig. S1b†). The rebinding process was repeated with fresh nanoMIP E-layer using BSA as a non-target protein instead of BHb.
2.10 AFM images
The samples in PBS were imaged using a Bruker Dimension Icon® AFM with a NanoScope 6 controller in peak force tapping™ mode with silicon nitride cantilevers (SCANASYST-FLUID, nominal spring constant 0.7 N m−1). Representative surface images of both bare and nanoMIP polymer-entrapped gold electrodes were obtained. An E-layer was produced in the absence of nanoMIP to act as a control. The coated electrodes were prepared through electrochemical polymerisation (see E-MIP production above).3. Results and discussion
3.1 MNP production and protein conjugation
To scale up nanoMIP synthesis, we tethered a protein (template) to the aldehyde-functionalised magnetic nanoparticles (MNPs) to act as the solid support. The MNPs were produced using a rapid and green solvothermal microwave synthesis method. In a previous study,8 the ramp time to the dwell temperature (200 °C) was 90 °C min−1, resulting in MNPs with an average TEM size of 7 ± 2 nm (ca. 36 nm by DLS) and a 300 mg yield. By altering the microwave conditions (temperature ramp rate reduced to 18 °C min−1), we were uniquely able to increase the particle size of the MNPs and obtain a similar yield of 330 mg. Fig. 2 shows DLS (Fig. 2a) and TEM (Fig. 2b and c) results of larger MNP@CHO. We attribute the larger particle size to the agglomeration of individual aldehyde-functionalised MNPs during the microwave synthesis process, resulting in stable clusters with an average size of 91 ± 15 nm (Fig. 2b). Importantly, we can still clearly identify the individual particles with an average size of 18 ± 5 nm at higher magnification in the TEM images (Fig. 2c). Note that this clustering of the MNPs is apparent in both TEM and DLS studies. The size of the clusters measured using DLS (Fig. 2a) is on average 122 ± 49 nm, whereas that of the clusters measured using TEM is 91 ± 15 nm (Fig. 2b), which we attribute to DLS representing the hydrodynamic diameter of wet MNPs, whereas TEM represents the clusters in the dried state. A similar difference in the sizes of MNP clusters measured using DLS and TEM has also been reported by others.31 Increasing the MNP@CHO particle size was crucial to increasing the number of target protein molecules that could be subsequently conjugated to each particle. This is important in developing a method that can efficiently produce multiple nanoMIPs per MNP. Bare MNPs were also produced in comparison with yields of 280 mg for a 30 mL reaction solution. | ||
| Fig. 2 Particle size determination using dynamic light scattering (a) and transmission electron microscopy (b and c) of aldehyde-functionalised MNPs (MNP@CHO). The MNPs were produced using microwave synthesis with a 10-minute ramp time at 18 °C min−1, followed by a 20 min dwell time at 200 °C. The average cluster size in (b) was determined to be 91 ± 15 nm and the average particle size in (c) was determined to be 18 ± 5 nm (the data represent the mean ± S.E.M., n = 20). | ||
Due to the ability of glutaraldehyde to polymerise when aged or heated,32,33 we believe that we are achieving coating of growing superparamagnetic iron oxide crystal structures with glutaraldehyde oligomers that still comprise the aldehyde groups. The glutaraldehyde polymer chains become entrapped as the formation of nanoparticles allows the glutaraldehyde groups to cover the MNPs in a core–shell fashion, which potentially contributes to the clumping of MNP@CHO observed in the TEM images (Fig. 2b). Other methods report the amino silane coating of magnetic nanoparticles to enable the attachment of the target template molecule.19,34 The latter is a multi-stage synthesis process requiring harsh silanizing reagents and the application of carbodiimide and N-hydroxysuccinimide protein coupling agents. Our one-pot method offers distinct advantages; we produced MNPs with a protein linker (glutaraldehyde) in situ, which reduces the steps required to obtain a functionalised MNP and removes the need for complex organic solvent-based silane core–shell chemistry.
To produce MNP@BHb conjugates, the MNP@CHO particles (10 mg) were resuspended in a 1 mL volume of e-pure water containing the target protein, bovine haemoglobin (1 mg mL−1 final concentration). The extent of protein capture by the MNPs was determined by spectroscopically monitoring the depletion of protein in the reaction solution, after the MNP@BHb had been magnetically separated. Whereas the smaller (ca. 36 nm) MNP@CHO particles adsorbed 0.05 mg mL−1 of protein, the larger (ca. 120 nm) MNP@CHO particles adsorbed 12 times more protein (0.6 mg mL−1). In contrast, the corresponding larger bare MNP control particles adsorbed only 0.02 mg mL−1 of protein, which is indicative of a very small element of non-specific binding (Fig. 3).
 | ||
| Fig. 3 Determination of the degree of protein functionalisation of MNP@CHO. A 1 mg mL−1 BHb starting solution was used and the amount adsorbed with time was determined by the subtraction of the amount of BHb remaining in the solution (measured using UV/Vis spectroscopy) during the protein conjugation reaction. Fifteen minutes was determined to be the minimum time required to complete the conjugation process. | ||
Fig. 4 shows the DLS spectrum for MNP@BHb. The particles were again monodispersed but have now more than doubled in size to ca. 330 nm due to protein attachment.
 | ||
| Fig. 4 DLS spectrum of the MNP@BHb particles. | ||
The chemically conjugated MNP@BHb particles were then taken forward for nanoMIP batch production using our proprietary method. MNP@CHO particles were used as control.
3.2 Batch reactor-type production of nanoMIPs using MNPs
The MNP@BHb particles were used as solid supports in an aqueous solution of functional monomer and crosslinker to allow nanoMIP to form as a loosely bound shell around each particle. The reaction was terminated at 15 minutes using a free-radical quencher and unreacted monomer and quencher were removed. Sonication was used to detach the non-covalently bound nanoMIP particles from the MNP@BHb particles and a neodymium magnet was then used to separate and recover MNP@BHb for re-use. The remaining nanoMIP solution was then lyophilised to concentrate the nanoMIP particles, which produced a fluffy white powder. The yield per cycle was determined to be 10 mg ± 2 mg nanoMIP per 1 mL of MNP@BHb suspension (containing 10 mg of MNP@BHb). We were able to run 3 separate batches each through 5 cycles within 8 h easily, producing a total yield of 150 mg in one day, which is unprecedented in the MIP field. A comparison study of large and small MNP@BHb particles (at equivalent mass) demonstrated that the yield is a function of MNP@BHb particle size. Whereas the larger MNP@BHb particles (ca. 330 nm) produced a nanoMIP yield of 10 mg ± 2 mg, the smaller MNP@BHb particles (ca. 131 nm) produced a nanoMIP yield of only 0.2 mg ± 0.1 mg. The larger particles were good candidates for nanoMIP synthesis probably due to the very high density of protein initially attached to the larger MNPs. A nanoNIP control was produced using MNP@CHO as the solid support surface. Table 1 compares the sizes of the functionalised MNPs, nanoMIP and nanoNIP control obtained using DLS. The produced nanoMIP had an average particle size of 125 nm. The nanoNIP particles were larger at 196 nm. A high polydispersity index (PDI) of 1.0 suggests a broad size distribution containing large particles or aggregates that could be slowly sedimenting.| Nanomaterial | Average size (nm) | SD | PDI |
|---|---|---|---|
| MNP@CHO | 122 | 49 | 1.0 |
| MNP@BHb | 331 | 72 | 1.0 |
| NanoMIP | 125 | 43 | 0.76 |
| NanoNIP | 196 | 60 | 0.97 |
The MNP@CHO (120 nm), MNP@protein (330 nm) and nanoMIP (125 nm) particles can be modelled as spheres with diameters taken from DLS measurements. Assuming the protein (BHb) has a diameter of 5 nm, we determined the theoretical number of nanoMIP particles that could be produced on 1 mg mL−1 of MNP@BHb to be 2.463 × 10¹⁴ particles per mL (see the ESI;† Theoretical calculations). Furthermore, we determined that there are 27.4 nanoMIP particles being theoretically produced per MNP@protein particle, suggesting that each nanoMIP particle theoretically has 23 protein recognition (binding) sites.
Therefore, during protein rebinding on the nanoMIP, we expect the ratio of protein molecules bound to nanoMIP particles to be approximately 25:1.
3.3 NanoMIP rebinding studies using electrochemical techniques
Lyophilised nanoMIP (0.1 mg) was reconstituted in 50 μL of PBS buffer comprising NHMA monomer, MBAm crosslinker and initiators as detailed in the Methods section. The 50 μL droplet was deposited on the surface of a BT-Au screen-printed electrode covering all three (working, counter and reference) electrodes. The potential was cycled seven times, allowing the entrapment of top surface-exposed nanoMIP within the surrounding electrochemically polymerised NHMA layer (E-layer). We are relying on compatibility between the NHMA monomer and the nanoMIP particles, which is best achieved by using similar acrylamide monomers as were used to make the nanoMIP particles form the E-layers. Essentially, we are physically entrapping the nanoMIP particles within the E-layers. During each reduction cycle, the persulphate in KPS (at the electrode surface) splits to produce sulphate radicals, which then initiate polymerisation of NHMA/bisacrylamide. NaNO3 was present as supporting electrolyte only and does not take part in the electrochemical reaction. Scanning electron microscopy images of the polyNHMA-entrapped nanoMIP particles were not obtained as they would have produced artefacts of the actual shape and size due to the dehydration of both pNHMA and the hydrogel-based nanoMIP particles under the low pressure (vacuum) operating conditions of the SEM instrument. Instead, atomic force microscopy (AFM) images of the pNHMA–nanoMIP samples while submerged in PBS were obtained. Fig. 5 shows the AFM images, obtained in an aqueous environment, of the bare electrode (Fig. 5a), electrochemically polymerised film layer (Fig. 5b) and nanoMIP entrapped within an electropolymerised film layer (Fig. 5c). Whereas the former two samples present a smooth and homogeneous layer with few discernible features, the third reveals polymer entrapped as nanoMIP islands, where nanoMIP particles are densely packed, very conspicuous and uniformly distributed, but not uniform in size. Discarding the larger agglomerations of individual nanoMIP particles, the modal nanoMIP particle size from AFM was determined to be 147 ± 19 nm, which is similar to the DLS findings (125 ± 43 nm). | ||
| Fig. 5 AFM images of (a) bare MNPs, (b) the electrochemically grown thin-film layer (E-layer) and (c) the nanoMIP particles entrapped within an E-layer. The samples in PBS were imaged using a Bruker Dimension Icon® AFM with a NanoScope 6 controller in peak force tapping™ mode with silicon nitride cantilevers (SNL-10, nominal spring constant: 0.35 N m−1 and SCANASYST-FLUID, nominal spring constant: 0.7 N m−1). | ||
The nanoMIP islands were then exposed to 100 fM–100 μM target protein (BHb) and non-target protein and interrogated using electrochemical impedance spectroscopy (EIS) in the presence of a ferricyanide redox marker. Bovine serum albumin (BSA), which is similar in size to BHb, was used as non-target protein for selectivity studies. Fig. 6 shows a linear increase in protein binding with increasing protein reloading, and saturation of nanoMIP by target protein occurring at 10 μM. In a similar way, nanoNIP (control) islands were also electrochemically entrapped on a screen-printed electrode and tested with protein (Fig. S2†). The nanoNIP particles did not respond below 1 nM, whereas the nanoMIP particles gave appreciable signals. In comparison, only small RCT changes (4–8 Ω) were observed in the 10 nM–1 μM concentration range, probably due to a very small amount of non-specific binding and giving very high MIP:NIP signal ratio (imprinting factor = 118:1 at 1 pM). ESI Fig. S3† shows the effect on RCT when the BHb nanoMIP islands are cross-bound with non-target bovine serum albumin (BSA). BHb nanoMIP did not recognise BSA below 1 nM. In the range of 10 nM–1 μM, BSA showed only small RCT changes (5–10 Ω), giving a target:non-target signal ratio (selectivity factor) of 120:1 at 1 nM protein concentration and an infinite selectivity factor between 0.1 fM and 0.1 nM protein concentrations, meaning that the non-target protein shows no interference in this concentration range.
 | ||
| Fig. 6 EIS determination of protein binding in the E-layer-entrapped nanoMIP particles. A plot for BHb concentration vs. ΔRCT was obtained using the nanoMIP particles entrapped in an electropolymerized layer (E-layer) on the surface of a screen-printed gold electrode. The dynamic linear range was 100 fM–10 nM with a limit of quantitation of 100 fM. The KD was determined to be 3.47 × 10⁻¹¹ M using the Hill–Langmuir method. The data represent the mean ± S.E.M., n = 3. | ||
The selectivity factor of the nanoMIP for target BHb over non-target BSA was determined to be 118:1 at 1 pM protein concentration. The limit of detection of our nanoMIP-based sensor for BHb determination was found to be 100 fM. We previously showed that an E-MIP sensor can be used to determine the KD for E-MIPs. In a similar way, based on the concentration of protein required to saturate the nanoMIP (Fig. 6; Bmax), we can use the E-NMI sensor results to determine the binding affinity (KD) using the Hill–Langmuir adsorption isotherm model (i.e. KD = concentration of protein at Bmax/2) for the nanoMIPs produced. We assumed that the Hill coefficient is equal to 1, which is indicative of ligand (MIP) binding with no cooperativity to one site. The KD for the BHb nanoMIP islands using this method was determined to be 0.0347 nM.
3.4 Scaling up of nanoMIP production (recycle and re-use of MNP@BHb)
In their application of silanised and trypsin-modified glass beads as a solid phase, Cáceres et al.22 studied the re-cycling of the solid phase and determined that, over 5 cycles, the protein became progressively denatured, which consequently decreased the low yield of nanoMIP produced from 0.439 mg mL−1 to 0.061 mg mL−1. For scale-up to be effective, and importantly, to conserve the amount of target protein required to mass produce nanoMIPs, we investigated the re-cycling of MNP@BHb. It was crucial to first ascertain if MNP@BHb showed any degradation following each use. CD spectroscopy was therefore used to test whether the protein remained pristine after each re-use (5 cycles in this study) of the same batch of MNP@BHb particles. We tested an aliquot of the MNPs using CD spectroscopy after each cycle of production and compared this against native protein in solution. Fig. 7a shows the change in the production yield of nanoMIPs and Fig. 7b summarises the % alpha helix and beta sheet composition of the conjugated protein after each subsequent re-use of MNP@BHb, showing little change in native protein structure. It is evident that nanoMIP production yield shows a small decrease between cycles with average yield per cycle of 10 mg ± 2 mg. Furthermore, a single concentration rebinding study at 1 nM BHb target or BSA non-target protein demonstrated that each batch retained its high affinity for target protein (Fig. 8). | ||
| Fig. 7 (a) Change in the production yield of nanoMIPs with 5 successive cycles of re-using MNP@BHb. The data represent the mean ± S.E.M., n = 3. (b) Summary of the CD spectral data demonstrating that 5 successive cycles of nanoMIP production do not significantly change the BHb secondary structure of the MNP@BHb particles. The data represent the mean ± S.E.M., n = 3. | ||
 | ||
| Fig. 8 Representation that after each cycle of MNP@BHb re-use, each subsequent batch of nanoMIP retained affinity for the target protein (BHb) and that no signal was observed for the non-target protein (BSA) (both at 1 nM). The data represent the mean ± S.E.M., n = 3. | ||
Therefore, we demonstrate that five sequential cycles of re-using MNP@BHb (at 10 mg mL−1 for cycle 1) can produce up to 50 mg of nanoMIP within one day. Three such batches run in series therefore would give 150 mg per day of nanoMIP. This method readily lends itself to further scaling by simply increasing the starting MNP@protein batch volume from 10 mg in 1 mL to 100 mg in 10 mL, offering gram yields of nanoMIP in one day.
We further demonstrated that our MNP–nanoMIP methodology is versatile by producing high affinity nanoMIPs for proteins ranging in molecular weight including albumin, lysozyme and SARS-CoV-2 recombinant nucleocapsid protein (N-protein). We tested their rebinding and affinity using our E-layer nanoMIP island method. Table 2 shows the KD obtained for each nanoMIP, again demonstrating high affinity.
| NanoMIP | Protein molecular weight (kDa) | K D (nM) |
|---|---|---|
| Bovine serum albumin | 66.5 | 1.6 |
| Bovine haemoglobin | 64.5 | 0.0347 |
| Recombinant nucleocapsid protein for SARS-CoV-2 | 46 | 1.2 |
| Chicken egg lysozyme | 14 | 0.058 |
Table 3 summarises other reports of solid-phase synthesis in the field. Our nanoMIP production method outperforms these in terms of delivering a high yield, short time to production and reduced number of steps involved while still offering acceptable protein-binding affinities. In addition, our ability to simply separate the MNP@protein particles using an external magnet and re-use it for multiple nanoMIP synthesis cycles with an overall <20% reduction in nanoMIP yield is a key step change compared to existing methods, offering scaling in yield and minimising target template required. We therefore offer a commercially viable, low-cost and generic route to fast-track bespoke nanoMIP production for protein targets. We are currently investigating automating the cycling and re-use of MNP@protein to generate nanoMIPs.
| Method | Key reagents | Number of steps (complexity) | NanoMIP yield (normalised to a 1 mL reaction volume) | Production time (minimum) | K D | NanoMIP particle size (DLS) |
|---|---|---|---|---|---|---|
| MNP@CHO method (our method) | NHMA, MBAm, PBS, FeCl3, glutaraldehyde, TEMED and APS, sodium acetate and ethylene glycol | 4 steps (including one-step microwave MNP@CHO production) | 10 mg | 2 hours | 0.0347 nM (BHb nanoMIPs); see also Table 2 above | 125 nm |
| Silanised glass bead method17 | TBAM, NIPAM, MBAm, ethanol, glutaraldehyde, TEMED, APS, and (3-aminopropyl)trimethoxysilane (APTMS) | 7 steps (including multi-step glass bead functionalisation) | 0.18 mg | 37 hours | 0.005 nM (trypsin nanoMIPs) | 207 nm |
| Silanised MNP method34 | TBAM, NIPAM, MBAm, ethanol, glutaraldehyde, TEMED, APS, APTMS, FeCl3, sodium acetate and ethylene glycol | 5 steps (including multi-step MNP production and subsequent functionalisation) | 0.625 mg | 24 hours | 79.4 nM (protease nanoMIPs) | 183 nm |
| Silanised glass bead22 | TBAM, NIPAM, MBAm, ethanol, EDC/NHS, TEMED, APS, APTMS, and Tween 20 | 7 steps (including multi-step glass bead functionalisation) | 0.439 mg | 37 hours | 9 nM (trypsin nanoMIPs) | 303 nm |
4. Conclusions
We have produced high-affinity nanoMIPs for a range of proteins including haemoglobin, albumin, N-protein of SARS-CoV-2 and lysozyme. Affinity was determined electrochemically. When nanoMIP was integrated with an electropolymerized layer on a disposable electrode, electrochemical impedance spectroscopy showed the device to be sensitive to BHb in a wide concentration range of 100 fM–10 nM, with an LOQ of 10 fM. The KD for BHb nanoMIP islands using this method was determined to be 3.47 × 10⁻¹¹ M, rivaling monoclonal antibody-type affinities. The recycling of the protein template is fundamental to economical scaling-up of nanoMIP production. We demonstrate a method of economically producing aldehyde-functionalised MNPs using a low-energy and fast microwave method and subsequent conjugation with a target protein. With the re-usability of as little as 600 μg of target template (over at least 5 cycles), we are able to demonstrate a method for the scaled-up mass production of nanoMIPs, with up to 10 mg mL−1 produced per cycle. This power ratio of protein used to produce high yields of high-affinity nanoMIP in such a short timescale is unprecedented in the MIP field. The method readily lends itself to further scaling, offering grams of nanoMIP production in one day. Our method offers realistic opportunities for the industry to adopt such smart polymers as an economically viable antibody replacement technology in diagnostics, biological extraction and therapeutics.Author contributions
SMR conceived, designed and directed the study and wrote the manuscript. ANS performed nanoMIP synthesis and optimisations, and electrochemical studies. SRD performed CD spectroscopy. MAH performed atomic force microscopy studies. SMR, ANS, MAH and SRD performed the analysis. WJS advised on microwave synthesis of MNPs. All authors contributed to manuscript revision and reading, and approved the submitted version.Data availability
All data are available within the article and its ESI† and from the authors upon request.Conflicts of interest
The authors declare that the research was conducted in the absence of any commercial or financial relationships that could be construed as a potential conflict of interest.Acknowledgements
The authors are grateful to the University of Central Lancashire, The Royal Society of Chemistry COVID-19 Action fund (H20-188), the RSC Research Enablement Grant (E22-5899202825), the Daiwa Anglo-Japanese Foundation (13094/13916), and The Royal Society (IES\R3\193093) for funding this work. We thank Dr Jennifer Simpson (The Pirbright Institute, UK) for TEM image capture services for the MNPs.References
- D. R. Kryscio and N. A. Peppas, Acta Biomater., 2012, 8, 461–473 CrossRef PubMed.
- H. El Sharif, D. Hawkins, D. Stevenson and S. Reddy, Phys. Chem. Chem. Phys., 2014, 16, 15483–15489 RSC.
- H. El Sharif, Q. Phan and S. Reddy, Anal. Chim. Acta, 2014, 809, 155–161 CrossRef PubMed.
- A. Nematollahzadeh, P. Lindemann, W. Sun, J. Stute, D. Lütkemeyer and B. Sellergren, J. Chromatogr., A, 2014, 1345, 154–163 CrossRef PubMed.
- Y. B. Wei, Q. Zeng, J. Z. Huang, X. R. Guo, L. L. Wang and L. S. Wang, ACS Appl. Mater. Interfaces, 2020, 12, 24363–24369 CrossRef PubMed.
- E. Battista, P. L. Scognamiglio, N. Di Luise, U. Raucci, G. Donati, N. Rega, P. A. Netti and F. Causa, J. Mater. Chem. B, 2018, 6, 1207–1215 RSC.
- S. Graham, H. El Sharif, S. Hussain, R. Fruengel, R. McLean, P. Hawes, M. Sullivan and S. Reddy, Front. Bioeng. Biotechnol., 2019, 7, 115 CrossRef.
- M. Sullivan, W. Stockburn, P. Hawes, T. Mercer and S. Reddy, Nanotechnology, 2020, 32, 095502 CrossRef.
- H. El Sharif, S. Dennison, M. Tully, S. Crossley, W. Mwangi, D. Bailey, S. Graham and S. M. Reddy, Anal. Chim. Acta, 2022, 1206, 339777 CrossRef PubMed.
- A. N. Stephen, S. R. Dennison, M. A. Holden and S. M. Reddy, Analyst, 2023, 148, 5476–5485 RSC.
- M. Kempe and K. Mosbach, J. Chromatogr., A, 1995, 691, 317–323 CrossRef PubMed.
- M. Sullivan, S. Dennison, J. Hayes and S. Reddy, Biomed. Phys. Eng. Expr., 2021, 7, 045025 CrossRef.
- M. Cieplak, K. Szwabinska, M. Sosnowska, K. C. C. Bikram, P. Borowicz, K. Noworyta, F. D'Souza and W. Kutner, Biosens. Bioelectron., 2015, 74, 960–966 CrossRef.
- A. Tretjakov, V. Syritski, J. Reut, R. Boroznjak, O. Volobujeva and A. Öpik, Microchim. Acta, 2013, 180, 1433–1442 CrossRef.
- P. S. Sharma, M. Dabrowski, F. D'Souza and W. Kutner, TrAC, Trends Anal. Chem., 2013, 51, 146–157 CrossRef.
- S. M. Reddy, Q. T. Phan, H. El-Sharif, L. Govada, D. Stevenson and N. E. Chayen, Biomacromolecules, 2012, 13, 3959–3965 CrossRef PubMed.
- F. Canfarotta, A. Poma, A. Guerreiro and S. Piletsky, Nat. Protoc., 2016, 11, 443–455 CrossRef PubMed.
- Q. Li, T. Wang, Y. Jin, C. Wierzbicka, F. Wang, J. Li and B. Sellergren, Sens. Actuators, B, 2022, 368, 132193 CrossRef.
- R. Mahajan, M. Rouhi, S. Shinde, T. Bedwell, A. Incel, L. Mavliutova, S. Piletsky, I. A. Nicholls and B. Sellergren, Angew. Chem., Int. Ed., 2019, 58, 727–730 CrossRef PubMed.
- C. Herrera León, N. A. Kalacas, A. Mier, P. Sakhaii, F. Merlier, E. Prost, I. Maffucci, V. Montagna, H. Mora-Radó, P. K. Dhal, B. Tse Sum Bui and K. Haupt, Angew. Chem., Int. Ed., 2023, 62, e202306274 CrossRef PubMed.
- S. S. Piletsky, E. Baidyuk, E. V. Piletska, L. Lezina, K. Shevchenko, D. J. L. Jones, T. H. Cao, R. Singh, A. C. Spivey, E. O. Aboagye, S. A. Piletsky and N. A. Barlev, Nano Lett., 2023, 23, 9677–9682 CrossRef PubMed.
- C. Cáceres, E. Moczko, I. Basozabal, A. Guerreiro and S. Piletsky, Polymer, 2021, 13, 314 Search PubMed.
- E. Saridakis, S. Khurshid, L. Govada, Q. Phan, D. Hawkins, G. V. Crichlow, E. Lolis, S. M. Reddy and N. E. Chayen, Proc. Natl. Acad. Sci. U. S. A., 2011, 108, 11081–11086 CrossRef.
- N. Cennamo, D. Maniglio, R. Tatti, L. Zeni and A. M. Bossi, Biosens. Bioelectron., 2020, 156, 112–126 CrossRef.
- B. de Geus and C. F. Hendriksen, Res. Immunol., 1998, 149, 533–534 CrossRef.
- C. Glad and I. Nilsson, in Therapeutic Monoclonal Antibodies, ed. C. A. K. Borrebaeck and J. W. Larrick, Palgrave Macmillan, UK, London, 1990, pp. 303–319, DOI:10.1007/978-1-349-11894-6_19.
- N. J. Greenfield, Nat. Protoc., 2006, 1, 2876–2890 CrossRef PubMed.
- L. Whitmore, B. Woollett, A. J. Miles, R. W. Janes and B. A. Wallace, Structure, 2010, 18, 1267–1269 CrossRef PubMed.
- L. Whitmore and B. A. Wallace, Biopolymers, 2008, 89, 392–400 CrossRef PubMed.
- L. Whitmore and B. A. Wallace, Nucleic Acids Res., 2004, 32, W668–W673 CrossRef PubMed.
- D. Wen, T. Ralph, J. Han, S. Bradley, M. J. Giansiracusa, V. Mitchell, C. Boskovic and N. Kirkwood, J. Phys. Chem. C, 2023, 127, 9164–9172 CrossRef.
- K. E. Rasmussen and J. Albrechtsen, Histochemistry, 1974, 38, 19–26 CAS.
- I. Migneault, C. Dartiguenave, M. J. Bertrand and K. C. Waldron, BioTechniques, 2004, 37, 790–802 CrossRef CAS.
- T. Hix-Janssens, J. R. Davies, N. W. Turner, B. Sellergren and M. V. Sullivan, Anal. Bioanal. Chem., 2024 DOI:10.1007/s00216-024-05395-6.
Footnotes |
| † Electronic supplementary information (ESI) available. See DOI: https://doi.org/10.1039/d4bm00990h |
| ‡ These two authors contributed equally to this work. |
| This journal is © The Royal Society of Chemistry 2024 |