
 Open Access Article
 This Open Access Article is licensed under a Creative Commons Attribution-Non Commercial 3.0 Unported Licence
Gelatine–collagen photo-crosslinkable 3D matrixes for skin regeneration†
Gauthier
Menassol
a,
Boudewijn
van der Sanden
 *b,
Laetitia
Gredy
a,
Capucine
Arnol
b,
Thibaut
Divoux
c,
Donald K.
Martin
b and
Olivier
Stephan
*a
*b,
Laetitia
Gredy
a,
Capucine
Arnol
b,
Thibaut
Divoux
c,
Donald K.
Martin
b and
Olivier
Stephan
*a
aMoVe, Laboratoire interdisciplinaire de physique, CNRS UMR 5588, Université Grenoble Alpes, St-Martin d'Hères, France. E-mail: gauthier.menassol@cea.fr; laetitia.gredy@univ-grenoble-alpes.fr; olivier.stephan@univ-grenoble-alpes.fr
bSyNaBi & Platform of Intravital Microscopy, TIMC, CNRS UMR 5525, Université Grenoble Alpes, Grenoble INP, INSERM, Grenoble, France. E-mail: boudewijn.vandersanden@univ-grenoble-alpes.fr; capucinearnol@gmail.com; donald.martin@univ-grenoble-alpes.fr
cENSL, CNRS, Laboratoire de Physique, F-69342 Lyon, France. E-mail: thibaut.divoux@ens-lyon.fr
First published on 12th February 2024
Abstract
Immediate care of skin wounds and burns is essential to repair this mechanical and chemical barrier to infections. Hydrogels have become one of the standard methods for wound care. Here, gelatine–collagen photo-crosslinkable matrixes or hydrogels were manufactured by two-photon polymerization (TPP) or one-photon UV exposure using a Digital Light Processing (DLP) setup. Both techniques are able to construct matrixes from computer-aided design models, which is important for future clinical applications in which wound dressings should be customized. Although TPP can mimic the 3D dermo-epidermal junction with a high spatial resolution (i.e., ∼6 μm3), the manufacturing time was too slow to produce large wound dressings. Therefore, a DLP setup was explored in this study to fabricate large 2D matrixes of several cm2 using the same photo-resist as for TPP, except for the photoinitiator. The fibroblast viability, adherence, and proliferation were analysed in time on both 3D and 2D matrixes in vitro using two-photon microscopy. For both types of matrixes, the adherence and proliferation of fibroblasts (3T3-NIH) were optimal for stiff structures with a Young's modulus of 191 ± 35 kPa compared to softer matrixes of 37 ± 12 kPa. Fibroblast showed complete confluence on Day 14 after seeding on these matrixes, which may create the granulation tissue composed of fibronectin, collagen, and various proteoglycans in the future dermis before repair of the epidermis and disintegrating of their host matrix. For the monitoring of this repair, gelatine–collagen matrixes can easily incorporate bio-optical sensors for the simultaneous monitoring of inflammation processes and wound healing in time.
1. Introduction
The human skin provides a mechanical and chemical barrier to infections, assists the regulation of body temperature, and minimizes trans-epidermal water loss. Applying immediate care to repair skin wounds and burns is important to recover and maintain these functions.1,2 Moist dressings such as hydrogels have become one of the standard methods for wound care to accelerate wound healing.1,3 Biocompatible hydrogels can facilitate rapid wound closure, improve scar quality, and enhance functional outcomes. Hydrogels should cover the entire wound area to effectively accelerate the process of granulation and epithelialization. Previous studies have demonstrated that gelatine gels stimulate migration, adhesion, and proliferation of cells such as fibroblasts and keratinocytes during skin regeneration.1 Fibroblasts create the granulation tissue, composed of fibronectin, collagen, and various proteoglycans, that provides structural integrity to the wound site in the future dermis before the epithelization by keratinocytes or repair of the epidermis.4,5Bio-printing using biocompatible hydrogels has emerged recently as a promising technique for producing customized wound dressings.6 Printing techniques such as Digital Light Processing (DLP) and Two-Photon Polymerization (TPP) utilize computer-aided design (CAD) for complete control of the structure and size of the matrixes for the wound dressing. This facilitates the reproducibility of matrix manufacturing, which is not possible with classical methods such as spin-coating.7 Although the macrostructure of the matrix (size and form) is controlled in 3D printing to enable adherence to the native skin, control of the matrix microstructures, which is to mimic the physico-biochemical properties of the skin extracellular matrix (ECM), remains a challenge that needs to be overcome.
Gelatine methacryloyl (GelMA) hydrogels contain some essential properties of native ECM due to the presence of cell-attaching and matrix metalloproteinase-responsive peptide motifs, which allow cells to proliferate and spread.8 GelMA hydrogels have tuneable mechanical strength due to a variable degree of cross-linking and high oxygen and water permeability, which is crucial for cell survival inside the matrix. The tuning of Young's modulus directly influences fibroblast proliferation, which is more efficient on stiffer substrates (>100 kPa) in comparison to softer matrixes (<20 kPa) that induce cell cycle arrest or cell death.8–10 The Young's modulus of the GelMA hydrogel should approach that of the human dermis, which is about 180 kPa, to optimize fibroblast proliferation.11 GelMA hydrogels can further be loaded with antibiotics, antibacterial nanoparticles, and other drugs that stimulate wound healing.5 Furthermore, the hydrogels may contain bio-(optical) sensors for continuously monitoring wound healing, for which local tissue pH and O2 consumption are relevant indicators of the different stages of an inflammation process and skin regeneration. For instance, a skinwound is in an alkaline state before healing and progresses via a neutral to an acidic pH when the wound healing is completed.5
The aim of this study is to produce a printed photo-crosslinkable gelatine–collagen matrix that mimics the dermo-epidermal junction. The dermo-epithelial junction is an important site of attachment in the skin, occurring at the interface between the basal epidermis and dermis. TPP was our first choice for the 3D printing of matrixes to mimic the dermo-epidermal junction, using a GelMA–collagen–ruthenium formulation. To produce larger 2D structures of several cm2, a DLP setup was utilized using a similar GelMA–collagen formulation but involving an alternative photoinitiator. For that, we selected lithium phenyl-2,4,6-trimethyl-benzoyl-phosphinate (LAP), which is well suited to the Anycubic® Mono X DLP 3D printer with a one-photon absorption at 405 nm instead of the ruthenium(II) complex used for TPP. We demonstrate that these matrixes support the adherence and proliferation of viable fibroblasts. These results from in vitro experiments show the usefulness of the microstructured matrixes to mimic the dermo-epithelial junction of the skin ECM and thus provide a good basis for skin regeneration.
2. Materials and methods
2.1 Preparation of GelMA–collagen–ruthenium photoresist for TPP
The hydrogel photoresist solution was obtained by mixing 1 mL of deionized water with 30 mg of collagen (collagen from rat tail, Sigma–Aldrich), 200 mg of gelatin methacryloyl (bloom 300, 80% degree of substitution, Sigma–Aldrich), and 10 mg of dichlorotris(1,10-phenantroline)ruthenium(II) (Sigma–Aldrich) acting as photoinitiator. We focused on ruthenium complexes for two-photon polymerization (TPP), because this water-soluble photoinitiator has an efficient two-photon absorption at 532 nm, corresponding to the wavelength of the micro-laser used in TPP. The two-photon absorption of these complexes leads to Ru(II)*, which allows the formation of organometallic cationic radicals able to initiate the photopolymerisation reaction (crosslinking of the methacrylated gelatine). In addition, due to steric hindrance, its diffusion is reduced when compared to classical small molecules such as Iragacure, which is usually used as a photoinitiator. As a consequence, spatial resolution is very close to the geometric size of the laser voxel. GelMA can be prepared through one-step synthesis of gelatine (from bovine or porcine skin) with methacrylic anhydride.12 Its degree of functionalization can be adjusted via the feed ratio of gelatine to methacrylic anhydride.8 In this study, we have used the GelMA supplied by Sigma-Aldrich: bloom 300, 80% degree of substitution. After gently mixing the solution at ambient temperature for 1 hour, the temperature was gradually increased to 40 °C to reach a complete dissolution of the components. A strong and solid gel was obtained when the mixture was cooled to room temperature. This strong hydrogel can be stored in a refrigerator for at least two months for later use.2.2 Preparation of GelMA–collagen–LAP photoresist for large 2D matrixes using DLP
A new formulation was investigated using Lithium phenyl-2,4,6-trimethylbenzoylphosphinate (LAP) from Sigma-Aldrich as one photon photoinitiator since the ruthenium complex used for DLP inhibits the reticulation process. At 405 nm, the Metal-to-Ligand Charge-Transfer (MLCT) band is exited and not the metallic one involved in the two-photon absorption. As a consequence, most of the 405 nm photons give only luminescence of the organometallic complexes instead of ruthenium radicals able to initiate the crosslinking process.The DLP photoresist was obtained by mixing 1 mL of deionized water containing the LAP photoinitiator (2.5 mg mL−1) with 30 mg of collagen and either 50 or 200 mg of gelatine methacryloyl (bloom 300, 80% degree of substitution). In this study, these two GelMA concentrations produce either soft or stiff matrixes, which impact fibroblast adherence and proliferation. After gently mixing the solution at room temperature for 1 hour, the temperature was raised to 40 °C to ensure a complete dissolution of the components. Subsequently, the resulting liquid preparation could be used immediately or stored in a refrigerator as a strong gel. Both the gel and matrix are normally transparent for two-photon microscopic analysis. Therefore, we covalently bonded a fluorescein derivative to the matrixes during DLP cross-linking. A solution of this fluorescein derivative was prepared by adding 1 mg of Fluorescein o-acrylate (Sigma-Aldrich) to 10 mL of deionized water and stirred for at least one hour. The solution was then filtered (0.1 μm pore size) to remove non-dissolved parts. Subsequently, 1 mL of this solution replaced deionized water in the previous formulation. This fluorescein derivative may also be used as a bio-optical sensor for pHmatrix analyses during inflammation and skin regeneration.13
2.3 3D two-photon polymerization
GelMA–collagen matrixes were fabricated on a Microlight® (https://www.microlight.fr) two-photon polymerization 3D micro printer,14 combined with an Olympus inverted microscope using a 40× air objective (Olympus, WD = 180 μm, NA = 0.95). The two-photon activation volume (voxel) is estimated to be 6 μm3. A pulsed green Nd-doped yttrium aluminum garnet micro-laser (λ = 532 nm) was used for the photo-polymerization. Prior to printing, glass coverslips (24 × 24 mm) were washed with isopropanol, followed by a bind-silane treatment (Sigma Aldrich) to enhance adhesion between the printed structures and the glass surface. First, a liquid photoresist solution was prepared by slowly heating the solid hydrogel photoresist to 40 °C while stirring continuously. In a second step, a drop of the liquid photoresist solution was deposited on the glass coverslip and allowed to cool to room temperature (gelation of the drop occurred around the sol–gel transition temperature of 35 °C after 10 minutes). Then, 3D structures were fabricated in the solid hydrogel by moving the laser inside the drop, starting at the interface between the glass coverslip and the gelled drop. Following microfabrication, the coverslips were rinsed twice with Phosphate Buffer Solution (PBS) for 30 minutes each at room temperature and at 40 °C to remove all remaining uncrosslinked material.To build large structures exceeding 300 μm2, the Microlight® setup allows replications in the x–y directions using an additional large motorized step-stage of 10 × 10 cm. The small piezoelectric cube (300 μm3) is replicated in this way. The corresponding CAD model of the dermal–epidermal junction elementary block has a 150 × 150 μm base (x–y) with a maximum height of 140 μm (z-direction), as shown in Fig. 1a. Larger assemblies were obtained by replicating this block inside the GelMA–collagen drop. Note that the 3D-TPP always started with a −2 μm offset inside the glass support. In these conditions, the laser process started inside the glass substrate, and the 3D fabrication began subsequently inside the glass, then at the interface between the glass coverslip and the drop, and finally inside the drop. This method ensured the adhesion of the matrix to the glass coverslip after several washing steps in PBS.
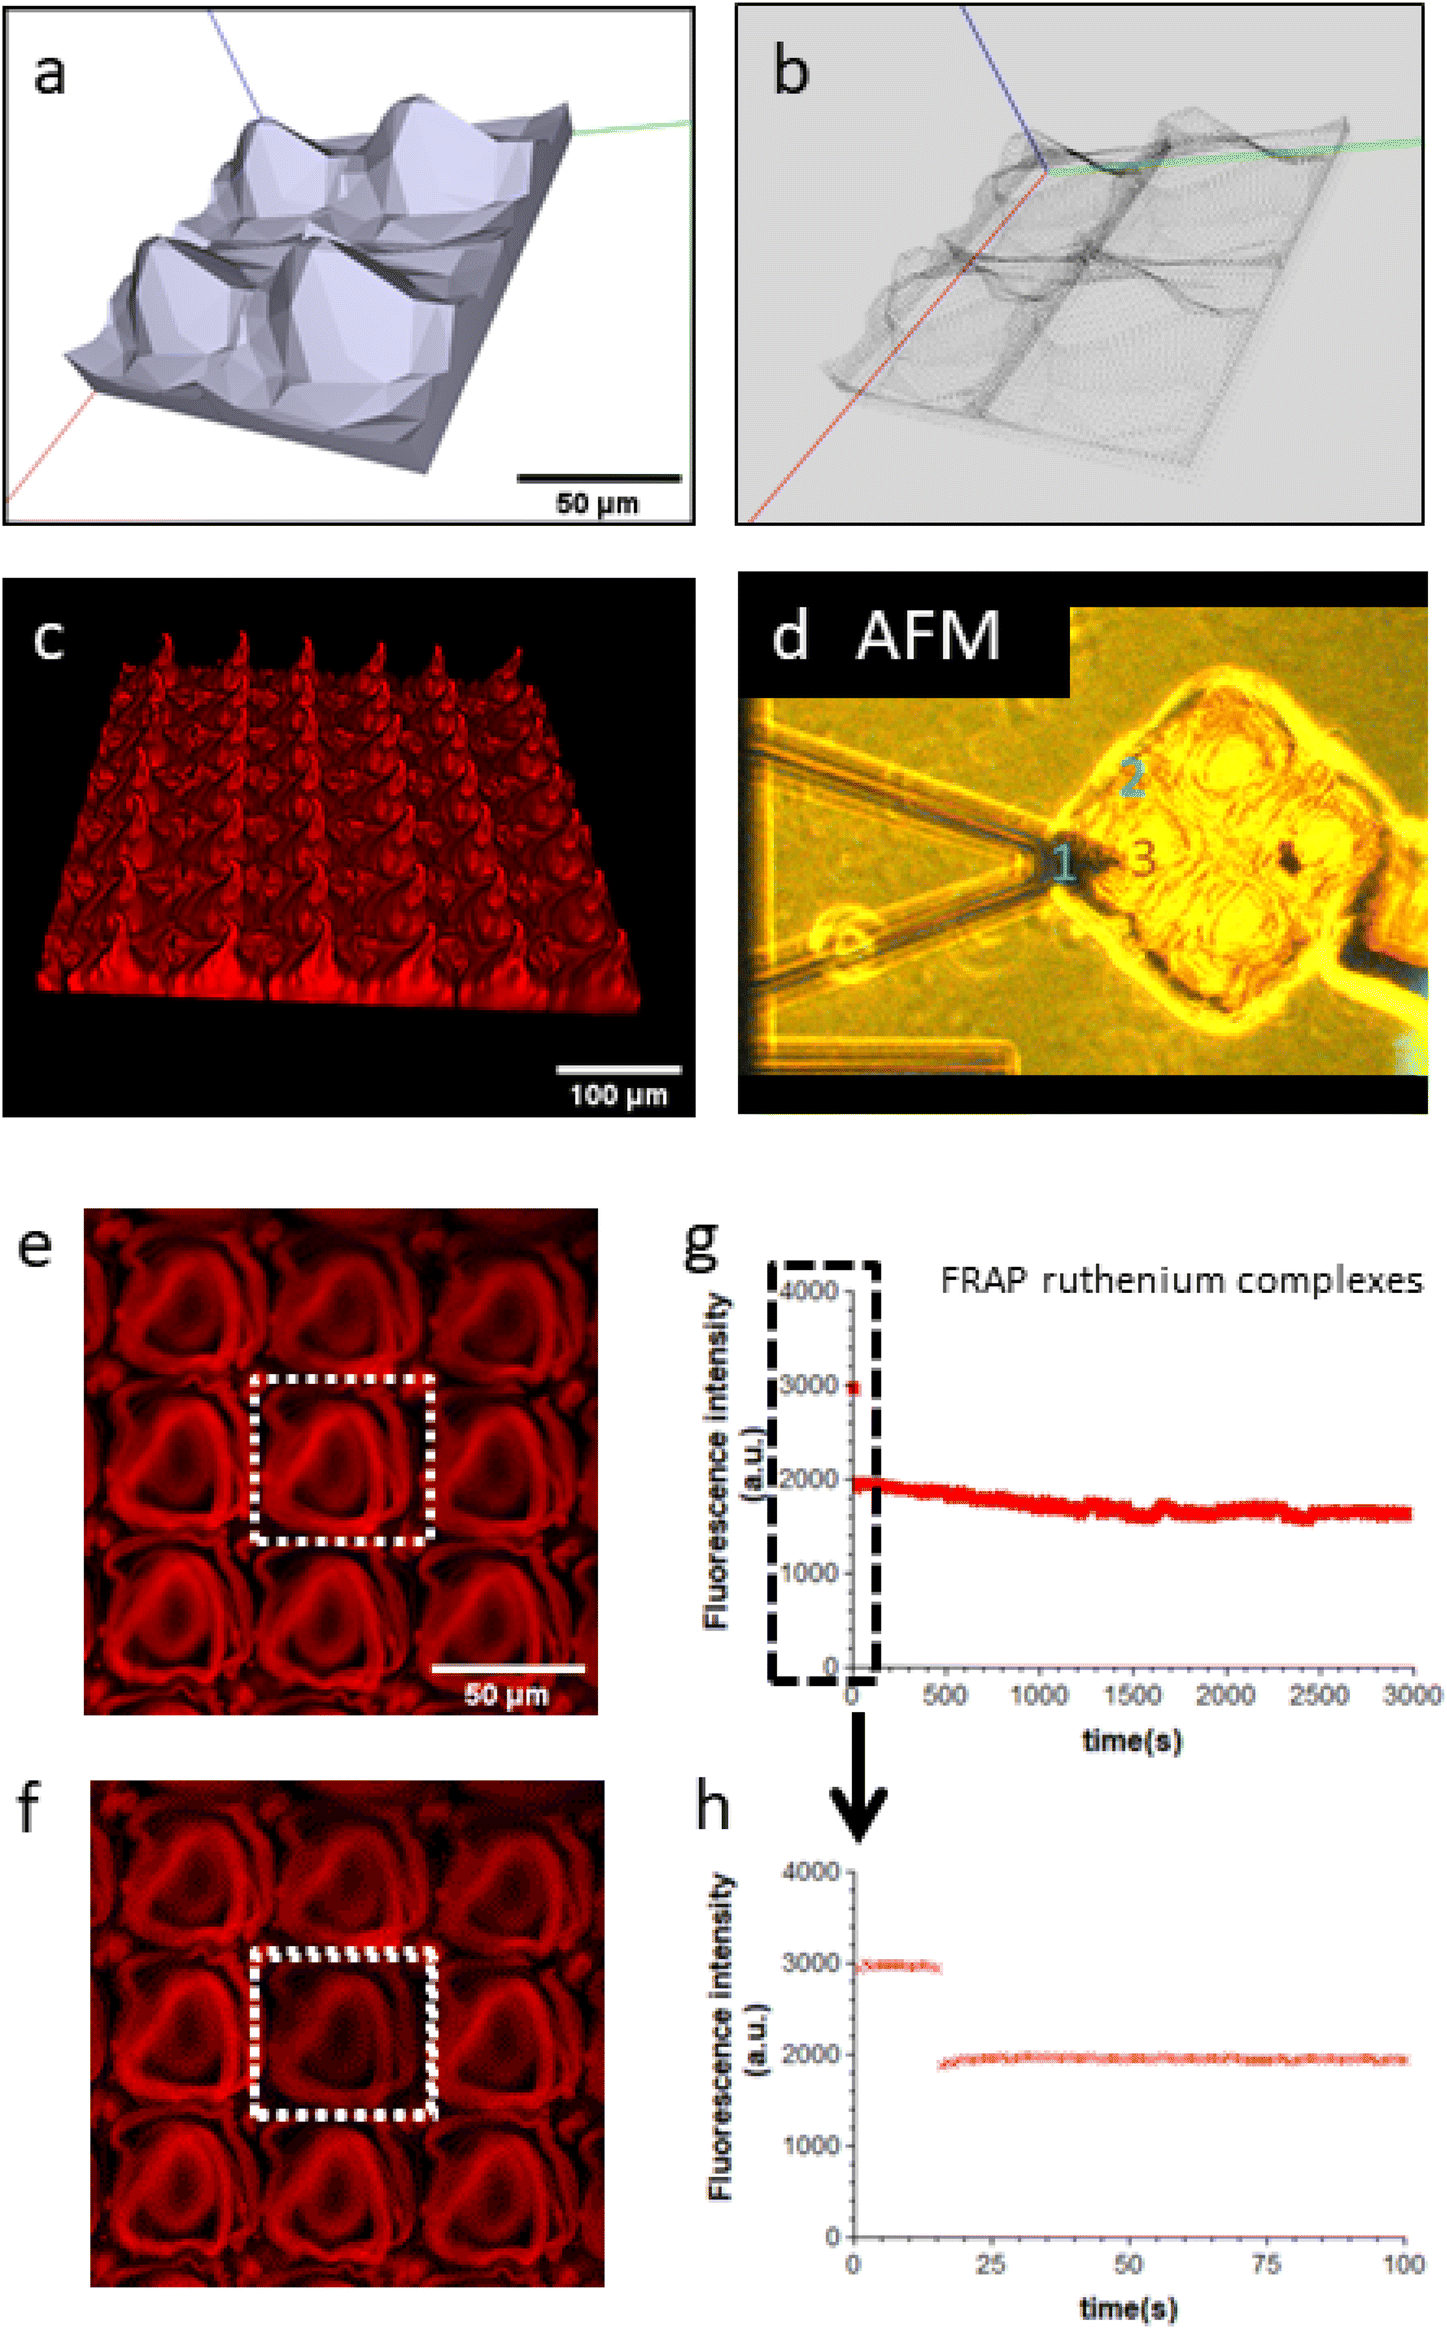 | ||
| Fig. 1 Manufacturing and physical characterization of 3D TPP GelMA–collagen matrixes. (a) CAD file of the matrix that mimics the dermo-epidermal junction. Here, the dimensions are 140 × 140 μm before washing, manufacturing time = 1 min. 3D voxel positions for the two-photon polymerization of the matrix. The scale bar is 50 μm. (b) The number of laser positions (voxels centers) is ∼22.000. (c) 3D two-photon microscopic image of a complete gelatine–collagen matrix of 500 × 500 μm using a 16× objective and a 900 nm excitation wavelength. The scale bar is 100 μm. (d) Positions 1 to 3 for Atomic Force Microscopy (AFM) measurements of Young's modulus in the valleys: positions 1 & 2 and at the top of the dome: position 3. The mean Young's modulus values are, respectively: 20 ± 1 kPa, 60 ± 2 kPa, and 129 ± 4 kPa for 64 measurements per position. (e & f) Fluorescence Recovery after Photobleaching (FRAP) measurements of the ruthenium complexes that are covalently bonded into the matrixes. Photobleaching was performed in the dotted square Region Of Interest. The scale bar is 50 μm. (g) shows the fluorescent signal intensities in arbitrary units (a.u.) of the ruthenium complexes for a total acquisition time of 3000 s. (h) Is a zoom of g or the first 100 s after photobleaching. No fluorescence recovery was observed during the entire acquisition time. | ||
Another key parameter is the manufacturing time of these assemblies, which is determined by the number of laser positions (voxels) where crosslinking occurs inside the GelMA drop. The manufacturing time was reduced by using the minimum number of voxels that were sufficient for the fabrication of stable matrixes after the washing step for the in vitro studies. In the x–y plane, the distance between two voxel positions was fixed at 2.5 μm, while for the z-axis, it was set at 3 μm, which corresponds to ∼22.000 positions for the 150 × 150 μm elementary block (Fig. 1b). The real voxel dimensions for TPP are defined by the 40× objective and are estimated at 1 μm × 1 μm × 6 μm = 6 μm3. Although the spatial resolution is higher in the x–y plane than in the z-direction, an overlap of the elementary crosslinked material in the x-y plane for each voxel volume is still possible due to radical diffusion. The theoretical overlap in the z-direction is 50%. The manufacturing time for the elementary block is ∼1 min (Fig. 1a). For the cell culture tests, a 450 × 450 μm matrix (= 0.25 mm2 after swelling in the PBS buffer) with a manufacturing time ∼9 min was used after replicating the elementary block 3 times in both the x and y directions (Fig. 1c). Note that the manufacturing time for large matrixes of 1.5 cm2 would have taken ∼1 week, which is not possible with the TPP setup and too long for artificial skin applications. For the photo-polymerization per voxel, the laser power was set at 3.5 mW with a fixed exposure time of 1 ms for each voxel position.
2.4 2D matrix obtained using the DLP setup
A single layer was printed by sandwiching a drop of the GelMA–collagen–LAP formulation between the print platform and the resin vat (0.1–0.15 mm Fluorinated Ethylene Propylene film (FEP) with light transmittance around 95%). To control the thickness of the 2D matrix, a distance of 1 mm was maintained between the bottom of the resin vat and the print platform. The drop was then exposed to near-UV blue light (λ = 405 nm) for 5 min at 80% of the 120 W LED overall power. After detachment from the print platform, large 2D matrixes of a few cm2 were obtained. For cell culture, typical 2D matrixes were fabricated starting from 100 μL of the liquid photoresist to form cylindrical matrixes (∼6 mm diameter and 1 mm thickness). Note that increasing the volume of the liquid photoresist leads to larger matrixes (Fig. 4d) that can be cut after fabrication to precisely control their size and shape. In all cases, matrixes were always washed for 20 minutes in deionized water at 40 °C to remove the uncrosslinked materials and then stored in PBS until further use.2.5 Cell culture
Before the in vitro studies, all 3D (TPP) or 2D (DLP) matrixes were always immersed in a solution that contained 1 mL DPBS (PBS without calcium and magnesium) and 0.100 mL of penicillin–streptomycin (10![[thin space (1/6-em)]](https://www.rsc.org/images/entities/char_2009.gif) 000 U mL−1) (Fisher Scientific), and then incubated (37 °C, CO2 5%) for 3 days to sterilize the hydrogels structures. Matrixes were then rinsed 3 times with DPBS and 3 times with Dulbecco's Modified Eagle Medium (DMEM) and left in the incubator overnight before seeding with cells.
000 U mL−1) (Fisher Scientific), and then incubated (37 °C, CO2 5%) for 3 days to sterilize the hydrogels structures. Matrixes were then rinsed 3 times with DPBS and 3 times with Dulbecco's Modified Eagle Medium (DMEM) and left in the incubator overnight before seeding with cells.
Mouse 3T3-NIH fibroblast cells (ThermoFisher Scientific) were cultured at 37 °C with 5% CO2 in Dulbecco's Modified Eagle's Medium (DMEM) 4.5 g L−1 glucose + GlutaMax, supplemented with 10% fetal bovine serum and 1% antibiotic solution (10.000 U mL−1 of penicillin–streptomycin). 100.000 cells were seeded on matrixes in 60 × 15 mm cell culture dishes. All cell nuclei were marked either with Hoechst (Sigma-Aldrich) 1 mg mL−1 or with SYTO-13 (ThermoFischer Scientific) 3.3 mg mL−1, or with propidium iodide (PI, Sigma-Aldrich) 1 mg mL−1 to determine the proportion of dead cells. In studies with TPP matrixes, the cell cytoplasm was further marked with AB176735 cyto-painter from Abcam.
2.6 Mechanical measurements
The Young's modulus E is derived by fitting the Force–indentation curve (F–δ curves), using E as the fit parameter and constant values for θand v. Here, ν is the Poisson ratio of 0.5 for hydrogels, and θ = 20°. AFM measurements were performed 3 times at 3 different locations (see Fig. 1d) to estimate average values of the Young's modulus.
2.7 Two-photon microscopy
All experiments were performed on a two-photon microscope (Trimscope II, LaVision BioTec, Bielefeld, Germany) coupled to a pulsed infrared laser (Insight Deepsea, Micro-Control Spectra Physics, Evry, France) with wavelengths tunable between 700 to 1300 nm. All 3D two-photon time-series images were mostly acquired with a 20× objective (N.A. = 1.0, WD = 1.7 mm, ZEISS, France) using an x–y plane resolution of 0.93 μm per pixel, a typical total image size of 504 × 504 pixels (469 × 469 μm) and interslice distance of 2 μm for z-stack acquisitions. A wavelength of λex = 900 nm was used for the simultaneous excitation of the ruthenium complex and cells marked with AB176735 cyto-painter. A wavelength of λex = 800 nm was used for cells marked with Hoechst, SYTO-13, and PI. The emission filters in front of the PMTs for the blue, green, and red channels had respectively the following characteristics: 420 ± 50 nm, 542 ± 50 nm, and 630 ± 50 nm.Fluorescence Recovery After Photobleaching (FRAP) experiments were performed on the two-photon microscope. A Region Of Interest (ROI) for photo-bleaching was selected using Inspector Pro64 Acquisition software on the Trimscope II. A time series of 3000 images (1 image per s) was defined as follows: 30 images were acquired before bleaching at 15% laser power, followed by 30 images with ROI photo-bleaching at 100% laser power (1.2 W) at 900 nm, and 2940 images at 15% laser power to analyse ruthenium or fluorescein fluorescence recovery time. A stage-top incubator (Okolab, Pozzuoli, Italy) was used to maintain a stable environment of O2 (19%), CO2 (5%), and temperature (37 °C) during the two-photon microscopy and FRAP experiments with or without cells on the matrixes. For the control FRAP experiments on matrixes without cells, the CO2 content was set to 0. The gas mixture and temperature were monitored online every 30 s and stored in a datalog file during each entire experiment.
2.8 In vivo two-photon microscopic analysis of 2D large DLP matrix stability
All animal procedures were performed in accordance with the Guidelines for Care and Use of Laboratory Animals of the European directive 2010/63 and were approved by the local and national ethical committees, permit number APAFIS#27767-2020092209498616 v5. Dorsal skinfold chambers were surgically implanted on the back of transgenic C57BL/6 mice CX3CR1GFP (The Jackson Laboratory, Bar Harbor, ME USA). These mice express GFP in the cytoplasm of mononuclear phagocytes. This transgenic mouse model is generally used to study inflammation reactions in vivo.Mice with a minimal weight of 20 g were anesthetized through an intraperitoneal injection with ketamine (100 mg per kg bw; Ketamine™ 10%, Bayer Health Care, Leverkusen, Germany) and xylazine (25 mg per kg bw; Rompun® 2%; Bayer Health Care, Leverkusen, Germany). The entire procedure was done with sterile instruments. Mice were placed on a 36 °C warm plate during surgery. Their backs were shaved and afterward depilated with hair removal cream (Veet Minima™, France). A midline was drawn with a sterile skin pen to obtain a medial position of the skinfold chamber. Both plates of the dorsal skinfold chamber were fixed with 8 sutures. Spacers of 1.8 mm were present between the plates to avoid pressure on the skin and changes in blood perfusion around the window. At the side of the window, the skin was removed, and the subcutaneous tissue was kept moistened with sterile saline. Matrixes were implanted, and a coverslip was finally placed on the observation window and secured with a ring. For recovery after surgery, mice were placed on a 36 °C warm plate until awakening. For the following 7 days after surgery, an analgesic, paracetamol, was added to their water for pain relief. Mice were housed individually, and their weight was measured daily. Mice were only sacrificed if their weight loss exceeded 15%, which occurred in approximately 2% of the cases. The matrix stability was analyzed on the two-photon microscope at D14 following matrix implantation.
2.9 3D two-photon image treatment and analysis
The 3D two-photon microscopic images acquired using z-stack acquisitions were prepared for 3D reconstruction using DIVA software (https://diva.pasteur.fr/download/). For the different colour channels (blue and/or green, and red), a background correction was performed using the rolling ball algorithm in ImageJ (https://imagej.nih.gov/ij/) with a standard radius of 50 pixels. The two-photon images of the different channels were converted from 16 to 8 bits. These modified images were then merged into a composite image in TIFF format that can be processed by DIVA software (https://diva.pasteur.fr/).2.10 Statistical analyses
All statistical analyses were performed using GraphPad Prism (version 3.02). Differences between mean cell densities from 3 regions of interest par matrix were analysed with the unpaired two-tailed t-test and considered to be significant for p-values <0.05.3. Results
We first report the physical characterization of the 3D GelMA–collagen–ruthenium matrixes manufactured by TPP and then the adherence, proliferation, and viability of fibroblasts on these matrixes. Next, we report our results using the 2D GelMA–collagen–LAP matrixes as an alternative for the rapid production of large matrixes for skin generation.3.1 Physical characterization of the 3D TPP GelMA–collagen–ruthenium matrixes
Fig. 1a–c shows the first steps of the manufacturing of GelMA–collagen matrixes that mimic the dermo-epidermal junction. The process begins with the generation of a computer-assisted design (CAD file) of the matrix (Fig. 1a) before defining the voxel positions using Microlight® software (Fig. 1b). At these positions, TPP is applied within 6 μm3 voxels. To conduct cell adherence, proliferation and viability tests, smaller matrixes of 500 × 500 μm are produced (Fig. 1c). The Young's modulus at different positions across the matrixes was measured by AFM, indicating mean values of 20 ± 1 kPa (position 1), 60 ± 2 kPa (position 2), and 129 ± 4 kPa (position 3) (Fig. 1d). The top of the domes was approximately six times stiffer than the valleys, influencing fibroblast adherence and proliferation, as detailed in section 3.2 and ESI results (Fig. 1S†). In TPP, ruthenium organometallic complexes were used as a photoinitiator, which is toxic to cells if these complexes can diffuse freely within the matrix. Therefore, FRAP experiments were performed (Fig. 1e–h), to check if ruthenium fluorescence recovery was observed in the Region Of Interest (ROI, dotted white boxes in Fig. 1e and f) after photo-bleaching this ROI at 100% laser power. The absence of recovery within 50 minutes indicates that ruthenium complexes surrounding the ROI did not diffuse inside the ROI due to their covalent bonding to the matrix during TPP. Note that a recovery time of 50 min is sufficient for freely diffusible small fluorescent dyes in solution. These FRAP results are confirmed by a previous study where the ruthenium fluorescence intensities of the TPP matrixes and their stability in cell culture conditions remained constant for at least 2 months.163.2 Fibroblasts cell adherence, proliferation, and viability on the 3D GelMA–collagen–ruthenium matrixes
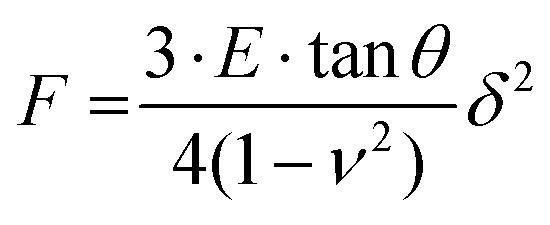
In Fig. 2, the adherence and proliferation of fibroblasts stained with green AB176735 cyto-painter on the GelMA–collagen–ruthenium matrixes were followed for 14 days. Initially, on day 1, fibroblast adherence was observed only on the domes of the matrixes (Fig. 2b). In a sequential recording of z-stack acquisitions, fibroblasts that adhered to the matrix at soft positions migrated towards the top of the domes (Fig. 2c). In comparison, fibroblasts in the softer areas (∼20 kPa) in between the domes showed either cell cycle arrest or cell death exhibiting neither migration nor proliferation (Fig. 1S, ESI†). At day 14, fibroblasts clustered around the top of the domes, with dead cells located inside the chronic hypoxic areas, as indicated by propidium iodide staining. These experiments were repeated 3 times and gave similar results.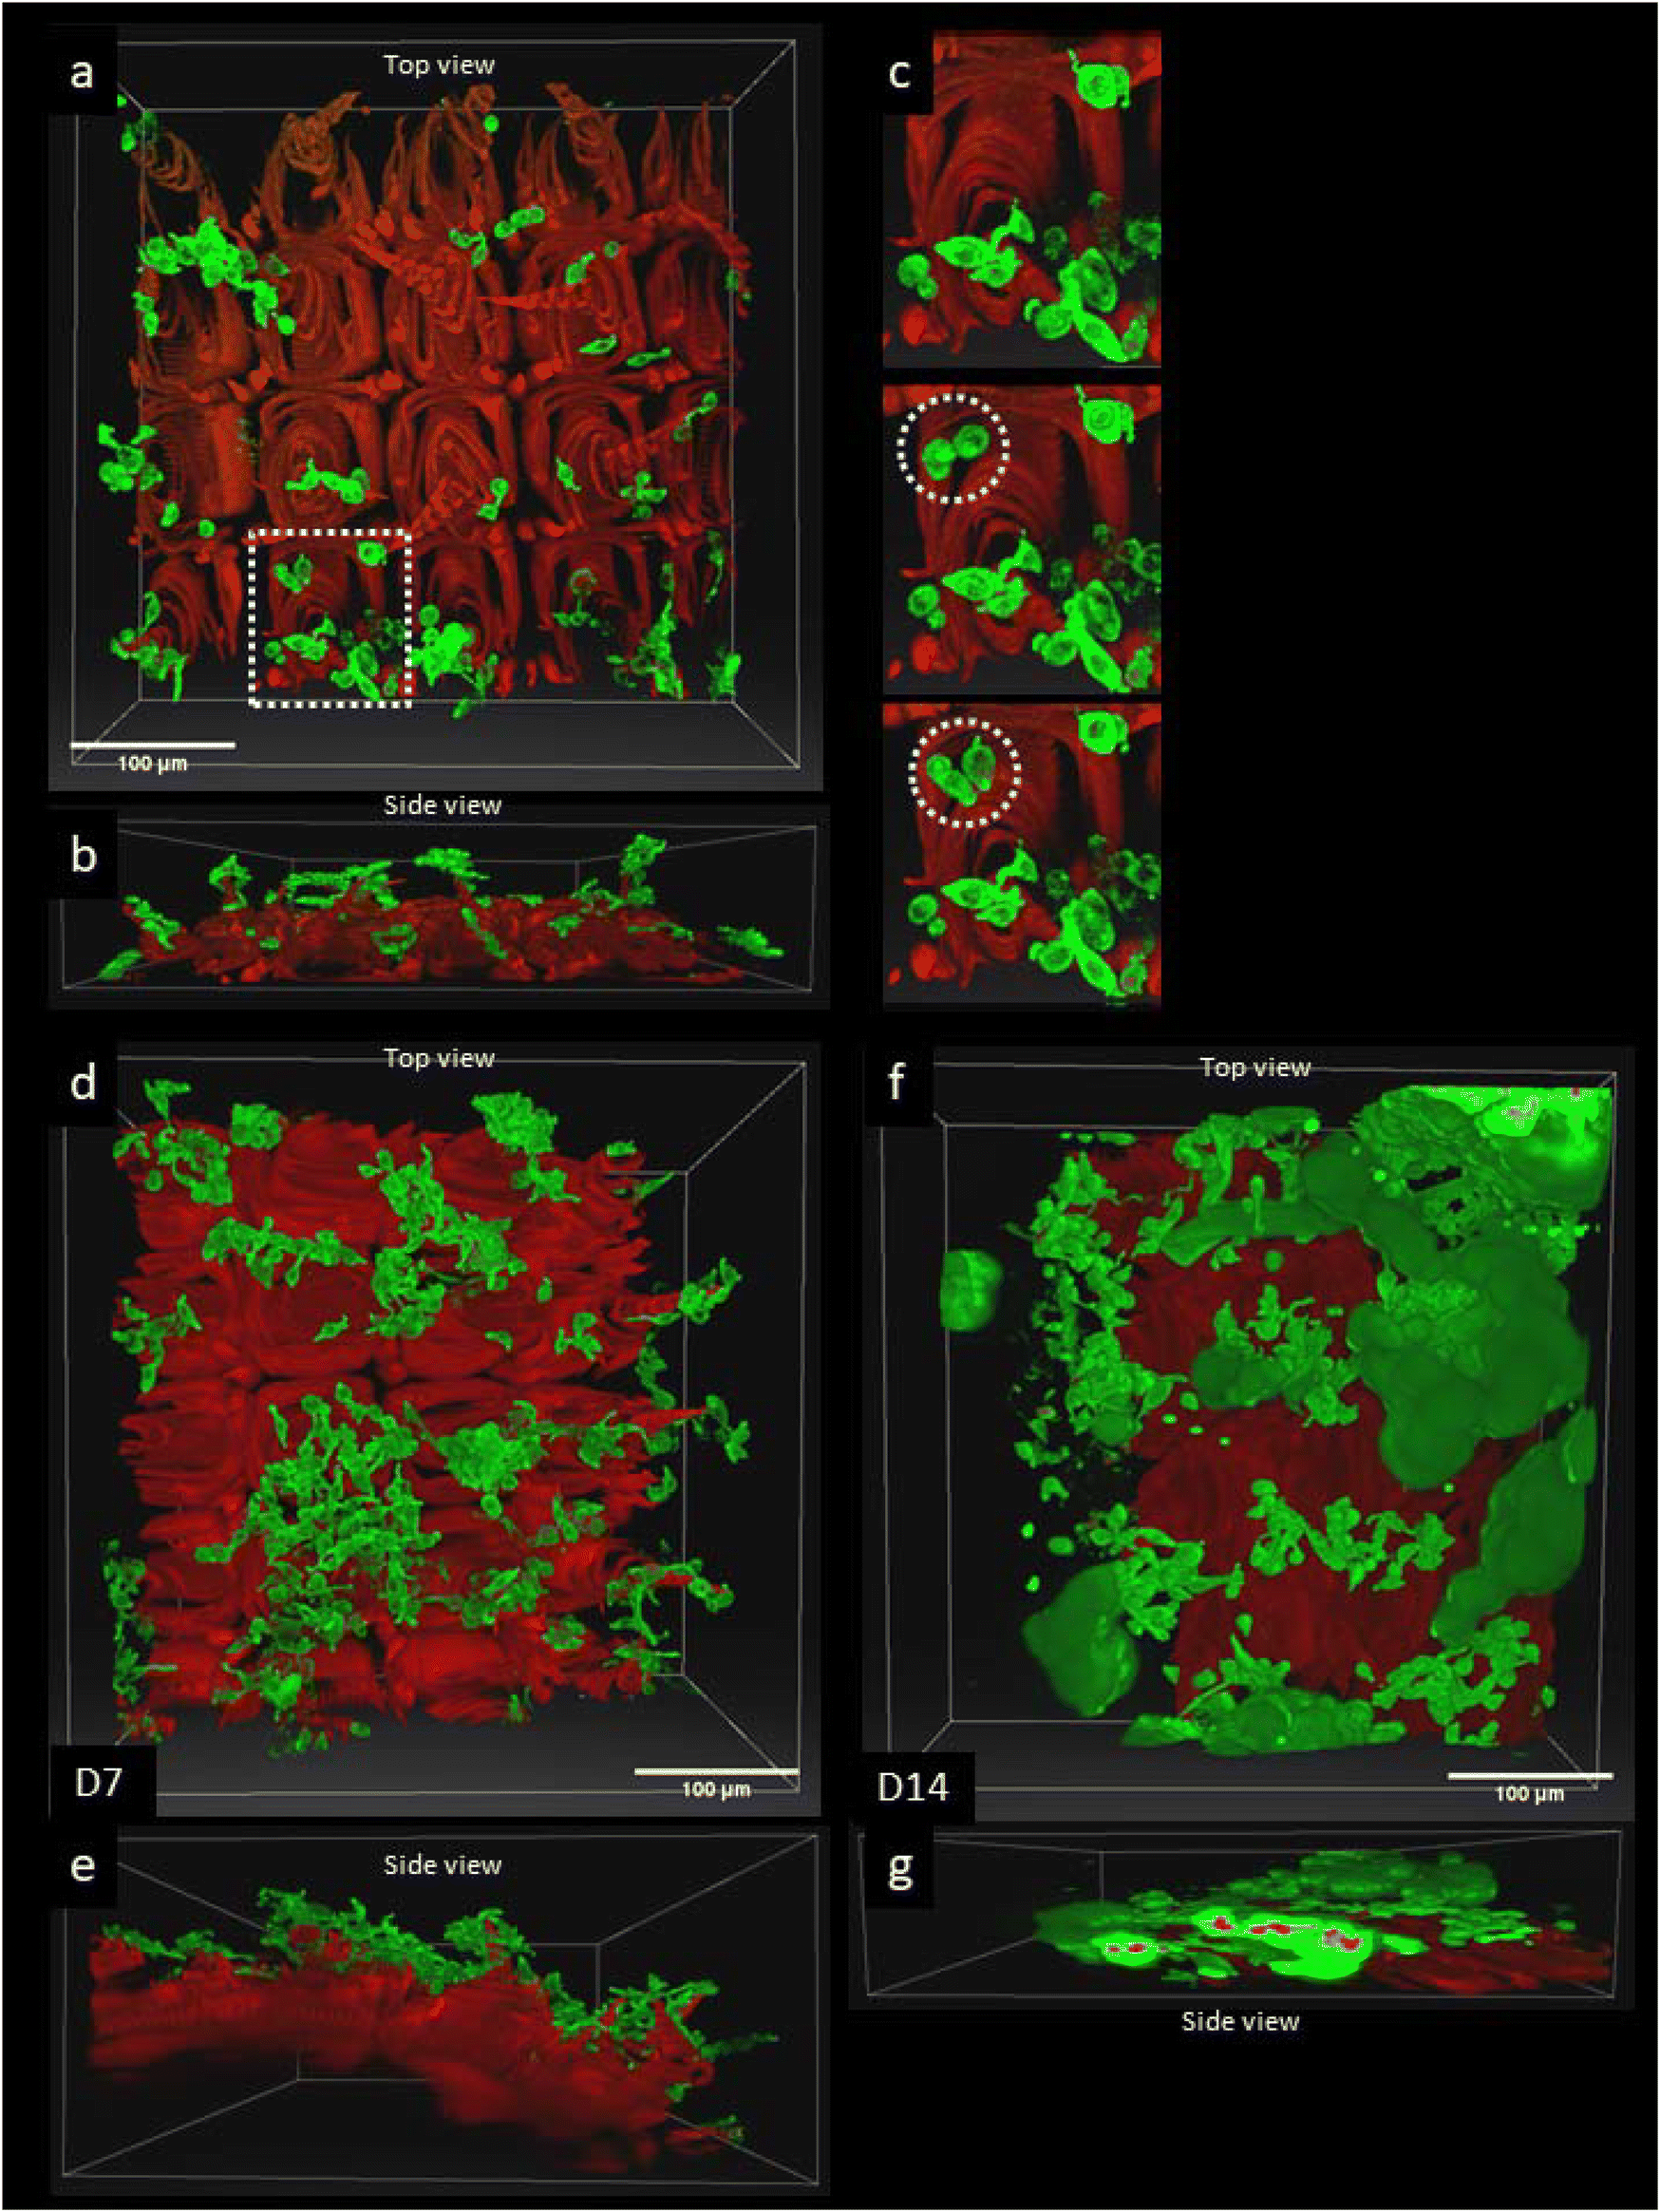 | ||
| Fig. 2 3D Time-lapse studies of 3T3 NIH mouse fibroblasts cell proliferation on the 3D GelMA–collagen matrixes. (a & b) Shows 3D two-photon images of the top view (a) and side view (a) of the red GelMA–collagen matrix with green fibroblast cells at day 1 after cell seeding using the green fluorescent cyto-painter (ab176735) before seeding. The scale bar is 100 μm. The 3D image is the last 3D image of 2 h time series with a Z-stack acquisition every 5 min. The white box size is 469 × 469 × 112 μm. Z-Stack acquisition was performed using a 20× objective with an excitation wavelength of 900 nm. (c) Detail of the white dotted ROI in (a) showing the adherence over time of green fibroblast cells to the rigid base of a dome (white dotted circles). The time between 3D images is 15 min. Fibroblasts showed more adherence on the rigid domes compared to the softer valleys in between the domes (cf.fig. 1e and f). (d & e) Top view (d) and side view (e) of the fibroblast distribution at day 7 after seeding. The box size is 469 × 469 × 344 μm. The domes are more crowded by cells than the valleys. The scale bar is 100 μm. (f & g) Top view (f) and side view (g) of the fibroblast distribution at day 14. The box size is 469 × 469 × 202 μm. The red fluorescence signals inside the fibroblast aggregates in the side view (g) are dead cells stained by PI. The scale bar is 100 μm. | ||
In the next series of experiments, cell viability was analysed on the 7th day following seeding (Fig. 3). The nuclei of all fibroblasts were stained with Hoechst and propidium iodide (PI), and the proportion of dead cells was determined based on the number of cell nuclei stained with PI (marked by white dotted circles in Fig. 3b, and note that PI only diffuses into the nuclei of dead cells). The mean percentage of dead cells was only 4.0 ± 0.4% compared to a vast majority of live cells of 96 ± 2% (n = 5 matrixes). In Fig. 3a & b, the cell density at the bottom of the Petri dish was compared to the density at the top of the matrix. The mean cell density at the bottom of the Petri dish was 2000 ± 143 cells per mm2, whereas at the top of the matrix, it was 1357 ± 286 cells per mm2. The differences in cell density are significant: p = 0.007 (unpaired two-tailed t-test).
 | ||
| Fig. 3 Cell viability studies of fibroblast cells on GelMA–collagen matrixes at D7. (a & b) 3D two-photon image of the corner of a red matrix with fibroblast cells adherence on the matrix and on the bottom of the Petri dish at day 7 after cell seeding. The white box size is 469 × 469 × 228 μm, and all images are top views. The cytoplasm of the fibroblasts is stained by the green fluorescent cyto-painter ab176735 (a), all nuclei by Hoechst 33342 (blue – green fluorescent), and the nuclei of the dead cells by PI (b, red fluorescence in dotted white circles). The mean percentage of dead and living cells at day 7 were respectively 4.0 ± 0.4% and 96 ± 2% (n = 5 matrixes). The mean cell density at the bottom of the Petri dish was 2000 ± 143 cells per mm2, and at the top of the matrix was 1357 ± 286 cells per mm2. The differences in cell density are significant: p = 0.007 (unpaired & two-tailed t-test). The scale bar is 100 μm. (c) Individual slices of a z-stack acquisition of 114 slices showing the nuclei of all fibroblasts, starting at the bottom of the Petri dish, (left box) halfway through the matrix (middle box), and on the top of the matrix (right box). The scale bar is 100 μm. | ||
The 3 boxes in Fig. 3c show 3 planes of a z-stack acquisition at the bottom (left box), halfway (middle box), and top (right box) of the matrixes. Fibroblasts remained at the surface of the matrix, probably due to TPP resulting in matrixes with a high cross-linking density, hindering the migration of fibroblasts inside the 3D structures. Similar results were obtained for the 2D DLP matrixes (see section 3.3). The images in the boxes of Fig. 3c demonstrate that fibroblasts prefer stiffer matrixes and surfaces, leading to a heterogeneous distribution at the top of the domes within the matrix, cf. the right box of Fig. 3c.
This second series of experiments showed that fibroblasts adhered, migrated, and proliferated on the surface of 3D GelMA–collagen–ruthenium matrixes. The results showed the preference of fibroblasts for stiffer domes over the softer regions between the domes (cf.Fig. 1d). Importantly, the matrix was not cytotoxic, because the mean percentage of dead cells was only 4.0 ± 0.4% at day 7 after seeding. Taken together with our FRAP results, this confirms that the ruthenium complexes are covalently bonded to the matrixes and do not diffuse freely in the hydrogel.
3.3 Fibroblasts cell adherence, proliferation, and viability on 1 mm thick 2D GelMA matrixes obtained using a DLP setup
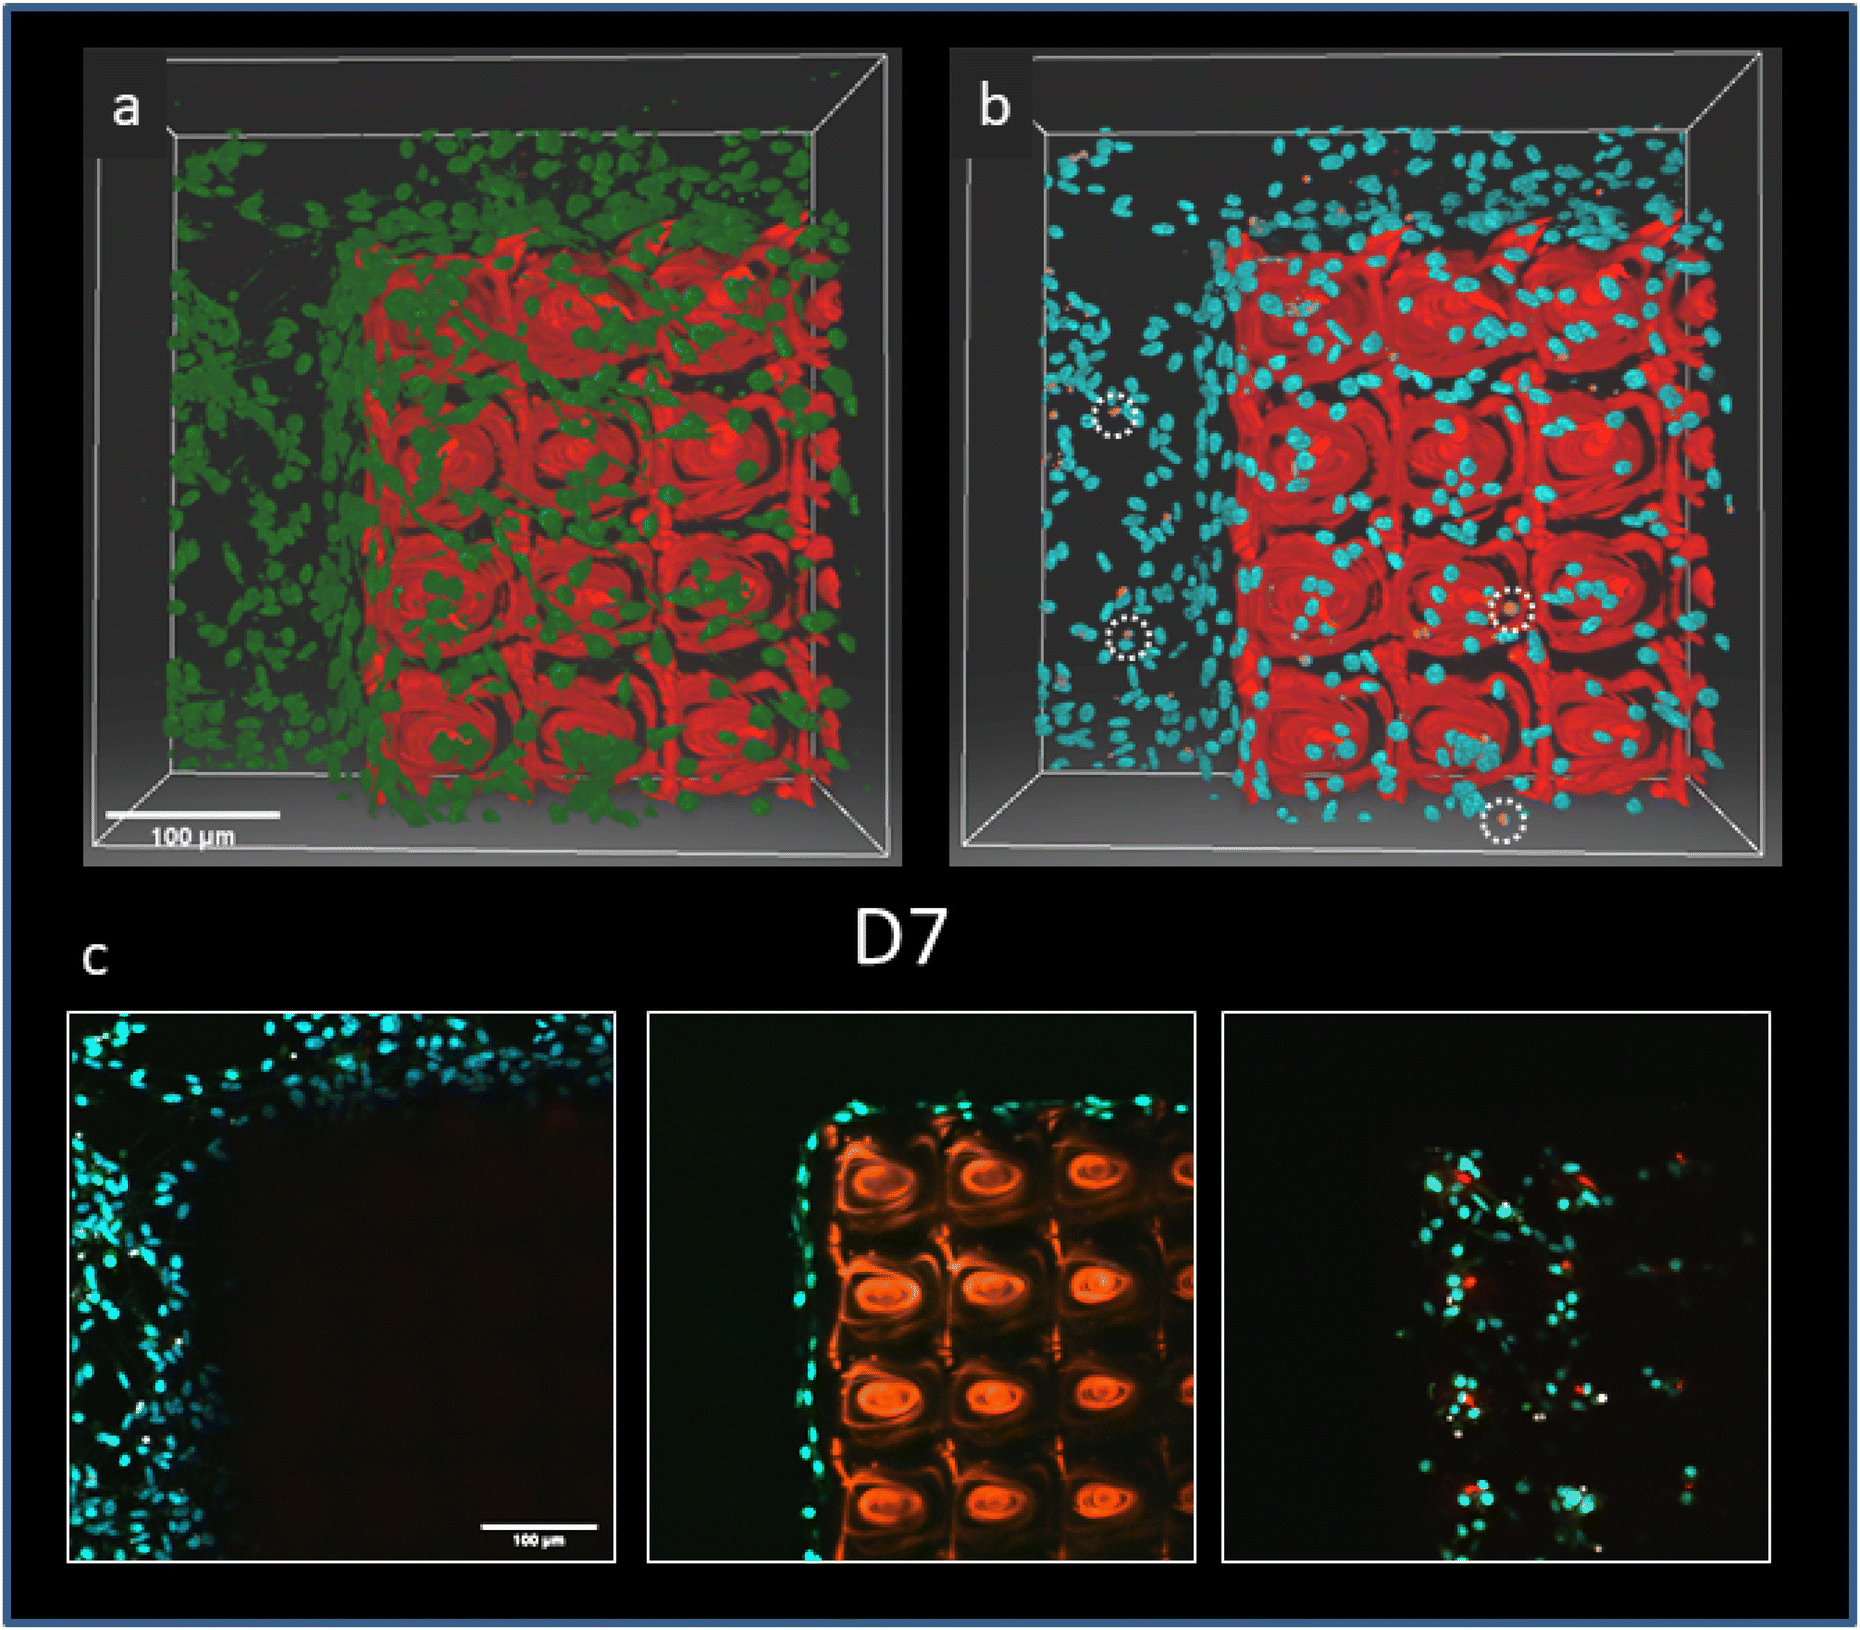
The advantage of DLP is the ability to produce large-area matrixes in a short period of time compared to TPP (Fig. 4a). The DLP protocol using one photon exposure at 405 nm took 5 minutes to produce a large matrix of 1 mm in thickness. The production time of a DLP matrix does not depend on its size in the x and y directions but rather on the number of layers in the matrix. In our case, a single image (one layer) is projected by the UV LEDs on the printing platform. Note that in comparison to visible light photopolymerization in TPP, photo-crosslinking at 405 nm (near UV) may affect cell viability and, therefore, could limit the use of DLP at this wavelength for applications using bio-ink materials in tissue engineering. Unlike TPP structures, DLP matrixes are invisible on a two-photon microscope when using the LAP photoinitiator. Consequently, fluorescein-acrylate was covalently bound to the matrix materials during crosslinking (Fig. 4b & c). Indeed, in FRAP experiments, no fluorescein fluorescence was recovered after photo-bleaching a ROI at the top of the matrix (Fig. 4d), indicating that fluorescein acrylate cannot diffuse freely in the matrix. An advantage of this dye is that it can be used as a bio-optical sensor for local pHmatrix measurements.13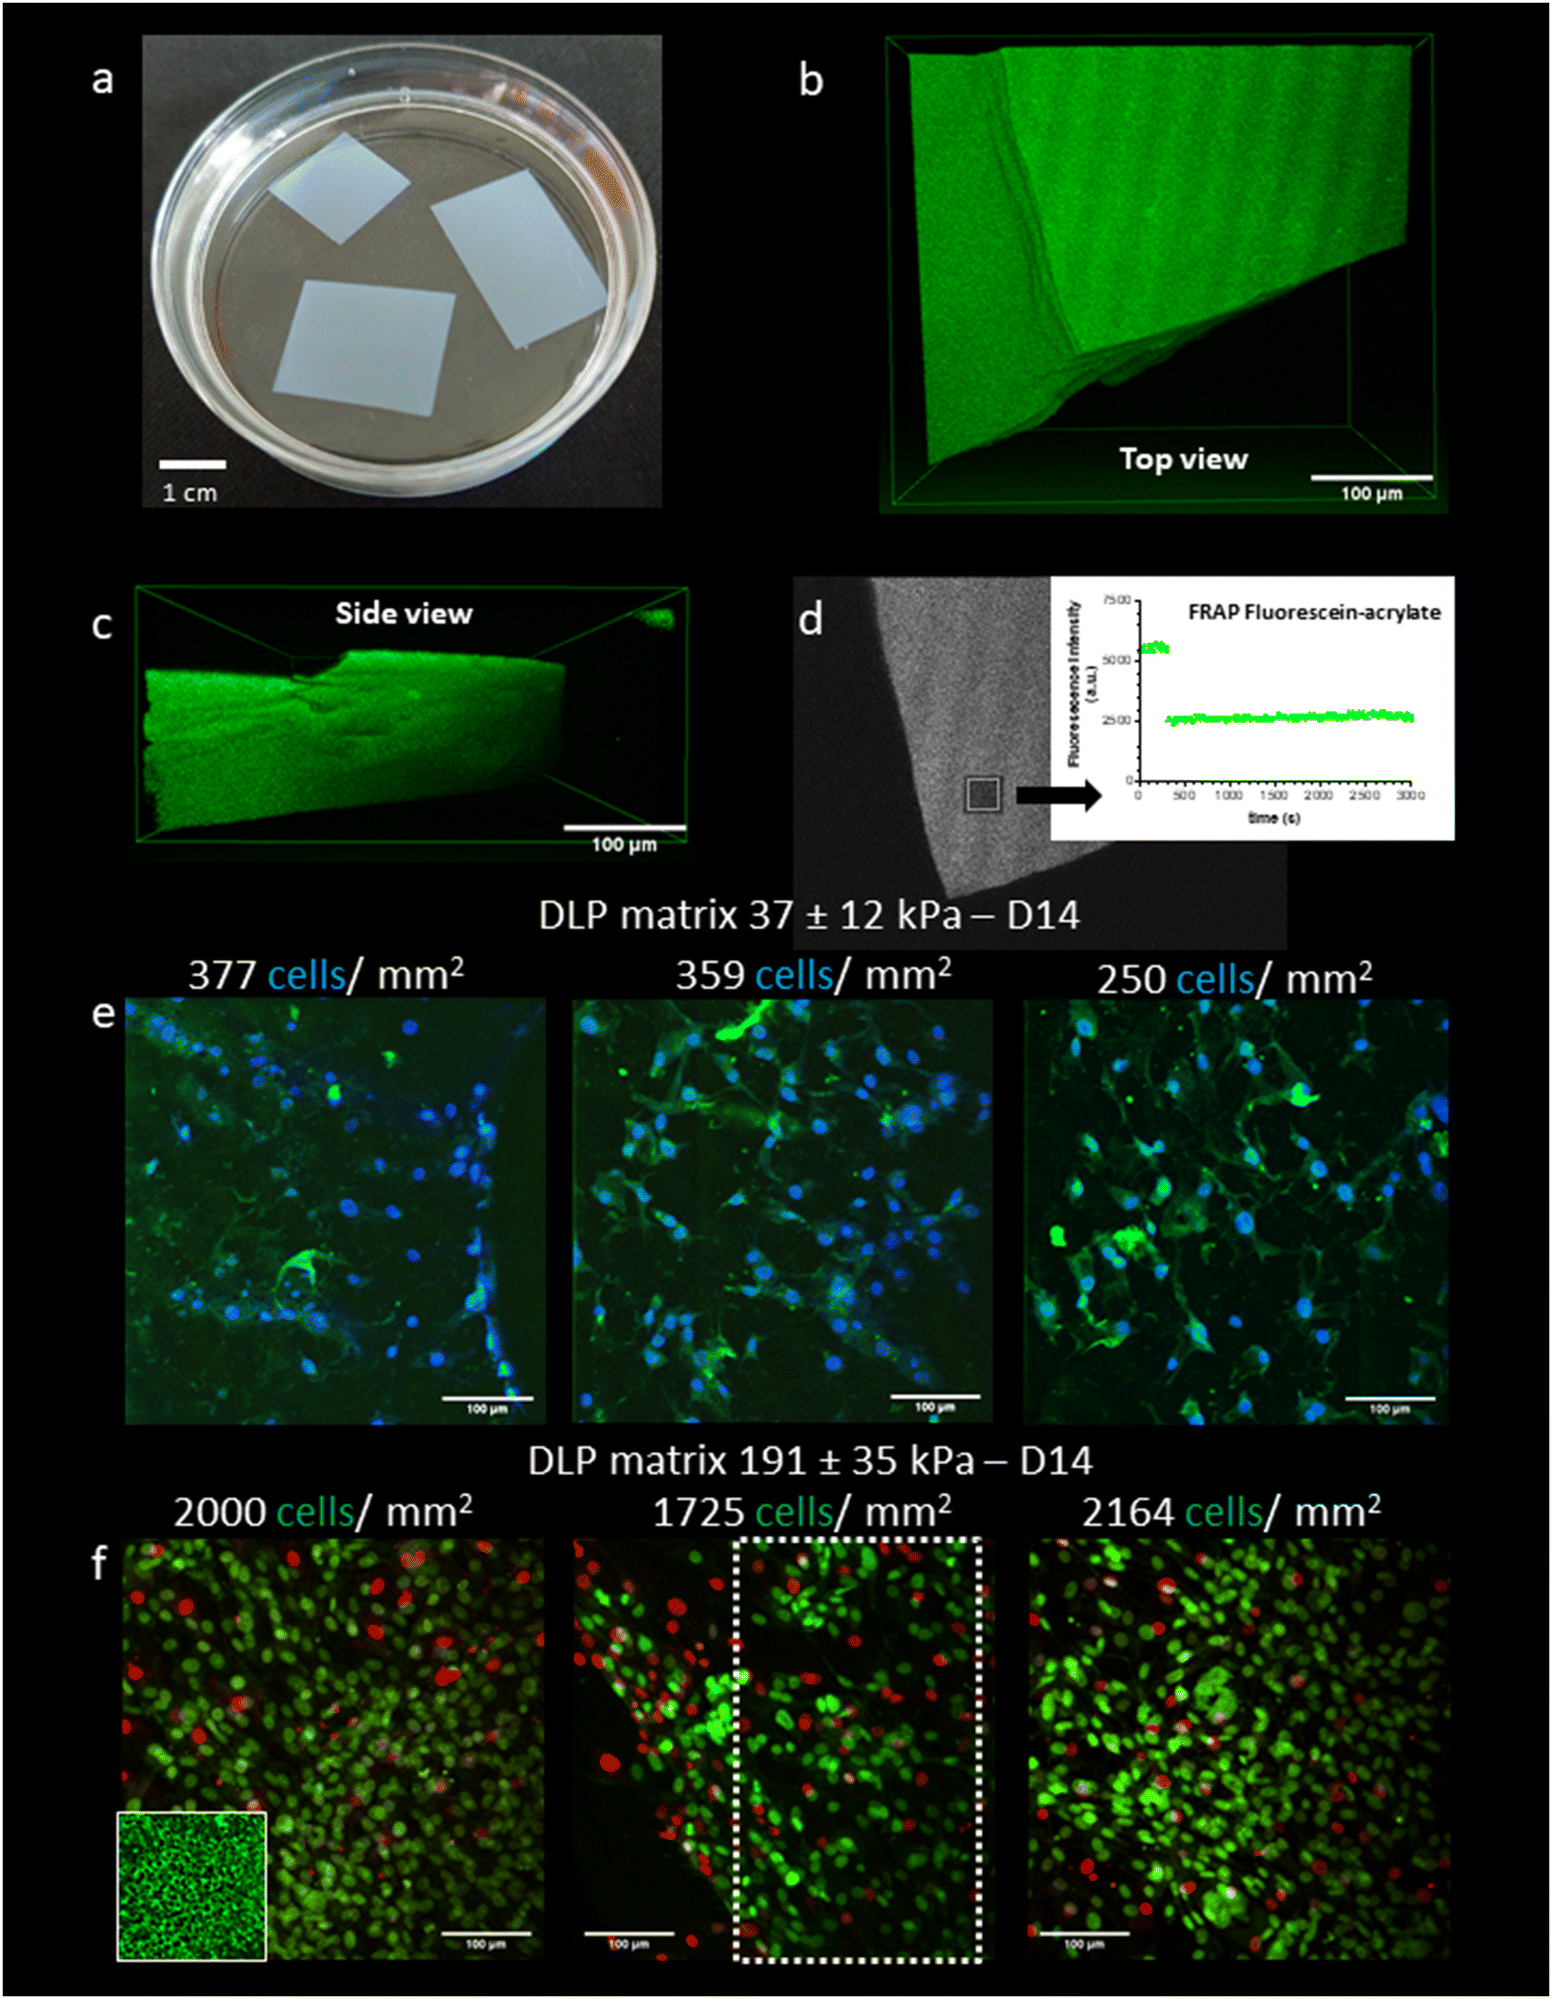 | ||
| Fig. 4 2D GelMA–collagen LAP matrixes. (a) Colour photo of large 2D GelMA–collagen matrixes in a Petri dish. The scale bar is 1 cm. (b & c) 3D two-photon images of a top view (b) and side view (c) of a GelMA–collagen LAP matrix after a homogeneous staining with covalently bonded fluorescein-acrylate. The white box size = 469 × 469 × 350 μm. The scale bar is 100 μm. (d) FRAP analyses of the green fluorescence recovery of fluorescein acrylate after photobleaching (see insert) for the white dotted ROI in the region of photobleaching at the top of the matrix. No fluorescence recovery was observed during 50 min. (e & f) 2D two-photon images for the analyses of the fibroblast density at D14 after cell seeding for 3 different locations at the surface of the matrixes of different stiffnesses. Fibroblasts did not enter any of the matrixes but showed a strong adherence on their surfaces. (e), soft matrixes (37 ± 12 kPa), and mean fibroblast density was 329 ± 52 cells per mm2. All nuclei were stained with Hoechst 33342 (blue staining) and Propidium Iodide (PI, red staining for dead cells). No dead cells were detected. (f) stiff matrixes (191 ± 35 kPa), and mean fibroblast density was 1963 ± 159 cells per mm2 (significantly different to the soft matrixes, p < 0.0001, unpaired two-tailed t-test). The cell density was analysed inside the white dotted rectangular in order to exclude the black area outside the matrix at the left bottom of the image. Hoechst 33342 was replaced by SYTO-13 (green staining), which led to a strong fluorescence intensity for nuclei staining that was subtracted to allow the green endo-fluorescence of the fibroblasts to be more visible. The insert in the first image shows the confluence of the fibroblasts on the top of the matrix. The greater confluence due to the higher cell density caused more cell death, which was observed by the red PI staining in the main images. These dead cells were excluded from the cell density estimations. The scale bar is 100 μm. | ||
Fig. 4e & f show the fibroblast density (cell per mm2) on both a soft 2D matrix (Young's modulus: 37 ± 12 kPa) or a stiff 2D matrix (Young's modulus: 190 ± 35 kPa), which were produced using respectively 100 or 200 mg of gelatine methacryloyl in the DLP photoresist formulation. Representative results of Young's modulus distribution of these matrixes determined by microindentation (see section 2.6.2 for details) are shown in Fig. 2S.† Note that those Young's moduli are comparable to the soft (valleys) and stiff areas (domes) of the 3D TPP matrixes. On Day 14 after cell seeding, the mean fibroblast density was significantly higher (1963 ± 159 cells per mm2, p < 0.0001, unpaired two-tailed t-test) on the stiff DLP matrixes compared to the soft ones (329 ± 52 cells per mm2). These results corroborate the previous analysis of 3D TTP matrixes with better fibroblast adherence and proliferation on the stiffer domes (∼130 kPa) compared to the softer parts of the matrix (∼20 kPa).
The stability of the stiff (190 kPa) DLP matrixes was tested in vivo on a mouse model that expressed GFP in all mono-nuclear phagocytes, see Fig. 5. This matrix was chosen because it showed the highest fibroblast density at Day 14, see Fig. 4f. On Day 14, after implantation of the matrix, the stiff DLP matrix was stable without any signs of degradation. Otherwise, MacrophagesGFP+ would have penetrated inside the matrix. Here, they were only present at the surface of the matrix at a low density: 51 ± 9 n mm−2.
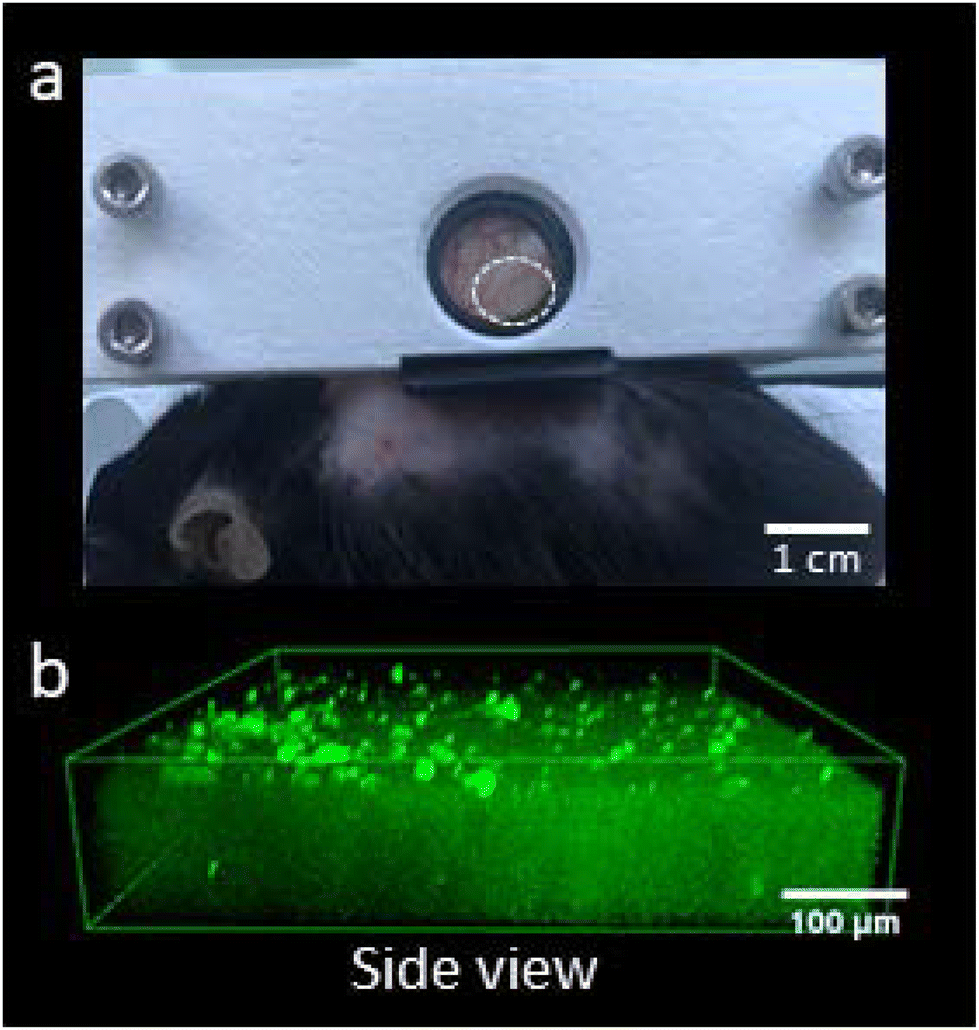 | ||
| Fig. 5 In vivo stability analyses of stiff (190 kPa) DLP matrixes at D14. (a) A transgenic C57BL/6 mouse with a dorsal skin fold chamber fixed in a holder for two-photon microscopic analysis. The white dotted ellipse indicates the nearly transparent and stiff DLP matrix. The scale bar is 1 cm. (b) A 3D two-photon image showing the side view of the matrix inside the chamber at D14. The green spots on the surface are macrophagesGFP+. Box size: 694 × 694 × 250 μm. The scale bar is 100 μm. | ||
4. Discussion
We have developed a photo-crosslinked gelatine–collagen matrix (GelMA) that mimics the dermo-epithelial junction, an important attachment site between the basal epidermis and dermis, and crucial for skin integrity. The GelMA matrixes were fabricated using Two-Photon Polymerization (TPP) either one-photon crosslinking using a Digital Light Processing (DLP) setup.Various natural polymers are used for skin tissue engineering, such as alginate, hyaluronic acid, chitosan, silk fibroin, poly-caprolactone, and poly(lactic-co-glycolic acid). However, these polymers lack cell adhesion motifs like ArginylGlycylAspartic acid (Arg-Gly-Asp or RGD) and, therefore, need additional chemical modifications.17 While most of these polymers are biocompatible, they are not bioactive in the skin, a characteristic seen in collagen and gelatine hydrogels. In a recent study, a combination of silk glycidyl methacrylate (GMA) and GelMA was explored to simultaneously enhance the stability and the tensile strength of the matrix and preserve cell adhesion motifs.18 Leveraging the soft gelation property and an improved tensile strength using silk GMA, will help to rapidly cover the wound, improving scar quality, and enhancing functional outcomes. 3D (Bio)printing techniques that are used in skin regeneration were recently reviewed.17,19
Here, TPP produced a GelMA that mimicked the dermal–epidermal junction, achieving a remarkable 3D spatial resolution. Our TPP protocol allowed us to modulate the voxel density, essential for controlling the matrix microstructures. This capability allowed us to generate high-stiffness matrixes that optimized the adherence and proliferation of fibroblasts. To illustrate this point, we engineered a matrix featuring micro-structured domes, controlled by a high voxel density (resulting in Young's modulus of 130 ± 4 kPa), and valleys, controlled by a lower voxel density (yielding Young's modulus of 20 ± 1 kPa). Our cell-culture experiments clearly demonstrated that fibroblasts had better adherence, proliferation, and viability on the stiffer domes compared to the softer valleys within the TPP matrixes. However, despite the ability to craft high-resolution microstructures of different stiffness levels, the manufacturing speed of TPP matrixes was slow: 0.002 mm2 min−1. For example, TPP matrixes to cover large wound areas of several cm2 will take at least one week using this photo-polymerization technique. Moreover, achieving an overall stiffness of around 150 kPa needed for optimal adherence and proliferation of fibroblasts would require a higher voxel density for photo-polymerization, inevitably elongating the manufacturing time.
To overcome this problem of manufacturing speed, we utilized a DLP setup to decrease considerably the manufacturing time of large 2D GelMA matrixes. DLP is a highly efficient method of layer-by-layer printing compared to point-by-point printing using TPP.20 Note that Saha et al. combined the advantages of TPP and DLP printing and developed a femtosecond projection TPP technique, where they could print complex 3D structures that maintained μm features at a speed 3× faster than classical TPP.21 However, their speed is still far beyond the speed for matrix fabrication using a DLP setup.
Using one-photon crosslinking in our DLP setup, we were able to tune the stiffness to the high Young's modulus (190 ± 35 kPa) required for optimal fibroblast responses by using the same amount of gelatine methacryloyl as for TPP. The 2D matrixes have a simple configuration in this study (direct exposure of a thin layer, cf.Fig. 4d). Still, we increased the surface area to provide better adherence to the dermis by incorporating honeycomb-like structures (cf. Fig. 3S in ESI†). Our ongoing work will explore 3D layer-by-layer DLP techniques to manufacture real 3D structures.22 With our setup, crosslinking is performed using LED sources at 405 nm, which may be replaced by LED sources at longer wavelengths to increase the penetration depth inside the photoresist. This should result in a more homogeneous crosslinking and achieve higher cell compatibility and wider application prospects, including the use of bioink materials in tissue engineering.17–19
GelMA–collagen matrixes can be easily transformed into smart matrixes, including bio-optical sensors for monitoring inflammation and wound healing processes.5,20,23 Smart wound dressings help distinguish between wounds with transient or chronic inflammation, which often occur in diabetes.19 The latter should be treated as early as possible to avoid permanent tissue damage and wounds failing to achieve closure. Indeed, in diabetic patients, the glycation of proteins reduces the process of angiogenesis and consequently limits cell proliferation and wound repair in hypoxic conditions.24 The stiffness of gelatine hydrogels can be tuned to stimulate the adherence, proliferation, and migration of vascular endothelial cells during angiogenesis.25 Furthermore, smart gelatine hydrogels with optical biosensors for local measurements of pO2tissue and pHtissue will help in online monitoring of the wound healing process and reoxygenation.
In TTP, a ruthenium complex was used as a photoinitiator: the red fluorescence of these complexes was used for analysis of the matrix structure on a two-photon microscope, and changes in the fluorescence intensity of these complexes can be used for local pO2tissue analysis, see previous study.16 During inflammation processes, the O2 consumption of mononuclear phagocytes increases in the acute phase, which results in transient hypoxia inside the wound until the end of the resolution phase.21 In chronic inflammation, the hypoxia status of the wound will be maintained if the mononuclear phagocyte density remains high. Thus, monitoring the pO2tissue in wound dressings helps distinguish between transient and chronic inflammation processes. In the present study, FRAP analysis confirmed that ruthenium complexes became covalently bonded to materials during crosslinking and are therefore ideal bio-optical sensors for local pO2matrix measurements in time. We obtained similar results for the DLP GelMA matrixes, which will be published in a future paper.
Here, our protocol for preparing the large matrixes using the DLP setup included a modified photo-resist with fluorescein-acrylate. This had the advantage of rendering the matrixes visible on a two-photon microscope. An additional benefit is that the fluorescein can be used for online pHtissue analysis in a wound dressing, which is, like the pO2tissue, an important physiological parameter for following inflammation processes and wound healing. A skinwound is in an alkaline state before healing and progresses via a neutral to an acidic pH when the wound healing is completed.20,22,26 On the contrary, the pHtissue in wounds with a chronic inflammation will oscillate around basic pH values, thus, a distinction between wounds with a transient or chronic inflammation would be possible. The presence of both optical biosensors for pO2tissue and pHtissue analysis will provide a more complete picture of the wound healing processes.
In our in vivo pilot studies on mice, 2D GelMA collagen LAP matrixes with a Young's modulus of 190 kPa were stable for a minimum of 14 days. In the present study, fibroblasts reached a state of complete confluence at D14 on these matrixes, which means that they can probably produce the new extracellular matrix before total degradation of their host matrix and ensure skin repair.
5. Conclusions
DLP using biocompatible photoresists (i.e., GelMA) is more suitable than TPP for the fast manufacturing of large matrixes for skin regeneration. Fibroblasts showed optimal adherence and proliferation, achieving a complete confluence by Day 14 on DLP GelMA matrixes with a Young's modulus of 190 ± 35 kPa. Indeed, the amount of GelMA in formulation controls Young's modulus, which provides a means to optimize fibroblast adherence and proliferation. Increasing its mass concentration leads to an increase in the young modulus. Future in vivo studies on mice will analyse the effects of an artificial dermal–epidermal junction, which is expected to enhance the surface area for interactions with the dermis in wounds.Author contributions
GM: conceptualization, methodology, investigation, validation, formal analysis, review, and editing. BvdS: conceptualization, methodology, formal analysis, resources, writing original draft, supervision. LG: methodology, investigation, validation. CA: methodology, investigation, validation. TD: methodology, investigation, formal analysis, review, and editing DKM: resources, review, and editing. OS: conceptualization, supervision, resources, review, and editing.Conflicts of interest
The authors declare that they have no known competing financial interests or personal relationships that could have appeared to influence the work reported in this paper.Acknowledgements
This work was supported by a grant from L′Agence Nationale de la Recherche (ANR-18-ENM3-0004-03) within the framework of the “nAngioderm” project (EuroNanoMed III). The authors also thank Microlight3D for discussions and free assistance with the 3D micro-printer.References
- A. Tanaka, T. Nagate and H. Matsuda, J. Vet. Med. Sci., 2005, 67(9), 909–913 CrossRef CAS PubMed.
- J. Killat, K. Reimers, C. Y. Choi, S. Jahn, P. M. Vogt and C. Radtke, Int. J. Mol. Sci., 2013, 14, 14460–14474 CrossRef PubMed.
- P. Le Thi, J. Young Son, Y. Lee, S. Bae Ryu, K. Min Park and K. Dong Park, Macromol. Res., 2020, 28, 400–406 CrossRef CAS.
- S. M. Frahs, S. M. Oxford, E. E. Neumann, R. J. Browm, C. R. Keller-Peck, X. Pu and T. J. Lujan, Ann. Biomed. Eng., 2018, 46, 1882–1895 CrossRef PubMed.
- F. Tsegay and M. Elsherif, Polymers, 2022, 14(5), 1012 CrossRef CAS PubMed.
- P. He, J. Zhao, J. Zhang, B. Li, Z. Gou, M. Gou and X. Li, Burns Trauma, 2018, 6, 5 Search PubMed.
- N. Saeidi, E. A. Sander, R. Zareian and J. W. Ruberti, Acta Biomater., 2011, 7, 2437–2447 CrossRef CAS PubMed.
- A. Tamayol, N. Annabi and A. Khademhosseini, Biomaterials, 2015, 73, 254–271 CrossRef PubMed.
- B. K. Verma, A. Chatterjee, P. Kondaiah and N. Gundiah, Gels, 2023, 9(12), 922 CrossRef.
- E. Hadjipanayi, V. Mudera and R. A. Brown, J. Tissue Eng. Regener. Med., 2009, 3, 77–84 CrossRef CAS PubMed.
- C. Li, G. Guan, R. Reif, Z. Huang and R. K. Wang, J. R. Soc., Interface, 2012, 9, 831–841 CrossRef PubMed.
- M. Zhu, Y. Wang, G. Ferracci, J. Zheng, N. J. Cho and B. H. Lee, Sci. Rep., 2019, 9(1), 6863 CrossRef PubMed.
- F. Le Guern, V. Mussard, A. Gaucher, M. Rottman and D. Prim, Int. J. Mol. Sci., 2020, 21, 1–23 Search PubMed.
- K. Iwai, Y. Uesugi, T. Sakabe, C. Hazama and F Takemura, Polym. J., 1991, 23, 757–763 CrossRef CAS.
- H. J. Butt and M. Jaschke, Nanotechnology, 1995, 6(1), 1–7 CrossRef.
- B. Van Der Sanden, L. Gredy, D. Wion and O. Stephan, Acta Biomater., 2021, 130, 172–182 CrossRef CAS PubMed.
- C. K. Balavigneswaran, S. Selvaraj, T. K. Vasudha, S. Iniyan and V. Muthuvijayan, Biomater. Adv., 2023, 153, 213570 CrossRef CAS PubMed.
- K. Young, O. Ajiteru, H. Hong, Y. Ji, T. Sultan, H. Lee, J. Seung, Y. Jin, O. Joo, S. Hee and C. Hum, Acta Biomater., 2023, 1(164), 159–174 Search PubMed.
- A. Olejnik, J. Anna Semba, A. Kulpa, A. Dańczak-Pazdrowska, J. Dalibor Rybka and J. Gornowicz-Porowska, ACS Synth. Biol., 2022, 11, 26–38 CrossRef CAS PubMed.
- Z. Zheng, D. Eglin, M. Alini, G. R. Richards, L. Qin and Y. Lai, Engineering, 2021, 7, 966–978 CrossRef CAS.
- S. K. Saha, D. Wang, V. H. Nguyen, Y. Chang and J. S. Oakdale, Science, 2019, 366(6461), 105–109 CrossRef CAS PubMed.
- Y. Piao, H. You, T. Xu, H. Bei, I. Z. Piwko, Y. Y. Kwan and X. Zhao, Engineered Regeneration, 2021, 2, 47–56 CrossRef.
- J. Holl, C. Kowalewski, Z. Zimek, P. Fiedor, A. Kaminski, T. Oldak, M. Moniuszko and A. Eljaszewicz, Cells, 2021, 10(3), 655 CrossRef CAS PubMed.
- A. Kru, S. Hauser, A. T. Ne, Y. Liu, A. Lendlein, J. A. Kru, S. Hauser, A. T. Ne, Y. Liu, A. Lendlein, J. Pietzsch and F. Jung, ACS Biomater. Sci. Eng., 2021, 7(2), 527–540 CrossRef.
- T. D. Nauta, V. W. M. Van Hinsbergh and P. Koolwijk, Int. J. Mol. Sci., 2014, 15, 19791–19815 CrossRef CAS PubMed.
- E. M. Jones, C. A. Cochrane and S. L. Percival, Advances in Wound Care, 2015, 4, 431–439 CrossRef PubMed.
Footnote |
| † Electronic supplementary information (ESI) available. See DOI: https://doi.org/10.1039/d3bm01849k |
| This journal is © The Royal Society of Chemistry 2024 |