
 Open Access Article
 This Open Access Article is licensed under a Creative Commons Attribution-Non Commercial 3.0 Unported Licence
Droplet-based fluorescence anisotropy insulin immunoassay†
Damilola I.
Adeoye‡
 a,
Rafael A.
Masitas‡
a,
James
Thornham
b,
Xiangyue
Meng
a,
Daniel J.
Steyer
a and
Michael G.
Roper
*ab
a,
Rafael A.
Masitas‡
a,
James
Thornham
b,
Xiangyue
Meng
a,
Daniel J.
Steyer
a and
Michael G.
Roper
*ab
aDepartment of Chemistry & Biochemistry, Florida State University, 95 Chieftain Way, Tallahassee, FL 32306, USA. E-mail: mroper@fsu.edu; Fax: +1-850-644-8281; Tel: +1-850-644-1846
bProgram in Molecular Biophysics, Florida State University, USA
First published on 21st October 2024
Abstract
Over the last several decades, multiple microfluidic platforms have been used for measurement of hormone secretion from islets of Langerhans. Most have used continuous flow systems where mixing of hormones with assay reagents is governed by diffusion, leading to long mixing times, especially for biomolecules like peptides and proteins which have large diffusion coefficients. Consequently, dispersion of rapidly changing signals can occur, reducing temporal resolution. Droplet microfluidic systems can be used to capture reagents into individual reactors, limiting dispersion and improving temporal resolution. In this study, we integrated a fluorescence anisotropy (FA) immunoassay (IA) for insulin into a droplet microfluidic system. Insulin IA reagents were mixed online with insulin and captured quickly into droplets prior to passing through a 200 mm incubation channel. Double etching of the glass device was used to increase the depth of the incubation channel compared to the IA channels to maintain proper flow of reagents. The droplet system produced highly precise FA results with relative standard deviations < 2% at all insulin concentrations tested, whereas the absolute fluorescence intensity precisions ranged between 5 and 6%. A limit of detection of 3 nM for insulin was obtained, similar to those found in conventional flow systems. The advantage of the system was in the increased temporal resolution using the droplet system where a 9.8 ± 2.6 s response time was obtained, faster than previously reported continuous flow systems. The improved temporal resolution aligns with continued efforts to resolve rapid signaling events in pancreatic islet biology.
Introduction
Diabetes is a chronic metabolic disease characterized by dysfunctional insulin secretion from pancreatic islets of Langerhans. Approximately 463 million adults were estimated to have diabetes in 2019 and this number is expected to grow to 700 million by the year 2045,1 making diabetes a global endemic. Despite its widespread occurrence, there are many details of the mechanisms controlling insulin release that remain unanswered. Development of an analytical methodology that enables hormone secretion measurements with rapid response times and high sensitivity is crucial for unraveling questions regarding its release.2Most mechanistic studies of insulin secretion have been carried out under static conditions using batches of islets. While these have proven useful, they are insufficient to assess dynamic processes. Microfluidic systems provide low dilution measurements which enable increased sensitivity as compared to conventional benchtop measurements.3 These systems have been used for investigating dynamic processes from small numbers of cells, organoids, and tissues, including islets of Langerhans.2–4 The majority of approaches for online measurement of hormone secretion from islets have used continuous flow microfluidic devices where reagents mix with islet perfusate in a continuously flowing channel.5–8 Immunoassay reagents, such as antibodies and fluorescently labeled peptides, are often used for quantifying hormone concentration. In continuous flow streams, these mix by diffusion as they travel through the channel network. With large biomolecules and wide channels, this process can be time consuming requiring long incubation times. As incubation times increase, dispersion of the dynamically changing sample also occurs, making rapid secretion processes difficult to detect.
Droplet microfluidics have been shown to improve temporal resolution as compared to continuous streams due to the segmentation of samples into a carrier stream.9 This segmentation helps to conserve the temporal information upstream of the segmentation. In addition, droplet microfluidic systems have been shown to promote fast reagent mixing and reactions as they travel down the microchannels of a microfluidic device.10,11 Their capability to improve the temporal resolution of biomolecular assays has been demonstrated in numerous formats, including the measurement of pancreatic islet secretions.12–14 For example, encapsulating islet secretions with a Zn2+-chelating dye, for use as a marker of insulin release, a temporal resolution of 1.09 s was produced.13 A more direct measurement of insulin release was made by use of on-chip valves to encapsulate single islet secretions with a homogeneous pincer assay, producing a temporal resolution of 15 s.14 Both of these assays enabled observation of rapid insulin oscillations with periods < 1 min. Homogeneous assays, like the aforementioned Zn2+ and pincer assay, are ideal for droplet systems as they simplify analyte measurement. We have reported the successful measurement of insulin secretion in a continuous flow stream using a different homogeneous assay, a fluorescence anisotropy (FA) immunoassay (IA).15–18 FA assays using droplet microfluidics have been widely reported,19–21 but none have been dedicated to insulin measurement. Here, we investigate the advantages of droplet microfluidics for use in an insulin FA–IA for high temporal resolution measurements. We find that the assay is well incorporated when using a glass microfluidic device and low resistance incubation channel. The limit of detection (LOD), 3 nM, is similar to those obtained using a conventional flow microfluidic assay and the temporal resolution was 9.8 ± 2.6 s, demonstrating that this method will be a viable means for measuring rapid changes in insulin secretion from islets of Langerhans.
Materials and methods
Chemicals and reagents
Sodium chloride, calcium chloride, sodium hydroxide, ethylenediaminetetraacetic acid (EDTA), Tween 20, bovine serum albumin (BSA), and ammonia were obtained from EMD Chemicals (San Diego, CA). Dextrose, RPMI 1640 containing L-glutamine, 11 mM glucose, gentamicin, and fetal bovine serum (FBS) were obtained from Thermo Fisher Scientific (Waltham, MA, USA). Collagenase P (from Clostridium histolyticum) was obtained from Roche Diagnostics (Indianapolis, IN, USA). Monoclonal anti-insulin antibody (Ab) was purchased from Meridian Life Science, Inc. (Saco, ME). Perfluorodecalin (PFD), 1H,1H,2H,2H-perfluorooctyldimethylchlorosilane, and Novec 7500 fluorinated liquid were purchased from Oakwood Products (Estill, SC, USA). 008-Fluorosurfactant (poly(ethylene glycol)-di-(krytox-FSH amide)fluoropolymer), was purchased from RAN Biotechnologies (Beverly, MA). Cy5-labeled insulin (Ins*) was prepared in-house, as previously described.22,23 Unless otherwise noted, all other reagents were purchased from Sigma-Aldrich (St. Louis, MO). All solutions were prepared with Milli-Q (Millipore, Bedford, MA) 18 MΩ cm ultrapure water and filtered using 0.2 μm nylon syringe filters (Pall Corporation, Port Washington, NY). Immunoassay reagents (Ins* and Ab) were prepared in TEAT-40, composed of 25 mM tricine, 40 mM NaCl, 1 mM EDTA, at pH 7.4 with an additional 0.1% Tween 20 (w/v), and 1 mg per mL BSA. Insulin standards were prepared in balanced salt solution (BSS) consisting of 125 mM NaCl, 2.4 mM CaCl2, 1.2 mM MgCl2, 5.9 mM KCl, 25 mM tricine, at pH 7.4 with an additional 1 mg per mL BSA. All concentrations in the text are given as the final concentration which assumes 3-fold dilution of the IA reagents after mixing.Microfluidic device fabrication
The microfluidic devices were fabricated in glass using photolithography and wet etching techniques. Briefly, all channels were etched to 50 μm depth, as measured by an SJ-410 surface profiler (Mitutoyo Corp., Aurora, IL, USA), using a photomask with 50 μm line widths. The incubation channel was etched to a depth of 150 μm using blue low tack tape (Semiconductor Equipment Corp., Moorpark, CA), as described in the text. The aqueous flow was segmented into the oil carrier phase 5 mm downstream of the IA mixing cross. Fluidic inlets were drilled with 1.1 mm drill bits (Industrial Power Tool and Abrasives, NY) and reservoirs (IDEX Health and Science, Oak Harbor, WA) were bonded to the microfluidic device according to the manufacturer's specifications. The surface of the droplet incubation channel was modified with 2% 1H,1H,2H,2H-perfluorooctyldimethylchlorosilane in PFD as described in the text. Aqueous reagents and the oil carrier phase were delivered using syringe pumps (Harvard Apparatus, Holliston, MA) from gastight syringes (Hamilton Company Inc., Reno, NV) connected to the fluidic inlets with Tygon tubing (0.01′′ ID × 0.03′′ OD, Cole-Parmer North America, Vernon Hills, IL) through fingertight fittings (IDEX Health and Science).FA detection system
FA was measured as described previously.18 Briefly, the microfluidic device was placed on the stage of an Eclipse TS-100 microscope (Nikon Instruments Inc., Melville, NY). A 25 mW, 635 nm laser (Coherent Inc., Santa Clara, CA, USA) was used for fluorescence excitation. Its intensity was attenuated to 2 mW by a neutral density filter (Thorlabs Inc., Newton, NJ) and coupled into a multimode fiber-optic bundle using an achromatic fiber port collimator (PAF2S-7A, Thorlabs). The light was collimated by an achromatic doublet (AC254-080-A-ML, Thorlabs) and randomly polarized by a quartz-wedge achromatic depolarizer (DPU-25-A, Thorlabs). The beam was then linearly polarized (WP25M-VIS, Thorlabs) and reflected by a dichroic mirror (XF2035, Omega Optical Inc., Brattleboro, VT) into a 40×, 0.6 NA objective (Nikon), which focused the beam into the detection point on the microfluidic device. The diameter of the focused laser spot in the channel is conservatively estimated to be 100 μm. The emitted fluorescence was collected with the same objective, transmitted through the dichroic, and directed into a two-channel microscope photometer (Horiba Scientific, Piscataway, NJ), where the light passed through a 665 nm long-pass filter (HQ665LP, Chroma Technology Corp., Bellows Falls, VT) and a 635 nm notch filter (ZET635NF, Chroma). The emission was then passed through a polarizing beam splitter cube (PBS101, Thorlabs) and split into parallel and perpendicularly polarized components (with respect to the excitation polarization). Each polarized component was passed through a complementary linear polarizer before impinging on separate photomultiplier tubes (PMTs) (R10699, Hamamatsu Photonics, Middlesex, NJ). Data from both PMTs were collected at 1000 Hz using a USB data acquisition device (6009, National Instruments, Austin, TX). Data was processed as described in the text. All data are presented as the average ± 1 standard deviation (SD) unless otherwise stated. Since relative changes in FA were mainly used for experiments, equal detection sensitivities (G-factor) between the two detection channels were assumed.Data analysis
Details on how anisotropy values are extracted from each droplet are given in the text. When calculating an average anisotropy, 300 s of data were averaged providing at least 200 data points depending on droplet frequency. Statistical significance was assumed when p < 0.05 using a 2-tailed unequal variance t-test. The LOD was determined as the concentration of insulin required to reduce the FA to a value less than 3 times the SD of the blank anisotropy value.Results and discussion
There have been several reports of FA–IA for insulin in continuous flow microfluidic systems.15–18,24,25 These reports demonstrate the utility of this homogeneous assay in profiling dynamic insulin secretion from islets of Langerhans. Here, we describe an alternative approach to improve the temporal resolution by taking advantage of droplet microfluidics to limit dispersion and longitudinal broadening during the assay, and consequently, further improve the temporal resolution.Microfluidic device & droplet generation
The microfluidic device design upstream of droplet generation was composed of four inlets (Fig. 1). In this report where the performance of the droplet FA–IA system was being evaluated, an islet chamber was not fabricated into the device and the two top-most inputs were used to deliver various reagents to a continuously flowing stream of Ab and Ins*. These reagents were then delivered to a flow of oil 5 mm downstream where they were segmented into droplets (inset of Fig. 1) and flowed through a 200 mm incubation channel prior to measurement by FA. | ||
| Fig. 1 Microfluidic droplet generation system. The microfluidic design used in the experiments is shown. The glass device had five inlets, inlets 1 and 2 were used to deliver buffer, insulin, or Cy5 depending on the experiment. A constant concentration of Ab and Ins* were delivered to the device via their respective inlets. The last inlet was used for oil that encapsulated these aqueous reagents into droplets and transported to the incubation channel where mixing and binding occurred, prior to detection shown by the X. The inset shows the T-junction and a portion of the mixing channel (boxed in red) showing droplet formation. | ||
Many aqueous-in-oil microfluidic droplet devices utilize polymeric devices, such as poly(dimethylsiloxane) (PDMS). Initially, PDMS devices were tested and generated reproducible droplets; however, the IA results were inconsistent and irreproducible (data not shown). Although not fully investigated, these results were attributed to nonspecific binding by the immunoassay reagents in the PDMS prior to being incorporated into droplets. Due to the successful use of glass microfluidic systems in previous reports,15,17,18 a glass device was then fabricated. The oil and incubation channels were coated by placing ∼50 μL of a 2% solution of 1H,1H,2H,2H-perfluorooctyldimethylchlorosilane in PFD into the oil reservoir and the four aqueous inputs were closed with tape. A vacuum was applied to the outlet reservoir which pulled the solution through the incubation channel. The vacuum was applied until all the liquid was pulled through and air dried the channel.
In the initial device, all channels were etched at the same depth (50 μm) based on our previous FA–IA designs.18,24 However, it was found that occasionally the oil would split and move back to the aqueous channels. We expected that the oil would move ‘upstream’ in lieu of flowing through the long incubation channel. To keep the oil flowing towards the outlet reservoir, we decreased the relative resistance of the incubation channel compared to what it was previously by increasing the depth of the droplet incubation channel. This was achieved by first etching all channels 50 μm deep, removing the device from the HF solution, and rinsing completely. The aqueous channels were then covered with low tack tape and the device was placed back into the HF solution to etch another 100 μm. The effect of the double etching can be seen by the aqueous channel appearing triangular as it intersects the oil channel in the inset of Fig. 1. This shape results when the HF undercuts the tape during the double etching of the incubation channel. With this double-etched design, the oil flowed towards the outlet and a stable droplet formation was formed. Droplet frequency was found to vary between days and ranged between ∼0.7 and 2.0 Hz although the frequency was stable over the course of an experiment. The inter-day variation in droplet frequency could have been due to variations in the syringe pump flow rates, especially when used at such low flow rates, or changes in the day-to-day conditions of the incubation channel coating that would affect the droplet frequency.
Droplet analysis
The FA–IA described here is a competitive insulin IA in which insulin competes with Ins* for binding to the Ab. The total anisotropy of the solution is the summation of the anisotropy of the bound Ins*–Ab complex and the free Ins*, weighted by their fractional compositions, which are determined by the insulin and immunoassay reagent concentrations as well as the equilibrium dissociation constant of the Ab.26,27 Fluorescence anisotropy, r, was determined by measuring the vertically- and horizontally-polarized emission intensity, I∥ and I⊥, respectively, using eqn (1):28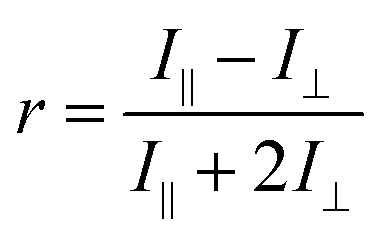 | (1) |
This calculation is straightforward for the assay in a continuously flowing stream; however, in the droplet assay, the droplets passing through the detector were separated by the carrier phase whose fluorescence intensity was near zero. A representative set of data is shown in Fig. 2A which shows the signal from the two PMTs collected over a 2 s duration during analysis of 50 nM insulin, 25 nM Ins*, and 25 nM Ab. The concentration of Ab and Ins* were chosen based on what we and others have used for single islet measurements using a competitive IA.6–8,15,17,18,22–25 As seen, there are much higher PMT signals detected as the droplets pass through the detection point compared to the oil carrier phase. For data analysis, a Python script was written which extracted PMT values greater than 1.00 V (horizontal red dashed line in Fig. 2A). In this way, the fluorescence from each droplet was analyzed and the oil phase was not. The 1.00 V threshold was chosen for convenience to separate the droplet signal from the oil. The highest PMT value in each of these data sets was identified and all values within 0.1 V of the maxima were extracted, as shown by the two dashed lines in Fig. 2B. These values were then averaged over a single droplet, and the Python script appended this information to an array, producing a plot of average intensity as a function of each droplet (Fig. S-1A†). This procedure was done for both PMT traces and the anisotropy per droplet (Fig. S-1B†) was calculated using eqn (1). Once the individual droplets were analyzed, the array was saved to a text file.
 | ||
| Fig. 2 Droplet analysis. Representative data using 25 nM Ab, 25 nM Ins*, and 50 nM insulin segmented into droplets. The parallel intensity is measured in PMT1 (blue curve) and the perpendicular intensity is measured in PMT2 (orange curve). (A) A 5 s segment of data is shown with the 1 V threshold for data analysis highlighted by the dashed red line. (B) A zoomed-in view of a single droplet within 0.1 V of the maximum signal. The data within this window were averaged and used to calculate an average anisotropy for this droplet. Each droplet was analyzed in a similar manner producing one anisotropy value for each droplet. | ||
The fluorescence intensity of the signal from the droplets (Fig. S-1A†) was consistent with a 5.8% RSD. The anisotropy across individual droplets showed higher precision with a 1.8% RSD, with the higher precision likely due to FA being a ratio of the two PMT signals. These RSDs for fluorescence intensity and FA were similar in all the concentrations of insulin tested during the recording of calibration curves described below (Table S-1†).
Device characterization
The FA–IA signal is a function of the reaction time, which is related to the distance the droplets travel in the incubation channel. As the droplets initially form, the IA reagents will require some time to completely mix and form the equilibrium amounts of bound and free Ins*. To determine the optimum distance that the droplets needed to travel to achieve a stable FA signal, an experiment was performed where insulin, 25 nM Ins*, and 25 nM Ab were each delivered at a flow rate of 0.2 μL min−1 into the T-junction where the carrier phase was flowing at 1.2 μL min−1 for a total flow rate of 1.8 μL min−1 delivered into the incubation channel. The experiment was performed using both 0 and 500 nM insulin and the FA at each insulin concentration was measured at five points along the incubation channel corresponding to distances of 20, 40, 120, 160, and 190 mm from the T-junction. With the channel dimensions of the incubation channel and the flow rate used, the travel times for a droplet to these locations were approximately 20, 40, 120, 160, and 190 s. The difference in FA (Δr) between the 0 and 500 nM samples was measured to account for imperfections in the microfluidic device that can impact the FA signal (e.g. etching imperfections, bonding defects, etc.). By using two insulin concentrations, any imperfections along the channel length would affect the FA of both samples.As the distance along the mixing channel increases, we expected that the Δr would increase and eventually stabilize as the Ab binds to the Ins*. Fig. 3 show the Δr between the 0 and 500 nM insulin samples at the different distances. As seen, the change in FA increased progressively from 20 to 160 mm, and the data at 190 mm showed a similar signal as that at 160 mm. The 190 mm point was chosen as the detection point for the remainder of the experiments as a matter of convenience considering the response time should not be different between the various locations. Remarkably, the Δr 20 mm into the incubation channel constituted ∼70% of the final Δr when the assay had stabilized, indicating rapid binding by the Ab.
 | ||
| Fig. 3 Incubation distance. The change in anisotropy between 0 and 500 nM insulin with 25 nM Ins* and 25 nM Ab is plotted as a function of distance in the incubation channel. The points are the average of 300 s of data and the error bars correspond to the propagation of error from the difference in the two measurements. The Δr at 160 and 190 mm are significantly different than the Δr at 20 mm, while the 160 and 190 mm are not significantly different. | ||
Once the detection location was set, the temporal resolution of the system was determined. The temporal resolution of a system is a measure of how quickly a change in a signal can be detected and is defined here as the time taken for a signal to change from 10% to 90% of its final value after a step change in the input. For these experiments, buffer was delivered at 0.57 μL min−1 from one of the inlets and 0.03 μL min−1 of 1 μM Cy5 from the other. No flow was applied to the Ins* and Ab reservoirs which resulted in the same aqueous flow rate used in all experiments (0.60 μL min−1) intersecting the oil flowing at 1.2 μL min−1. The fluorescence in the droplets was measured and the time required for the signal to change to 90% of the final value when the two inlet flow rates switched was determined (Fig. 4). The response time was 9.8 ± 2.6 s (n = 3), significantly faster than continuous flow devices used with even higher flow rates. For example, a 36 ± 1 s response time was reported17 using an aqueous flow rate of 1.5 μL min−1. By capturing the reagents into the droplets, less longitudinal broadening occurred as they traveled through the incubation channel resulting in a higher temporal resolution. Similar improvements have been reported in the past for comparisons between continuous flow assays and droplets.29,30
 | ||
| Fig. 4 Temporal resolution. Buffer was initially delivered followed by a pulse of 1 μM Cy5. Time to reach 10 and 90% of the final PMT responses are indicated by the black dotted lines and the response time was calculated as the difference in time between these points. The aqueous flow rate was 0.6 μL min−1 and the oil carrier phase was 1.2 μL min−1. | ||
Insulin calibration
After the optimization and characterization of the system, a calibration curve for insulin was recorded. Insulin from 0 to 500 nM was delivered through one of the inlets at 0.2 μL min−1 while 25 nM Ab and Ins* were delivered from their respective inlets at 0.2 μL min−1. For each concentration of insulin tested, anisotropy was averaged across 300 s of droplets and the average values ± 1 SD are plotted in Fig. 5. The curve showed the expected nonlinear decrease in anisotropy as a function of increasing insulin concentration. The LOD was determined to be 3 nM which is comparable to those previously reported for insulin measurements in continuous-flow systems due to the use of similar IA reagents and concentrations.15,17,18,31,32 This LOD gives confidence that this system can be applied to measurements of insulin secretion from islets of Langerhans in the future. | ||
| Fig. 5 Insulin immunoassay calibration curve. Representative calibration curve of FA as a function of insulin concentration in droplets. The final concentration of both Ab and Ins* was 25 nM. The points are the averages of the calculated anisotropy over a 300 s measurement. Error bars are ±1 SD and the blue line is a four-parameter logistic curve fit to the data. | ||
Conclusions
In this study, we have incorporated a FA–IA method for use with microfluidic droplets. The droplet anisotropy assay system improved the temporal resolution of the assay compared to previously developed continuous flow systems. The temporal resolution obtained here (9.8 ± 2.6 s), although not as rapid as a previously developed system for measurement of Zn2+ secretion,13 was similar to a different homogeneous insulin sensor assay using a droplet microfluidic system,14 and faster than our previously developed15–18,24,25 FA–IA methods for insulin measurements. The LOD was similar to other competitive insulin IA, which is expected given that similar reagents and concentrations were used in these reports. Prior to use with islets, several improvements will be required. For example, there were difficulties using syringe pumps to maintain the low flow rates used here. There will also need to be an islet chamber that can be fully sealed to ensure oil does not encounter the biological tissue. This effect was mitigated in this report by reducing the resistance to flow in the incubation channel; however, incorporation of an islet chamber will lead to a potentially low resistance outlet for the oil if the chamber is not sealed fully. Nevertheless, the improved temporal resolution obtained with this assay is a continued effort to resolve rapid signaling events in pancreatic islet biology. Although this work was designed for future incorporation of an islet chamber for online insulin measurements, it would be straightforward to use this system as described for an offline assay of insulin using low volume samples. In this regard, no islet chamber is required, and the system could be used as described in this report.Data availability
Data for this article, including text files and droplet analysis programs are available at Harvard Dataverse, V1 at: https://doi.org/10.7910/DVN/UTNU1L.Author contributions
Damilola I. Adeoye: investigation, writing – original draft, and writing – review and editing. Rafael A. Masitas: investigation, resources, writing – review and editing. James Thornham: investigation, resources, and writing – review and editing. Xiangyue Meng: resources and writing – review and editing. Daniel J. Steyer: resources and writing – review and editing. Michael G. Roper: investigation, resources, funding acquisition, and writing – review and editing.Conflicts of interest
The authors declare that they have no conflicts of interest.Acknowledgements
This work was supported with a grant from the National Institutes of Health (R01 DK 080714).References
- P. Saeedi, I. Petersohn, P. Salpea, B. Malanda, S. Karuranga, N. Unwin, S. Colagiuri, L. Guariguata, A. A. Motala, K. Ogurtsova, J. E. Shaw, D. Bright, R. Williams and Committee on behalf of the IDA, Global and Regional Diabetes Prevalence Estimates for 2019 and Projections for 2030 and 2045: Results from the International Diabetes Federation Diabetes Atlas, 9th Edition, Diabetes Res. Clin. Pract., 2019, 157, 107843 CrossRef PubMed.
- R. Regeenes and J. V. Rocheleau, Twenty years of islet-on-a-chip: microfluidic tools for dissecting islet metabolism and function, Lab Chip, 2024, 24, 1327–1350 RSC.
- T. A. Duncombe, A. M. Tentori and A. E. Herr, Microfluidics: reframing biological enquiry, Nat. Rev. Mol. Cell Biol., 2015, 16, 554–567 CrossRef PubMed.
- M. G. Roper, Cellular Analysis Using Microfluidics, Anal. Chem., 2016, 88, 381–394 CrossRef PubMed.
- J. G. Shackman, K. R. Reid, C. E. Dugan and R. T. Kennedy, Dynamic monitoring of glucagon secretion from living cells on a microfluidic chip, Anal. Bioanal. Chem., 2012, 402, 2797–2803 CrossRef PubMed.
- M. G. Roper, J. G. Shackman, G. M. Dahlgren and R. T. Kennedy, Microfluidic Chip for Continuous Monitoring of Hormone Secretion from Live Cells Using an Electrophoresis-Based Immunoassay, Anal. Chem., 2003, 75, 4711–4717 CrossRef CAS PubMed.
- J. F. Dishinger, K. R. Reid and R. T. Kennedy, Quantitative Monitoring of Insulin Secretion from Single Islets of Langerhans in Parallel on a Microfluidic Chip, Anal. Chem., 2009, 81, 3119–3127 CrossRef CAS PubMed.
- Y. Wang, R. Regeenes, M. Memon and J. V. Rocheleau, Insulin C-peptide secretion on-a-chip to measure the dynamics of secretion and metabolism from individual islets, Cells Rep. Methods, 2023, 3, 100602 CrossRef PubMed.
- T. Moragues, D. Arguijo, T. Beneyton, C. Modavi, K. Simutis, A. R. Abate, J. C. Baret, A. J. deMello, D. Densmore and A. D. Griffiths, Droplet-based microfluidics, Nat. Rev. Methods Primers, 2023, 3, 32 CrossRef.
- H. Song and R. F. Ismagilov, Millisecond kinetics on a microfluidic chip using nanoliters of reagents, J. Am. Chem. Soc., 2003, 125, 14613–14619 CrossRef PubMed.
- J. D. Tice, H. Song, A. D. Lyon and R. F. Ismagilov, Formation of Droplets and Mixing in Multiphase Microfluidics at Low Values of the Reynolds and the Capillary Numbers, Langmuir, 2003, 19, 9127–9133 CrossRef.
- D. Chen, W. Du, Y. Liu, W. Liu, A. Kuznetsov, F. E. Mendez, L. H. Philipson and R. F. Ismagilov, The chemistrode: a droplet-based microfluidic device for stimulation and recording with high temporal, spatial, and chemical resolution, Proc. Natl. Acad. Sci. U. S. A., 2008, 105, 16843–16848 CrossRef PubMed.
- C. J. Easley, J. V. Rocheleau, W. S. Head and D. W. Piston, Quantitative Measurement of Zinc Secretion from Pancreatic Islets with High Temporal Resolution Using Droplet-Based Microfluidics, Anal. Chem., 2009, 81, 9086–9095 CrossRef PubMed.
- X. Li, J. Hu and C. J. Easley, Automated microfluidic droplet sampling with integrated, mix-and-read immunoassays to resolve endocrine tissue secretion dynamics, Lab Chip, 2018, 18, 2926–2935 RSC.
- A. M. Schrell, N. Mukhitov, L. Yi, J. E. Adablah, J. Menezes and M. G. Roper, Online fluorescence anisotropy immunoassay for monitoring insulin secretion from islets of Langerhans, Anal. Methods, 2017, 9, 38–45 RSC.
- N. Mukhitov, J. E. Adablah and M. G. Roper, Gene expression patterns in synchronized islet populations, Islets, 2019, 11, 21–32 CrossRef CAS PubMed.
- J. E. Adablah, Y. Wang, M. Donohue and M. G. Roper, Profiling Glucose-Stimulated and M3 Receptor-Activated Insulin Secretion Dynamics from Islets of Langerhans Using an Extended-Lifetime Fluorescence Dye, Anal. Chem., 2020, 92, 8464–8471 CrossRef CAS PubMed.
- D. I. Adeoye, Y. Wang, J. J. Davis and M. G. Roper, Automated cellular stimulation with integrated pneumatic valves and fluidic capacitors, Analyst, 2023, 148, 1227–1234 RSC.
- J. W. Choi, D. K. Kang, H. Park, A. J. deMello and S. I. Chang, High-Throughput Analysis of Protein–Protein Interactions in Picoliter-Volume Droplets Using Fluorescence Polarization, Anal. Chem., 2012, 84, 3849–3854 CrossRef CAS PubMed.
- J. W. Choi, G. J. Kim, S. Lee, J. Kim, A. J. deMello and S. I. Chang, A droplet-based fluorescence polarization immunoassay (dFPIA) platform for rapid and quantitative analysis of biomarkers, Biosens. Bioelectron., 2015, 67, 497–502 CrossRef CAS PubMed.
- F. Gielen, M. Butz, E. J. Rees, M. Erdelyi, T. Moschetti, M. Hyvönen, J. B. Edel, C. F. Kaminski and F. Hollfelder, Quantitative Affinity Determination by Fluorescence Anisotropy Measurements of Individual Nanoliter Droplets, Anal. Chem., 2017, 89, 1092–1101 CrossRef CAS.
- C. Guillo, T. M. Truong and M. G. Roper, Simultaneous capillary electrophoresis competitive immunoassay for insulin, glucagon, and islet amyloid polypeptide secretion from mouse islets of Langerhans, J. Chromatogr. A, 2011, 1218, 4059–4064 CrossRef.
- A. R. Lomasney, L. Yi and M. G. Roper, Simultaneous Monitoring of Insulin and Islet Amyloid Polypeptide Secretion from Islets of Langerhans on a Microfluidic Device, Anal. Chem., 2013, 85, 7919–7925 CrossRef PubMed.
- Y. Wang, D. I. Adeoye, Y. J. Wang and M. G. Roper, Increasing insulin measurement throughput by fluorescence anisotropy imaging immunoassays, Anal. Chim. Acta, 2022, 1212, 339942 CrossRef PubMed.
- A. L. Glieberman, B. D. Pope, J. F. Zimmerman, Q. Liu, J. P. Ferrier, J. H. R. Kenty, A. M. Schrell, N. Mukhitov, K. L. Shores, A. B. Tepole, D. A. Melton, M. G. Roper and K. K. Parker, Synchronized stimulation and continuous insulin sensing in a microfluidic human islet on a chip designed for scalable manufacturing, Lab Chip, 2019, 19, 2993–3010 RSC.
- W. B. Dandliker, R. J. Kelly, J. Dandliker, J. Farquahar and J. Levin, Fluorescence polarization immunoassay. Theory and experimental method, Immunochemistry, 1973, 10(4), 219–227 CrossRef PubMed.
- J. R. Lakowicz, I. Gryczynski, Z. Gryczynski and J. D. Dattelbaum, Anisotropy-Based Sensing with Reference Fluorophores, Anal. Biochem., 1999, 267, 397–405 CrossRef PubMed.
- J. R. Lakowicz, Principles of Fluorescence Spectroscopy, Springer Verlag, 3rd edn, 2006 Search PubMed.
- M. Wang, G. T. Roman, K. Schultz, C. Jennings and R. T. Kennedy, Improved Temporal Resolution for In Vivo Microdialysis by Using Segmented Flow, Anal. Chem., 2008, 80, 5607–5615 CrossRef PubMed.
- M. Wang, G. T. Roman, M. L. Perry and R. T. Kennedy, Microfluidic Chip for High Efficiency Electrophoretic Analysis of Segmented Flow from a Microdialysis Probe and In Vivo Chemical Monitoring, Anal. Chem., 2009, 81, 9072–9078 CrossRef CAS PubMed.
- L. Yi, B. Bandak, X. Wang, R. Bertram and M. G. Roper, Dual Detection System for Simultaneous Measurement of Intracellular Fluorescent Markers and Cellular Secretion, Anal. Chem., 2016, 88, 10368–10373 CrossRef CAS PubMed.
- B. Bandak, L. Yi and M. G. Roper, Microfluidic-enabled quantitative measurements of insulin release dynamics from single islets of Langerhans in response to 5-palmitic acid hydroxy stearic acid, Lab Chip, 2018, 18, 2873–2882 RSC.
Footnotes |
| † Electronic supplementary information (ESI) available. See DOI: https://doi.org/10.1039/d4ay01511h |
| ‡ These authors contributed equally. |
| This journal is © The Royal Society of Chemistry 2024 |