DOI:
10.1039/D4AY01172D
(Paper)
Anal. Methods, 2024,
16, 6337-6348
Immunoaffinity-free chromatographic purification of ovarian cancer biomarker CA125 (MUC16) from blood serum enables mass spectrometry characterization†
Received
22nd June 2024
, Accepted 19th August 2024
First published on 19th August 2024
Abstract
The enrichment of trace proteins from human fluid samples is of great importance in diverse clinical and industrial applications. In clinical diagnostics, such enrichment may enable detection of trace proteins that serve as biomarkers of disease. Affinity-based approaches, such as immunoaffinity pulldown, are widely used to enrich trace proteins, but this strategy relies on the availability and performance of antibodies that act on all proteoforms in an unbiased manner. Our prior work to characterize MUC16 (the mucin protein that carries the ovarian cancer biomarker CA125) by mass spectrometry successfully overcame the reliance on affinity-based enrichment and was used to enrich this biomarker from ascites of individual ovarian cancer patients, however, this strategy was not demonstrated on clinically relevant volumes of serum, a biofluid that is more accessible than ascites. The present work developed a non-affinity-based chromatographic method to enrich MUC16 from serum. The enriched MUC16 sample was further processed using a Midi Top 14 abundant protein depletion column. Peptides identified using bottom-up proteomics yielded 1–8% coverage of MUC16. Additionally, MUC16 was detected in samples containing less than the clinical cut-off level of CA125 (35 U mL−1), suggesting that this strategy of enrichment and bottom-up proteomics can enable analysis of CA125 from the serum of individuals with early-stage ovarian cancer and those whose tumors express CA125 (MUC16) at low levels.
Introduction
A persistent challenge in clinical chemistry is the detection of trace proteins in serum via mass spectrometry. The proteins present in serum span a concentration range of 10 orders of magnitude, and direct detection across this vast range challenges the dynamic response attainable by mass spectrometers.1–3 Ten highly abundant proteins—albumin, IgG, IgA, IgM, transferrin, fibrinogen, alpha-2-macroglobulin, alpha-1-antitrypsin, C3 complement, and haptoglobin—account for 90% of the total protein mass in serum.4 Of the remaining 10%, 12 proteins make up 90% of the total.4 The remaining 1% of proteins found in serum appear at high dilution but are clinically and analytically significant as this protein cohort contains established and emerging biomarkers of disease. Trace serum proteins are currently used as biomarkers for prostate, liver, ovary, breast, pancreas, and colon cancer.5 Efforts are underway to identify new biomarkers to complement established assays.6–8
One long-established serum biomarker is CA125, which is approved by the FDA as an ovarian cancer marker to monitor patient response to treatment and to surveil patients in remission for disease recurrence.9–13 CA125 is a peptide epitope located on the mucin MUC16,12,14,15 a heavily glycosylated transmembrane protein composed of more than 15![[thin space (1/6-em)]](https://www.rsc.org/images/entities/char_2009.gif) 000 amino acids.16 MUC16 contains three domains: an N-terminal domain consisting of ∼12100 amino acids, a tandem-repeat region containing 19 similar, but not identical, subdomains, and a C-terminal domain that spans the cell membrane (Fig. 1). The CA125 epitope has been determined to be located within the tandem repeat domain, but the precise amino acid composition of the CA125 epitope(s) remains an area of active investigation.17,18 Previous work in our group used western blotting, ELISA, and SPR spectroscopy studies on recombinantly expressed tandem repeat proteins to demonstrate that the CA125 epitope is not uniformly distributed within the tandem repeat domain, and that the antibodies used in the clinical immunoassay—M11 and OC125—do not uniformly recognize tandem repeat domains of MUC16.17,19 Glycan modification, alternative splicing of mRNA, and proteolytic cleavage may generate many MUC16 proteoforms13 of which only a subset are detected in the CA125 immunoassay, which may delay detection of ovarian cancer recurrence.
000 amino acids.16 MUC16 contains three domains: an N-terminal domain consisting of ∼12100 amino acids, a tandem-repeat region containing 19 similar, but not identical, subdomains, and a C-terminal domain that spans the cell membrane (Fig. 1). The CA125 epitope has been determined to be located within the tandem repeat domain, but the precise amino acid composition of the CA125 epitope(s) remains an area of active investigation.17,18 Previous work in our group used western blotting, ELISA, and SPR spectroscopy studies on recombinantly expressed tandem repeat proteins to demonstrate that the CA125 epitope is not uniformly distributed within the tandem repeat domain, and that the antibodies used in the clinical immunoassay—M11 and OC125—do not uniformly recognize tandem repeat domains of MUC16.17,19 Glycan modification, alternative splicing of mRNA, and proteolytic cleavage may generate many MUC16 proteoforms13 of which only a subset are detected in the CA125 immunoassay, which may delay detection of ovarian cancer recurrence.
 |
| | Fig. 1 Schematic diagram showing the domains of MUC16, the CA125 epitopes, and the clinically used antibodies. | |
A mass spectrometry-based assay for MUC16 could have great clinical value if it enabled detection of regions of the protein that are analytically silent in the existing immunoassay. We have previously demonstrated that bottom-up proteomics analysis of MUC16 from patient ascites was improved by prior chromatographic enrichment of MUC16. This approach is of limited use for detecting early-stage ovarian cancer, however, because ascites is a co-morbidity of advanced, metastatic disease and is rarely observed in early-stage cancer cases.20–22 An alternative to ascites is serum, a readily available biofluid commonly used for biomarker characterization. MUC16 is found in serum but is not frequently detected with mass spectrometry because of its high dilution. To enable detection of MUC16 from serum using mass spectrometry, a method is needed to enrich MUC16 from volumes of serum obtained from a clinical blood draw. Such enriched samples will contain a simpler serum proteome from which proteins of small size and high abundance have been removed while retaining MUC16, the large and trace protein target of interest.
Here, we report a method that uses size-exclusion chromatography (SEC) to enrich MUC16 from biofluids including plasma-derived serum and ascites from individual patients. SEC is advantageous for enriching MUC16 which—because of its large size—elutes in the void peak that contains unretained material.23,24 Void peak samples from SEC can be further enriched using Top 14 depletion columns to remove highly abundant proteins and proteins of lower abundance that are contained in larger protein complexes (Fig. 2A).25,26 The enrichment process reported here is compatible with 0.4–2.0 mL samples of plasma-derived serum, volumes readily obtainable with clinical blood draws, and can enrich CA125 across concentration ranges spanning clinically relevant values (30–30,000 U mL−1). Using SEC followed by bottom-up proteomics, we identify peptides from MUC16 proteoforms that were enriched with and without the use of Top 14 protein depletion. We demonstrate that enrichment of MUC16 from plasma-derived serum increases analyte purity by 100–200 times over serum alone. Enriched MUC16 is detectable with mass spectrometry, and the number of MUC16 peptides detected by this method correlates with clinical CA125 counts. The method reported here is designed to enrich MUC16 proteoforms for further characterization using mass-spectrometry-based proteomics without reliance on anti-CA125-immunoaffinity enrichment that can bias the enriched sample to favor epitope-presenting proteoforms. An affinity-free enrichment and mass spectrometry approach is desirable because it enables the detection of multiple features of the MUC16 glycoprotein, in contrast with existing immunoassay methods that are limited to detecting only the CA125 epitopes. This enrichment method may enable the characterization of MUC16 from individuals with early-stage ovarian cancer and those who have tumors with low MUC16 expression.
 |
| | Fig. 2 (A) The workflow used to enrich MUC16 from biofluids. (B) A representative size-exclusion chromatogram showing absorbance at 280 nm as a function of fraction number. Fractions corresponding to the first peak were pooled and either analyzed with bottom-up proteomics directly or further processed using a Top 14 depletion column before proteomics analysis. | |
Experimental
Chemicals and reagents
Sodium dodecyl sulfate (SDS), iodoacetamide (IAA), triethylammonium bicarbonate (TEAB), 100 kDa molecular weight cutoff filters (MWCO), human serum, Sepharose CL-4B, and Tris base were purchased from MilliporeSigma (St. Louis, MO). Econo-Pac® Chromatography Columns were purchased from Bio-Rad (Hercules, CA). Tris(2-carboxyethyl)phosphine (TCEP), deoxycholic acid (DCA), phosphoric acid, methanol (Burdick & Jackson), and sodium chloride (NaCl) were obtained through VWR (Radnor, PA). Formic acid (99% purity; FA), acetonitrile (ACN), C18 ZipTips, Top 14 Abundant Protein Depletion Midi Spin Columns, Whatman no. 4, 5, and GF/F filter papers, trypsin gold, RPMI 1640 (Gibco), and L-glutamine (Lonza) were purchased from Fisher Scientific (Hanover Park, IL). S-Traps were purchased from ProtiFi (Huntington, NY). The Pierce fluorometric BCA peptide assay and Pierce colorimetric BCA protein assay were purchased from Thermo Fisher (Waltham, MA). Bovine Serum Albumin was purchased from Rockland Immunochemicals Inc. (Limerick, PA). Fetal bovine serum (FBS) and 0.25% porcine trypsin were purchased from Cytiva (Marlborough, MA).
Patient recruitment
All experiments were approved by the Institutional Review Board of the University of Wisconsin-Madison and conducted in accordance with the U.S. Health and Human Services Basic Policy for Protection of Human Research Subjects. Ascites samples were obtained by paracentesis as a part of the standard-of-care from patients with advanced stage high-grade serous ovarian cancer who had not received any prior treatment for the cancer. The cancer diagnosis was confirmed by clinical pathology of the tumor tissue extracted through cytoreductive surgery. The ascites samples were de-identified by the UW-Madison Comprehensive Center Biobank prior to handing them over to the researchers. Within two hours of the paracentesis procedure, the ascites samples were centrifuged at 1000×g for 20 minutes at 4 °C to remove cellular debris. The supernatants were aliquoted and stored at −80 °C until use.
Collection of MUC16 from conditioned cell media
OVCAR3 cells were validated by human cell Short Tandem Repeat (STR) profiling (ATCC, Manassas, VA) and confirmed to be free of mycoplasma contamination using a PCR kit from Genlantis (San Diego, CA). Collection of MUC16 from OVCAR3 cells was performed using a method modified from Patankar and co-workers.27 Briefly, cells were cultured in 175 cm2 tissue culture flasks containing RPMI 1640 media supplemented with 10% FBS and 2 mM L-glutamine. Cells were grown until they reached 100% confluency at which point spent media was removed. Cells were washed two times with RPMI 1640 media devoid of phenol red and FBS. After washing, fresh media devoid of phenol red and FBS was added. Spent media was collected after five to seven days and centrifuged for 10 minutes at 3000×g to pellet cell debris. The supernatant was spun through a 100 kDa MWCO to concentrate MUC16 which was then spiked into plasma-derived serum as described below.
Preparation of ascites and serum samples
Prior to filtration, each ascites sample was centrifuged at 2000×g for 30 min at 15 °C to pellet any insoluble material. Plasma-derived serum was obtained from MilliporeSigma having been prepared as follows: AB male whole blood was obtained and treated with sodium citrate to prevent coagulation. The sample was centrifuged to pellet cells and the plasma was removed. The plasma was treated with calcium to activate the coagulation cascade, centrifuged, and supernatant (serum) was removed.
Ascites and plasma-derived serum were filtered using Whatman no. 4 (25 μm), no. 5 (2.5 μm), and glass fiber (GF/F) filter (0.7 μm) papers sequentially. Filtrate from GF/F filtration was used for further sample processing. Filtered plasma-derived serum was spiked with MUC16 from the conditioned cell media of OVCAR3 cells. The volume of the spiking solution ranged from a minimum of 2% of the total volume to a maximum of 18% of the total volume. For the plasma-derived serum samples with varied CA125 counts, plasma-derived serum (diluted to 80% with RPMI 1640) was used as the diluent.
Size-exclusion chromatography (SEC)
Filtered ascites or plasma-derived serum samples were loaded onto a 1.5 × 12 cm Sepharose CL-4B gravity flow column with a fractionation range of 60 kDa to 20 MDa. The column was connected to a fraction collector (Model 2110, Bio-Rad), and fractions were collected in droplet mode. Prior to separation, the column was equilibrated using two column volumes of buffer (20 mM Tris HCl, 150 mM sodium chloride, pH 7.5). After equilibration, sample was applied to the column and allowed to enter the resin prior to separation. Proteins were eluted using equilibration buffer. Ten-droplet fractions were collected, and absorbance at 280 nm was monitored on a Nanodrop 2000 spectrometer. The fractions that made up the void peak were pooled and stored at 4 °C. Total protein concentration in the pooled fractions was determined using the Pierce BCA assay. BCA assays were performed using 96-well clear plates read in a SpectraMax M5 spectrophotometer (Molecular Devices, San Jose, CA). A quadratic polynomial function was used to fit the calibration data and to calculate protein concentrations in unknown samples.
Top 14 abundant protein depletion
Three hundred microliters of slurry from a Midi Top 14 Abundant Protein Depletion Column were placed into a 10 mL Pierce centrifuge column (length = 112 mm, width = 16.5 mm). Three hundred micrograms of protein collected in the SEC void peak were added to this column to deplete abundant proteins. The loaded column was placed on a rotating stand at ambient temperature (approximately 22 °C) for 30 min. Following incubation, unbound proteins were eluted by centrifugation at 1000×g for 2 min. The concentration of the eluted proteins was determined using a Pierce BCA assay.
CA125 quantification
CA125 counts for all samples were determined using a CA125 ELISA assay (DRG-International, Fisher Scientific) read on a SpectraMax plate reader as described above. A quadratic polynomial function was used to fit the calibration data and to calculate CA125 counts in unknown samples.
Sample statistics
Measured absorbance values from CA125 ELISA and protein BCA assays were used to find concentrations after fitting a quadratic polynomial to the calibration data. Uncertainties in concentrations were determined from average absorbance values using a method from the Engineering Statistics Handbook (NIST). The approach is summarized in the ESI (Document S1†). Other uncertainties were determined using the rules for error propagation.
Bottom-up proteomics sample preparation
Bottom-up proteomics analysis was performed on samples enriched using SEC alone and samples enriched using both SEC and Top 14 depletion. Following enrichment using SEC alone, 50 μg of total protein were digested. Following enrichment using SEC and Top 14 depletion, 30 μg of total protein were digested. Protein digestion followed methods previously described.28 Briefly, proteins were denatured and reduced simultaneously using 0.4% DCA, 10% SDS, and 10 mM TCEP with incubation at 95 °C for 10 min. Afterwards, proteins were alkylated using 10 mM IAA for 30 min at ambient temperature (approximately 22 °C) in the dark. Alkylation was quenched by adding a mixture of 1.2% phosphoric acid and 90% methanol containing 100 mM TEAB to the protein solution, and the proteins were spun onto an S-Trap device. The S-Trap was washed 3 times with 90% methanol containing 100 mM TEAB. For samples that underwent SEC only, a 1:20 enzyme:protein ratio was used. Samples that underwent SEC and Top14 depletion had a 1:10 enzyme:protein ratio. For all samples, trypsin in 100 mM TEAB in water was added to the S-Trap. The digestion reaction was allowed to proceed for four hours at 37 °C. Following digestion, peptides were eluted using 100 mM TEAB, 0.1% FA, and 50% ACN in three sequential steps. Eluted peptides were dried, resuspended in 0.1% FA, and desalted using ZipTips. Peptide concentrations were determined using the fluorescent peptide BCA assay. Fluorescent BCA assays were performed in 96-well black plates read in a SpectraMax M5 spectrophotometer (Molecular Devices, San Jose, CA). A quadratic polynomial function was used to fit the calibration data and to calculate peptide concentrations in unknown samples.
Mass spectrometry and data analysis
All peptide digests were analyzed using reversed-phase (RP) liquid chromatography on an UltiMate 3000 RSLCnano system coupled to an Orbitrap Eclipse Mass Spectrometer. Enriched peptide pellets were dissolved in 2% ACN/0.1% FA, and 450 ng from each sample was loaded onto an Acclaim PepMap 100 trapping cartridge using the loading pump flowing at 5 μL min−1. Trapped peptides were eluted onto a 75 μm I.D. × 15 cm length C18 column packed in-house with 1.9 μm ReproSil-Pur 120 C18-AQ (Dr Maisch GmbH). The mobile phases were 0.1% FA (buffer A) and 80% ACN with 0.1% FA (buffer B). Peptides were separated using a 130 min RP gradient (wash with 2% B for 5 min, 2–25% B in 82 min, 25–40% B in 20 min, 40–95% B in 1 min, hold at 95% B for 10 min, wash with 2% B for 12 min) at a flow rate of 300 nL min−1. Peptides were eluted directly from the tip of the column and nano sprayed into the mass spectrometer.
The Orbitrap Eclipse was operated in data-dependent mode. Full MS1 spectra/scans were acquired in the Orbitrap at 120 K resolution (Profile mode) with mass range of 375–1500 m/z and normalized AGC target of 250%. The cycle time was set to 3 s, and within those 3 s the most abundant ions/scan were selected for fragmentation by higher energy collision dissociation (HCD). MS2 spectra were collected in the ion trap in rapid scan mode (centroid mode). An isolation window of 1.6 m/z was used for the data dependent MS.2 Dynamic exclusion was employed for 60 s excluding all charge states for a given precursor.
RAW data files were processed using Proteome Discoverer 2.5 (PD 2.5). The data files were searched against a Homo sapiens (Hs) database and a contaminant database. The Hs database consists of 88656 sequences, 88654 H. sapiens non-redundant proteins (downloaded from NCBI on April 11, 2022), and two additional MUC16 protein sequences. The contaminant database consists of 426 usual contaminants (human keratins, IgGs, and proteolytic enzymes). The data were searched using the SEQUEST algorithm in PD 2.5. Oxidation of methionine residues (+15.995 Da) and deamidation of asparagine, glutamine, and arginine (+0.984 Da) were set as variable modifications. Carbamidomethylation of cysteine residues (+57.021 Da) was set as a static modification. In addition, N-terminal glutamate to pyroglutamate (−17.027 Da) on peptide terminus and protein N-terminal acetylation (+42.011 Da) were set as variable modifications. Peptide-spectrum matches (PSM) were adjusted to a 1% false discovery rate (FDR) and minimum PSM number was set to two. A minimum of two peptides were required for protein identification. Data were analyzed and results generated in Excel files.
Results and discussion
Enrichment of CA125 (MUC16) from patient-derived ascites using SEC
The analytical value of fractionating complex samples prior to proteomics analysis has been well demonstrated in diverse sample types including yeast,29,30Arabidopsis,31,32 and ascites fluid,33 among others. We have previously demonstrated the enrichment of MUC16 from 1.5 to 2 L of patient-derived ascites using an affinity-free method involving filtration, ion exchange chromatography (IEX), and SEC.22 The innovation of the method reported here is two-fold: (1) eliminating IEX to simplify sample processing and (2) reducing the input volumes by three orders of magnitude (to 2 mL). To determine if this method can enrich MUC16 from individual patient ascites, we processed five patient samples using SEC. Purity—defined as units (U) of CA125 per milligram (mg) total protein—for the feed solution and pooled fractions were calculated and compared. Purity was used as the metric because CA125 counts are defined in functional units and cannot be directly converted to MUC16 mass. Fig. 2B shows a representative chromatogram; MUC16 is found in the first, smaller peak, which corresponds to the void volume. Table 1 reports the concentration of CA125, total protein concentration, and purity for each feed solution and resulting pooled fractions. For each pool, we also report the increase in purity achieved by SEC and the percent recovery of CA125 and total protein. SEC enrichment increases CA125 purity from a minimum of 40-fold to a maximum of 110-fold compared to the feed solution. The SEC method enriches CA125 from samples with CA125 counts spanning a wide, clinically relevant, range. Notably, the starting CA125 concentration in the ascites sample from patient 2 was less than twice the clinical cutoff (35 U mL−1), suggesting that this enrichment method is compatible with the lower CA125 counts observed in healthy individuals and in early-stage ovarian cancer cases.
Table 1 Summary of CA125 and total protein concentrations, CA125 purity, fold enrichment from the feed solution, and percent of CA125 and protein recovered for the individual patient ascites samples enriched with SEC. CA125 concentrations and uncertainties were calculated from absorbance values using the average of six reads. Protein concentrations and uncertainties were calculated from absorbance values using the average of nine reads. Other values are the result of calculations, with the uncertainty found from error propagation
| Patient number – sample |
CA125 concentration (U mL−1) |
Protein concentration (mg mL−1) |
CA125 purity (U mg−1) |
Purity fold increase from feed |
Percent recovery CA125 |
Percent recovery protein |
| 1 – Feed |
1500 ± 200 |
52 ± 2 |
30 ± 5 |
|
|
|
| 1 – Pool |
480 ± 70 |
0.283 ± 0.015 |
1700 ± 300 |
56 ± 13 |
48 ± 10 |
0.86 ± 0.06 |
| 2 – Feed |
60 ± 12 |
49 ± 3 |
1.2 ± 0.3 |
|
|
|
| 2 – Pool |
20 ± 11 |
0.427 ± 0.017 |
50 ± 30 |
40 ± 20 |
60 ± 30 |
1.5 ± 0.1 |
| 3 – Feed |
9000 ± 2000 |
52.3 ± 1.9 |
160 ± 30 |
|
|
|
| 3 – Pool |
3800 ± 700 |
0.304 ± 0.015 |
12000 ± 2000 |
75 ± 20 |
80 ± 20 |
1.01 ± 0.06 |
| 4 – Feed |
5700 ± 1600 |
30.4 ± 1.2 |
190 ± 52 |
|
|
|
| 4 – Pool |
5000 ± 1000 |
0.258 ± 0.014 |
17000 ± 4000 |
90 ± 30 |
110 ± 40 |
1.22 ± 0.08 |
| 5 – Feed |
7000 ± 2000 |
40.7 ± 1.6 |
150 ± 50 |
|
|
|
| 5 – Pool |
3400 ± 700 |
0.183 ± 0.012 |
19000 ± 4000 |
110 ± 40 |
62 ± 20 |
0.54 ± 0.04 |
Enrichment of CA125 (MUC16) from varied volumes of serum
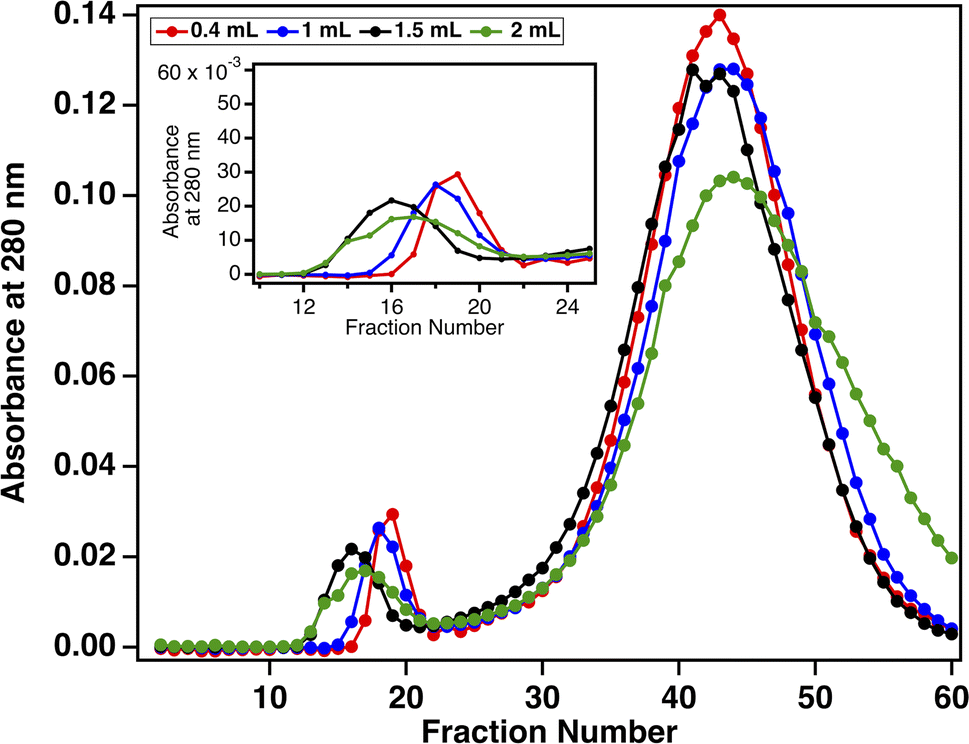
Although the SEC method reported here achieves our goal of a simple process to enrich MUC16 from ∼2 mL input volumes, ascites is not observed in all ovarian cancer cases and is not found in healthy individuals. Our biofluid of ultimate interest is plasma, which can be obtained through a standard-volume blood draw (2–5 mL). We therefore sought to demonstrate the compatibility of SEC enrichment with small volumes of plasma-derived serum. To assess the appropriate amount of plasma-derived serum to load onto a 20 mL SEC column, serum samples ranging from 0.4 to 2.0 mL (corresponding to 2–10% column volumes) were loaded onto SEC columns in separate experiments. Prior to loading, each sample was spiked with 30000 U mL−1 CA125. Resulting chromatograms displayed the general profile seen in Fig. 2B, with an early eluting void peak that contains MUC16 (as confirmed by CA125 ELISA), and a second, larger peak. Fig. 3 shows that when absorbance data are normalized, the chromatograms resulting from all sample volumes contain chromatographic features of comparable migration time and peak shape, suggesting that we can achieve efficient separation when 2–10% of the column volume is loaded.
 |
| | Fig. 3 Normalized size-exclusion chromatograms collected for four loaded volumes of plasma-derived serum. Absorbance at 280 nm was measured for each fraction. The inset shows the unretained void peak that contains MUC16. | |
Enrichment of varied concentrations of CA125 from serum
Following SEC, fractions that corresponded to the void peak were pooled and designated P1, and the first five fractions of the second peak were pooled and designated P2. As for the ascites samples, purity and fold enrichment were determined. The results are reported in Table 2. For all samples, more CA125 was recovered in the void peak than the second peak, and void peak material yielded the greatest MUC16 purity. The greatest increase in purity is achieved from loading 2 mL of sample, a volume of serum attainable from a single blood draw. Serum CA125 levels can range from below 35 U mL−1 in healthy individuals to over 10000 U mL−1 in patients with ovarian cancer.11,13,34,35 It is therefore important that an enrichment method be able to enrich MUC16 from serum samples with a wide range of CA125 concentrations. To determine the CA125 concentration range compatible with the SEC enrichment method, we prepared serum samples that contain CA125 in concentrations spanning three orders of magnitude. Samples were prepared by spiking known amounts of MUC16 into plasma-derived serum. Two mL of spiked plasma-derived serum were processed through SEC; this process was repeated a total of three times. Table 3 reports average values of concentration of CA125, total protein concentration, and purity for each feed solution and resulting pooled fractions. For each pool, we also report the increase in purity achieved by SEC and the percent recovery of CA125 and total protein. SEC enrichment increases purity between a minimum of 99-fold and a maximum of 196-fold compared to the feed solution. This purity fold enrichment compares favorably to what was observed when using SEC to enrich MUC16 from ascites.22 Additionally, most of the CA125 loaded onto the column was recovered. In contrast, less than two percent of the total protein was recovered in the void peak. This low recovery of total protein is critical to increasing the purity of MUC16.
Table 2 Summary of CA125 and total protein concentrations, CA125 purity, fold enrichment from the feed solution, and percent of CA125 and protein recovered for varied volumes of plasma-derived serum spiked with CA125. The same feed solution was used for all loading volumes. For each volume loaded, we report data that come from the fractions corresponding to the void peak (P1) and the following five fractions (P2). CA125 concentrations and uncertainties were calculated from absorbance values using the average of six reads. Protein concentrations and uncertainties were calculated from absorbance values using the average of nine reads. Other values are the result of calculations, with the uncertainty found from error propagation
| Sample |
CA125 concentration (U mL−1) |
Protein concentration (mg mL−1) |
CA125 purity (U mg−1) |
Purity fold increase from feed |
Percent recovery CA125 |
Percent recovery protein |
| 0.4 mL feed |
17000 ± 400 |
52 ± 3 |
330 ± 20 |
|
|
|
| 0.4 mL P1 |
1820 ± 80 |
0.038 ± 0.011 |
47000 ± 14000 |
140 ± 40 |
49 ± 3 |
0.3 ± 0.1 |
| 0.4 mL P2 |
990 ± 80 |
0.076 ± 0.011 |
13000 ± 3000 |
39 ± 7 |
32 ± 3 |
0.82 ± 0.13 |
| 1.0 mL feed |
17000 ± 400 |
52 ± 3 |
330 ± 20 |
|
|
|
| 1.0 mL P1 |
4260 ± 170 |
0.110 ± 0.012 |
39000 ± 5000 |
118 ± 16 |
64 ± 8 |
0.05 ± 0.07 |
| 1.0 mL P2 |
2000 ± 60 |
0.233 ± 0.016 |
8600 ± 600 |
26 ± 2 |
20 ± 2 |
0.79 ± 0.07 |
| 1.5 mL feed |
17000 ± 400 |
52 ± 3 |
330 ± 20 |
|
|
|
| 1.5 mL P1 |
5500 ± 200 |
0.0161 ± 0.013 |
34000 ± 3000 |
104 ± 11 |
70 ± 8 |
0.67 ± 0.07 |
| 1.5 mL P2 |
2700 ± 100 |
0.447 ± 0.019 |
6100 ± 300 |
19 ± 2 |
20.9 ± 1.7 |
1.12 ± 0.08 |
| 2.0 mL feed |
17000 ± 400 |
52 ± 3 |
330 ± 20 |
|
|
|
| 2.0 mL P1 |
8200 ± 200 |
0.228 ± 0.013 |
3600 ± 2000 |
110 ± 9 |
81 ± 7 |
0.74 ± 0.06 |
| 2.0 mL P2 |
3090 ± 80 |
0.54 ± 0.03 |
5700 ± 300 |
17 ± 1 |
17.0 ± 1.4 |
0.98 ± 0.07 |
| — |
— |
— |
— |
Total recovery |
98 ± 9 |
1.72 ± 0.06 |
Table 3 Summary of CA125 and total protein concentrations, CA125 purity, fold enrichment from the feed solution, and percent of CA125 and protein recovered from plasma-derived serum samples with varied concentrations of CA125. For the feed solutions, CA125 concentrations and uncertainties were calculated from absorbance values using the average of six reads. Protein concentrations and uncertainties were calculated from absorbance values using the average of nine reads. Other values are the result of calculations, with the uncertainty found from error propagation. For each pool sample, concentrations (CA125 and protein) and associated uncertainties were found from the calibration curve. Values in the table are the average and standard deviation for three identical replicate samples of feed solution processed on the SEC column
| Sample |
CA125 concentration (U mL−1) |
Protein concentration (mg mL−1) |
CA125 purity (U mg−1) |
Purity fold increase from feed |
Percent recovery CA125 |
Percent recovery protein |
| 30 U mL−1 feed |
38 ± 4 |
58 ± 3 |
0.66 ± 0.07 |
|
|
|
| 30 U mL−1 pool |
32 ± 3 |
0.248 ± 0.016 |
129 ± 16 |
196 ± 17 |
122 ± 17 |
0.62 ± 0.05 |
| 300 U mL−1 feed |
160 ± 15 |
44 ± 2 |
5.9 ± 0.4 |
|
|
|
| 300 U mL−1 pool |
185 ± 8 |
0.253 ± 0.015 |
730 ± 50 |
123 ± 9 |
110 ± 8 |
0.89 ± 0.07 |
| 3000 U mL−1 feed |
3080 ± 180 |
45.4 ± 1.8 |
68 ± 5 |
|
|
|
| 3000 U mL−1 pool |
1790 ± 86 |
0.267 ± 0.013 |
6700 ± 500 |
99 ± 6 |
83 ± 6 |
0.84 ± 0.05 |
| 30000 U mL−1 feed |
33000 ± 2000 |
48 ± 2 |
690 ± 50 |
|
|
|
| 30000 U mL−1 pool |
20000 ± 1000 |
0.270 ± 0.014 |
76000 ± 5000 |
109 ± 7 |
88 ± 7 |
0.81 ± 0.06 |
SEC enrichment of MUC16 from serum enables mass spectrometry detection
We prepared samples of plasma-derived serum spiked with clinically relevant amounts of CA125 (5000 U mL−1 and 100 U mL−1). These samples were analyzed via bottom-up proteomics without any prior enrichment or depletion of abundant proteins, and no MUC16 peptides were detected in either sample. These results are consistent with the findings of several recent studies performing bottom-up proteomics on serum and ascites from ovarian cancer patients that did not identify MUC16 peptides in samples with detectable CA125 counts.36–39 To determine if SEC enrichment of MUC16 enabled MUC16 peptides to be detected in a bottom-up proteomics assay, we prepared four samples spiked with varied concentrations of CA125, performed SEC enrichment as described above, and then analyzed each sample using bottom-up proteomics. Table S1† reports CA125 and protein concentration, purity, purity fold increase over feed, and percent recoveries for these samples. The pooled fractions for each sample were proteolytically digested and analyzed using an Orbitrap Eclipse mass spectrometer. The CA125 counts in the pooled fractions ranged from a minimum of 100 U mL−1 to a maximum of 7900 U mL−1, which corresponds to performing digestion on CA125 in a range between a minimum of 13 U and a maximum of 1040 U. Table 4 shows the CA125 concentration and amount digested along with the number of MUC16 peptides identified and percent coverage of MUC16 in duplicate digestions. MUC16 peptides were detected in all samples processed using SEC. This is in contrast with the results from samples not enriched by SEC in which no MUC16 peptides were detected in a sample that contained 5000 U mL−1 CA125 (a digested amount of 22 U). Fig. 4 shows the peptides identified in MS mapped onto the MUC16 amino acid sequence. The number of amino acids of MUC16 reported in these coverage maps is fewer than the number used in our previous publications.22,28 This change reflects our newly reported revised molecular model of the MUC16 tandem repeat domain, which contains 19 tandem repeats, not 63 as was previously reported.14,16 Peptides identified through MS map to the tandem repeat domain and C-terminal domain of MUC16 and not the N-terminus, consistent with our previous reports.22,28 We further investigated the complementarity between peptides identified in each sample (Fig. 5). The sample that contained the highest CA125 counts resulted in the greatest number of MUC16 peptides identified. As CA125 concentration decreased, no new peptides were identified, and all identified peptides were a subset of the peptides detected in the highest concentration sample.
Table 4 Summary of mass spectrometry analysis of MUC16 enriched from plasma-derived serum using SEC. Column 1 reports replicate number. Column 2 reports the concentration of CA125, and column 3 reports the amount of CA125 digested. Column 4 contains the average ± standard deviation of the number of MUC16 peptides identified in triplicate injections (technical triplicates). Column 5 shows the total percent coverage of MUC16
| Replicate number |
CA125 concentration (U mL−1) |
Amount digested (U) |
Number of MUC16 peptides |
MUC16 percent coverage |
| 1 |
7900 ± 1100 |
1040 |
56 ± 2 |
7 |
| 2 |
|
|
56 ± 3 |
8 |
| 1 |
870 ± 150 |
119 |
22 ± 2 |
5 |
| 2 |
|
|
29 ± 5 |
5 |
| 1 |
180 ± 40 |
21 |
3 ± 2 |
1 |
| 2 |
|
|
4 ± 2 |
2 |
| 1 |
100 ± 20 |
13 |
2 ± 1 |
1 |
| 2 |
|
|
1 ± 1 |
1 |
 |
| | Fig. 4 Sequence coverage maps of MUC16 peptides identified from plasma-derived serum. Green vertical bars indicate MUC16 peptides identified in MS analysis. | |
 |
| | Fig. 5 Venn diagrams comparing MUC16 peptides identified in four plasma-derived serum samples. Samples were spiked with CA125 (13, 21, 119, and 1040 U, respectively), enriched through SEC, and analyzed via bottom-up proteomics. The number of MUC16 peptides identified correlate with CA125 counts, and the peptides identified in samples with lower CA125 counts are a subset of those in samples with higher CA125 counts. | |
High abundance, low molecular weight proteins co-elute with MUC16
In our previous work, low molecular weight proteins were observed to co-elute with MUC16 from a size-exclusion column. One possible explanation for this observation was that the ionic strength of the elution buffer—10 mM ammonium bicarbonate—was not sufficient to prevent protein aggregation. In this study, the input sample is serum, which has an ionic strength of ∼150 mM. For the SEC separations reported here, the elution buffer—20 mM Tris HCl supplemented with 150 mM NaCl—was selected because it is isotonic with serum. When 20 mM Tris alone was used as the elution buffer, the solution was visibly cloudy, which we attribute to protein aggregation. Addition of 150 mM NaCl cleared the solution, likely because this higher ionic strength solution disrupted protein aggregation. We hypothesized that increasing the ionic strength of our buffer would also reduce the number of low molecular weight proteins that co-elute with MUC16 along with reducing protein aggregation.
To investigate the range of molecular weights of proteins identified in mass spectrometry, the number of identified peptides originating from each protein was plotted on a log scale40 as a function of the molecular weight of the proteins from which the peptide derived. Fig. 6 shows that the molecular weight of the proteins span 9–1600 kDa. MUC16 is the only protein with a molecular weight >600 kDa. To further investigate the molecular weights of proteins identified, we examined the molecular weight of proteins ranging from 9 to 100 kDa (Fig. 6 insets). Surprisingly, there is a positive correlation between the amount of CA125 digested and the number of low molecular weight proteins identified, suggesting that these proteins are co-eluting with MUC16, even at high ionic strength.
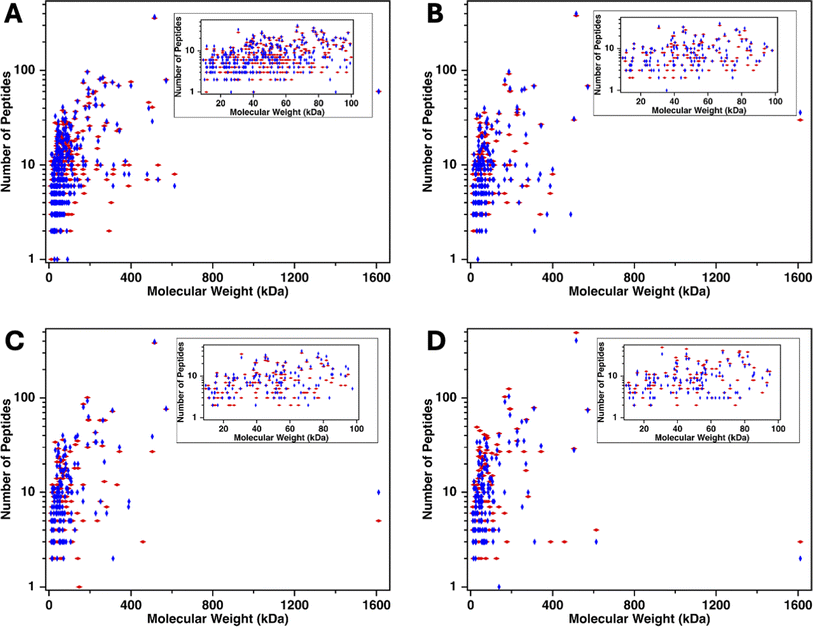 |
| | Fig. 6 Number of peptides (log scale) identified versus the molecular weight of the parent protein for plasma-derived serum samples containing decreasing amounts of CA125: (A) 1040 U, (B) 119 U, (C) 21 U, and (D) 13 U. The inset shows proteins of molecular weight 9–100 kDa. Red diamonds represent proteins identified in biological replicate one and blue diamonds are proteins identified in biological replicate two. | |
In addition to identifying low molecular weight proteins, mass spectrometry analysis shows that many highly abundant proteins are identified in the void peak. Search results identify apolipoprotein B-100, alpha-1-antitrypsin, complement factors, alpha-2-macroglobulin, and haptoglobin in all enriched samples. Although some of these proteins have a molecular weight of 400–500 kDa, several others have molecular weights <100 kDa; these proteins should have been trapped by SEC. It is possible that the proteins with molecular weights <100 kDa are co-eluting with MUC16 or forming aggregates with themselves or other proteins, including albumin.25 These protein aggregates may be large enough to avoid entering the beads and elute in the void peak. We therefore explored the effects on MS of depleting abundant proteins using affinity pull-down.
Depletion of abundant proteins using Top 14 depletion columns
Mass spectrometry analysis reveals that high abundance proteins co-elute with MUC16 in the void peak (listed in Table S2†). To achieve higher purity MUC16 and potentially increase the number of detectable MUC16 peptides, the SEC-enriched pool corresponding to the void peak was treated using Top 14 protein depletion columns. Surprisingly, the depletion columns were observed to deplete MUC16, perhaps via complexation of MUC16 with abundant proteins. Table 4 shows that 10–33 percent of CA125 is recovered in the flow through, significantly less than what is observed when CA125 is enriched using SEC. Additionally, Top 14 protein depletion, in contrast with SEC, does not consistently increase CA125 purity. Studies by Gundry and co-workers and Silva-Costa and co-workers have shown that commercially available abundant protein depletion columns deplete 35 to 100 more proteins than expected.25,26 Despite the decreased purity and the loss of MUC16, we hypothesized that removal of abundant proteins may enable detection of new, low-abundance MUC16 peptides that are masked by contamination with high-abundance peptides.
Plasma-derived serum samples that had been enriched via SEC and depletion of abundant proteins were analyzed using bottom-up proteomics. Table 5 shows a summary of the concentration and corresponding amount of CA125 digested, the number of peptides identified, and the percent coverage between two biological replicates. Table 6 shows that MUC16 peptides are identified in all samples, including those in which the CA125 concentration is below the clinical cutoff (35 U mL−1). The mass spectrometry data suggest that depletion of highly abundant proteins enables detection of MUC16 peptides from lower input amounts of MUC16. A sample containing 11 U CA125 that underwent SEC and Top 14 protein depletion resulted in 4–11 identified peptides, whereas a sample that underwent SEC alone but contained a similar CA125 amount resulted in 1–2 identified peptides. The identification of a greater number of peptides when less CA125 is digested suggests that depletion of abundant proteins enables detection of more MUC16 peptides despite the penalty of MUC16 loss and may be a valuable approach, depending on the goal of the experiment. Most peptides detected through MS are shared between the two enrichment methods (Fig. S1†).
Table 5 Summary of CA125 and total protein concentrations, CA125 purity, fold enrichment from the feed solution, and percent of CA125 and protein recovered for plasma-derived serum samples (lableled as A–D) with varied concentrations of CA125 that were enriched with SEC and then depleted of abundant proteins. CA125 concentrations and uncertainties were calculated from absorbance values using the average of six reads. Protein concentrations and uncertainties were calculated from absorbance values using the average of nine reads. Other values are the result of calculations, with the uncertainty found from error propagation
| Sample |
CA125 concentration (U mL−1) |
Protein concentration (mg mL−1) |
CA125 purity (U mg−1) |
Purity fold increase from feed |
Percent recovery CA125 |
Percent recovery protein |
| A – SEC only |
7900 ± 1100 |
0.224 ± 0.013 |
35000 ± 5000 |
|
|
|
| A – SEC + depletion |
2400 ± 100 |
0.058 ± 0.012 |
41000 ± 9000 |
1.2 ± 0.3 |
26 ± 4 |
22 ± 5 |
| B – SEC only |
870 ± 150 |
0.208 ± 0.012 |
4200 ± 800 |
|
|
|
| B – SEC + depletion |
870 ± 150 |
0.049 ± 0.012 |
4000 ± 1000 |
1.0 ± 0.3 |
21 ± 4 |
21 ± 5 |
| C – SEC only |
180 ± 40 |
0.220 ± 0.014 |
810 ± 180 |
|
|
|
| C – SEC + depletion |
69 ± 3 |
0.048 ± 0.017 |
1400 ± 500 |
1.8 ± 0.7 |
33 ± 7 |
19 ± 7 |
| D – SEC only |
100 ± 20 |
0.227 ± 0.016 |
500 ± 100 |
|
|
|
| D – SEC + depletion |
13 ± 1 |
0.043 ± 0.011 |
300 ± 80 |
0.7 ± 0.2 |
10 ± 2 |
16 ± 4 |
Table 6 Summary of mass spectrometry analysis of MUC16 enriched from plasma-derived serum using SEC followed by depletion of Top 14 abundant proteins. Column 1 reports replicate number. Column 2 reports the concentration of CA125, and Column 3 reports the amount of CA125 digested. Column 4 contains the average ± standard deviation of the number of MUC16 peptides identified in triplicate injections (technical triplicates). Column 5 shows the total percent coverage of MUC16
| Replicate number |
CA125 concentration (U mL−1) |
Amount digested (U) |
Number of MUC16 peptides |
Percent coverage |
| 1 |
2400 ± 100 |
317 |
51 ± 2 |
7 |
| 2 |
|
|
47 ± 1 |
7 |
| 1 |
209 ± 7 |
32 |
30 ± 2 |
5 |
| 2 |
|
|
24 ± 2 |
5 |
| 1 |
69 ± 3 |
11 |
11 ± 1 |
2 |
| 2 |
|
|
4 ± 2 |
1 |
| 1 |
13 ± 1 |
2 |
11 ± 2 |
2 |
| 2 |
|
|
4 ± 1 |
1 |
Number of MUC16 peptides identified in MS correlates with CA125 counts
The clinical CA125 immunoassay reports concentration in units per milliliter (U mL−1), and there is no conversion factor between this functional unit and amounts of MUC16 in mass or mole units. We have previously demonstrated that the number of MUC16 peptides identified correlate with clinical CA125 counts when 100–5000 U CA125 are digested.22 To further explore the correlation of number of MUC16 peptides identified and CA125 counts, we digested 13–1040 U of CA125 enriched from plasma-derived serum using SEC. Fig. 7A shows that the number of MUC16 peptides identified from plasma-derived serum that was enriched with SEC correlates with CA125 counts determined using a research-grade CA125 ELISA. These results agree with the results of a clinical CA125 immunoassay (Table S3†). Fig. 7B shows a similar trend for MUC16 peptides identified after SEC and Top 14 abundant protein depletion. This finding suggests that a mass spectrometry assay may complement the existing clinical assay by providing direct detection of MUC16 instead of the indirect detection method used in the current CA125 test. Whereas the CA125 immunoassay provides quantitative determination of the CA125 epitope(s), MS provides information on regions of MUC16 that are located both within the CA125 epitope(s) and outside. The broader molecular coverage enabled by MS therefore provides an opportunity to further stratify samples based on the biochemical presentation of MUC16.
 |
| | Fig. 7 Number of MUC16 peptides identified using mass spectrometry versus amount of CA125 digested. (A) MUC16 peptides identified after SEC only. (B) MUC16 peptides identified after SEC and Top 14 abundant protein depletion. Each data point represents an average of technical triplicate MS runs. Error bars are standard deviations (n = 3). Slopes of two biological duplicate plots agree as determined by T-score (Panel A, SEC only: T-calc = 0.0362, T-crit = 2.776; p value = 0.973. Panel B, SEC + depletion: T-calc = 0.073, T-crit = 2.776; p value = 0.946). | |
Conclusion
Using gravity flow-based size-exclusion chromatography, MUC16 can be enriched from 0.4 to 2.0 mL of serum and ascites. Enriched MUC16 is detectable with a high-resolution mass spectrometer, even when as little as 2 U of CA125 are digested. Although Top 14 depletion columns also remove MUC16 (an unexpected effect), more MUC16 peptides are detected in MS after Top 14 protein depletion. The method reported here will allow for the enrichment and mass spectrometry analysis of MUC16 from serum samples of healthy patients and those with ovarian cancer. This strategy enables the detection of multiple regions of MUC16, providing coverage beyond the epitope(s) recognized in the clinical CA125 test. Detection of multiple regions of MUC16 may result in a more sensitive test than the existing immunoassay and enable a new approach to stratification based on the biochemical presentation of MUC16. Additional benefit may come from replacing Data-Dependent Acquisition (DDA) with a global protein profiling approach, such as Data-Independent Acquisition (DIA), or a targeted approach, such as Parallel Reaction Monitoring (PRM). We are actively pursuing these alternative MS approaches.
Data availability
The mass spectrometry proteomics data have been deposited to the ProteomeXchange Consortium via the PRIDE partner repository with the dataset identifier PXD053289.
Author contributions
Naviya Schuster-Little: conceptualization, investigation, original draft preparation, reviewing and editing, visualization. Andrew D. Sokolovsky: investigation, reviewing and editing. Ashten Gentry: investigation, reviewing and editing. Anita Saraf: investigation, reviewing and editing. Mark R. Etzel: conceptualization, reviewing and editing, funding acquisition. Manish S. Patankar: conceptualization, reviewing and editing, supervision, funding acquisition. Rebecca J. Whelan: conceptualization, original draft preparation, reviewing and editing, supervision, data acquisition.
Conflicts of interest
There are no conflicts to declare.
Acknowledgements
The authors wish to thank the Mass Spectrometry and Analytical Proteomics Laboratory (MSAPL) at the University of Kansas for mass spectrometry data collection and analysis. This work was supported by award R21CA267532 from the NCI and by an NIH grant from NIGMS and OD (1 P20 GM152280). NSL was supported by the Carl and Catherine Chaffee Scholarship from the University of Kansas. ADS was supported by an Undergraduate Research Award from the University of Kansas. Partial funding for this study was also obtained through R35CA197605 and through support from Wisconsin Ovarian Cancer Alliance and the University of Wisconsin-Madison Department of Obstetrics and Gynecology.
References
- L. Thadikkaran, M. A. Siegenthaler, D. Crettaz, P. A. Queloz, P. Schneider and J. D. Tissot, Proteomics, 2005, 5, 3019–3034 CrossRef CAS PubMed.
- G. Liumbruno, A. D'Alessandrd, G. Grazzini and L. Zolla, J. Proteomics, 2010, 73, 483–507 CrossRef CAS PubMed.
- Y. Zhao, Q. Xue, M. Wang, B. Meng, Y. Jiang, R. Zhai, Y. Zhang, X. H. Dai and X. Fang, J. Proteome Res., 2023, 22, 1009–1023 CrossRef CAS PubMed.
- R. S. Tirumalai, K. C. Chan, D. A. Prieto, H. J. Issaq, T. P. Conrads and T. D. Veenstra, Mol. Cell. Proteomics, 2003, 2, 1096–1103 CrossRef CAS PubMed.
- A. Tessitore, A. Gaggiano, G. Cicciarelli, D. Verzella, D. Capece, M. Fischietti, F. Zazzeroni and E. Alesse, Int. J. Proteomics, 2013, 2013, 125858 Search PubMed.
- L. Gortzak-Uzan, A. Ignatchenko, A. I. Evangelou, M. Agochiya, K. A. Brown, P. S. Onge, I. Kireeva, G. Schmitt-Ulms, T. J. Brown, J. Murphy, B. Rosen, P. Shaw, I. Jurisica and T. Kislinger, J. Proteome Res., 2008, 7, 339–351 CrossRef CAS PubMed.
- S. Elschenbroich, V. Ignatchenko, B. Clarke, S. E. Kalloger, P. C. Boutros, A. O. Gramolini, P. Shaw, I. Jurisica and T. Kislinger, J. Proteome Res., 2011, 10, 2286–2299 CrossRef CAS PubMed.
- C. V. Trinidad, H. B. Pathak, S. B. Cheng, S. C. Tzeng, R. Madan, M. E. Sardiu, L. E. Bantis, C. Deighan, A. Jewell, S. Rayamajhi, Y. Zeng and A. K. Godwin, Sci. Rep., 2023, 13, 18341 CrossRef CAS PubMed.
- R. C. Bast, T. L. Klug, E. Stjohn, E. Jenison, J. M. Niloff, H. Lazarus, R. S. Berkowitz, T. Leavitt, C. T. Griffiths, L. Parker, V. R. Zurawski and R. C. Knapp, N. Engl. J. Med., 1983, 309, 883–887 CrossRef PubMed.
- M. E. L. Vanderburg, F. B. Lammes and J. Verweij, Ann. Oncol., 1990, 1, 301–302 CrossRef CAS PubMed.
- M. E. L. Vanderburg, F. B. Lammes and J. Verweij, Neth. J. Med., 1992, 40, 36–51 CAS.
- B. W. T. Yin and K. O. Lloyd, J. Biol. Chem., 2001, 276, 27371–27375 CrossRef CAS PubMed.
- M. Felder, A. Kapur, J. Gonzalez-Bosquet, S. Horibata, J. Heintz, R. Albrecht, L. Fass, J. Kaur, K. Hu, H. Shojaei, R. J. Whelan and M. S. Patankar, Mol. Cancer, 2014, 13, 129 CrossRef PubMed.
- T. J. O'Brien, J. B. Beard, L. J. Underwood, R. A. Dennis, A. D. Santin and L. York, Tumor Biol., 2001, 22, 348–366 CrossRef PubMed.
- T. J. O'Brien, J. B. Beard, L. J. Underwood and K. Shigemasa, Tumor Biol., 2002, 23, 154–169 CrossRef PubMed.
- C.-W. Wang, S. D. Weaver, N. Boonpattrawong, N. Schuster-Little, M. Patankar and R. J. Whelan, Cancer Res. Commun., 2024, 4, 253–263 CrossRef CAS PubMed.
- A. Bressan, F. Bozzo, C. A. Maggi and M. Binaschi, Dis. Markers, 2013, 34, 257–267 CrossRef CAS PubMed.
- L. Marcos-Silva, Y. Narimatsu, A. Halim, D. Campos, Z. Yang, M. A. Tarp, P. J. B. Pereira, U. Mandel, E. P. Bennett, S. Y. Valchrushev, S. B. Levery, L. David and H. Clausen, J. Proteome Res., 2014, 13, 3349–3359 CrossRef CAS PubMed.
- C. W. Wang, E. K. Hanson, L. Minkoff and R. J. Whelan, Cancer Biomarkers, 2023, 37, 85–94 Search PubMed.
- G. Becker, D. Galandi and H. E. Blum, Eur. J. Cancer, 2006, 42, 589–597 CrossRef PubMed.
- A. A. Ayantunde and S. L. Parsons, Ann. Oncol., 2007, 18, 945–949 CrossRef CAS PubMed.
- N. Schuster-Little, R. Fritz-Klaus, M. Etzel, N. Patankar, S. Javeri, M. S. Patankar and R. J. Whelan, Analyst, 2021, 146, 85–94 RSC.
- H. M. Davis, V. R. Zurawski Jr, R. C. Bast Jr and T. L. Klug, Cancer Res., 1986, 46, 6143–6148 CAS.
- E. Perez, K. Bierla, G. Grindlay, J. Szpunar, J. Mora and R. Lobinski, Anal. Chim. Acta, 2018, 1018, 7–15 CrossRef CAS PubMed.
- R. L. Gundry, Q. Fu, C. A. Jelinek, J. E. Van Eyk and R. J. Cotter, Proteomics: Clin. Appl., 2007, 1, 73–88 CAS.
- L. C. Silva-Costa, S. Garcia-Rosa, B. J. Smith, P. A. Baldasso, J. Steiner and D. Martins-de-Souza, Sep. Sci. Plus, 2019, 2, 449–456 CrossRef CAS.
- N. K. Wong, R. L. Easton, M. Panico, M. Sutton-Smith, J. C. Morrison, F. A. Lattanzio, H. R. Morris, G. F. Clark, A. Dell and M. S. Patankar, J. Biol. Chem., 2003, 278, 28619–28634 CrossRef CAS PubMed.
- N. Schuster-Little, S. Madera and R. Whelan, Anal. Bioanal. Chem., 2020, 412, 6361–6370 CrossRef CAS PubMed.
- J. Gao, G. J. Opiteck, M. S. Friedrichs, A. R. Dongre and S. A. Hefta, J. Proteome Res., 2003, 2, 643–649 CrossRef CAS PubMed.
- Q. A. Gao, A. G. Madian, X. P. Liu, J. Adamec and F. E. Regnier, J. Chromatogr. A, 2010, 1217, 7661–7668 CrossRef CAS PubMed.
- Z. McBride, D. L. Chen, C. Reick, J. Xie and D. B. Szymanski, Mol. Cell. Proteomics, 2017, 16, 1972–1989 CrossRef CAS PubMed.
- P. D. B. Olinares, L. Ponnala and K. J. van Wijk, Mol. Cell. Proteomics, 2010, 9, 1594–1615 CrossRef CAS PubMed.
- C. Kuk, V. Kulasingam, C. G. Gunawardana, C. R. Smith, I. Batruch and E. P. Diamandis, Mol. Cell. Proteomics, 2009, 8, 661–669 CrossRef CAS PubMed.
- S. J. Skates, F. J. Xu, Y. H. Yu, K. Sjovall, N. Einhorn, Y. C. Chang, R. C. Bast and R. C. Knapp, Cancer, 1995, 76, 2004–2010 CrossRef CAS PubMed.
- P. Charkhchi, C. Cybulski, J. Gronwald, F. O. Wong, S. A. Narod and M. R. Akbari, Cancers, 2020, 12, 3730 CrossRef CAS PubMed.
- J. F. Timms, E. Arslan-Low, M. Kabir, J. Worthington, S. Camuzeaux, J. Sinclair, J. Szaub, B. Afrough, V. N. Podust, E. O. Fourkala, M. Cubizolles, F. Kronenberg, E. T. Fung, A. Gentry-Maharaj, U. Menon and I. Jacobs, Proteomics: Clin. Appl., 2014, 8, 982–993 CAS.
- C. Han, S. Bellone, E. R. Siegel, G. Altwerger, G. Menderes, E. Bonazzoli, T. Egawa-Takata, F. Pettinella, A. Bianchi, F. Riccio, L. Zammataro, G. Yadav, J. A. Marto, M. F. Penet, D. A. Levine, R. Drapkin, A. Patel, B. Litkouhi, E. Ratner, D. A. Silasi, G. S. Huang, M. Azodi, P. E. Schwartz and A. D. Santin, Gynecol. Oncol., 2018, 149, 585–591 CrossRef CAS PubMed.
- R. Bhawal, A. L. Oberg, S. Zhang and M. Kohli, Cancers, 2020, 12, 2428 CrossRef CAS PubMed.
- M. Dutt, G. Hartel, R. S. Richards, A. K. Shah, A. Mohamed, S. Apostolidou, A. Gentry-Maharaj, J. D. Hooper, L. C. Perrin, U. Menon, M. M. Hill and A. O. C. S. Grp, Proteomics: Clin. Appl., 2023, 17, 2200114 CAS.
- T. Thavarajah, M. Tucholska, P. H. Zhu, P. Bowden and J. G. Marshall, Anal. Biochem., 2020, 599, 113680 CrossRef CAS PubMed.
Footnote |
| † Electronic supplementary information (ESI) available: Fig. S1 (Venn diagrams showing effect of enrichment method on MUC16 peptides detected), Table S1 (CA125 and protein recoveries from samples analyzed by MS), Table S2 (list of co-eluting proteins), Table S3 (comparison of results from clinical and research-grade CA125 immunoassay kits) and Document S1 showing equations used to calculate uncertainties in concentration values found from non-linear calibration curves. See DOI: https://doi.org/10.1039/d4ay01172d |
|
| This journal is © The Royal Society of Chemistry 2024 |
Click here to see how this site uses Cookies. View our privacy policy here. 
 Open Access Article
 This Open Access Article is licensed under a Creative Commons Attribution-Non Commercial 3.0 Unported Licence
 ab,
Andrew D.
Sokolovsky
ab,
Ashten
Gentry
ab,
Anita
Saraf
ab,
Andrew D.
Sokolovsky
ab,
Ashten
Gentry
ab,
Anita
Saraf