
 Open Access Article
 This Open Access Article is licensed under a
 Creative Commons Attribution 3.0 Unported Licence
Quality and efficiency assessment of five extracellular vesicle isolation methods using the resistive pulse sensing strategy
Min
Yang
a,
Jia
Guo
a,
Le
Fang
b,
Ze
Chen
a,
Ying
Liu
a,
Zepeng
Sun
a,
Xin
Pang
 a and
Yinghua
Peng
*a
a and
Yinghua
Peng
*a
aInstitute of Special Animal and Plant Sciences, Chinese Academy of Agricultural Sciences, Changchun, 130112, China. E-mail: pengyinghua@caas.cn
bDepartment of Neurolog, China Japan Union Hospital, Jilin University, Changchun, 130022, China
First published on 10th July 2024
Abstract
Extracellular vesicles (EVs) have attracted great interest due to their great potential in disease diagnosis and therapy. The separation of EVs from complex biofluids with high purity is essential for the accurate analysis of EVs. Despite various methods, there is still no consensus on the best method for high-quality EV isolation and reliable mass production. Therefore, it is important to offer a standardized method for characterizing the properties (size distribution, particle concentration and purity) of EV preparations from different isolation methods. Herein, we employed a NanoCoulter Counter based on the resistive pulse sensing (RPS) strategy that enabled multi-parameter analysis of single EVs to compare the quality and efficiency of different EV isolation techniques including traditional differential ultracentrifugation, ultrafiltration, size exclusion chromatography, membrane affinity binding and polymer precipitation. The data revealed that the NanoCoulter Counter based on the RPS strategy was reliable and effective for the characterization of EVs. The results suggested that although higher particle concentrations were observed in three commercial isolation kits and ultrafiltration, traditional differential ultracentrifugation showed the highest purity. In conclusion, our results from the NanoCoulter Counter provided reliable evidence for the assessment of different EV isolation methods, which contributed to the development of EV-based disease biomarkers and treatments.
1. Introduction
EVs are different cell and biofluid derived nanoscale vesicles with a diameter of 30–150 nm and consist of functional proteins, small molecules, nucleic acids and other metabolites.1–3 EVs are found in nearly all kinds of cells and body fluids, including plasma, urine, saliva and breast milk.4–6 The type and content of proteins, lipids and miRNAs carried in EVs can directly reflect the type of their deriving source.7–10 EVs not only contribute to a better understanding of cellular physiology and pathology, but also show great potential for transformation into clinical applications, ranging from disease diagnosis to drug delivery.11–15 Therefore, the isolation and characterization of high purity EVs are considered to be important and major challenges for further clinical applications. The International Society for Extracellular Vesicles and the Chinese Society for Extracellular Vesicles have published a set of group standards for the isolation and quality assessment of EVs.16Traditional differential ultracentrifugation (UC) is regarded as the “gold standard” for EV isolation, which can effectively isolate EVs from various cells and biological fluids.17,18 Recently, a number of commercial kits have been made available to isolate EVs based on different principles including size exclusion chromatography (SEC), polymer precipitation, membrane affinity binding and ultrafiltration (UF).19–22 For example, qEV from Izon is a kind of SEC column.23–25 ExoQuick from System Biosciences is based on polymer precipitation.26 exoEasy from Qiagen relies on membrane-based affinity binding.27 The ultrafiltration tube from Millipore is a kind of centrifugal filter device.28 To improve the purity, researchers have tried to combine different methods such as ultracentrifugation and SEC for the isolation of EVs.29,30 Although these kits require less time and do not need special equipment, their applicability for scientific and clinical applications is undefined due to the uncertain quality of EVs. This is particularly true for plasma or serum samples, as there is a significant overlap in particle size and density between EVs and lipoprotein particles, which usually leads to unintentional co-separation of these two different entities.31 Furthermore, prior to using isolated EVs for downstream proteomics, nucleomics and lipomics analyses, it is necessary to comprehensively characterize the quality and quantity of EVs using different parameters such as size, concentration, zeta potential and purity.
Currently, several technologies have been applied to compare the isolation efficiency of various EV isolation techniques, including transmission electron microscopy (TEM),32,33 dynamic light scattering (DLS),34–36 nanoparticle tracking analysis (NTA)37–39 and nano-flow cytometry (nFCM).40–42 TEM has high resolution and can detect real data of single particles, but sample processing before use is complex and the number of tested particles is limited. Moreover, TEM technology cannot characterize particles in liquid environments. DLS cannot obtain the true data of each particle by averaging the overall intensity of scattered light from particles since signals from larger particles will severely shield signals from smaller particles according to the principle of the Rayleigh scattering law. NTA can hardly reveal the full picture of all sizes of EVs since the minimum detectable size is 70–90 nm. The process of NTA is complex and requires calibration before use. nFCM combines Rayleigh scattering and sheath flow single molecule fluorescence detection technology, expanding the application of traditional FCM in nanoparticle detection and achieving the detection of viruses, EVs, etc. within nanoscale size.43 But its detection range is limited to nanoparticles that have a similar refractive index compared with silica nanoparticles.
The resistive pulse sensing (RPS) strategy, also known as Coulter technology, can measure the size and concentration of particles in solution on the basis of single-particle detection.44–46 To further elucidate the RPS technology, the particles driven by a constant current can pass through a pore filled with electrolyte solution in an insulation membrane. Due to the partial exclusion of electrolyte solution in the pore by the particles, the resistance inside the membrane changes, resulting in voltage pulses observed in real-time measurements. The obtained individual voltage pulse includes detailed information such as particle size, concentration, and zeta potential, achieving the single-particle detection of EVs. RPS technology can accurately characterize nanoparticles in various complex environments, regardless of low refractive index, high ion concentration or poor fluidity in liquid environments. In practical applications, most of the measured samples are composed of complex and uneven components. For example, EVs contain multiple complex contents including nucleic acids, proteins, lipids, etc. Traditional methods for characterizing nanoparticles are ensemble-based, which makes it difficult to accurately characterize the composition and proportion of polydispersed nanoparticles such as EVs. RPS technology is less affected by the interaction between the particle and dispersion medium, showing excellent performance for complicated samples and the capability of statistics based on single-particle data.47 Moreover, it is simple and fast for simultaneous size and zeta potential measurements.
Herein, we used human serum as the model system to extract EV samples, and the performance of three commercial isolation kits and ultrafiltration were compared with that of the classical differential UC method. Properties such as size distribution, particle concentration, zeta potential and purity were measured based on the RPS strategy on a NanoCoulter Counter.
2. Materials and methods
2.1 Collection and separation of human blood samples
30 mL peripheral blood was drawn from a healthy volunteer. An informed consent form was acquired from the healthy volunteer. The collection of human blood samples was approved by the Ethics Committee of Jilin University Sino Japanese Friendship Hospital (Permit No. 2024022206). The blood was centrifuged at 3500×g for 10 min. The obtained supernatant (serum) was collected and stored at −80 °C for further use.2.2 Isolation of EVs
EVs were extracted from the obtained serum using 5 methods, including conventional differential ultracentrifugation, ultrafiltration and 3 commercially available EV extraction kits:![[thin space (1/6-em)]](https://www.rsc.org/images/entities/char_2009.gif) 000×g for 30 min at 4 °C. The supernatant was then filtered with a 0.22 μm filter and ultracentrifuged at 100000×g for 2 h at 4 °C in an ultracentrifuge (Beckman Coulter, USA). Afterwards, the supernatant was discarded and the obtained EVs were resuspended in PBS.
000×g for 15 min at 4 °C. Afterwards, the retentate was flushed with PBS followed by a second centrifuge at 12000×g for 10 min at 4 °C. To recover the concentrate, the filter was turned upside down in another microcentrifuge tube and centrifuged at 2000×g centrifuge for 5 min to transfer the concentrated sample from the device to the tube.
000×g for 30 min at 4 °C. The supernatant was then filtered with a 0.22 μm filter and ultracentrifuged at 100000×g for 2 h at 4 °C in an ultracentrifuge (Beckman Coulter, USA). Afterwards, the supernatant was discarded and the obtained EVs were resuspended in PBS.
000×g for 15 min at 4 °C. Afterwards, the retentate was flushed with PBS followed by a second centrifuge at 12000×g for 10 min at 4 °C. To recover the concentrate, the filter was turned upside down in another microcentrifuge tube and centrifuged at 2000×g centrifuge for 5 min to transfer the concentrated sample from the device to the tube.
2.3 RPS measurement
Particle size, particle concentration and zeta potential were detected using the NanoCoulter Counter (Resun Technology, co., Ltd, Shenzhen). There are two electrodes on both sides of the chip pore in the electrolyte solution. When current is applied to pass through the pore, an “electric induction zone” is generated around the pore. As a particle passes through the nanopore filled with electrolyte solution it partially displaces the electrolyte, instantly increasing the electrical resistance of the electric induction zone and generating a pulse signal. The instrument accurately measures and analyzes the pulse signal to obtain multi-dimensional data including particle size, concentration and zeta potential using NanoCoulter software (n = 3).Based on the Coulter principle, the NanoCoulter Counter measures the reduction in ionic current across a pore on a membrane due to the temporary occlusion of the pore as a particle traverses it. The blockade event signal is recorded by the instrument each time a particle traverses the pore, and the magnitude of the measured blockade signal is directly proportional to the volume of the particle, allowing determination of the particle diameter. Size calibrations are performed using a particle suspension of known size as a reference. Bare polystyrene particles (NIST traceable size standards, with certificates) with nominal diameters confirmed by electron microscopy could be purchased from commercial suppliers.
2.4 nFCM analysis
The laser of the instrument was turned on and the pipeline was flushed for 4 min before any operation. After adjusting the instrument status with a quality control ball, the particle size standard and PBS were orderly tested. After that, proper dilutions were conducted for the extracted EV samples (100 μL). The particle and concentration results were calculated using the corresponding software (n = 3).2.5 Western blot analysis
The protein concentrations of the EV samples were determined using a PierceTM BCA Protein Assay Kit (Thermo Scientific 23225). For each sample, 30 μg of protein was loaded onto a 10% polyacrylamide gel for electrophoretic separation on a Trans-Blot Mini-PROTEAN Tetra System (Bio-Rad). Following electrophoresis, the proteins were transferred from the gel onto a polyvinylidene fluoride membrane (PVDF, Millipore). The membrane was then blocked with 5% non-fat dry milk in TBST for 60 min at room temperature and incubated with primary antibodies overnight at 4 °C. Then, the blots were washed five times with TBST and incubated with horseradish peroxidase (HRP)-coupled secondary antibodies (Thermo Fisher) for 1 h at room temperature. The protein signals were detected with a chemiluminescence kit (Thermo Fisher) and imaged using a multifunctional imaging system (Tanon 4600 SF). The primary antibodies used in the study were purchased from Abcam: rabbit polyclonal CD63 antibody (ab68418, dilution ratio: 1:1000), rabbit monoclonal CD81 antibody (ab109201, dilution ratio: 1:500), and mouse monoclonal TSG101 antibody (ab83, dilution ratio: 1:1000).
2.6 Transmission electron microscopy (TEM)
10 μL aliquot of the EV samples prepared by UC, UF, exoEasy, qEV and ExoQuick methods was placed on a carbon-coated grid and dried for 5 min. The samples were negative-stained with 2% phosphotungstic acid for 1 min. Then the samples were imaged with a TEM (Tecnai G2 Spirit BioTwin) operating at 120 kV.2.7 Statistical analysis
The experimental data were shown as mean ± standard deviation (S. D.). The error bars represent the S.D. of three repetitive experiments. The data were analyzed using ORIGIN software (ORIGIN, Massachusetts, USA).3. Results
3.1 Principle of the RPS strategy and composition of the NanoCoulter Counter
The RPS detection platform consists of two parts, namely the AI data processing module and the detection card module. The AI data processing module includes the following parts: power module, AI processing module, signal acquisition module and measurement base (Fig. 1a–d). The power module provides the power of the system, the AI processing module provides data processing functions for software algorithms, the signal acquisition module provides high-speed data sampling and intelligent recognition, and the measurement base is used to insert detection cards. The detection card module is composed of a silicon-based chip and testing components, and the detection card module consists of two detachable chamber structures with a silicon based nanopore chip in the middle of the chamber. One chamber contains electrolyte buffer, and the other chamber contains the sample that is suspended in the buffer. By applying voltage between chambers, ion current flows out of one chamber and enters another chamber through nanopores, forming a circuit structure. When a particle moves across the nanopore which contains an electrolyte solution, it will enter the channel and partially displaces the electrolyte, thus increasing the resistance across the nanopore and reducing the ion current. The signal acquisition module captures a transient change in measured current, generating a resistive pulse. A series of resistive pulses are associated with the particles passing through the nanopore and each individual particle can be measured. The height of the pulse is related to particle size, the width of the pulse is related to zeta potential of the particle and the frequency of the pulse is related to the particle concentration. These data of the nanoparticles are processed using the NanoCoulter software (Fig. 1e and f). | ||
| Fig. 1 Schematic diagram of a NanoCoulter Counter platform and its working principle. (a) The detection card module integrates a silicon based nanopore chip and the measurement slot of a microelectric induction system. (b) Multiple pulse signal curves of the tested sample. (c) Single pulse signal curve of the measured sample. (d) The image of the NanoCoulter Counter instrument. (e) The user interface of the NanoCoulter software. (f) Scatter plot of zeta potential and particle size distribution of the tested sample. | ||
3.2 Particle size and concentration analysis of EV preparations
EVs were separated from the serum using UC, UF and three different commercial kits. The NanoCoulter Counter was used to measure the particle size and concentration based on the RPS strategy. The testing principle is as follows: when the particles in the conductive liquid pass through the nanopore, the difference in conductivity between the particle and the conductive liquid will cause a certain change in the voltage between the electrodes, forming a pulse signal. The amplitude of the pulse corresponds to the volume and size of the particle, and the frequency of the pulse corresponds to the number and concentration of the particles.Prior to starting the measurement, appropriate dilutions were conducted on the EV samples. Fig. 2 and 3 show the particle size distribution and mean/middle sizes of the EV preparation by different isolation methods. According to the results, the EVs extracted from human serum were within the expected size range for exosomes (30–150 nm). No significant differences were found in the mean diameters of EVs prepared by UC (71 nm), UF (71 nm), exoEasy (71 nm) and qEV (67 nm) with relatively narrow size distribution. The middle diameters were 71 nm for UC, 70 nm for UF, 70 nm for exoEasy and 66 nm for qEV, which were consistent with the mean sizes. Compared with the narrow size distributions of the above four methods, the EVs isolated using ExoQuick were characterized by a relatively broader size distribution. The mean size was measured to be 77 nm and the middle size was 75 nm, which was a little larger than that by the other four methods.
 | ||
| Fig. 2 The particle size distribution histograms of the EVs prepared by UC, UF, exoEasy, qEV and ExoQuick methods measured using the NanoCoulter Counter. | ||
 | ||
| Fig. 3 The grain, middle, max and min diameters of the EVs prepared by UC, UF, exoEasy, qEV and ExoQuick methods measured using the NanoCoulter Counter (n = 3). | ||
Next, we evaluated the particle concentration of the EVs prepared by different isolation methods. Since the number and concentration of EVs depended on the amount of starting serum used, statistical analyses were conducted based on their starting serum volumes. The original particle concentrations of the different EV preparations were calculated based on the measured concentration and dilution factor of the sample. Fig. 4 and Table 1 display the particle concentrations of the different samples. The results showed significantly reduced particle yield of UC compared to the other four isolation methods. The particle concentration of EVs isolated by UC was only 7.33 × 10¹⁰ particles per mL. It was worth noting that if there existed a substantial loss of EVs during UC isolation, the particle number of the EV proportion in serum could be severely underestimated. The particle concentration of EVs using exoEasy (9.14 × 10¹⁰ particles per mL) was a little higher than that by UC, while the particle concentrations for EV preparations by the UF method and qEV and ExoQuick were much higher than that by using UC and exoEasy, ranging from 3.72 × 10¹¹ particles per mL for qEV and 8.82 × 10¹¹ for ExoQuick to 2.10 × 10¹² particles per mL for UF. The UF method displayed the highest particle concentration among all the isolation methods, while UC showed the lowest particle concentration. EVs isolated by UC are approximately 28.6-fold, 12.0-fold, 5.1-fold and 1.2-fold lower than those isolated by UF, ExoQuick, qEV and exoEasy methods.
 | ||
| Fig. 4 The particle concentration distribution histograms of the EVs prepared by UC, UF, exoEasy, qEV and ExoQuick methods obtained using the NanoCoulter Counter, respectively. And the line chart depicts the particle concentration per mL of serum. The error bars represent the standard deviation (S. D.) of three repetitive experiments for each isolation method. | ||
| Principle of EV isolation | Method | Abbr | Tested particle concentration (particle per mL) | Initial serum volume (mL) | PBS (mL) | Particle concentration (particle per serum mL) |
|---|---|---|---|---|---|---|
| Sedimentation | Differential ultracentrifugation | UC | 2.93 × 10¹¹ | 1.2 | 0.3 | 7.33 × 10¹⁰ |
| Membrane filtration | Ultrafiltration | UF | 7.58 × 10¹² | 0.9 | 0.25 | 2.10 × 10¹² |
| Membrane affinity | exoEasy | exoEasy | 3.96 × 10¹¹ | 0.65 | 0.15 | 9.14 × 10¹⁰ |
| Size exclusion chromatography | qEV columns | qEV | 8.68 × 10¹¹ | 0.35 | 0.15 | 3.72 × 10¹¹ |
| Polymer precipitation | ExoQuick | ExoQuick | 8.82 × 10¹¹ | 0.5 | 0.5 | 8.82 × 10¹¹ |
We diluted the EV samples into different ratios to detect the testing stability of the particle size and concentration using the NanoCoulter Counter. As shown in Table 2, the different dilution ratios almost had no significant difference in EV diameters and concentrations. This demonstrated that the NanoCoulter Counter was stable in measuring the particle size and concentration of EV samples.
| Principle of EV isolation | Method | Abbr | Dilution factor | Mean diameter (nm) | Middle diameter (nm) | Max diameter (nm) | Min diameter (nm) | Particle concentration (particle per mL) |
|---|---|---|---|---|---|---|---|---|
| Sedimentation | Differential ultracentrifugation | UC | 100 | 71 | 71 | 223 | 55 | 2.93 × 10¹¹ |
| 200 | 74 | 73 | 228 | 56 | 2.93 × 10¹¹ | |||
| Membrane filtration | Ultrafiltration | UF | 500 | 71 | 70 | 229 | 56 | 7.58 × 10¹² |
| 1000 | 70 | 69 | 229 | 56 | 7.54 × 10¹² | |||
| Membrane affinity | exoEasy | exoEasy | 100 | 71 | 70 | 155 | 57 | 3.96 × 10¹¹ |
| 200 | 68 | 67 | 155 | 57 | 3.82 × 10¹¹ | |||
| Size exclusion chromatography | qEV columns | qEV | 200 | 67 | 66 | 188 | 57 | 8.68 × 10¹¹ |
| 400 | 66 | 65 | 224 | 57 | 7.94 × 10¹¹ | |||
| Polymer precipitation | ExoQuick | ExoQuick | 200 | 77 | 75 | 225 | 58 | 8.82 × 10¹¹ |
| 400 | 79 | 79 | 228 | 58 | 9.13 × 10¹¹ |
nFCM is a commonly used method to measure the particle size and concentration of EV preparations. Therefore, we compared the EV sizes and concentrations tested using both the NanoCoulter Counter and nFCM. The results were displayed in Table 3 and Fig. 5. We could conclude that there was no significant difference between the sizes obtained by the two methods, whereas the concentrations of different EVs tested using the NanoCoulter Counter tended to be larger than the results from nFCM.
| Principle of EV isolation | Method | Abbr | Dilution factor | Mean diameter (nm) | Middle diameter (nm) | Particle concentration (particle per mL) |
|---|---|---|---|---|---|---|
| Sedimentation | Differential ultracentrifugation | UC | RPS | 71 | 71 | 2.93 × 10¹¹ |
| nFCM | 73 | 70 | 5.41 × 10¹⁰ | |||
| Membrane filtration | Ultrafiltration | UF | RPS | 71 | 70 | 7.58 × 10¹² |
| nFCM | 72 | 67 | 5.96 × 10¹² | |||
| Membrane affinity | exoEasy | exoEasy | RPS | 71 | 70 | 3.96 × 10¹¹ |
| nFCM | 73 | 67 | 1.62 × 10¹¹ | |||
| Size exclusion chromatography | qEV columns | qEV | RPS | 67 | 66 | 8.68 × 10¹¹ |
| nFCM | 68 | 64 | 1.49 × 10¹¹ | |||
| Polymer precipitation | ExoQuick | ExoQuick | RPS | 77 | 75 | 8.82 × 10¹¹ |
| nFCM | 72 | 68 | 5.11 × 10¹¹ |
 | ||
| Fig. 5 Comparison of mean particle diameters (a) and concentrations (b) of the different EVs tested using the NanoCoulter Counter and nFCM (n = 3). | ||
3.3 Zeta potential measurement of the EVs
The principle of the zeta potential measurement by the RPS strategy is as follows: when a particle flows through a nanopore, the resistance of the pore portion changes due to the exclusion of the solution with the same volume as the particle, resulting in a corresponding voltage pulse. The width of the pulse corresponds to the electrophoretic mobility of the particle and the corresponding zeta potential.The significance of zeta potential lies in its numerical value related to the stability of colloidal dispersion. Zeta potential is the measurement of the strength of mutual repulsion or attraction between particles. It is generally believed that higher the zeta potential (absolute value) of the particles, the more stable the solution system. Particles with lower zeta potential (absolute value) are inclined to condense in solution. It means that the attraction exceeds the repulsive force, and the destroyed dispersion causes condensation in the solution. The commonly used method for measuring zeta potential is mainly the electrophoresis method, which uses Doppler electrophoresis light scattering to measure the zeta potential of nanoparticles. Herein, we also employed the NanoCoulter Counter to detect the zeta potential. As shown in Fig. 6 and Table 4, all the zeta potentials of the different EVs were negative and within the range of −10.18 to −19.68 mV. The zeta potential for ExoQuick was measured to be −10.18, which is the lowest (absolute value) among all the groups. UC displayed a higher absolute zeta potential value (−16.45), while the zeta potential of UF, exoEasy and qEV were the highest (absolute value) and showed no significant difference (UF: −19.26 mV, exoEasy: −19.27 mV, and qEV: −19.68 mV).
 | ||
| Fig. 6 The NanoCoulter Counter was used to measure the zeta potential of the EVs prepared by UC, UF, exoEasy, qEV and ExoQuick methods. | ||
| Principle of EV isolation | Method | Abbr | Average zeta potential (mV) | Zeta std dev | Middle zeta potential (mV) | Zeta potential D90 (mV) | Zeta potential D10 (mV) |
|---|---|---|---|---|---|---|---|
| Sedimentation | Differential ultracentrifugation | UC | −16.45 | 16.68 | −10.87 | −44.33 | −1.28 |
| Membrane filtration | Ultrafiltration | UF | −19.26 | 22.46 | −8.68 | −57.87 | −0.53 |
| Membrane affinity | exoEasy | exoEasy | −19.27 | 16.12 | −13.07 | −41.75 | −5.48 |
| Size exclusion chromatography | qEV columns | qEV | −19.68 | 22.37 | −8.98 | −56.11 | −1.49 |
| Polymer precipitation | ExoQuick | ExoQuick | −10.18 | 12.97 | −5.94 | −20.01 | −3.07 |
3.4 Morphology and protein characterization
According to the results from the NanoCoulter Counter and nFCM, the diameters of the prepared serum EVs were all within the expected range for exosomes (30–150 nm). We further conducted the morphological characterization of the different EV preparations using TEM, which is a well-accepted technique for nanoparticle characterization. Fig. 7 shows the representative TEM images of EVs prepared by different separation methods. Except for the UF separation method, the TEM images of EVs extracted by UC, exoEasy, qEV and ExoQuick methods clearly showed a “cup-shaped” structure. Their size distribution profiles were very similar to the size distribution curve of the identified EVs with the most particles having a diameter less than 80 nm. The dense protein particles were evident in all samples. In particular, the EVs extracted by the UF method showed potential aggregation after freezing. No matter how hard we tried, we could not find the single particle, so the size of the EVs observed from the TEM images was relatively large. Overall, our data from TEM images indicated that the different methods were able to isolate EVs with acceptable quality in terms of size range and morphology. | ||
| Fig. 7 The TEM images of the EVs prepared by UC (a), UF (b), exoEasy (c), qEV (d) and ExoQuick (e) methods (scale bar for a, c, d, e: 100 nm and scale bar for b: 1 μm). | ||
TSG101, CD63 and CD81 have been widely used as classic protein markers for EVs at high concentrations, which demonstrate the high purity of EVs. Fig. 8 shows the protein expressions of TSG101, CD63 and CD81 extracted from serum EVs obtained by five different methods at the same protein concentration. The results showed that EVs isolated by UC, UF, exoEasy and qEV methods all expressed TSG101, CD63 and CD81 proteins with high intensity and high similarity. It was worth noting that the blot in the ExoQuick group was not clear enough, which may be due to the relatively low EV marker protein concentration in this sample.
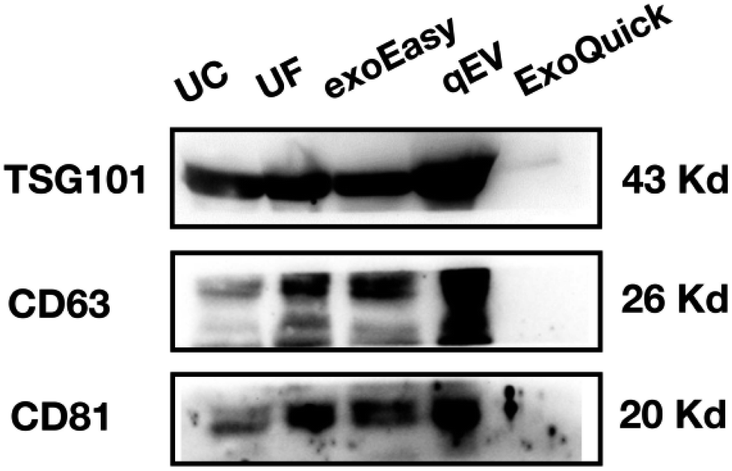 | ||
| Fig. 8 Western blot analysis of TSG101, CD63 and CD81 expression in the EV samples isolated by UC, UF, exoEasy, qEV and ExoQuick methods. | ||
3.5 Purity assessment of EV preparations
EVs derived from blood serum are unavoidably co-isolated with a complex assortment of non-vesicular materials such as protein aggregates and lipoproteins. The ratio of particle number to protein concentration is one of the methods for the evaluation of EV purity. The more particles per mg of protein, the higher the purity of the EVs. Therefore, we measured the particle number using the NanoCoulter Counter and protein concentration (BCA kit) of EVs obtained from different purification methods. The particle/protein of EVs showed that the purity of the EVs isolated by UC (7.88 × 10¹¹) was the highest (Table 5). The purity of EVs isolated by qEV was little lower than that by UC with a particle/protein of 1.16 × 10¹¹. However, the purities by UF (particle/protein of 8.86 × 10¹⁰), exoEasy (particle/protein of 5.58 × 10¹⁰) and ExoQuick (particle/protein of 3.83 × 10¹⁰) were much lower compared with UC and qEV.| Principle of EV isolation | Method | Abbr | Particle concentration (particle per mL) | Protein concentration (mg mL−1) | Particle/protein |
|---|---|---|---|---|---|
| Sedimentation | Differential ultracentrifugation | UC | 7.33 × 10¹⁰ | 0.093 | 7.88 × 10¹¹ |
| Membrane filtration | Ultrafiltration | UF | 2.10 × 10¹² | 23.7 | 8.86 × 10¹⁰ |
| Membrane affinity | exoEasy | exoEasy | 9.14 × 10¹⁰ | 1.64 | 5.58 × 10¹⁰ |
| Size exclusion chromatography | qEV columns | qEV | 3.72 × 10¹¹ | 3.2 | 1.16 × 10¹¹ |
| Polymer precipitation | ExoQuick | ExoQuick | 8.82 × 10¹¹ | 2.3 | 3.83 × 10¹⁰ |
4. Conclusions
In summary, we prepared EVs from serum using UC, UF, exoEasy, qEV, and ExoQuick methods. The diameter, concentration, and zeta potential of the EVs were characterized using a NanoCoulter Counter, demonstrating their purity and preparation efficiency. Our research indicates that the NanoCoulter Counter, based on the RPS strategy, provides reliable and effective data for EV characterization. The results further show that the EVs separated by the UC method exhibit high performance and purity. Our work holds promising potential for applications in the field of EV-based diagnostics.Data availability
This manuscript does not involve the use of any external databases or datasets. All data generated or analyzed during this study are included in this published article.Conflicts of interest
There are no conflicts to declare.Acknowledgements
This work was funded by the Jilin Province Science and Technology Development Plan Project (YDZJ202201ZYTS443 and 20210202030NC). We thank Resun Technology, Co., Ltd, Shenzhen, for their technical support and valuable help at sample testing using the NanoCoulter Counter.References
- Q. Wu, S. Fu, H. Xiao, J. Du, F. Cheng, S. Wan, H. Zhu, D. Li, F. Peng, X. Ding and L. Wang, Adv. Sci., 2023, 10, e2204814 CrossRef PubMed.
- X. Zhang, H. Cui, W. Zhang, Z. Li and J. Gao, Bioact. Mater., 2023, 22, 491–517 CAS.
- J. Zhao, Y. Zhu, Z. Li, J. Liang, Y. Zhang, S. Zhou, Y. Zhang, Z. Fan, Y. Shen, Y. Liu, F. Zhang, S. Shen, G. Xu, L. Wang, Y. Lv, S. Zhang and X. Zou, Biomater. Sci., 2022, 10, 6614–6626 RSC.
- S. Gurunathan, M. H. Kang and J. H. Kim, Int. J. Nanomed., 2021, 16, 1281–1312 CrossRef PubMed.
- R. Kalluri and V. S. LeBleu, Science, 2020, 367, 6478 CrossRef PubMed.
- S. Elliot, P. Catanuto, S. Pereira-Simon, X. Xia, S. Shahzeidi, E. Roberts, J. Ludlow, S. Hamdan, S. Daunert, J. Parra, R. Stone, I. Pastar, M. Tomic-Canic and M. K. Glassberg, eLife, 2022, 11, e79543 CrossRef CAS PubMed.
- M. Fernandes, I. Lopes, J. Teixeira, C. Botelho and A. C. Gomes, Curr. Med. Chem., 2020, 27, 3888–3905 CrossRef CAS PubMed.
- L. Wang, M. Chopp, A. Szalad, X. Lu, Y. Zhang, X. Wang, P. Cepparulo, M. Lu, C. Li and Z. G. Zhang, Diabetes, 2020, 69, 749–759 CrossRef CAS PubMed.
- Y. Sun, H. Shi, S. Yin, C. Ji, X. Zhang, B. Zhang, P. Wu, Y. Shi, F. Mao, Y. Yan, W. Xu and H. Qian, ACS Nano, 2018, 12, 7613–7628 CrossRef CAS PubMed.
- B. C. Melnik, Int. J. Mol. Sci., 2021, 22, 1059 CrossRef CAS PubMed.
- M. Yang, X. Wang, F. Pu, Y. Liu, J. Guo, S. Chang, G. Sun and Y. Peng, Pharmaceutics, 2021, 13, 1593 CrossRef CAS PubMed.
- Z. Wei, X. Zhang, Z. Zhang, T. Yong, G. Zhan, W. Lv, Z. Ding, K. Sun, X. Yang and L. Gan, Chem. Eng. J., 2022, 433, 133847 CrossRef CAS.
- T. Cui, Y. Zhang, G. Qin, Y. Wei, J. Yang, Y. Huang, J. Ren and X. Qu, Nat. Commun., 2023, 14, 1974 CrossRef CAS PubMed.
- K. S. Kim, S. Lee, K. Na and Y. H. Bae, Adv. Healthcare Mater., 2022, 11, 2200909 CrossRef CAS PubMed.
- L. Zhu, S. Kalimuthu, P. Gangadaran, J. M. Oh, H. W. Lee, S. H. Baek, S. Y. Jeong, S. Lee, J. Lee and B. Ahn, Theranostics, 2017, 7, 2732–2745 CrossRef CAS PubMed.
- C. Thery, K. W. Witwer, E. Aikawa, M. J. Alcaraz, J. D. Anderson, R. Andriantsitohaina, A. Antoniou, A. M. Zivkovic, D. Zocco and E. K. Zuba-Surma, J. Extracell. Vesicles, 2018, 7, 1535750 CrossRef PubMed.
- C. Coughlan, K. D. Bruce, O. Burgy, T. D. Boyd, C. R. Michel, J. E. Garcia-Perez, V. Adame, P. Anton, B. M. Bettcher, H. J. Chial, M. Konigshoff, E. Hsieh, M. Graner and H. Potter, Curr. Protoc. Cell Biol., 2020, 88, e110 CrossRef CAS PubMed.
- J. A. Welsh, G. Arkesteijn, M. Bremer, M. Cimorelli, F. Dignat-George, B. Giebel, A. Gorgens, A. Hendrix, M. Kuiper, R. Lacroix, J. Lannigan, T. G. van Leeuwen, E. Lozano-Andres, S. Rao, S. Robert, L. de Rond, V. A. Tang, T. Tertel, X. Yan, M. Wauben, J. P. Nolan, J. C. Jones, R. Nieuwland and E. van der Pol, J. Extracell. Vesicles, 2023, 12, e12299 CrossRef CAS PubMed.
- M. Ding, C. Wang, X. Lu, C. Zhang, Z. Zhou, X. Chen, C. Zhang, K. Zen and C. Zhang, Anal. Bioanal. Chem., 2018, 410, 3805–3814 CrossRef CAS PubMed.
- R. Stranska, L. Gysbrechts, J. Wouters, P. Vermeersch, K. Bloch, D. Dierickx, G. Andrei and R. Snoeck, J. Transl. Med., 2018, 16, 1 CrossRef CAS PubMed.
- T. Soares Martins, J. Catita, I. Martins Rosa, O. A. B. Da Cruz E Silva and A. G. Henriques, PLoS One, 2018, 13, e198820 CrossRef PubMed.
- L. M. Doyle and M. Z. Wang, Cells, 2019, 8, 727 CrossRef CAS PubMed.
- Y. Wang, Y. Zhang, Z. Li, S. Wei, X. Chi, X. Yan, H. Lv, L. Zhao and L. Zhao, Proteomics, 2023, 23, e2200364 CrossRef PubMed.
- J. H. Jung, W. Back, J. Yoon, H. Han, K. W. Kang, B. Choi, H. Jeong, J. Park, H. Shin, W. Hur, Y. Choi, S. Hong, H. K. Kim, Y. Park and J. H. Park, Sci. Rep., 2021, 11, 217 CrossRef CAS PubMed.
- A. N. Boing, E. van der Pol, A. E. Grootemaat, F. A. Coumans, A. Sturk and R. Nieuwland, J. Extracell. Vesicles, 2014, 3, 3402 Search PubMed.
- M. A. Rider, S. N. Hurwitz and D. J. Meckes, Sci. Rep., 2016, 6, 23978 CrossRef CAS PubMed.
- W. Nakai, T. Yoshida, D. Diez, Y. Miyatake, T. Nishibu, N. Imawaka, K. Naruse, Y. Sadamura and R. Hanayama, Sci. Rep., 2016, 6, 33935 CrossRef CAS PubMed.
- R. J. Lobb, M. Becker, S. W. Wen, C. S. Wong, A. P. Wiegmans, A. Leimgruber and A. Moller, J. Extracell. Vesicles, 2015, 4, 27031 CrossRef PubMed.
- J. Lim, M. Choi, H. Lee, J. Y. Han and Y. Cho, Front. Chem., 2018, 6, 664 CrossRef CAS PubMed.
- P. Li, M. Kaslan, S. H. Lee, J. Yao and Z. Gao, Theranostics, 2017, 7, 789–804 CrossRef CAS PubMed.
- B. W. Sodar, A. Kittel, K. Paloczi, K. V. Vukman, X. Osteikoetxea, K. Szabo-Taylor, A. Nemeth, B. Sperlagh, T. Baranyai, Z. Giricz, Z. Wiener, L. Turiak, L. Drahos, E. Pallinger, K. Vekey, P. Ferdinandy, A. Falus and E. I. Buzas, Sci. Rep., 2016, 6, 24316 CrossRef CAS PubMed.
- P. Tizro, C. Choi and N. Khanlou, Methods Mol. Biol., 2019, 1897, 417–424 CrossRef CAS PubMed.
- R. Kiyama, M. Yoshida, T. Nonoyama, T. Sedlacik, H. Jinnai, T. Kurokawa, T. Nakajima and J. P. Gong, Adv. Mater., 2023, 35, e2208902 CrossRef PubMed.
- K. Ashizawa, Yakugaku Zasshi, 2019, 139, 237–248 CrossRef CAS PubMed.
- S. Harvey, J. Austin, D. Bancarz and A. Malm, MethodsX, 2023, 10, 102142 CrossRef CAS PubMed.
- S. Bhattacharjee, J. Controlled Release, 2016, 235, 337–351 CrossRef CAS PubMed.
- M. N. Longjohn and S. L. Christian, Methods Mol. Biol., 2022, 2508, 353–373 CrossRef PubMed.
- D. Bachurski, M. Schuldner, P. H. Nguyen, A. Malz, K. S. Reiners, P. C. Grenzi, F. Babatz, A. C. Schauss, H. P. Hansen, M. Hallek and V. S. E. Pogge, J. Extracell. Vesicles, 2019, 8, 1596016 CrossRef CAS PubMed.
- E. van der Pol, F. A. Coumans, A. E. Grootemaat, C. Gardiner, I. L. Sargent, P. Harrison, A. Sturk, T. G. van Leeuwen and R. Nieuwland, J. Thromb. Haemostasis, 2014, 12, 1182–1192 CrossRef CAS PubMed.
- L. Li, S. Wang, J. Xue, Y. Lin, L. Su, C. Xue, C. Mao, N. Cai, Y. Tian, S. Zhu, L. Wu and X. Yan, Anal. Chem., 2023, 95, 3423–3433 CrossRef CAS PubMed.
- C. Chen, N. Cai, Q. Niu, Y. Tian, Y. Hu and X. Yan, J. Extracell. Vesicles, 2023, 12, e12351 CrossRef PubMed.
- R. Lees, R. Tempest, A. Law, D. Aubert, O. G. Davies, S. Williams, N. Peake and B. Peacock, J. Visualized Exp., 2022, 185 Search PubMed.
- S. He, X. Hong, M. Zhang, L. Wu and X. Yan, Anal. Chem., 2020, 92, 2393–2400 CrossRef CAS PubMed.
- R. W. DeBlois and R. K. Wesley, J. Virol., 1977, 23, 227–233 CrossRef CAS PubMed.
- C. Li and W. Chu, Front. Biosci.-Landmark, 2016, 21, 455 CrossRef PubMed.
- M. Durak-Kozica, A. Wróbel, M. Platt and E. Ł. Stępień, Bio. Algorithm Med. Syst., 2022, 18(1), 171–179 CrossRef.
- K. Liu, C. Pan, A. Kuhn, A. P. Nievergelt, G. E. Fantner, O. Milenkovic and A. Radenovic, Nat. Commun., 2019, 10, 3 CrossRef CAS PubMed.
| This journal is © The Royal Society of Chemistry 2024 |