DOI:
10.1039/D4AY00991F
(Paper)
Anal. Methods, 2024,
16, 5571-5583
Comparison of test strip, conductivity, and novel smartphone digital image colorimetry methods for field assessment of soil chloride and salinity†‡
Received
27th May 2024
, Accepted 23rd July 2024
First published on 24th July 2024
Abstract
Understanding the extent of salt-affected soils is important in agriculture for irrigation, crop selection and land management, and affordable smartphone-based techniques can broaden access to environmental analysis in resource-limited settings. A novel smartphone-based Digital Image Colorimetry (DImC) technique using colorimetric chloride test strips has been developed and compared to 3 other field techniques (direct soil conductivity (Csoil), soil extract solution conductivity (Cext), titration test strips (TS)) and 1 lab-based method (chloride analyser (CA)) for the assessment of soil salinity. A survey of soils from a coastal saltmarsh and neighbouring farmland was conducted in Southwest Scotland and a rapid sample preparation method suitable for in-field use was evaluated. Comparison of each method with the reference method (CA) using correlation plots, Bland–Altman plots, and concordance correlation coefficients, showed that the accuracy and precision of the methods decreased in the order Cext > DImC ≃ TS > Csoil. The novel DImC method had good accuracy, although the limit of detection (LOD = 20.30 mg L−1) and precision was poorer than Cext. The analysis of field-wet soils enabled a rapid estimate of soil Cl− in approximately 6 minutes and spatially interpolated maps of soil Cl− concentration, prepared using smartphone location data, identified areas of elevated soil salinity. Each field analysis method had specific benefits, and the low cost, portability and lack of specialist equipment required for the DImC method demonstrated suitability for use in agriculture, citizen science or conservation settings where resources may be limited. The example presented demonstrates how smartphones may be used to broaden access to environmental analysis techniques.
1 Introduction
Soil degradation is an issue which has wide-ranging impacts on environmental sustainability and global food security.1 Salinisation of soils is a mechanism of degradation which affects over one billion hectares of land globally2,3 and which is predicted to increase in future due to human activities and climate change.4,5 Salt affected soils have been identified in over 100 countries worldwide spanning all continents.6,7 The majority of salt-affected soils are influenced by primary salinisation processes, such as rising groundwater and coastal intrusion of seawater.2,8 However, human actions also make a significant contribution to salinisation of soils, for example through the use of salt-rich groundwater for crop irrigation which can allow salts to become concentrated in soils,9,10 or the use of reservoir water for irrigation which may cause an increase in groundwater level allowing the upward intrusion of salt-rich water into soils.11 Human-induced climate change is also a significant driver of soil salinisation, due to factors including increased sea level intrusion and decreased precipitation in arid areas.12 These factors are contributing to an overall increase of salt-affected soils globally, which are estimated to be expanding at a rate of ∼2 Mha per year9 with coastal and arid regions particularly affected.
Soil salinity can have negative impacts on agriculture, with decreased plant growth, decreased crop yield and even crop failure.10 This in turn has been seen to drive migration and displacement of people from impacted agricultural areas.13 It is therefore crucial that farmers and landowners are able to apply practices to mitigate the impacts of soil salinisation. These mitigation practices often rely on improved irrigation methods which can leach salt from the soils or aim to limit the accumulation of salt from irrigation in soils.2 “Precision agriculture” methods can help farmers to make effective land management decisions by applying targeted and data-driven actions.14–16 These methods rely on sensors to make localised measurements of soil quality parameters such as moisture content, conductivity and pH, but often require extensive networks of sensors, specialist installation, regular maintenance or specific expertise to apply effectively, all of which may make precision agriculture prohibitively expensive for some potential users. Smartphones have been identified as a useful tool to broaden the availability of precision agriculture methods thanks to their versatility, common usage and continuing improvement. For these reasons, smartphone applications have been introduced into many areas of agriculture including crop estimation, crop health, water management, and calculation of fertilizer requirement.17 These applications often make use of specific parts of smartphone capability such as GPS location, camera image capture and internet connectivity. Smartphones have also been applied in the analysis of soil chemical parameters such as nitrate content,18,19 soil colour, pH and organic matter content.20,21
Chemical analysis techniques using smartphones often use a technique sometimes referred to as Digital Image Colorimetry (DImC),22 in which digital cameras, smartphone digital cameras or desktop computer scanners are used as sensors to replace potentially expensive analytical instrumentation or potentially unreliable visual colorimetric techniques in detecting the intensity of colours formed during colorimetric reactions.23–26 We use the abbreviation “DImC” for Digital Image Colorimetry to limit confusion with the abbreviation commonly used in Environmental Science for Dissolved Inorganic Carbon, DIC. The widespread accessibility of good quality digital cameras in smartphones means that DImC methods can be highly portable, relatively low-cost and the techniques can often be applied in the field for fast analysis and results.27,28 However, the sensitivity and reproducibility of the methods is highly dependent on the type of camera used, variable light sources and inconsistent distance between camera and sample. dos Santos Benedetti et al. (2015) demonstrated that the choice of camera used for DImC methods can impact the quality of data acquired, as cameras with higher resolution tend to show improved precision and sensitivity compared to cameras with lower resolution. However, the authors also note that this effect can be overcome by increasing the area of the digital image sampled to increase the number of pixels included in the analysis, thereby making lower-precision cameras (such as those found in smartphones) suitable for DImC methods.29 Variations in lighting during the data collection stage of DImC can have a significant impact on method sensitivity, precision and reproducibility, and different solutions have been employed to control lighting during image collection, for example through the use of custom-made sample chambers and enclosures. Examples include devices which may utilise 3D-printed components and carefully controlled lighting using LEDs.24,27,29–32 Such devices benefit from improved reproducibility of image collection conditions, but may require specialist or bespoke components and fabrication. Other researchers have demonstrated the application of low-cost sample chambers made from repurposed or recycled materials.26,33–35 These examples have the benefit of low manufacturing cost and simple preparation, which are useful properties in resource-limited settings. The flash of the smartphone has been recognised as useful for illumination during image capture, and diffusing the light source through a semi-transparent material to change the angle or intensity of the incident light can reduce over-exposure or reflections in captured images.35–38 It is also beneficial to maintain camera settings for uniform image collection to minimise variations due to automatic camera settings.39,40 Even with steps in place to control conditions during image acquisition, variations in image quality are still possible. Processing of digital images using correction algorithms41 and using coloured or grayscale calibration cards24,39,42,43 can minimise the impact of variations in lighting conditions on the acquired data. For example, Azhar et al. (2023) demonstrated the benefit of using a colour calibration card for image analysis of urine samples, which enabled an improvement of the intra- and inter-phone agreement of measured B and G pixel intensity from “poor” to “exceptional”,42 and Aitkenhead et al. (2016), used a grayscale calibration card to calculate the ratio between measured and expected intensity values on the calibration card which could then be applied to correct the measured sample RGB data in bands of 16 intensity units from 0–255.43 The versatility of DImC methods have led to their application in the analysis of soil quality, such as organic matter content, pH and soil structure, quantification of contaminants such as arsenic, and quantification of nutrients, such as nitrate.18,19,21,43–46
We present a novel smartphone-based Digital Image Colorimetry (DImC) technique using commercially available chloride test strips and a simple enclosure made using a recycled food container, for measurement of soil chloride (Cl−) as a proxy for salinity. The method is compared with 3 other field methods and one lab-based method to investigate the extent of soil salinity in a coastal region of Southwest Scotland. The aims of the investigation were: (1) develop and apply a novel DImC approach for low-cost quantification of Cl− in soil and evaluate its accuracy and precision, (2) compare the novel method with other field methods for evaluating soil salinity, (3) compare the analysis of field-wet and dried soils for potential in-field application of the novel method.
The novel DImC method highlights the potential for simple, smartphone-based methods to make robust, low-cost analysis techniques available to a broad range of users and exemplifies the applicability of smartphones in precision agriculture.
2 Materials and methods
2.1 Sample site and sampling design
The sample site investigated was the RSPB Mersehead nature reserve, Southwest Scotland. This ∼7 km2 site was chosen due to its proximity to the coast, use as an active farm (sheep and beef cattle), and variety of land-use and habitat types present. The Western part of the site contains an area of saltmarsh known as the Southwick Merse, while the Southern extent of the site is bordered by a belt of sand dunes ∼50 m wide which separates agricultural land from the coastal beach. Other habitats present include wetland, deciduous woodland, improved grassland, and semi-improved grassland. Soil salinity analysis and mapping methods were employed to determine the extent of the salt affected soils around the western part of the site and to investigate variation in soil salinity across the whole site.
Sample locations were selected using a stratified random approach with a greater density of points allocated to the western edge of the census area to account for higher variability in soil salinity (Fig. 1). A combination auger was used to extract soil samples to a depth of ∼20 cm, vegetation was discarded and the sample placed in a polyethylene bag.
 |
| | Fig. 1 Soil sample locations at RSPB Mersehead nature reserve. | |
The sample plan, prepared using QGIS, was uploaded to smartphone app (Mergin Maps), and sampling points in the field were identified using the smartphone's built-in GPS functionality. As well as collection of samples for analysis in the lab, in situ measurements of soil conductivity, moisture content and temperature were made using a portable soil sensor (HydraGO, Stevens) with data collected stored using the HydraGO smartphone app.
2.2 Analysis of chemical and physical soil parameters
Soil texture was estimated by hand using the method of Sinclair et al., (2014)47 using field-wet soils. Soil samples were dried to a constant weight in an oven (OP250, LTE) at 40 °C. Dried samples were disaggregated using a mortar and pestle and sieved (2 mm) for further analysis. Soil pH was measured in a 1![[thin space (1/6-em)]](https://www.rsc.org/images/entities/char_2009.gif) :5 ratio (w/v) solution of soil to DI water using a bench-top pH meter (SevenCompact, Mettler Toledo).
:5 ratio (w/v) solution of soil to DI water using a bench-top pH meter (SevenCompact, Mettler Toledo).
Soil Cl− was evaluated in soil extracts using 4 analytical methods: A bench-top chloride analyser (MkII Chloride analyser, Sherwood. Abbreviated as “CA”), DImC with test strips (Section 2.3), titration test strips (Quantab, Hach. Abbreviated as “TS”), and conductivity (HI98129, Hanna Instruments. Abbreviated as “Cext”). In addition to the methods analysing soil extracts, a direct soil conductivity instrument (HydraGo, Stevens. Abbreviated as Csoil) was used to evaluate the conductivity of field-wet soils measured in situ (Table 1). Soil extracts for analysis by CA, Cext, TS and DImC were prepared using both field-wet and air-dried soil samples. For the dried soil extraction, a 1:5 ratio (w/v) of dried soil to distilled (DI) water (conductivity <1 μSiemen cm−1) water was prepared by accurately weighing ∼4.00 g of soil into a 50 ml centrifuge tube and adding 20 ml of DI water. The sample tubes were shaken on an end-over-end shaker (VWR) for 1 hour, centrifuged at 4000 rpm (TMT-2400XC-50, OCS.tec) for 5 minutes and filtered (qualitative filter paper 413, VWR), with the filtrate used for further analysis. A faster preparation method using field-wet soils was also tested. This faster method used a shorter extraction time and excluded the soil preparation and extract filtration steps. A level 4 ml measuring spoon of field-wet soil was added to 50 ml pre-weighed centrifuge tubes. The mass of wet soil added was weighed for comparison with the dried-soil experiments (however this weighing stage is optional for faster in-field application). 20 ml of DI water was added to the tube for a soil:extractant ratio of 1:5 (v/v). The tubes were shaken by hand for 2 minutes then left to settle for three minutes, after which the supernatant liquid was decanted into a clean glass beaker for analysis.
Table 1 Summary of analysis methods used for quantification of soil salinity
| Analysis method |
Acronym |
Description |
Instrument |
| Chloride analyser |
CA |
Chloride in extracted soil solution analysed with lab chloride analyser (reference method) |
MkII Chloride Anlayser 926, Sherwood |
| Soil extract conductivity |
C
ext
|
Extracted soil solution analysed with portable conductivity meter |
HI98129, Hanna Instruments |
| Direct soil conductivity |
C
soil
|
Measurements made in situ using portable soil conductivity and moisture probe |
HydraGO, Stevens |
| Titration test strips |
TS |
Chloride in extracted soil solution analysed with test strips with a range of 30–600 mg L−1 |
Quantab, Hach |
| Digital image colorimetry |
DImC |
Chloride in extracted soil solution analysed by measurement of RGB pixels in digital image of colorimetric test strip |
Chloride Check test strips, ITS Europe and smartphone digital camera, Samsung Galaxy A20e |
The soil extracts from both field-wet and dried soils were used for Cl− analysis by the methods introduced above and summarised in Table 1. The CA method was chosen as the reference method for comparison. Limits of detection (LOD) and quantification (LOQ) were calculated from the analysis of blank solutions (DI, 0 mg L−1 Cl−). The LOD was calculated using the formula given in eqn (1) and LOQ was calculated using the formula in eqn (2), where ![[x with combining macron]](https://www.rsc.org/images/entities/i_char_0078_0304.gif) = mean of >10 analytical replicates of the blank solution and σ = the standard deviation of the same samples.
= mean of >10 analytical replicates of the blank solution and σ = the standard deviation of the same samples.
| | | LOD (mg L−1) = + 3σ | (1) |
| | | LOQ (mg L−1) = + 10σ | (2) |
2.3 Digital image colorimetry (DImC) method
The DImC method used semi-quantitative colorimetric chloride test strips (WaterWorks Chloride Check, ITS Europe) to react with Cl− in the soil extracts, forming an increasingly pale purple colour with increasing concentration (Fig. 2b and c). Test strips were dipped in the soil extract solution for 10 seconds, then were left for 30 seconds for colour to develop, as directed by the test-strip instructions. The digital camera of a mid-range smartphone (Samsung Galaxy A20e) was used to photograph the colour developed after reaction with the sample. The smartphone camera had a resolution of 13 megapixels, and aperture of f/1.9. Camera settings were fixed so that images were reproducible and comparable, (ISO = 200, white balance = 4000, and brightness = +0.5). In order for lighting conditions, distance from the camera to the test strip (11 cm) and picture background (plastic laminated white paper) to be consistent, the smartphone was set upon an opaque white plastic container with a small hole cut through for the camera (Fig. 2a). The flash of the phone camera was switched on and the flash diffused through the white plastic of the box to decrease glare and reflections in the photographs. To further limit the impact of lighting variation between pictures, a printed and laminated grayscale calibration card with four rectangles of increasing grayscale intensity (RGB intensity of [50,50,50], [100,100,100], [150,150,150] and [200,200,200]) similar to that reported by Aitkenhead et al., 2016,43 was photographed alongside the test strip (Fig. 2b and c).
 |
| | Fig. 2 (a) How the smartphone, colorimetric test strip, calibration card and sample enclosure are used to obtain image data for DImC. (b) Example image of test strip after reaction with a 0 mg L−1 Cl− solution, with yellow boxes showing the regions of interest (RoI) on the test strip and calibration card analysed during the data analysis procedure. (c) Example image of test strip after reaction with a 100 mg L−1 Cl− solution. | |
2.4 DImC image analysis
Digital images of test strips were analysed using the Fiji distribution of the open source image analysis software, ImageJ.48 The RGB composition of the sections of each picture with the coloured end of the test strips and the 4 rectangular areas of varying grayscale colour were analysed (Fig. 2b). Each picture therefore generated 5 sets of RGB values, one for each of the grayscale calibration card areas and one for the coloured sample. The area sampled in the image of the test strip was ∼40–50000 pixels, while the area of each of the segments of the grayscale calibration card sampled were ∼100000 pixels, as measured using the ImageJ “area” function. Different RGB calibration options were explored for quantifying Cl−, including using the intensity of the R, G and B values individually, R/G, R/B, B/G and grayscale and it was found that the mean value of the intensity of green pixels (G) increased linearly with Cl− concentration between 0 and 160 mg L−1 Cl− (Fig. 3.) The images and the uncorrected and corrected G pixel intensity data used for the calibration graph in Fig. 3 are presented in Fig. S3 and Table S1.‡
 |
| | Fig. 3 Linear relationship between the intensity of the green (G) pixel in digital images of test strips and Cl− concentration in calibration standards. Black crosses show the uncorrected G pixel data, and green squares show the data corrected using the grayscale card. The RoI of the uncorrected test strip images for each standard concentration are presented above the graph, with the full images presented in Fig S3.‡ | |
2.4.1 Image correction using the grayscale calibration card.
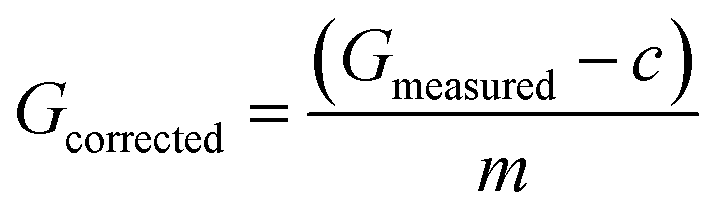
The printed grayscale calibration card photographed alongside each sample test strip (Fig. 2) was used to calibrate the G pixel data retrieved from each image in order to correct for lighting or photograph artefacts. This was achieved using a linear regression model of the measured mean G intensity of each section of the grayscale card against its printed value (50, 100, 150, 200). The linear regression model generated for each photograph was then used to correct the measured G value from the image of the sample test strip using eqn (3), in which c = y intercept and m = slope of the linear regression model.| |  | (3) |
The corrected G values were found to improve the precision and accuracy of the DImC measurement, for example the R2 of the Cl− calibration line increased from 0.979 to >0.996 (as shown in Fig. 3), the slope increased from ∼0.4 to ∼0.65, and the relative standard deviation of replicate sample measurements and LOD were improved.
2.5 Calibration and method validation
Calibration standards were prepared from solid NaCl (Normapure, VWR) which was dried in an oven at 105 °C (OP250, LTE) and stored in a desiccator before being precisely weighed to 4 decimal places (AG204, Mettler Toledo). Calibration standards (used for all the analysis methods reported) were prepared by serial dilution in DI water at a concentration range from 0–2000 mg L−1. Calibration graphs for all methods other than DImC (which is shown in Fig. 3) are shown in ESI Fig. S1 and S2.‡ The colorimetric test strips used in the DImC analysis have a reported semi-quantitative working range of 0–500 mg L−1 Cl−. Two methods of calibrating the DImC method were tested. The first used an image of the coloured calibration card provided with the test strips by the manufacturer. The second method used a series of Cl− standards from 0–500 mg L−1 with the linear calibration range found to be 0–160 mg L−1. The calibration made using the image of the manufacturer-provided calibration card had fewer points (0, 50, 100, 250 and 500 mg L−1) and lower R2 than that using standard solutions, and therefore subsequent calculations used the calibration made with standard solutions. To validate the DImC method, six replicates of a Certified Reference Material (CRM) (Anions in Soil, Sigma-Aldrich) was analysed. The CRM was extracted for one hour on an end-over-end shaker with a 1:5 ratio (w/v) of soil to deionized water, centrifuged for five minutes then filtered. The results of CRM analysis by Cext, TS, CA and DImC were compared with the certified Cl− concentration of 497 ± 15 mg L−1. In addition, a Cl− standard solution (1000 mg L−1 Cl− in water, Sigma-Aldrich) was used to prepare independent check solutions of 100 mg L−1 which were measured at regular intervals throughout the sample analysis.
2.6 Statistical analysis
Summary statistics for the results of all methods were calculated using R49 and RStudio (version 2023.03.1+446). Comparisons were made between each field method and the CA method for both field-wet and dried soils. Visual evaluations were made with scatter plots. A high number of results (>60%) from some of the methods tested were below the method LOD, therefore the non-parametric Spearman's rank correlation was applied to compare field methods with the CA, with values below LOD replaced with the LOD, as described by Helsel (2011).50 Bland–Altman (B–A) plots were used for further visual evaluation of the deviation of the methods tested from the reference CA method. B-A plots show the paired means of the results from a test and reference method on the x-axis plotted against the paired differences for each method on the y-axis. Values of difference between methods clustered tightly around 0 indicates excellent agreement between the test and reference methods, while a greater spread of values around 0 indicates greater variability between the methods. Distribution of points above or below 0 can indicate a bias in the test method compared to the reference method.18,51,52 Lin's Concordance Correlation Coefficients (CCC)52,53 were calculated using the epiR package54 in R for a detailed evaluation and comparison of the field methods with CA. CCC analysis generates a single value (rc) which captures both accuracy and precision of a method compared to a reference method. Precision of the new method compared to the reference method is shown by the Pearson correlation coefficient (r), and the accuracy of the new method is captured by the bias correction factor (Cb). The scale shift (ν) and location shift (μ) describe the deviation of the new method from the reference method.52,53
2.7 Spatial analysis
Empirical Bayesian Kriging (EBK) was performed to interpolate soil variables across the nature reserve using a “leaving-one-out” cross-validation approach. Where required, data were transformed to approximate a local Gaussian with a normal score process and prediction errors evaluated to maximise interpolation accuracy. Geostatistical analysis and mapping was undertaken using ArcGIS Pro 3.1 software (Copyright © 2023, ESRI Inc.) and QGIS 3.28.55
3 Results
3.1 Certified reference material and quality control standards
The results of analysis of six replicates of the Anions in Soil certified reference material (CRM) (Sigma-Aldrich) showed some variability in terms of precision and accuracy of the methods used (Table 2). CA showed very good accuracy, with the mean measurement of 510.2 mg kg−1 being 2.65% higher than the certified value of 497 mg kg−1, which is within error of the certified value. The precision of CA was excellent, with a relative standard deviation (RSD) of 1.6%, and a standard deviation >5 times less than the CRM informational value. The results of analysis by TS gave a mean which was slightly higher than the certified value, at 529.5 mg kg−1, but within the range of the stated informational values. The precision of TS was very good, with an RSD of 4.97%. Cext led to a large overestimation of Cl− concentration due to the significant concentrations of other ions within the CRM influencing conductivity, however the measurement precision of 2.01% was excellent. Finally, the accuracy of analysis by the novel DImC method was excellent, with a mean of 494.4 mg kg−1, within 1% of the certified value. However, the precision of the DImC method was not as good as the other methods, with an RSD of 11.39%. Based on the accuracy and precision of analysis of the CRM, all the methods used showed good potential for the analysis of Cl− in soils, therefore the methods were next used for the analysis of soil samples from the Mershead nature reserve. Blank (0 mg L−1) and 100 mg L−1 Cl− quality control standards were routinely analysed along with soil sample extracts. The results of the analysis of blank solutions were used to calculate limits of detection (LOD) and quantification (LOQ) for each method, while the analysis of the 100 mg L−1 standard was used as an additional check on method accuracy and precision, to complement the analysis of the CRM. The results of the analysis of the quality control standards are presented in Table 3.
Table 2 Results of analysis of certified reference material (CRM) by each method showing the mean Cl− concentration of 6 replicates, standard deviation, relative standard deviation (RSD%), 95% confidence interval (CI) and percentage recoverya
| Method |
Mean (mg kg−1) |
Standard deviation (mg kg−1) |
RSD (%) |
95% CI (mg kg−1) |
Recovery (%) |
|
CA = Chloride analyser, TS = titration strips, Cext = conductivity of soil extract, DImC = Digital Image colorimetry.
|
| CA |
510.2 |
8.2 |
1.61 |
8.64 |
102.65 |
| TS |
529.5 |
26.3 |
4.97 |
27.64 |
106.54 |
|
C
ext
|
1253.2 |
25.2 |
2.01 |
26.42 |
252.15 |
| DImC |
494.4 |
56.3 |
11.39 |
59.12 |
99.48 |
| CRM certified values |
497 |
— |
— |
15 |
— |
| CRM informational values |
348–646 |
47.9 |
10.00 |
— |
— |
Table 3 Results of analysis of blank and 100 mg L−1 Cl− quality control standards (std.) by each methoda
|
|
CA |
TS |
C
ext
|
DImC |
|
CA = Chloride analyser, TS = titration strips, Cext = conductivity of soil extract, DImC = Digital Image colorimetry.
|
| Mean blank (mg L−1) |
0.07 |
— |
−0.70 |
−4.03 |
|
n blank |
30 |
— |
25 |
24 |
|
σ (mg L−1) |
2.19 |
— |
0.33 |
8.11 |
| LOD (mg L−1) |
6.65 |
— |
0.30 |
20.30 |
| LOQ (mg L−1) |
22.00 |
30.00 |
2.63 |
77.08 |
| Mean 100 mg L−1 std. |
101.71 |
103.20 |
97.12 |
121.61 |
|
n 100 mg L−1 std. |
22 |
11 |
16 |
26 |
|
σ (mg L−1) |
2.49 |
3.35 |
3.74 |
18.37 |
| RSD (%) |
2.45 |
3.25 |
3.85 |
15.11 |
The test strips used in the TS method had a working range stated by the manufacturer of 30–600 mg L−1. It was, therefore, not possible to calculate a LOD, and 30 mg L−1 was taken as the LOQ. Comparison of the LOD and LOQ values for all methods reveal that Cext method had the greatest sensitivity, with the lowest LOD and LOQ values, while CA was the second-most sensitive. The calculated LOD and LOQ values of the DImC method of 20.30 and 77.08 mg L−1, respectively, showed the poorest sensitivity of the methods compared, however the values are still acceptable for the analysis of environmental soil or water samples with elevated salinity. The analysis of the 100 mg L−1 standard broadly corroborated the results of the analysis of the CRM, with CA showing the best accuracy (mean within 2% of actual concentration) and precision (RSD = 2.45%), while Cext and TS methods both demonstrated excellent accuracy (mean within 3.5% of actual concentration) and precision (RSD < 4%). The results of analysis of the 100 mg L−1 standard by the DImC method gave a mean which was ∼21% higher than the actual concentration, although the RSD was similar to the analysis of the CRM at 15.11%.
3.2 Results from the analysis of Mersehead soil samples
3.2.1 Soil properties.
The 69 soil samples analysed covered a pH range from moderately acidic to moderately basic (range 4.8–7.9, mean = 6.05, std dev. = 0.58) and a variety of soil textures from sand to silty clay loam (Table 4). Soils with higher silt and clay content, and higher pH values, were found around the western part of the site with dominant saltmarsh habitat, while sandier soils were dominant for the majority of the farmed area of the site.
Table 4 Soil texture summary
| Soil texture |
n
|
| Sand |
4 |
| Loamy sand |
7 |
| Sandy loam |
16 |
| Sandy silt loam |
11 |
| Silt loam |
21 |
| Silty clay loam |
10 |
3.2.2 Analysis of field wet soils.
Measured Cl− concentrations of field-wet soils ranged between <1.5–8189 mg kg−1 (Table S2‡). The maximum reported concentration of Cl− was generated by DImC and was approximately 1900 mg kg−1 higher than the CA and Cext methods, which had a difference of 484 mg kg−1. Sample variance was also higher in the DImC method, indicating a wider range of determinations. Conductivity data from the Csoil method was not able to be converted directly into equivalent units, however interpolated maps of the DImC, Cext, TS and Csoil methods (Fig. 4) indicate converging descriptions of the distribution of Cl− at the Mersehead nature reserve. Broadly, the site exhibited relatively low Cl− concentrations, with the highest concentrations of Cl− observed in the western sections of the site, in the saltmarsh area. Uncertainties in the interpolation of Cl−, indicated by the residual mean square error (RMSE) values in Fig. 4, were highest for the DImC method and lowest for the Cext approach, reflecting the greater variance of the DImC measurements.
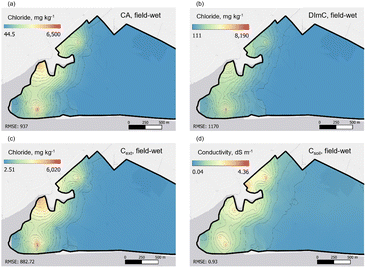 |
| | Fig. 4 Interpolated chloride concentrations for field-wet soils by all methods at the Mersehead nature reserve. Residual Mean Squared Error (RMSE) provided for each interpolation. | |
3.2.3 Analysis of dried soils.
Dried soils provided a similar series of observations to the field-wet soils, with Cl− concentrations ranging from 38–8297 mg kg−1 (Table S3‡). Similarly to the field-wet soils, the DImC approach provided the highest determinations, with CA and Cext roughly equitable. TS had a markedly lower maximum concentration (5524 mg kg−1) relative to other methods and the highest minimum determination (230.8 mg kg−1) due to the LOQ defined by the manufacturer of 30 mg L−1.
Similarly to the field-wet analysis, dried samples provided comparable interpolations of Cl− at the site (Fig. S4‡). The highest concentrations and RMSE were again observed using the DImC method and the lowest for TS.
3.2.4 Comparison of methods.
The results of analysis by DImC, Cext, TS, and Csoil were first compared with the analysis by CA for both field-wet and dried soils using scatter plots and Speaman's rank correlation analysis (Fig. 5), with all methods showing strong positive correlations with CA. The results from analysis of dried and field-wet soils by CA and DImC (Fig. 5a and d) showed that the field-wet soils had slightly stronger correlation coefficient (ρ = 0.85 and 0.82 for field-wet and dried soils, respectively), while the method appears to slightly over-estimate Cl− concentration in both extraction methods. Cext demonstrated a stronger correlation coefficient (ρ = 0.9) for dried soils (Fig. 5b) than the method using field-wet soils (ρ = 0.81), although the analysis of wet soils (Fig. 5e) appears to produce results which are closer to the 1:1 line across the concentration range, and can therefore be considered more accurate. TS showed a strong correlation in the analysis of dried soils (Fig. 5c, ρ = 0.84), but appeared to under-estimate the higher Cl− concentrations, indicated by the deviation of the modelled linear regression below the 1:1 line. In addition, TS couldn't be used to analyse the extracts of field-wet soils as the method did not include a filtration step which led to the strips becoming blocked by fine soil particles. The Csoil method (Fig. 5f) showed the lowest correlation coefficient (ρ = 0.80) of all the methods when compared with the CA results, however, this was still a significant correlation (p < 0.001). The Csoil method directly measures bulk soil conductivity in situ, and therefore does not use such a well defined soil mass or volume, and may be influenced by other soil components such as large pieces of plant material or stones, which is likely to explain the wider distribution of values measured by this method.
 |
| | Fig. 5 Correlations between alternative methods of Cl− quantification and the Cl− analyser (CA) for dried (a–c) and field-wet (d–f) soils. Red dashes show 1:1 line. Digital Image Colorimetry = DImC (panels a and d), conductivity of soil extract = Cext (panels b and e), titration test strips = TS (panel c), directly measured conductivity of soil = Csoil (panel f). | |
As is noted by Altman and Bland (1983),51 scatter plots with correlation analysis and 1:1 line are a useful tool for the initial interpretation of method comparison data, however reliance on correlation coefficients can lead to misinterpretation in cases where a strong correlation may not actually denote method agreement. Therefore B–A plots and Concordance Correlation Coefficient (CCC) analysis were used to investigate the accuracy and precision of the methods compared to the reference CA method in more detail. The B–A plots (Fig. 6) show that the Cext method had the narrowest 95% confidence intervals for the limits of agreement (LoA), demonstrating improved precision compared to the other methods. The mean of the LoA values for all methods are relatively close to zero, with the Cext analysis of wet-soils showing the best overall accuracy (mean LoA = −3.59) and the Cext for dried soils the poorest (mean LoA = −143.82). There is an indication of bias in the results of TS and Cext of dried soils, with a greater deviation in differences at higher concentrations. The results of CCC analysis (Table 5) showed that the Cext method had the best agreement with the CA results, with rc = 0.99 and rc >0.99 for dried and field-wet soils, respectively. The slight over-estimate of Cl− by Cext of dried soils, identified in the interpretation of the scatter plots, is captured in the higher ν and μ values compared to the analysis of field-wet soils by the Cext method. This highlights the slight deviation from the 1:1 line in the analysis of dried soils by Cext, however the accuracy was still greater than the DImC or TS methods and, overall, the accuracy and precision of the Cext method was excellent. The DImC method also compared very favourably with the CA results, with rc = 0.95 and rc = 0.96 for dried and field-wet soils, respectively. The lower CCC of the DImC method than the Cext method is explained by both the lower precision (r = 0.97 and 0.98 for dried and field-wet soils, respectively) and lower accuracy (Cb = 0.988 and 0.986 for dried and field-wet soils, respectively) of the DImC method. The TS method also performed well in the analysis of Cl− from dried soil extracts, however the CCC of rc = 0.95 was influenced by the lower accuracy of the method (Cb = 0.974), which was a result of the relatively low scale shift value of ν = 0.83. This is indicative of the underestimation of the higher concentration soil samples, as identified in the scatter (Fig. 5) and B–A (Fig. 6) plots. Overall, the CCC analysis highlights that all the field methods used had very good precision and accuracy, and all would be suitable for the estimation of areas of increased soil salinity. The Cext solution conductivity method, which is a standard method for investigating soil salinity,56 showed the best accuracy and precision of the field methods tested.
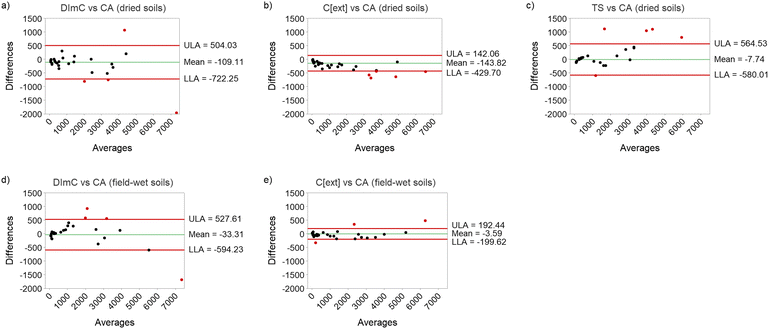 |
| | Fig. 6 Bland–Altman plots comparing the alternative methods of Cl− quantification with the results of the chloride analyser (CA) for dried (a–c) and field-wet (d–e) soils. The green line shows the mean of the paired differences, and red lines show the 95% confidence intervals for the limits of agreement. Points in red are beyond the limits of agreement. Digital Image Colorimetry = DImC (panels a and d), Conductivity of soil extract = Cext (panels b and e), and titration test strips = TS (panel c). | |
Table 5 Concordance Correlation Coefficient (CCC) analysis of the results from dried soils using different methods compared with the chloride analyser (CA)a
|
|
Comparison |
r
c (95% CI) |
r
|
C
b
|
ν
|
μ
|
|
r
c = concordance correlation coefficient, r = Pearson's correlation coefficient (indicating precision), Cb = bias correction factor (indicating accuracy), ν = scale shift, μ = location shift.
|
| Dried soils |
CA vs. DImC |
0.95 (0.90–0.98) |
0.97 |
0.988 |
1.12 |
0.11 |
|
|
CA vs. Cext |
0.99 (0.98–0.99) |
>0.99 |
0.990 |
1.08 |
0.12 |
|
|
CA vs. TS |
0.95 (0.91–0.96) |
0.98 |
0.974 |
0.83 |
−0.13 |
| Field-wet soils |
CA vs. DImC |
0.96 (0.92, 0.98) |
0.98 |
0.986 |
1.18 |
−0.03 |
|
|
CA vs. Cext |
>0.99 (0.99, >0.99) |
>0.99 |
>0.999 |
0.97 |
0.00 |
4 Discussion
4.1 Comparison of methods
4.1.1 Method development and testing.
Analysis of CRMs and standard solutions is useful for evaluating method accuracy and precision when undertaking method development.18 The methods applied in this study in general showed good agreement with the certified values, and the novel DImC method showed excellent accuracy for quantification of Cl− in the soil CRM, although the precision was poorer than other methods. Analysis of the 100 mg L−1 Cl− standard solutions by DImC showed an overestimate of ∼20% (Table 3), while other methods showed excellent accuracy. While the reasons for this overestimate by DImC are not clear, there are several factors which could influence measurements by colorimetric test strips, such as temperature, chemical interferences, and chemical degradation.18 Golicz et al., (2020) highlight the impact of temperature on measurements made with test strips combined with image analysis in the quantification of nutrients in soil, demonstrating that increasing temperature in 5° increments from 15 to 35 °C led to an overestimate of the concentration of nitrate and phosphate in standard solutions.44 This is likely to be due to the influence of temperature on the colour forming chemical reactions occurring in the test strips, which has been previously highlighted as a limitation of test-strip methods.57 The impact of temperature during colour formation was not investigated in this study, and new calibration graphs were prepared for each day of the analysis. The lack of systematic bias evident in the comparison of results indicates that temperature did not have a noticeable effect on results, or that using a new calibration for each day mitigated any possible impact. However, possible temperature effects should be considered for future applications of the novel DImC method. Chemical degradation may also impact colorimetric reactions, and it was noticed in the early stages of the study that the colour of the reactive colour pad of the colorimetric test strips appeared to get lighter with longer storage times which could lead to erroneously high results. Therefore new packs of test strips which had at least 12 months of their manufacturer stated shelf life remaining were used for the analyses reported. In addition, the colorimetric test strips used in DImC were very sensitive to the timing of when the measurement reading was made, as they continued to turn increasingly pale after the 30 seconds reaction time. All samples and standards were carefully timed in the same way and photographed after 10 seconds of immersion in the sample solution and 30 seconds of reaction time, so this is unlikely to be a source of an error in the analysis of the standards. The over-estimate of the 100 mg L−1 Cl− standards was not seen in the results of analysis of the CRM, which had a mean within 1% of the certified value.
4.1.2 Spatial distribution of salt affected soils.
All methods used proved to be effective for identifying the areas of increased soil salinity at the site, and all provided comparable determinations of Cl−. The spatial interpolation analysis demonstrated that all methods for both dried and field-wet soils provided good spatial agreement for the relative Cl− concentration, although there was variability depending on the methods used, with DImC and Csoil interpolations having higher RMSE (accounting for 14.3% and 21.3% of the highest measured value, respectively). The higher modelling errors associated with these methods can be attributed to the lower precision of both methods, as variations in data strongly impacts modelled estimates in spatial interpolation.58 All methods used identified elevated soil Cl− concentration in the Western part of the site (Fig. 4 and S4‡), as would be expected from the saltmarsh habitat present, while soils in the remainder of the site were largely unaffected by salinisation. Saltmarsh habitats can have considerable variability of salinity across relatively small spatial areas with differences driven by topographic, hydrological, and climatic factors.59 Hydraulic conductivity, impacted by factors like soil porosity and texture, is a key variable impacting soil salinity, as soils with high hydraulic conductivity are subject to salt leaching due to high water flow.59 This appears to be an important driver of soil salinity across the Mersehead site, as the soils in the saltmarsh area to the west of the site predominantly had silty soil textures and higher moisture content, while the areas of the site with low or negligible salinity were dominated by sandy soils and had lower associated moisture content.
4.1.3 Accuracy and precision in the analysis of soil samples.
The samples with highest Cl− concentrations were slightly over-estimated by the DImC method. In addition, the calibration range of the DImC method, of 20.30–160 mg L−1, meant that 13 samples required a 2–10 times dilution with DI water to fit within the linear calibration range. The measurement range was narrower than the other methods tested, however all methods except Csoil required dilutions to be applied for the highest concentration samples. The TS method had good precision, but slightly over-estimated Cl− in the soil CRM, under-estimated Cl− in the Mersehead soil samples, and showed excellent accuracy for the analysis of 100 mg L−1 Cl− check standards. The calibration standards also showed excellent agreement with the calibration scale provided by the manufacturer (Fig. S2‡). It was not possible to use the TS method for analysis of unfiltered soils, as the opening where sample solution is introduced to the reactive media within the strip is very small and became blocked with soil particles (in line with the manufacturer's instructions, which indicate filtration is required for analysis of soil samples). The results suggest that there may be variability inherent in the results of the TS method when used for soil analysis. This could possibly be due to fine clay particles making it through coarse filter papers and partially blocking the test strip opening, as some filtered soil extracts appeared slightly cloudy. In previous studies the TS method has shown excellent accuracy for analysis of Cl− in urine samples,60 and application in citizen science analysis of water samples demonstrated variable precision and some under-estimation of Cl− compared to a reference method.61 If this method is adopted for soil analysis in future studies we recommend comparison of at least some samples with a reference method, such as the CA method adopted in this study, to determine if there is an under-estimate of measured soil Cl−, and possibly the application of additional finer filtration steps (e.g. syringe filtration with 0.45 μm membranes) to ensure the complete clarity of sample solutions. In addition, low sample concentrations could not be accurately captured by the TS or DImC methods due to the relatively high LOQ values of these methods, however they both performed well for the identification of areas of increased salinity. The precision of the results from the Csoil method was slightly less than the other methods used, as is indicated by the lower correlation coefficient of ρ = 0.80 (Fig. 5) and the accuracy could not be directly, compared due to the different measurement units, however the spatially interpolated maps of salinity across the site showed excellent agreement with all other methods. The methods used by probes which give a direct measure of soil conductivity without the requirement for sample removal or preparation (such as electrical resistivity, electromagnetic induction, and time domain reflectometry) are influenced by properties such as soil texture, water content and bulk density as well as soil salinity.62,63 They are therefore more inherently variable than other direct measures of soil salinity and Cl−, which explains the greater variability in the results found by the Csoil method used in this study. The Cext method, which measures conductivity with a 1:5 soil:water extraction ratio, is a standard method for soil salinity analysis.56 It is therefore unsurprising that the Cext method was very effective for assessing the Cl− content of both field-wet and dried soil samples, with excellent accuracy, precision and working range. However, the results of analysis of the Anions in Soil CRM highlighted that the estimate of Cl− could be inaccurate due to the presence of other conductive ions, e.g. nitrate, ammonium, phosphate, etc. This effect would also impact the results of the Csoil method. Therefore, if differentiation between salinity from Cl− and other soil ions is desired, then the DImC, TS, or CA methods would be preferable. In the soils analysed in this study from the Mersehead nature reserve, the conductivity was dominated by salinity with a coastal NaCl origin, as indicated by the strong agreement between conductivity and soil Cl− concentration, and therefore the conductivity methods were effective for identifying areas of increased salinisation from salts of marine origin.
4.2 Method application and ease of use
The Csoil method was user friendly, and provided almost instantaneous data on soil conductivity and other parameters. There was no requirement for sample removal or additional preparation, enabling a large area to be surveyed in a short amount of time, however the precision of the estimate of salinity was lower by this method than other methods. The TS method was also user friendly, but required the sample filtration step to avoid blockage, as is noted in Section 4.1. The TS method has previously been applied in citizen science for testing water samples impacted by winter road-salt applications, and the simplicity and speed of the method made it appropriate for use by non-specialists.61 The DImC and Cext methods both had good accuracy for the measurement of field wet soils, which suggests they are both promising methods to use for quick in-field assessments of soil Cl−. The data analysis for all methods was comparable, apart from the DImC method which has more steps and is more complex and time-consuming due to the conversion of digital images into raw data used for calibration and sample measurement. This kind of image processing can be automated43 and can be carried out using apps44 which could make the method much more user friendly. Combining DImC with other smartphone functionalities, such as recording location and timestamp data, enables the generation of spatially interpolated maps (such as those presented in this study), and temporal records of soil salinity and other key soil parameters. The Mergin Maps app enabled sample points to be easily located in the field using the smartphone GPS capability, however the set-up required to generate sample points and spatially interpolated maps was more than would be expected to be undertaken by a non-specialist user. The need for improvement of the spatial analytical capabilities in smartphone apps related to soil analysis was highlighted in the recent review by Sinclair et al., (2024),21 and such an improvement would help to make the kind of spatial analysis presented here more accessible to users. The results presented demonstrate the potential value of improved smartphone-based apps for spatial analysis of soil parameters to help users analyse and interpret soil data in precision agriculture and other analytical applications.
4.3 Analysis of field-wet and dried soils
Fast and simple methods for in-field sample preparation and analysis are valuable for providing quick estimates to non-scientists making land-management decisions.17,44,45 The analysis methods using field-wet or dried soils led to very comparable results. The CCC analysis demonstrated that there were negligible differences in the results using the field-wet or dried soil extraction methods for analysis by Cext and DImC, showing that the shorter extraction with field-wet soils is effective for the identification of saline areas, without the requirement for time-consuming drying, disaggregating, weighing and filtering of samples. The preparation and analysis of field-wet soils could be completed in under 6 minutes, compared with more than a day taken for the preparation of dried soils. The field-wet extraction procedure presented therefore represents an accurate and rapid method for in-field assessment of soil salinity when combined with the Cext or DImC analysis methods.
4.4 Cost effectiveness of the field methods tested
Cost of analysis is frequently an important consideration when planning an experimental measurement, and each of the methods used had different set up and sample analysis costs. The set-up costs are >£2000 for the Csoil and CA methods, and ∼£150–250 for the Cext method (depending on the instrument used). The TS method had a cost of ∼£1.50 per sample, while the colorimetric test strips used with DImC cost ∼ £0.40 per sample. The simple enclosure for DImC made from recycled packaging also had negligible associated cost. The DImC method therefore enables very cost-effective quantitative analysis of Cl− and represents the lowest cost of the analysis options tested. It could, therefore, be a suitable choice for use in citizen science, precision agriculture, teaching, or other resource-limited settings with a large number of participants collecting data.
4.5 Evaluation of the novel DImC method
There are many factors which can influence the precision of methods which use smartphone digital cameras as sensors, with the variability in lighting being a particularly important variable to control.20 Placing the test strips under a recycled opaque white plastic container, using the grayscale calibration card, and using fixed smartphone camera settings were effective measures to enable good image and data reproducibility. This highlights that costly hardware adaptions or very carefully controlled lighting conditions are not always required to make accurate DImC measurements. However, the precision and LOD of the DImC measurement was still poorer than the other methods investigated, with RSD% values of ∼15% compared to values of <5% found for the other methods (Tables 2 and 3). The results from this study are in agreement with other studies applying smartphone analysis for quantification of nitrate using colorimetric test strips, and other soil properties, which show lower precision compared to standard methods, but also highlight the benefits of the low-cost and ease of accessibility and application of this type of method.18,19,43–45 Overall, the novel method compared favourably with the reference CA method, with rc values of 0.95 and 0.96 for dried and field-wet soils, respectively. However, the results should be interpreted cautiously and used as indicative, rather than absolute, values of soil Cl− concentration. Future applications of the method should consider soils from a broader geographical region, with greater diversity of soil types, underlying geology, and climatic variables, in order to demonstrate its wider applicability. The novel DImC method is not a replacement for standard methods for evaluating soil salinity and Cl− concentration, however it demonstrates great promise for identifying areas of elevated salinity in resource-limited settings.
5 Conclusion
Four field methods, including a novel Digital Image Colorimetry (DImC) method, were applied to analyse Cl− in coastal soils of Southwest Scotland. Each method had benefits for the assessment of Cl− in soils, and were able to identify areas of elevated salinity. The direct soil conductivity method (Csoil) was a good method for fast and easy measurement of soil conductivity, however it showed poorer precision than the other methods used and has a relatively high cost. The solution conductivity method (Cext) was excellent for the analysis of overall soil salinity in both wet and dry soils, however where Cl− quantification is desired the results are likely to be influenced by other ions in the soil, as was seen in the poor estimate of Cl− ions in the CRM. When a filtration step was included, the titration test strips (TS) had very good precision and accuracy for the analysis of soil Cl− at concentrations below ∼ 3000 mg kg−1, however they underestimated higher concentrations. Finally, the application of DImC using colorimetric test strips enabled a quantitative measurement of Cl− which was low-cost, fast, and possible to use under field conditions, removing time-consuming sample preparation steps with no detriment to precision or accuracy. Combination with smartphone location data enabled the creation of spatially interpolated maps, allowing accurate and easy identification of areas of increased salinity. Further development of the DImC method, for example with a bespoke smartphone app, would improve the usability of the method and would enable it to be applied in the field by non-specialists to achieve a good estimate of soil Cl− in approximately 6 minutes. This application of DImC to measure soil Cl− highlights the potential for smartphone-based techniques to be used for portable and affordable analysis of soil chemical properties.
Author contributions
MM: conceptualization, methodology, formal analysis, investigation, writing – original draft, writing – review & editing, visualization, project administration. AI: methodology, formal analysis, investigation, writing – original draft, writing – review & editing, visualization.
Conflicts of interest
The authors have no conflicts of interest to declare.
Acknowledgements
Many thanks to the RSPB for granting access to the Mersehead Nature Reserve. This project received no external funding.
Notes and references
-
L. Olsson, H. Barbosa, S. Bhadwal, A. Cowie, K. Delusca, D. Flores-Renteria, K. Hermans, E. Jobbagy, W. Kurz, D. Li, D. Sonwa and L. Stringer, in Climate Change and Land – An IPCC Special Report on climate change, desertification, land degradation, sustainable land management, food security, and greenhouse gas fluxes in terrestrial ecosystems. ed. P. Shukla, J. Skea, E. C. Buendia, V. Masson-Delmotte, H.-O. Portner, D. Roberts, P. Zhai, R. Slade, S. Connors, R. van Diemen, M. Ferrat, E. Haughey, S. Luz, S. Neogi, M. Pathak, J. Petzold, J. P. Pereira, P. Vyas, E. Huntley, K. Kissick, M. Belkacemi and J. Malley, IPCC, 2019, ch. 4, pp. 345–436 Search PubMed.
- J. W. Hopmans, A. S. Qureshi, I. Kisekka, R. Munns, S. R. Grattan, P. Rengasamy, A. Ben-Gal, S. Assouline, M. Javaux, P. S. Minhas, P. A. Raats, T. H. Skaggs, G. Wang, Q. D. J. van Lier, H. Jiao, R. S. Lavado, N. Lazarovitch, B. Li and E. Taleisnik, Adv. Agron., 2021, 169, 1–191 CrossRef.
- B. Wicke, E. Smeets, V. Dornburg, B. Vashev, T. Gaiser, W. Turkenburg and A. E. Faaij, Energy Environ. Sci., 2011, 4, 2669–2681 RSC.
- R. V. Schofield and M. J. Kirkby, Global Biogeochem. Cycles, 2003, 17, 1078 CrossRef.
- K. Ivushkin, H. Bartholomeus, A. K. Bregt, A. Pulatov, B. Kempen and L. de Sousa, Remote Sens. Environ., 2019, 231, 111260 CrossRef.
-
FAO and ITPS, Status of the World's Soil Resources – Main Report, Food and Agriculture Organization of the United Nations and Intergovernmental Technical Panel on Soils, 2015 Search PubMed.
-
C. Omuto, R. Vargas, A. E. Mobarak, K. Viatkin and Y. Yigini, Mapping of Salt-Affected Soils – Technical Manual, Food and Agriculture Organization of the United Nations, 2020 Search PubMed.
- M. C. Paz, M. Farzamian, A. M. Paz, N. L. Castanheira, M. C. Gonçalves and F. M. Santos, Soil, 2020, 6, 499–511 CrossRef.
- A. Abbas, S. Khan, N. Hussain, M. A. Hanjra and S. Akbar, Phys. Chem. Earth, 2013, 55–57, 43–52 CrossRef.
- D. L. Corwin, Eur. J. Soil Sci., 2021, 72, 842–862 CrossRef.
- Y. Wang, D. Xiao, Y. Li and X. Li, Environ. Monit. Assess., 2008, 140, 291–302 CrossRef PubMed.
- D. Eswar, R. Karuppusamy and S. Chellamuthu, Curr. Opin. Environ. Sustain., 2021, 50, 310–318 CrossRef.
- J. Chen and V. Mueller, Nat. Clim. Change, 2018, 8, 981–987 CrossRef.
- R. Gebbers and V. I. Adamchuk, Science, 2010, 327, 828–831 CrossRef CAS PubMed.
- F. J. Pierce and P. Nowak, Adv. Agron., 1999, 67, 1–85 Search PubMed.
- D. L. Corwin and S. M. Lesch, Agron. J., 2003, 95, 455–471 Search PubMed.
- J. Mendes, T. M. Pinho, F. N. D. Santos, J. J. Sousa, E. Peres, J. Boaventura-Cunha, M. Cunha and R. Morais, Agronomy, 2020, 10, 855 CrossRef.
- K. Golicz, S. H. Hallett, R. Sakrabani and G. Pan, Sci. Rep., 2019, 9, 1–10 CrossRef CAS PubMed.
- A. Mallory, K. Golicz and R. Sakrabani, Soil Use Manage., 2020, 38, 164–178 CrossRef.
-
M. Aitkenhead, D. Donnelly, M. Coull and R. Gwatkin, in Digital Soil Morphometrics, ed. A. E. Hartemink and B. Minasny, Springer, 2016, ch. 7, pp. 89–110 Search PubMed.
- R. Sinclair, S. Nodi and M. A. Kabir, Comput. Electron. Agric., 2024, 216, 108527 CrossRef.
- Y. Fan, J. Li, Y. Guo, L. Xie and G. Zhang, Meas.: J. Int. Meas. Confed., 2021, 171, 108829 CrossRef.
-
V. Kilic, N. Horzum and M. E. Solmaz, in Color Detection, ed. L. Zeng and S. L. Cao, IntechOpen, 2020, ch. 4, DOI:10.5772/intechopen.82227.
- L. F. Capitán-Vallvey, N. López-Ruiz, A. Martínez-Olmos, M. M. Erenas and A. J. Palma, Anal. Chim. Acta, 2015, 899, 23–56 CrossRef PubMed.
- E. Kehoe and R. L. Penn, J. Chem. Educ., 2013, 90, 1191–1195 CrossRef CAS.
- J. F. Destino and K. Cunningham, J. Chem. Educ., 2020, 97, 2960–2966 CrossRef CAS.
- G. M. Fernandes, W. R. Silva, D. N. Barreto, R. S. Lamarca, P. C. F. Lima Gomes, J. F. da S Petruci and A. D. Batista, Anal. Chim. Acta, 2020, 1135, 187–203 CrossRef CAS PubMed.
-
J. Ma, J. Xu, B. Cui, D. Yang, Y. Fang, X. Liu and F. Zhang, in Portable and Wearable Sensing Systems: Techniques, Fabrication, and Biochemical Detection, ed. Q. Liu, Wiley VCH GmbH, Weinheim, 2024, ch. 3, pp. 41–70 Search PubMed.
- L. P. dos Santos Benedetti, V. B. dos Santos, T. A. Silva, E. B. Filho, V. L. Martins and O. Fatibello-Filho, Anal. Methods, 2015, 7, 4138–4144 RSC.
- Y. Zhao, S. Y. Choi, J. Lou-Franco, J. L. Nelis, H. Zhou, C. Cao, K. Campbell, C. Elliott and K. Rafferty, Proc. IEEE Sens., 2019, 1–4 Search PubMed.
- H. S. de Sousa, R. Arruda-Santos, E. Zanardi-Lamardo, W. T. Suarez, J. L. de Oliveira, R. A. Farias and V. B. dos Santos, Anal. Methods, 2024, 16, 2009–2018 RSC.
- F. Cecil, M. Zhang, R. M. Guijt, A. Henderson, P. N. Nesterenko, B. Paull, M. C. Breadmore and M. Macka, Anal. Chim. Acta, 2017, 965, 131–136 CrossRef CAS PubMed.
- B. S. Hosker, J. Chem. Educ., 2018, 95, 178–181 CrossRef CAS.
- M. de O. K. Franco, W. J. Cardoso, C. B. Vilanculo, V. B. dos Santos, J. P. B. de Almeida, L. F. Capitán-Vallvey and W. T. Suarez, Anal. Methods, 2023, 15, 2300–2308 RSC.
- L. M. de Oliveira, V. B. dos Santos, E. K. da Silva, A. S. Lopes and H. A. Dantas-Filho, Talanta, 2020, 206, 120219 CrossRef CAS PubMed.
- S. C. Kim, U. M. Jalal, S. B. Im, S. Ko and J. S. Shim, Sens. Actuators, B, 2017, 239, 52–59 CrossRef CAS.
- G. Chen, C. Fang, H. H. Chai, Y. Zhou, W. Y. Li and L. Yu, Sens. Actuators, B, 2019, 281, 253–261 CrossRef CAS.
- S. DiNonno and R. Ulber, Analyst, 2021, 146, 2749 RSC.
- L. Shen, J. A. Hagen and I. Papautsky, Lab Chip, 2012, 12, 4240–4243 RSC.
- K. E. McCracken and J. Y. Yoon, Anal. Methods, 2016, 8, 6591–6601 RSC.
- J. I. Hong and B.-Y. Chang, Lab Chip, 2014, 14, 1725 RSC.
- M. N. Azhar, A. Bustam, F. S. Naseem, S. S. Shuin, M. H. M. Yusuf, N. U. Hishamudin and K. Poh, Digit. Health, 2023, 9, 1–11 Search PubMed.
- M. Aitkenhead, M. Coull, R. Gwatkin, D. Donnelly, G. P. Martinsanz and F. Rovira-Más, J. Imaging, 2016, 2, 1–12 Search PubMed.
- K. Golicz, S. Hallett, R. Sakrabani and J. Ghosh, Comput. Electron. Agric., 2020, 175, 105532 CrossRef.
- M. Tobiszewski and C. Vakh, Anal. Bioanal. Chem., 2023, 415, 3703–3715 CrossRef CAS PubMed.
- T. H. Oo, T. Hata, K. Z. Htun and K. Marumo, J. Jpn. Soc. Civ. Eng., 2019, 75, 147–154 Search PubMed.
-
A. Sinclair, B. Crooks and M. Coull, Soils Information, Texture and Liming Recommendations, SRUC Technical Report TN656, 2014 Search PubMed.
- J. Schindelin, I. Arganda-Carreras, E. Frise, V. Kaynig, M. Longair, T. Pietzsch, S. Preibisch, C. Rueden, S. Saalfeld, B. Schmid, J. Y. Tinevez, D. J. White, V. Hartenstein, K. Eliceiri, P. Tomancak and A. Cardona, Nat. Methods, 2012, 9, 676–682 CrossRef CAS PubMed.
-
R Core Team, R: A Language and Environment for Statistical Computing, R Foundation for Statistical Computing, Vienna, Austria, 2023 Search PubMed.
-
D. R. Helsel, Statistics for Censored Environmental Data Using Minitab® and R, John Wiley and Sons, Hoboken, 2nd edn, 2011 Search PubMed.
- D. G. Altman and J. M. Bland, The Statistician, 1983, 32, 307 CrossRef.
- D. W. Meek, T. A. Howell and C. J. Phene, Agron. J., 2009, 101, 1012–1018 CrossRef.
- L. I.-K. Lin, Biometrics, 1989, 45, 255–268 CrossRef CAS PubMed.
-
M. Stevenson, T. Nunes, C. Heuer, J. Marshall, J. Sanchez, R. Thornton, J. Reiczigel, J. Robison-Cox, P. Sebastiani, P. Solymos, K. Yoshida, G. Jones, S. Pirikahu, S. Firestone and R. Kyle, epiR: Tools for the Analysis of Epidemiological Data, R Package Version 0.9-93, 2023 Search PubMed.
-
QGIS.org, QGIS Geographic Information System, 2023, http://qgis.org.
-
FAO, Standard Operating Procedure for Soil Electrical Conductivity, Soil/water, 1:5, Food and Agriculture Organization of the United Nations, 2021, vol. CB3354EN/1/02.21 Search PubMed.
- R. Wetselaar, G. D. Smith and J. F. Angus, Commun. Soil Sci. Plant Anal., 1998, 29, 729–739 CrossRef CAS.
- J. Li and A. D. Heap, Ecol. Inform., 2010, 6(3–4), 228–241 Search PubMed.
- H. Wang, Y. P. Hsieh, M. A. Harwell and W. Huang, Ecol. Modell., 2007, 201, 429–439 CrossRef.
- N. D. Heeney, R. H. Lee, B. C. D. Hockin, D. C. Clarke, S. Sanatani, K. Armstrong, T. Sedlak and V. E. Claydon, Auton. Neurosci., 2021, 233, 102797 CrossRef CAS PubMed.
- D. M. Haake, S. Krchma, C. W. Meyners and R. Virag, Integr. Environ. Assess. Manage., 2022, 18, 1667–1677 CrossRef PubMed.
- D. L. Corwin and E. Scudiero, Adv. Agron., 2019, 158, 1–130 Search PubMed.
- T. G. Caldwell, T. Bongiovanni, M. H. Cosh, C. Halley and M. H. Young, Vadose Zone Journal, 2018, 17, 1–16 CrossRef CAS.
|
| This journal is © The Royal Society of Chemistry 2024 |
Click here to see how this site uses Cookies. View our privacy policy here. 
 Open Access Article
 This Open Access Article is licensed under a
  *a and
Andrew
Innes
*a and
Andrew
Innes