
Improving analytical performance for pesticides and mycotoxins determination in Brazilian table olives: one extraction and one analysis†
Bárbara
Reichert
a,
Ionara Regina
Pizzutti
 *b,
Bárbara Daiana
Jänisch
b and
Marlos Eduardo
Zorzella Fontana
b
*b,
Bárbara Daiana
Jänisch
b and
Marlos Eduardo
Zorzella Fontana
b
aHUSM – University Hospital of Santa Maria, Pharmacy Sector (SFH), 1000 Roraima Ave, Santa Maria, RS 97105-900, Brazil
bUFSM – Federal University of Santa Maria, Chemistry Department, Center of Research and Analysis of Residues and Contaminants (CEPARC), 1000 Roraima Ave, Santa Maria, RS 97105-900, Brazil. E-mail: ionara.pizzutti@ceparc.com.br; Tel: +55 55 3220 9458
First published on 4th June 2024
Abstract
This paper describes an extensive study in which a multiclass QuEChERS based approach was optimized for determination of 150 pesticides and 7 mycotoxins in table olives. Three versions of QuEChERS were evaluated and compared (unbuffered, citrate and acetate buffering). A combination of EMR-Lipid cartridges and liquid nitrogen or freezer freezing out were tested for clean-up of the oily olive extracts. Analysis of the extracts were performed by LC-MS/MS triple quadrupole. The best results were achieved using acetate QuEChERS with liquid nitrogen for clean-up. For validation, organic olives were ground and spiked at 4 concentrations with pesticides and mycotoxins (n = 5). The linearity of the calibration curves was assessed by analyzing calibration standards of 7 concentrations which were prepared separately in acetonitrile and in blank olive extract (n = 5). The validation study demonstrated that the calculated r2 was ≥0.99 for 144 pesticides and 6 mycotoxins, when the calibration curves were prepared in matrix extract, showing satisfactory linearity. Matrix effects were within the range of ±20% for only 46 pesticides and one mycotoxin. Then, to ensure reliable quantification, calibration standards had to be matrix-matched. In accuracy experiments 138 pesticides and 6 mycotoxins presented recoveries from 70 to 120% and RSD ≤ 20% for at least 2 of the 4 spike concentrations evaluated, being successfully validated. The integrated QuEChERS and LC-MS/MS method meet MRL for 11 of the 21 pesticides regulated for olives in Brazil and for 132 pesticides which are regulated in the EU law. Eleven commercial table olive samples were analyzed and 4 of them tested positive for pesticides. All the positive samples violate the Brazilian law and one sample violates also the European law.
Introduction
Native to the Mediterranean, the olive trees are members of the Oleacea family. The gender Olea has several species, even though Olea europaea is the only one with commercial importance.1 Because of its qualities, olives have been introduced in almost all continents.2 Olives are rich in oil (12 to 30%) and are usually cured by fermentation processes to be consumed as pickled olives. The fruit can also be ground raw and later centrifuged (or pressed) for oil extraction. Along with grapes and wheat, olives are a member of the Mediterranean triad, the suite of plants underpinning ancient agriculture in the region.3In Brazil, olive trees were introduced in the colonial period mainly in the southern states. Nevertheless, to avoid competition, the groves were cut down by order of the Portuguese crown. This fact prevented olive growing from taking the first impulse in Brazil.4 This scenario only started to change recently. Currently, olive groves in Brazil cover about 7000 hectares, manly located in the state of Rio Grande do Sul (around 4500 hectares) and in a region denominated “Serra da Mantiqueira” (around 2000 hectares), which encompasses areas of the states of Minas Gerais, São Paulo and Rio de Janeiro.5
According to the statistics of the Food and Agriculture Organization of the United Nations (FAO), olive production in Brazil leapt from 77 tons in 2011 to 2651 tons in 2020 and to 3417 tons in 2021.6 Contradictorily, Brazilian table olive consumption was around 124![[thin space (1/6-em)]](https://www.rsc.org/images/entities/char_2009.gif) 000 tons in 2020,7 which is 46.8 times higher than the production in the same year. Such data show that indeed domestic production is by far not enough to meet the consumption demand. In addition, Brazilian olive production is still very small when compared to other Latin American countries as Argentina, Peru and Chile, which produced 341306; 147011 and 130344 tons respectively, in 2021.6
000 tons in 2020,7 which is 46.8 times higher than the production in the same year. Such data show that indeed domestic production is by far not enough to meet the consumption demand. In addition, Brazilian olive production is still very small when compared to other Latin American countries as Argentina, Peru and Chile, which produced 341306; 147011 and 130344 tons respectively, in 2021.6
As any other crop olives are subjected to pests, diseases and weeds during cultivation which can negatively affect production.8 Mycotoxigenic fungi can contaminate olive fruits, and under favorable conditions, produce mycotoxins. These can also be transferred to table olives and olive oil.9,10 Besides the fungi, insect pests are also of great relevance. Some pests as e.g. the olive fly, olive moth, psyllids, thrips, cochineal, neiroun and leopard moth can attack the groves damaging the fruits and cause decrease in production.8
Aiming to protect the fruits and maintain high productivity, pesticides are systematically applied to olive groves. The application of pesticides according to the good agricultural practices protects the plants and brigs benefits. However, the application of excessive amounts, use of banned pesticides, the non-compliance of preharvest interval or even the drift of pesticides applied to other crops can offer health risk to the consumers. To ensure food safety, many countries have set maximum residue levels (MRL) for pesticides in olives, and consequently, reliable analytical methods have become essential.8
According to SANTE N. 11312/2021,11 olives belong to the group of commodities with high oil content and intermediate water content. The challenging task about multi-residue methods for such matrices is due the sample preparation approach. The high oil content must be removed from the extracts before chromatographic analysis, which requires efficient clean-up procedures, otherwise it can lead to unsatisfactory recoveries and/or high matrix effects.12,13
Over the last decades a considerable number multi-residue methods were reported for olive oil. Some of them covering small scopes (≤70),14–18 others covering wide scopes (>100).19–21 However, not so many methods were reported for pesticides determination in table olives15,21,22 and even less were reported for mycotoxins. Since there is evidence that mycotoxins can contaminate olives23–25 and olive oils,26–33 it can be considered a concerning topic.
Many studies have also already addresses the contamination levels of olive oils with pesticides.14,16,18,20,34 Several positive samples were reported by these articles and in some cases, the detected pesticides exceeded their MRL.16,20,21,35 Among the determined pesticides were chlorpyrifos-ethyl,20,21,34,35 diazinon,20,21,34 thiacloprid,14,21 quinalphos,16,35 tetraconazole, dimethoate,20,21 endosulfan-sulfate, fenthion21,35 and parathion-methyl,34,35 among others. Even the banned organochlorine insecticide 4,4-DDE was found at 15.7 μg kg−1 in one sample.18
Regarding olives contamination with pesticides, a study conducted by García-Vara et al. (2022)15 analyzed samples from Iberian Peninsula produced from 2018 to 2020. A few samples tested positive for imidacloprid (>100 μg kg−1), acetamiprid, desisopropyl-atrazine (DIA), terbutryn and irgarol.
Taghizadeh et al. (2021),22 tested 1800 olive samples from Iran for the presence of 22 pesticides, besides other contaminants. Positive samples were reported and fortunately, all pesticides were in accordance with their corresponding MRL. Another study from Anagnostopoulos and Miliadis (2013)21 evaluated olives an olive oils samples from Greece. Seven samples tested positive. The determined pesticides were chlorpyriphos-ethyl, dimethoate, omethoate and pyriproxyfen, some of them exceeded their MRL.
In addition to pesticides, mycotoxins contamination has also been detected in olive oils. Among the mycotoxins found are aflatoxin B1 at concentrations up to 2.4 μg kg−1,31,32 alternariol (from 3.0 to 28.0 μg kg−1),26,27,30,33 alternariol monomethyl ether (up to 14.0 μg kg−1)26,30 ochratoxin A (up to 17.7 μg kg−1),31,32 zearalenone (up to 7.1 μg kg−1),26,28,29 aflatoxins G1 (up to 1.9 μg kg−1) and G2 (up to 6.8 μg kg−1),28 besides sterigmatocystin, tentoxin, beauvericin, mycophenolic acid, enniatin A, A1, B and B126 and tenuazonic acid.30
In contrast, the subject of mycotoxins contamination in olives has not yet been explored so deeply, although a few studies are available in the literature. Khalil, Hashem and Abdelaziz (2019)25 isolated mycotoxigenic Penicillium species from green table olives from Saudi Arabia. These authors used thin layer chromatography (TLC) for qualitative detection of citrinin, penicillic acid and cyclopiazonic acid. All samples stored at 10 to 15 °C for 21 to 30 days tested positive for mycotoxins produced by Penicillium species.
Franzetti et al. (2011)24 analyzed 40 samples of green table olives from Italy. Aflatoxin B1 was detected in 25% of the samples (in the range of 0.4 to 0.5 μg kg−1), while ochratoxin A was found in 58% of the samples (in the range of 0.2 to 3.9 μg kg−1).
El Adlouni et al. (2006)23 investigated the presence of mycotoxins in black olives from Marocco. These authors reported the occurrence of ochratoxin A, citrinin and aflatoxin B in some samples. Seven samples tested positive for ochratoxin A at concentrations up to 0.6 μg kg−1. Citrinin was determined in 5 samples (up to 0.5 μg kg−1) and aflatoxin B was found in 4 samples at concentrations from 0.5 to 5 μg kg−1.
Unfortunately, so far there are no maximum levels (ML) established in law for mycotoxins in olives or olive oils. Thus, this study aimed to optimize and validate an high performance QuEChERS based approach for pesticides and mycotoxins determination in the oily olive matrix using LC-MS/MS, and afterwards, to apply it to assess the contamination levels of olives samples commercialized in Brazil.
Experimental
Chemicals and reagents
Acetonitrile pesticide grade (99.9%), formic acid and acetic acid both analytical grade (99.8%) were purchased from J.T. Baker (Phillipsburg, NJ, USA). Ultrapure water was obtained from a Milli-Q Gradient Water System (Millipore, Milford, USA). Sodium acetate analytical grade was purchased from J.T. Baker (Xalostoc, Mexico). Anhydrous magnesium sulphate, sodium chloride, sodium citrate, sodium hydrogencitrate sesquihydrate and enhanced matrix removal-lipid (EMR-Lipid) SPE cartridges were supplied by Agilent (Folsom, CA, USA).Pesticide standards (purity >97%) were obtained from Dr Ehrenstorfer (Augsburg, Germany). Mycotoxins standards were from Fermentek Biotechnology (Jerusalem, Israel) or from Sigma-Aldrich (Steinheim, Germany).
Standard solutions
:1). In case of G2 of mycotoxins, stock solutions were prepared in acetonitrile, at 500 mg L−1 for citrinin and at 1000 mg L−1 for zearalenone. Afterwards, a mixture standard solution of the 7 mycotoxins was prepared in acetonitrile by successive dilution of the individual stock solutions. Concentration of the mixture standard solution was of 1 μg mL−1 for mycotoxins of G1 and at 50 μg mL−1 for mycotoxins of G2. All standard solutions were stored in a freezer at −18 °C until use.
The mixture standard solutions of both mycotoxins and pesticides were used as spiking solutions to perform recovery experiments and to prepare calibration standards for a linearity study.
The P.I.S. was spiked to the samples previously to extraction and used to ensure the correct execution of QuEChERS approach by calculating mean recoveries and repeatability relative standard deviation (RSD). Acceptance criteria were recoveries of 70 to 120% and RSD ≤ 20%.
The I.I.S. was added to the final dilution solvent (acetonitrile/water, 1:1) and used to ensure the accurate injection of sample extracts. RSD among the peak areas were calculated and injections were considered correctly done when RSD ≤ 20%. Internal standards were not used for correction or quantification purposes.
LC-MS/MS conditions
Chromatographic analysis was performed on an 1260 Infinity II Prime LC (Agilent, Waldbronn, Germany) coupled to an Ultivo triple quadrupole mass spectrometer (TQ-MS/MS) (Agilent, Singapore). The LC system was equipped with a flexible quaternary pump, multisampler and column oven.Injection volume was 2 μL. Separation of the pesticides and mycotoxins was conducted on an InfinityLab Poroshell 120 SB C18 (100 × 3.0 mm i.d., 2.7 μm particle size) (Agilent, USA), kept at 45 °C. The column was connected to a guard column 3 PK InfinityLab Poroshell HPH-C18 (5 × 2.1 mm i.d., 2.7 μm particle size) (Agilent, USA).
The mobile phase consisted of ultrapure water containing 0.1% formic acid (eluent A) and acetonitrile containing 0.1% formic acid (eluent B). Gradient elution started with 80% eluent A (kept for 5 min), followed by a linear gradient down to 10% eluent A at 9 min (kept for 0.25 min) and then to 5% of eluent A at 11 min. Gradient was set gradually back to the initial condition at 13 minutes and the column was re-equilibrated for 1 minute, resulting in a total run time of 14 min. Mobile phase flow rate was set at 0.3 mL min−1 and it was diverted to waste during the first 0.5 min of the chromatographic run.
The mass spectrometer was equipped with an Agilent Jet Stream Source (AJS), which was operated in the positive and negative electrospray (ESI) mode. Nitrogen (N2) was used as nebulizer gas (flow rate 11 L min−1 at 250 °C) and as sheath gas (flow rate 12 L min−1 at 350 °C). Capillary voltage and current were 3845 V and 5781 nA, respectively. The Ultivo TQ-MS/MS was operated in the dynamic multiple reaction monitoring mode (dMRM). Two transitions were monitored for each analyte. The optimized LC-MS/MS conditions for pesticides and mycotoxins are summarized in ESI Table S1.†
Data acquisition and processing was done by the MassHunter software, version 1.2 (Agilent, USA).
Samples and pretreatment
In order to provide blank sample (free of the studied pesticides and mycotoxins) for method optimization and validation, a sample of organic table olives (1 kg) was acquired from a certified organic producer located in the state of Minas Gerais, Brazil. This sample was previously analyzed to ensure it was really blank.Aiming to assess the contamination levels of conventional table olives, 11 commercial samples of 0.5 kg and of different brands (with 3 replicates each, n = 3) were purchased in local markets of Santa Maria, Rio Grande do Sul, Brazil.
All olive samples had their pits removed and were then ground using a universal fruit multiprocessor (Philco, Brazil) until obtaining an homogeneous paste. Afterwards, the ground samples were stored in a freezer at −18 °C until analysis.
Slurried samples (diluted 2-fold) were used for method optimization (experiments II and IV, described in Fig. 1). The slurry was prepared directly into the 50 mL centrifuge tubes. For this, portions of 5 or 10 g of olive paste were weighed into the tubes, the P.I.S. was added and the tubes were homogenized in vortex for 30 s. For recovery experiments, spiking solutions were added and the tubes were homogenized in vortex again for 1 min. Finally, ultrapure water was added and the tubes were shaken in vortex for more 1 min.
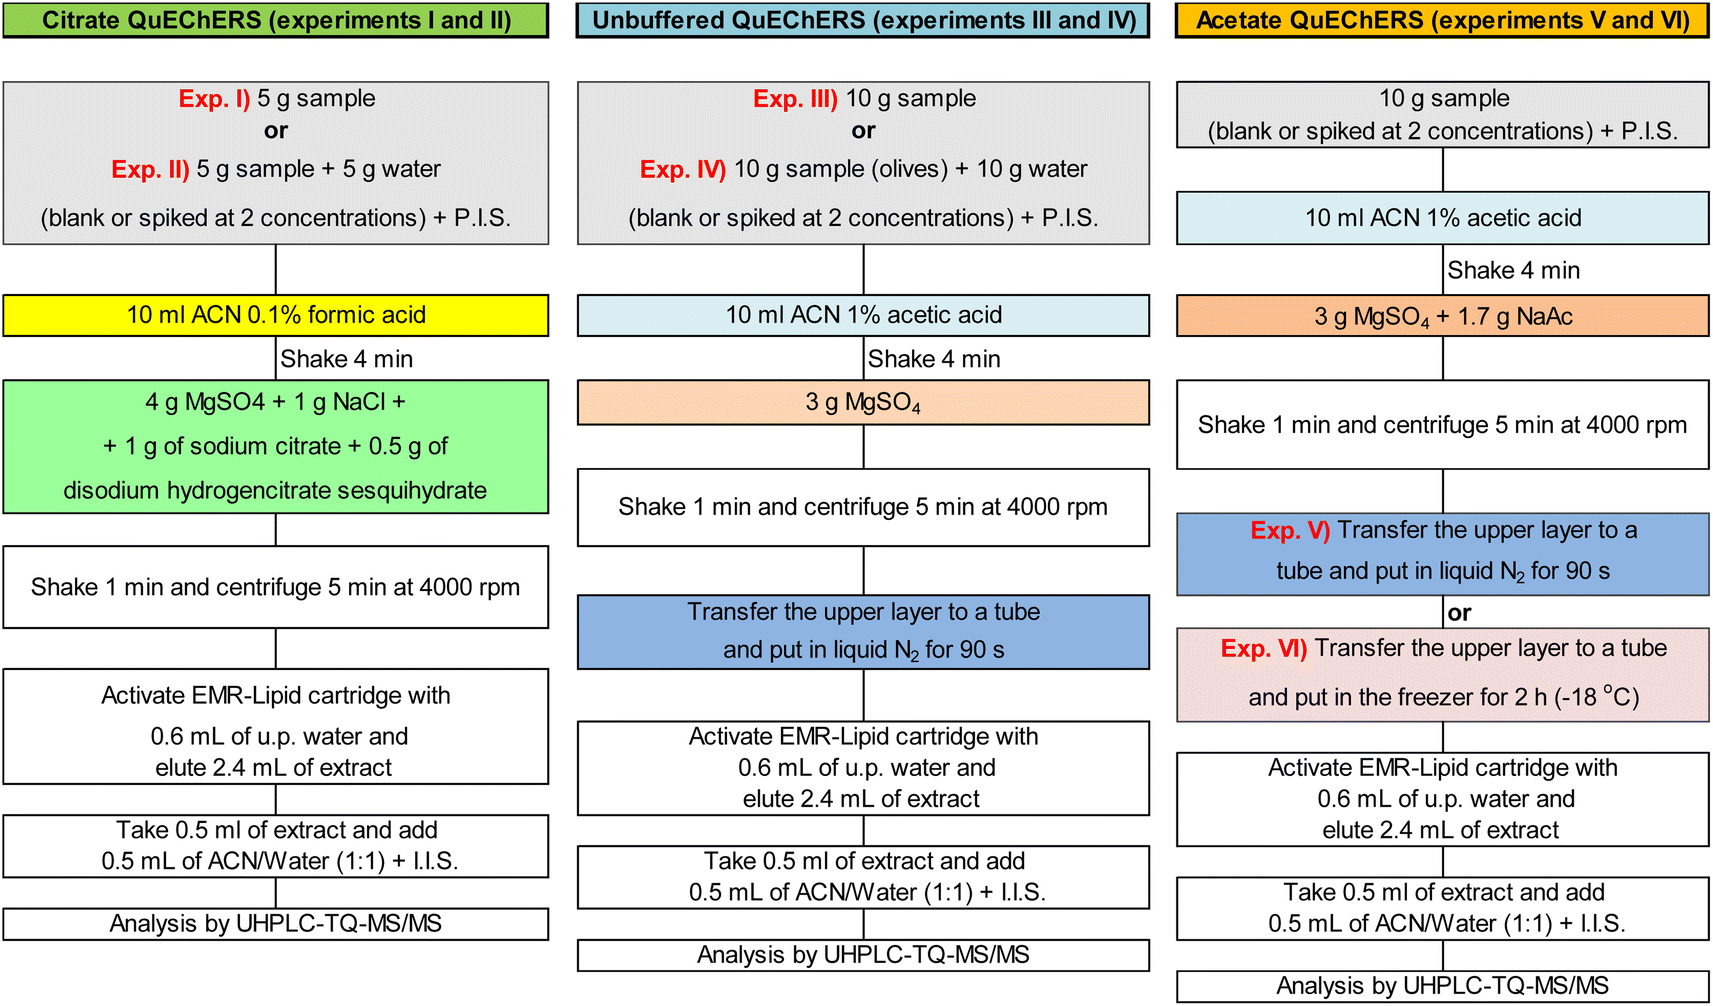 | ||
| Fig. 1 Scheme of the QuEChERS approaches evaluated for olives. | ||
Optimization and selection of the extraction method (QuEChERS approach)
Extraction experiments were conducted with 5 or 10 g of sample, with and without sample dilution (slurry) previously to extraction. Unbuffered, as well as citrate and acetate buffering versions of QuEChERS approach were evaluated in combination with clean-up steps of liquid nitrogen or 2 hours in freezer (−18 °C) for freezing out. Fig. 1 shows a scheme of QuEChERS approaches tested (experiments I, II, III, IV, V and VI).Before extraction, the samples were spiked with pesticides at 10 and 50 μg kg−1 and with mycotoxins at 2 and 20 μg kg−1 for G1 and at 100 and 1000 μg kg−1 for G2 (with 3 replicates at each concentration, n = 3). Spiked samples were then extracted with QuEChERS approaches as demonstrated in Fig. 1.
Results obtained from those 6 experiments were compared and to select for validation one of the tested approaches the following parameters were considered: (i) ability to provide acceptable recoveries and RSD, besides low matrix effects; (ii) good cost-benefit relation; (iii) work and time required to perform the extraction approach.
Validation of the analytical method
According to SANTE N. 11312/2021,11 laboratory method validation is done to assure that the method fits for the intended purpose. Therefore, this method validation study was conducted according to the mentioned guide criteria. Quantitative methods have to be assessed for sensitivity/linearity, matrix effects, limit of quantification (LOQ), specificity, recovery, precision and robustness.In this study all 150 pesticides and 7 mycotoxins were extracted and determined simultaneously in one single chromatographic run.
Recovery experiments were performed to assess the accuracy (as trueness and precision) by spiking pesticides and mycotoxins to the blank olive matrix. The spike concentrations were 10, 20, 50 and 70 μg kg−1 for pesticides; 2, 10, 20 and 30 μg kg−1 for mycotoxins of G1 and 100, 500, 1000 and 1500 μg kg−1 for mycotoxins of G2. Five replicates (n = 5) were prepared at each spike concentration and the blank sample was also extracted 5 times (n = 5) to assess specificity.
The determination of the LOQ was done based on the lowest spiked concentration that meets criteria of recoveries within the range of 70–120% with an associated repeatability RSD ≤ 20%.11
Linearity of the calibration curves was assessed by analyzing calibration standards of 7 concentrations which were prepared separately in acetonitrile and in a blank olive extract (matrix-matched standards). Calibration standards were injected into the LC-MS/MS system 5 times each (n = 5) and the medium peak areas were considered for calculations. For pesticides, the concentrations of the standard solutions were: 1, 5, 10, 25, 35, 50 and 75 μg L−1 (corresponding to 2, 10, 20, 50, 70, 100 and 150 μg kg−1 of matrix). For mycotoxins of G1 concentrations were: 0.5, 1, 5, 10, 15, 25 and 50 μg L−1 (corresponding to 1, 2, 10, 20, 30, 50 and 100 μg kg−1); for G2: 25, 50, 250, 500, 750, 1250 and 2500 μg L−1 (corresponding to 50, 100, 500, 1000, 1500, 2500 and 5000 μg kg−1).
Matrix effects were calculated individually for each pesticide and mycotoxin based on the slope of calibration curves of each compound by using the equation below.
| Matrix effects (%) = [(a1/a2) − 1)] × 100 |
Results and discussion
Method optimization and selection
Aiming to select for validation the most “fit for purpose” QuEChERS approach, samples spiked at two concentrations were analyzed and results are shown in Fig. 2. | ||
| Fig. 2 Results of QuEChERS approach optimization study according to the six experiments (I, II, III, IV, V and VI) performed for pesticides (A) and for mycotoxins (B). | ||
Extraction of slurried samples was evaluated because in some cases, the addition of water to the samples (prior to extraction) can improve extraction efficiency. Sample dilution is generally recommended for low moisture commodities as cereals.11 As demonstrated in Fig. 2(A and B), extraction of slurried samples (experiments II and IV) did not improve recoveries for pesticides or for mycotoxins.
Considering only the pesticides (Fig. 2A), the experiments that provided recoveries from 70 to 20% and RSD ≤ 20% for the largest number of pesticides were experiments I, II (for the highest spike concentration), III and V (for both spike concentrations). This last experiment yielded satisfactory recoveries for 83% of the pesticides at the spike concentration of 10 μg kg−1 (target LOQ), possibly because 10 g of sample was used for extraction rather than 5 g, as used in experiments I and II.
For the mycotoxins (Fig. 2B), experiments I, III, II, V and VI, respectively, presented the largest number of mycotoxins meeting satisfactory recovery and RSD criteria. Aflatoxins presented satisfactorily recoveries in all experiments at 20 μg kg −1, except aflatoxin G2 in experiment IV, in which it was not detected. Citrinin presented recoveries (and RSD) of 89% (8%) and 92% (3%) for the spike concentration of 1000 μg kg−1 in experiments I and II, respectively. But it presented recoveries <70% for both spike concentrations in experiments III to VI. This may have been caused either by the pH of the extraction solvent or by the freezing out clean-up. Ochratoxin A was satisfactory recovered in experiments I to IV at the spike concentration of 20 μg kg −1, while in experiments V and IV it presented recoveries <35%, probably due to the pH change caused by the acetate buffer. Zearalenone presented similar recovery and RSD results for all experiments, being apparently little affected by the different QuEChERS approaches tested.
Regarding the matrix effects, experiments II, I and V, respectively, yielded matrix effects from −20 to +20% for more than 40% of the of pesticides and mycotoxins. In experiments I and II, the lower matrix effects can be explained by the smaller amount of sample used for extraction, 5 g instead of the 10 g. As less sample was extracted, less matrix interferers were available for co-extraction. In experiment V, the liquid nitrogen freezing out may have played a key role in reducing matrix effects for the mycotoxins. For pesticides, the liquid nitrogen clean-up was not able to overcome matrix effects, but it seems to have improved recoveries of some target pesticides, which is of utmost importance to achieve lower limits of quantification.
The worth results were obtained in experiment IV both for pesticides and mycotoxins. In this experiment, 10 g of sample was slurried with 10 g of water, and subsequently extracted with unbuffered QuEChERS. Apparently, the lack of the buffering step caused low recoveries (<70%) for many compounds, in special for target pesticides as buprofezin, diazinon, imidacloprid and pyrimethanil, besides the mycotoxins, aflatoxin G2 and citrinin. In addition, experiment IV was the one that presented the highest matrix effects.
In general, approaches of experiments I and V provided the best results of recovery and RSD and lower matrix effects. However for the pesticides, approach of experiment V yielded the best recovery results for the lowest spike concentration (10 μg kg−1). Moreover, approach of experiment V (acetate QuEChERS) uses only two salts, one for buffering and one to removing water, while approach of experiment I (citrate QuEChERS) uses 2 salts for buffering and 2 to remove water, being more time, work and money costly per extracted sample. Therefore, acetate QuEChERS was chosen for validation.
Validation of the analytical method
| Number of pesticides (% of pesticides) | Number of mycotoxins (% of mycotoxins) | ||||
|---|---|---|---|---|---|
| Standards in acetonitrile | Matrix-matched standards | Standards in acetonitrile | Matrix-matched standards | ||
| r2 | ≥0.990 | 144 (96.0%) | 143 (95.3%) | 6 (85.7%) | 6 (85.7%) |
| From 0.980 to 0.989 | 4 (2.7%) | 6 (4.0%) | 0 (0.0%) | 0 (0.0%) | |
| From 0.950 to 0.979 | 2 (1.3%) | 1 (0.7%) | 1 (14.3%) | 1 (14.3%) | |
| Linear range (μg L−1) | Pesticides: from 1 to 75 mycotoxins G1: from 1 to 50 | 34 (22.5%) | 30 (19.9%) | 4 (57.1%) | 3 (42.8%) |
| Pesticides: from 5 to 75 mycotoxins G1: from 5 to 50 | 112 (74.8%) | 111 (74.2%) | 1 (14.3%) | 2 (28.6%) | |
| Pesticides: from 10 to 75 mycotoxins G2: from 50 to 2500 | 4 (2.7%) | 9 (5.9%) | 1 (14.3%) | 1 (14.3%) | |
| Pesticides: from 25 to 75 mycotoxins G2: from 250 to 2500 | 0 (0.0%) | 0 (0.0%) | 1 (14.3%) | 1 (14.3%) | |
| Matrix effects | Within the range of ±20% | 46 (30.7%) | 1 (14.3%) | ||
| Outside the range of ±20% | 104 (69.3%) | 6 (85.7%) | |||
Determination coefficients and the deviations of back-calculated concentrations from true concentrations were calculated to estimate the fit of calibration curves into the linear function for all standards of the calibration curves. In case of the calculated deviation was out of range of ±20% for any specific calibration standard, this one was considered as not belonging to the calibration curve.11 In this study, the calibration curves of all pesticides and mycotoxins had at least 5 calibration points (standards) for r2 and the linear range estimation.
Empirically, calculated deviations outside the range of ± 20% are often observed at the lowest calibration points, which may then be removed from calibration curves for a better fit into the linear model.
As shown in Table 1, the calibration curves of more than 95.0% of the pesticides and 85.7% of the mycotoxins presented determination coefficients ≥0.990 that represents a proper fit to the linear function. A smaller percentage of the studied pesticides and mycotoxins presented determination coefficients in the range of 0.950 to 0.989, which is still considered acceptable for quantification purposes.
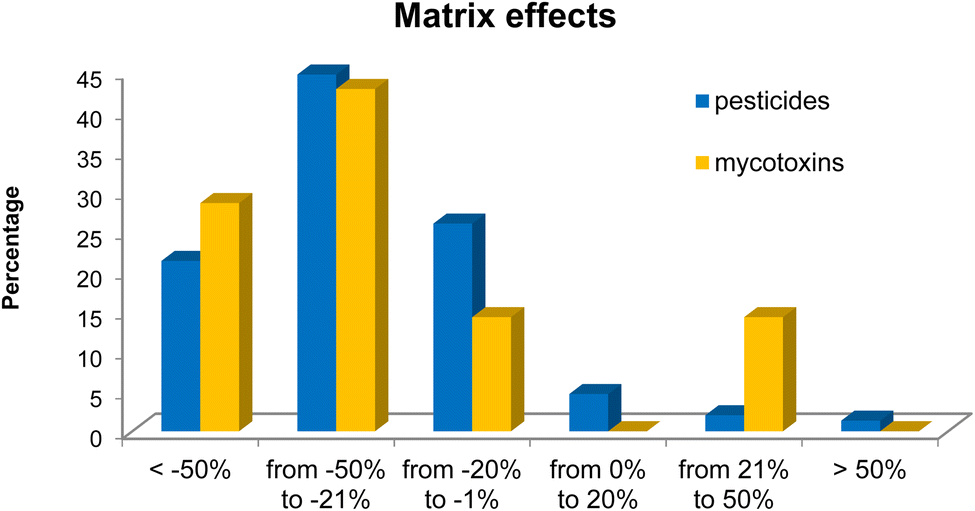 | ||
| Fig. 3 Results of matrix effects for the studied pesticides and mycotoxins. | ||
| Pesticide | Spike concentrations | ||||||||
|---|---|---|---|---|---|---|---|---|---|
| 10 μg kg−1 | 20 μg kg−1 | 50 μg kg−1 | 70 μg kg−1 | LOQ | |||||
| Rec. (%) | RSD (%) | Rec. (%) | RSD (%) | Rec. (%) | RSD (%) | Rec. (%) | RSD (%) | (μg kg−1) | |
| a n.f.r.: Not fulfilling requirements for quantitative method (recovery: 70–120% and RSD ≤ 20%); n.d.: not detected. b I.I.S.: instrument internal standard; P.I.S.: procedure internal standard. | |||||||||
| Acephate | 109 | 5 | 101 | 6 | 89 | 6 | 89 | 16 | 10 |
| Acetamiprid | 112 | 5 | 98 | 3 | 97 | 3 | 98 | 3 | 10 |
| Acetochlor | 99 | 7 | 77 | 7 | 80 | 11 | 98 | 7 | 10 |
| Aldicarbe sulfone | 117 | 4 | 105 | 5 | 97 | 2 | 80 | 8 | 10 |
| Aldicarbe sulfoxide | n.d. | n.d. | 72 | 45 | 51 | 15 | 44 | 13 | n.f.r. |
| Atrazine | 107 | 3 | 96 | 2 | 94 | 2 | 80 | 9 | 10 |
| Azamethiphos | 118 | 6 | 101 | 5 | 99 | 7 | 81 | 9 | 10 |
| Azinphos-methyl | 87 | 9 | 103 | 13 | 107 | 5 | 93 | 12 | 10 |
| Azoxystrobin | 119 | 4 | 109 | 2 | 111 | 4 | 90 | 9 | 10 |
| Benfuracarb | 170 | 87 | 90 | 66 | 121 | 76 | 85 | 77 | n.f.r. |
| Bifenazate | 97 | 8 | 91 | 9 | 95 | 8 | 75 | 14 | 10 |
| Bitertanol | 107 | 12 | 92 | 8 | 95 | 10 | 79 | 12 | 10 |
| Boscalid | 92 | 11 | 94 | 3 | 98 | 6 | 78 | 15 | 10 |
| Bromuconazol | 102 | 10 | 90 | 3 | 92 | 3 | 81 | 13 | 10 |
| Bupirimate | 104 | 4 | 97 | 4 | 98 | 3 | 81 | 12 | 10 |
| Buprofezin | 97 | 3 | 83 | 3 | 81 | 8 | 80 | 3 | 10 |
| Cadusaphos | 97 | 3 | 87 | 11 | 97 | 18 | 94 | 15 | 10 |
| Carbaryl | 106 | 9 | 98 | 8 | 97 | 8 | 99 | 8 | 10 |
| Carbendazim | n.d. | n.d. | n.d. | n.d. | 13 | 70 | 13 | 49 | n.f.r. |
| Carbofuran | 114 | 9 | 118 | 5 | 115 | 9 | 117 | 4 | 10 |
| Carpropamid | 104 | 15 | 88 | 8 | 91 | 9 | 95 | 10 | 10 |
| Chlorfenvinphos | 107 | 14 | 96 | 12 | 104 | 12 | 104 | 13 | 10 |
| Chlorpyrifos | 87 | 47 | 72 | 19 | 85 | 15 | 70 | 9 | 20 |
| Clofentezine | 84 | 63 | 74 | 38 | 75 | 19 | 84 | 17 | 50 |
| Clothianidin | 118 | 10 | 105 | 3 | 105 | 3 | 107 | 5 | 10 |
| Cyazofamid | 116 | 11 | 98 | 15 | 119 | 6 | 118 | 9 | 10 |
| Cyproconazole | 82 | 11 | 93 | 7 | 94 | 5 | 98 | 3 | 10 |
| Cyprodinil | 73 | 9 | 72 | 5 | 71 | 4 | 74 | 1 | 10 |
| Demeton-S-methylsulfone | 115 | 6 | 100 | 3 | 100 | 3 | 101 | 4 | 10 |
| Diazinon | 93 | 9 | 91 | 4 | 93 | 7 | 95 | 7 | 10 |
| Dichlofluanid | n.d. | n.d. | n.d. | n.d. | 105 | 17 | 99 | 17 | 50 |
| Diethofencarb | 101 | 8 | 101 | 6 | 104 | 6 | 101 | 4 | 10 |
| Difenconazole | 101 | 3 | 86 | 4 | 83 | 7 | 84 | 3 | 10 |
| Diphenylamine | 98 | 13 | 89 | 7 | 78 | 6 | 77 | 7 | 10 |
| Diflubenzuron | n.d. | n.d. | 47 | 71 | 79 | 17 | 72 | 11 | 50 |
| Dimethoate | 114 | 3 | 98 | 2 | 97 | 2 | 100 | 2 | 10 |
| Dimethomorph | 108 | 4 | 101 | 4 | 102 | 5 | 101 | 4 | 10 |
| Diniconazole | 98 | 14 | 86 | 11 | 88 | 13 | 89 | 12 | 10 |
| Diuron | 102 | 13 | 101 | 6 | 101 | 5 | 102 | 2 | 10 |
| Epoxiconazole | 104 | 6 | 104 | 5 | 101 | 5 | 99 | 3 | 10 |
| Ethion | 87 | 13 | 80 | 9 | 84 | 8 | 81 | 3 | 10 |
| Ethirimol | 81 | 4 | 71 | 5 | 57 | 3 | 55 | 5 | 10 |
| Etofenprox | 110 | 13 | 92 | 16 | 72 | 8 | 70 | 6 | 10 |
| Ethoprophos | 90 | 8 | 94 | 7 | 96 | 8 | 90 | 7 | 10 |
| Ethiprole | 104 | 12 | 113 | 7 | 119 | 6 | 119 | 5 | 10 |
| Etoxazole | 87 | 3 | 81 | 3 | 79 | 3 | 78 | 3 | 10 |
| Fenamidone | 116 | 6 | 103 | 4 | 103 | 5 | 103 | 5 | 10 |
| Fenamiphos | 98 | 10 | 104 | 5 | 109 | 9 | 102 | 8 | 10 |
| Fenarimol | 95 | 8 | 90 | 7 | 82 | 11 | 85 | 7 | 10 |
| Fenazaquin | 68 | 2 | 60 | 3 | 57 | 6 | 57 | 4 | 10 |
| Fenbuconazole | 91 | 18 | 97 | 12 | 94 | 9 | 93 | 9 | 10 |
| Fenhexamid | 110 | 16 | 91 | 10 | 92 | 10 | 92 | 7 | 10 |
| Fenobucarb | 105 | 4 | 102 | 7 | 104 | 2 | 103 | 4 | 10 |
| Fenoxycarb | 94 | 15 | 95 | 6 | 97 | 9 | 104 | 11 | 10 |
| Fenpropimorph | 70 | 2 | 63 | 3 | 63 | 3 | 63 | 2 | 10 |
| Fenpyroximate | 81 | 4 | 72 | 3 | 70 | 3 | 71 | 3 | 10 |
| Fensulfothion | 103 | 7 | 120 | 7 | 119 | 4 | 114 | 1 | 10 |
| Fluazifop-butyl | 107 | 4 | 94 | 4 | 93 | 5 | 94 | 4 | 10 |
| Fludioxonil | 227 | 5 | 206 | 4 | 199 | 4 | 190 | 4 | n.f.r. |
| Flufenoxuron | 93 | 15 | 96 | 17 | 93 | 10 | 93 | 8 | 10 |
| Fluquiconazole | 97 | 14 | 95 | 9 | 94 | 9 | 90 | 9 | 10 |
| Flusilazole | 92 | 11 | 94 | 3 | 98 | 6 | 94 | 7 | 10 |
| Flutolanil | 109 | 13 | 103 | 8 | 105 | 9 | 100 | 8 | 10 |
| Flutriafol | 118 | 7 | 113 | 11 | 108 | 9 | 108 | 8 | 10 |
| Fostiazato | 119 | 4 | 105 | 4 | 102 | 4 | 103 | 5 | 10 |
| Furalaxyl | 115 | 7 | 108 | 5 | 108 | 4 | 107 | 4 | 10 |
| Furathiocarb | 90 | 7 | 90 | 4 | 94 | 10 | 90 | 6 | 10 |
| Halofenozide | 105 | 12 | 107 | 14 | 114 | 7 | 109 | 10 | 10 |
| Haloxyfop-2-ethoxyethyl | 95 | 11 | 95 | 6 | 96 | 9 | 97 | 7 | 10 |
| Hexaconazole | 88 | 7 | 84 | 9 | 86 | 10 | 85 | 8 | 10 |
| Hexythiazox | 94 | 12 | 76 | 10 | 70 | 3 | 72 | 8 | 10 |
| Imazalil | 82 | 2 | 76 | 3 | 79 | 1 | 79 | 2 | 10 |
| Imazapic | 15 | 3 | 11 | 5 | 11 | 2 | 12 | 4 | n.f.r. |
| Imidacloprid | 120 | 3 | 105 | 1 | 102 | 2 | 103 | 3 | 10 |
| Indoxacarb | 116 | 14 | 103 | 18 | 94 | 19 | 94 | 19 | 10 |
| Iprovalicarb | 108 | 7 | 103 | 2 | 107 | 6 | 102 | 4 | 10 |
| Kresoxim-methyl | 119 | 10 | 110 | 10 | 111 | 16 | 105 | 11 | 10 |
| Linuron | 83 | 16 | 90 | 17 | 109 | 12 | 101 | 10 | 10 |
| Malathion | 119 | 6 | 111 | 10 | 112 | 6 | 115 | 7 | 10 |
| Mecarbam | 107 | 12 | 105 | 14 | 108 | 17 | 102 | 14 | 10 |
| Mepanipyrim | 71 | 11 | 76 | 9 | 79 | 9 | 102 | 14 | 10 |
| Metalaxil | 117 | 2 | 102 | 2 | 100 | 1 | 100 | 3 | 10 |
| Metconazole | 101 | 5 | 87 | 5 | 84 | 5 | 86 | 3 | 10 |
| Methamidophos | 88 | 6 | 79 | 3 | 79 | 3 | 77 | 3 | 10 |
| Methidathion | 90 | 16 | 116 | 12 | 117 | 6 | 116 | 8 | 10 |
| Methiocarb | 103 | 9 | 98 | 4 | 100 | 4 | 101 | 4 | 10 |
| Methiocarb sulfone | 95 | 13 | 87 | 5 | 82 | 4 | 85 | 5 | 10 |
| Methiocarb sulfoxide | n.d. | n.d. | n.d. | n.d. | n.d. | n.d. | n.d. | n.d. | n.d. |
| Methomyl | 108 | 3 | 95 | 3 | 95 | 3 | 96 | 3 | 10 |
| Methoxyfenozide | 309 | 8 | 270 | 6 | 255 | 6 | 241 | 7 | n.f.r. |
| Monocrotophos | 105 | 15 | 86 | 8 | 81 | 6 | 81 | 5 | 10 |
| Myclobutanil | 108 | 12 | 106 | 14 | 108 | 10 | 104 | 8 | 10 |
| Nitenpyram | 83 | 16 | 92 | 14 | 72 | 19 | 76 | 11 | 10 |
| Ofurace | 115 | 5 | 105 | 3 | 104 | 3 | 106 | 4 | 10 |
| Omethoate | 100 | 8 | 84 | 6 | 76 | 6 | 77 | 6 | 10 |
| Oxadixyl | 107 | 5 | 90 | 4 | 85 | 3 | 85 | 4 | 10 |
| Oxamyl | 120 | 3 | 105 | 4 | 101 | 3 | 101 | 3 | 10 |
| Paclobutrazol | 97 | 7 | 102 | 5 | 107 | 5 | 104 | 3 | 10 |
| Penconazole | 89 | 15 | 88 | 10 | 93 | 9 | 93 | 7 | 10 |
| Pencycuron | 90 | 9 | 84 | 9 | 91 | 11 | 91 | 10 | 10 |
| Pendimethalin | 88 | 13 | 73 | 12 | 71 | 8 | 71 | 4 | 10 |
| Phenothrin | 100 | 8 | 70 | 9 | 67 | 2 | 65 | 5 | 10 |
| Phenthoate | n.d. | n.d. | n.d. | n.d. | n.d. | n.d. | n.d. | n.d. | n.d. |
| Phosalon | n.d. | n.d. | 114 | 19 | 96 | 19 | 106 | 19 | 20 |
| Phosmet | 71 | 16 | 105 | 13 | 116 | 7 | 111 | 7 | 10 |
| Picoxystrobin | 112 | 6 | 105 | 6 | 106 | 6 | 108 | 5 | 10 |
| Piperonyl butoxide | 95 | 4 | 87 | 5 | 89 | 3 | 87 | 5 | 10 |
| Pirazophos | 94 | 20 | 90 | 7 | 101 | 16 | 98 | 17 | 10 |
| Pirimicarb | 10 | 3 | 4 | 18 | 1 | 1 | 2 | 2 | n.f.r. |
| Pirimiphos-methyl | 85 | 10 | 85 | 6 | 88 | 9 | 87 | 7 | 10 |
| Pirimiphos-ethyl | 93 | 6 | 80 | 5 | 80 | 7 | 78 | 6 | 10 |
| Prochloraz | 81 | 4 | 88 | 3 | 91 | 4 | 94 | 3 | 10 |
| Profenofos | 98 | 9 | 74 | 10 | 75 | 12 | 74 | 10 | 10 |
| Prometryn | 88 | 2 | 78 | 2 | 75 | 1 | 75 | 3 | 10 |
| Propamocarb | 35 | 5 | 35 | 3 | 37 | 2 | 37 | 3 | n.f.r. |
| Propanil | n.d. | n.d. | n.d. | n.d. | 94 | 14 | 94 | 17 | 50 |
| Propargite | 92 | 9 | 83 | 8 | 79 | 6 | 81 | 7 | 10 |
| Propham | 105 | 13 | 99 | 8 | 98 | 6 | 100 | 6 | 10 |
| Propiconazole | 89 | 13 | 88 | 11 | 91 | 12 | 94 | 8 | 10 |
| Propyzamide | 107 | 12 | 92 | 7 | 85 | 11 | 88 | 6 | 10 |
| Propoxur (I.I.S.) | — | 2 | — | 3 | — | 8 | — | 5 | — |
| Pyraclostrobin | 98 | 5 | 89 | 4 | 89 | 7 | 92 | 7 | 10 |
| Pyridaben | 118 | 4 | 91 | 4 | 77 | 8 | 74 | 6 | 10 |
| Pyrimethanil | 90 | 4 | 83 | 2 | 80 | 2 | 80 | 3 | 10 |
| Pyriproxyfen | 101 | 3 | 80 | 3 | 71 | 3 | 71 | 4 | 10 |
| Quinalphos (P.I.S.) | 99 | 5 | 84 | 4 | 77 | 1 | 77 | 2 | — |
| Quinoxyfen | 112 | 15 | 86 | 18 | 78 | 11 | 82 | 8 | 10 |
| Simazine | 89 | 3 | 78 | 3 | 73 | 3 | 75 | 2 | 10 |
| Spinosyn D | 51 | 6 | 50 | 10 | 58 | 3 | 64 | 5 | 10 |
| Spinosyn A | 56 | 4 | 54 | 8 | 61 | 8 | 67 | 2 | 10 |
| Spirodiclofen | 84 | 9 | 82 | 7 | 79 | 10 | 78 | 8 | 10 |
| Spiromesifen | 98 | 11 | 87 | 9 | 86 | 12 | 85 | 10 | 10 |
| Spiroxamine | 73 | 2 | 70 | 3 | 73 | 2 | 75 | 1 | 10 |
| Tau-fluvalinate | n.d. | n.d. | 101 | 16 | 87 | 13 | 93 | 10 | 20 |
| Tebuconazole | 75 | 8 | 90 | 8 | 92 | 7 | 90 | 9 | 10 |
| Tebufenoxide | 117 | 10 | 109 | 11 | 118 | 13 | 111 | 9 | 10 |
| Tebufenpyrad | 73 | 7 | 72 | 15 | 71 | 7 | 75 | 9 | 10 |
| Tetrachlorvinphos | 113 | 9 | 97 | 10 | 100 | 8 | 98 | 9 | 10 |
| Tetraconazole | 111 | 4 | 101 | 6 | 102 | 4 | 101 | 7 | 10 |
| Tetramethrin | 85 | 14 | 82 | 7 | 83 | 8 | 82 | 6 | 10 |
| Thiabendazole | 92 | 7 | 73 | 9 | 72 | 12 | 70 | 12 | 10 |
| Thiacloprid | 117 | 6 | 107 | 2 | 100 | 3 | 102 | 3 | 10 |
| Thiamethoxam | 72 | 110 | 53 | 49 | 54 | 29 | 49 | 19 | n.f.r. |
| Thiodicarb | 112 | 4 | 99 | 3 | 97 | 3 | 97 | 3 | 10 |
| Thiophanate-methyl | n.d. | n.d. | n.d. | n.d. | n.d. | n.d. | n.d. | n.d. | n.d. |
| Triadimefon | 110 | 5 | 93 | 8 | 91 | 6 | 86 | 7 | 10 |
| Triadimenol | 74 | 107 | 64 | 43 | 99 | 15 | 92 | 6 | 50 |
| Triazophos | 116 | 10 | 102 | 8 | 103 | 11 | 100 | 11 | 10 |
| Trifloxystrobin | 91 | 19 | 89 | 10 | 94 | 10 | 91 | 7 | 10 |
| Triflumizole | 92 | 4 | 87 | 4 | 89 | 6 | 90 | 5 | 10 |
| Triticonazole | 90 | 14 | 89 | 7 | 92 | 3 | 94 | 3 | 10 |
| Zoxamide | 85 | 8 | 89 | 19 | 87 | 19 | 92 | 17 | 10 |
| Mycotoxin | Group | Spike concentrations | ||||||||
|---|---|---|---|---|---|---|---|---|---|---|
| G1: 2 μg kg−1 | G1: 10 μg kg−1 | G1: 20 μg kg−1 | G1: 30 μg kg−1 | LOQ (μg kg−1) | ||||||
| G2: 100 μg kg−1 | G2: 500 μg kg−1 | G2: 1000 μg kg−1 | G2: 1500 μg kg−1 | |||||||
| Rec. (%) | RSD (%) | Rec. (%) | RSD (%) | Rec. (%) | RSD (%) | Rec. (%) | RSD (%) | |||
| a n.f.r.: Not fulfilling requirements for quantitative method (recoveries from 70–120% and RSD ≤ 20%); n.d.: not detected. | ||||||||||
| Aflatoxin B1 | 1 | 119 | 7 | 105 | 7 | 95 | 3 | 95 | 9 | 2 |
| Aflatoxin B2 | 1 | n.d. | n.d. | 113 | 6 | 98 | 3 | 95 | 4 | 10 |
| Aflatoxin G1 | 1 | 106 | 16 | 117 | 8 | 95 | 5 | 91 | 8 | 2 |
| Aflatoxin G2 | 1 | 111 | 12 | 104 | 4 | 92 | 5 | 93 | 3 | 2 |
| Citrinin | 2 | n.d. | n.d. | 76 | 4 | 93 | 1 | 93 | 3 | 500 |
| Ochratoxin A | 1 | 32 | 63 | 36 | 11 | 35 | 12 | 34 | 7 | n.f.r. |
| Zearalenone | 2 | n.d. | n.d. | 99 | 13 | 97 | 14 | 98 | 10 | 500 |
Considering Table 2, it is possible to observe that from a total of 150 pesticides, 138 (92%) fulfilled the validation requirements and were consequently successfully validated. While 10 pesticides (6.7%) did not fulfil validation requirements due to recoveries outside the range of 70–120% and/or RSD > 20% and 2 (1.3%) were not detected at any of the spike concentrations studied.
As summarized in Table 3, 6 (85.7%) mycotoxins out of 7 met validation requirements. Only one, ochratoxin A (14.3%), was not validated due to too low recoveries, despite it was still detectable at concentrations ≥10 μg kg−1.
The low recoveries (<40%) obtained for ochratoxin A may be explained by two factors: the pH of the extraction solution and the clean-up step. The authors know already from previous studies38 that some mycotoxins are affected by the pH of the extraction solvent and can also be retained in clean-up adsorbents, resulting in low recoveries.
As described before, limits of quantification were stated according to SANTE11 criteria, which considers the LOQ the lowest concentration of the analyte that has been validated with acceptable accuracy. For pesticides (Table 2) the LOQ was of 10 μg kg−1, 20 μg kg−1 and 50 μg kg−1 for 130 (86.7%); 3 (2.0%) and 5 (3.3%) of the pesticides, respectively. The other 12 pesticides (8%) did not fulfil validation requirements or were not detected at any spike concentration studied.
In Brazil, a total of 21 pesticides are allowed by law for the olive culture. The MRL are in the range of 0.01 to 5 mg kg−1 depending on the pesticide.39 From the 21 regulated pesticides, 12 were covered by the method of this study and 11 were successfully validated presenting LOQ ≤ MRL for olives (Tables 2 and ESI S2†). The method is suitable for assessing compliance of these 11 pesticides with the MRL in olives and the other 127 validated pesticides can contaminate olives either by illegal use or by drift, when they are applied to other cultures grown close to olives groves, playing an important key role in the method.
Thiophanate-methyl, which is regulated in Brazil and covered by the method, did not meet validation requirements because it was not detected in recovery experiments. Thiophanate-methyl is a tricky pesticide. It belongs to the group of the benzimidazol fungicides and may suffer degradation into carbendazim.40
Within the EU the number of compounds (pesticides, growth regulators, metabolites, etc.) allowed for olive plantation is over 500, with MRL ranging from 0.003 to 20 mg kg−1.41 The method of this study covers 132 pesticides (ESI Table S2†) which are regulated in the EU law and, from these, 114 pesticides have a suitable LOQ (LOQ ≤ MRL) to assess compliance to the European MRL for olives. Just eight pesticides presented LOQ > MRL. However, they are still detectable.
In addition, from those 138 pesticides which were successfully validated in this study, 15 are not approved for use in the EU and 1 (piperonyl butoxide) was not yet assessed at the EU level. These pesticides can contaminate olives by illegal use and/or drift.
Table 3 summarizes LOQ for mycotoxins. The LOQ was stated at 2 μg kg−1 for 3 (42.8%) and at 10 μg kg−1 for 1 (14.3%) mycotoxin of G1. Both mycotoxins of G2 (28.6%) had LOQs of 500 μg kg−1. Neither the Brazilian legislation nor the EU legislation establishes maximum levels (ML) for mycotoxins in table olives.42,43
Quality control using internal standards
Quinalphos was used as the P.I.S. and it was spiked to the samples previously to extraction. A P.I.S. is added to the analytical test portion prior to the extraction step to account for various sources of errors throughout all stages in the method.11 In the present study, recoveries and RSD were calculated for quinalphos to monitor possible errors. As shown in Table 2, quinalphos presented recoveries in the range of 77 to 99% with associated RSD from 1 to 5%, which meets the acceptance criteria and demonstrates the correct execution of the method.Propoxur was used as the I.I.S. and was added to the final dilution solvent. RSD among propoxur's peak areas were calculated. According to SANTE,11 an I.I.S. is added to the final extracts, just prior to injection to allow a check and possible correction for variations in the injection volume. Propoxur presented an RSD from 2 to 8% for the 4 spike concentrations, representing an acceptable variation in the samples injection volume.
Sample analysis
Some commercial table olive samples were analyzed with the validated method aiming to assess compliance with the MRL. From 11 samples, 4 tested positive for pesticides.Buprofezin was found in 2 samples at 0.010 mg kg−1 in the first sample, and at 0.033 mg kg−1 in the second one. This pesticide is not allowed for the crop in Brazil, consequently both samples violate the Brazilian law. In EU buprofezin is allowed for olives up to the MRL of 0.01 mg kg−1. Thereby, the last sample violates also the EU law.
Another 2 samples tested positive for buprofezin and pyrimethanil. The concentration of buprofezin was below the LOQ in the samples. Pyrimethanil was found at 0.014 mg kg−1 in one sample and below the LOQ in the other one. Both samples violate the Brazilian law, although they are in accordance with the MRL of the EU (ESI Table S2†). The chromatograms of some positive samples are shown in ESI Fig. S1.†
These results reinforce the need of monitoring pesticide residues in processed commodities in order to ensure food safety and compliance with the good agricultural practices. Moreover, concerning the olive cultivation demand in Brazil, a revision and update of the Brazilian legislation seems to be necessary to attend pests control actions in olive groves.
Regarding the studied mycotoxins, even with reports in literature of mycotoxins occurrence in table olives,23–25 none of the samples analyzed in this study tested positive for mycotoxins.
Conclusions
Results of the method optimization experiments demonstrated that the three versions of QuEChERS approach were able to provide satisfactorily recoveries for more than 60% of the pesticides and mycotoxins studied. In general, citrate and unbuffered QuEChERS yielded better recoveries for mycotoxins while acetate QuEChERS provided better results for pesticides, especially at the target LOQ level of 10 μg kg−1. Extraction of 5 g of sample, instead of 10 g, was advantageous in terms of lower matrix effects. However, by extracting 10 g of sample it was possible to achieve lower limits of quantification. The liquid nitrogen freezing out clean-up apparently played a key role in reducing matrix effects for mycotoxins and improved recoveries of some target pesticides. Based on these results, the approach of experiment V (acetate QuEChERS with liquid nitrogen for clean-up) was chosen for validation.In the validation study, the analytical method presented satisfactory accuracy and precision for the majority of the studied compounds. From 150 pesticides, 92% were successfully validated. Concerning the 7 mycotoxins, 85.7% met validation requirements.
Finally, by the analysis of 11 commercial table olive samples it was possible to demonstrate the contamination of 4 of them with pesticide residues. Buprofezin was detected in all positive samples and pyrimethanil was detected in 2 of them. All the positive samples violate the Brazilian law and one sample also violates the EU law. Such results demonstrate the importance of food safety actions and the need of stricter enforcement of pesticide residues in table olives. Considering that the olive cultivation is growing a lot in Brazil, a revision of the policy for pesticides and its concentrations (MRL) allowed for this commodity seems to be necessary to meet cultivation's challenges.
Author contributions
Bárbara Reichert: methodology, investigation, validation, data processing, sample analysis, writing – original draft. Ionara Regina Pizzutti: supervision, writing – review and editing. Bárbara Daiana Jänisch: methodology, investigation and validation. Marlos Eduardo Zorzella Fontana: methodology, investigation, validation and data processing.Conflicts of interest
There are no conflicts to declare.Acknowledgements
The authors acknowledge funding support from Agilent Technologies.References
-
International Olive Council (IOC), World Olive Encyclopedia, EGDSA-Sabadell, Madrid, Spain, 1996, ch. 2, p. 61 Search PubMed
.
- T. H. Borges, J. A. Pereira, C. Cabrera-Vique, L. Lara, A. F. Oliveira and I. Seiquer, Food Chem., 2017, 215, 454–462 CrossRef CAS PubMed
-
W. Smith, Olives and Olive Oil, The Encyclopedia of Archaeological Sciences, John Wiley & Sons, 2018. https://onlinelibrary.wiley.com/doi/10.1002/9781119188230.saseas0419#, accessed January 28th, 2024 Search PubMed
-
F. Villa and A. F. Oliveira, Origem e Expansão da Oliveira na América Latina, in Oliveira no Brasil. Tecnologias de Produção, ed. Oliveira, A. F., Belo Horizonte. EPAMIG, 2012, pp. 21–38 Search PubMed
- P. F. Filoda, F. C. Chaves, J. F. Hoffmann and C. V. Rombaldi, Rev. Bras. Frutic., 2021, 43, 1–23 Search PubMed
- Food and Agriculture Organization of the United Nations (FAO), FAOSTAT. Data. Crops and livestock products, 2024, https://www.fao.org/faostat/en/#data, accessed January 30th.
- International Olive Council (IOC), Consumption, 2023, https://www.internationaloliveoil.org/wp-content/uploads/2020/12/IOC-Table-Olive-Dashboard-December-2020.html#consumption-1, accessed December 10th.
- E. Hakme, A. Lozano, C. Ferrer, F. J. Díaz-Galiano and A. R. Fernández-Alba, TrAC, Trends Anal. Chem., 2018, 100, 167–179 CrossRef CAS
- H. Lin, L. Ni, H. Chen and W. Xu, Anal. Chim. Acta, 2022, 1232, 340451 CrossRef CAS PubMed
- F. Shavakhi, A. Rahmani and Z. Piravi-Vanak, J. Food Sci. Technol., 2023, 60, 1255–1264 CrossRef CAS PubMed
-
European Commission, Analytical Quality Control and Method Validation Procedures for Pesticide Residues Analysis in Food and Feed, SANTE/11312/2021, 2021 Search PubMed
- J. F. García-Reyes, C. Ferrer, M. J. Gómez-Ramos, A. Molina-Díaz and A. R. Fernández-Alba, Trac. Trends Anal. Chem., 2007, 26, 239–251 CrossRef
- B. Gilbert-López, J. F. García-Reyes and A. Molina-Díaz, Talanta, 2009, 79, 109–128 CrossRef PubMed
- M. E. Schiano, F. Sodano, C. Cassiano, E. Magli, S. Seccia, M. G. Rimoli and S. Albrizio, Food Chem., 2024, 442, 138498 CrossRef PubMed
- M. García-Vara, C. Postigo, P. Palma, M. J. Bleda and M. L. de Alda, Food Chem., 2022, 386, 132558 CrossRef PubMed
- A. Arena, M. Zoccali, L. Mondello and P. Q. Tranchida, Anal. Bioanal. Chem., 2023, 415, 2459–2469 CrossRef CAS PubMed
- S. Soltani, H. Sereshti and N. Nouri, Talanta, 2021, 225, 121983 CrossRef CAS PubMed
- I. N. Tarawneh, A. A. Najjar, F. F. Salameh and R. S. Bani Issa, J. Liq. Chromatogr. Relat. Technol., 2020, 43, 819–826 CrossRef CAS
- D. Moreno-González, J. Alcántara-Durán, S. M. Addona and M. Beneito-Cambra, J. Liq. Chromatogr., 2018, 1562, 27–35 Search PubMed
- J. V. Dias, V. Cutillas, A. Lozano, I. R. Pizzutti and A. F. Fernández-Alba, J. Liq. Chromatogr., 2016, 1462, 8–18 CAS
- C. Anagnostopoulos and G. E. Miliadis, Talanta, 2013, 112, 1–10 CrossRef CAS PubMed
- S. F. Taghizadeh, M. Azizi, R. Rezaee, J. P. Giesy and G. Karimi, Environ. Sci. Pollut. Res., 2021, 28, 39723–39741 CrossRef CAS PubMed
- C. El Adlouni, M. Tozlovanu, F. Naman, M. Faid and A. P. Leszkowicz, Mol. Nutr. Food Res., 2006, 50, 507–512 CrossRef CAS PubMed
- L. Franzetti, M. Scarpellini, A. Vecchio and D. Planeta, Ann. Microbiol., 2011, 61, 843–851 CrossRef CAS
- A. M. Aly Khalil, A. H. Hashem and A. M. Abdelaziz, Biocatal. Agric. Biotechnol., 2019, 21, 101314 CrossRef
- J. Zhou, S. S. Yao, J. M. Wang, X. H. Chen, C. Qin, M. C. Jin, D. D. Zhang, J. J. Xu and Z. X. Cai, Food Chem., 2023, 426, 136629 CrossRef CAS PubMed
- F. Pradanas-González, R. Aragoneses-Cazorla, M. A. Merino-Sierra, E. Andrade-Bartolomé, F. Navarro-Villoslada, E. Benito-Peña and M. C. Moreno-Bondi, Food Chem., 2023, 429, 136846 CrossRef PubMed
- J. L. Hidalgo-Ruiz, R. Romero-Gonzalez, J. L. Martinez Vidal and A. Garrido Frenich, Food Chem., 2019, 288, 22–28 CrossRef CAS PubMed
- S. Li, S. Zhang, X. Li, S. Zhou, J. Ma, X. Zhao, Q. Zhang and X. Yin, Food Chem.: X, 2023, 20, 100887 CAS
- H. Lin, L. Ni, H. Chen and W. Xu, Anal. Chim. Acta, 2022, 1232, 340451 CrossRef CAS PubMed
- R. Ferracane, A. Tafuri, A. Logieco, F. Galvano, D. Balzano and A. Ritieni, Food Addit. Contam., 2007, 24, 173–180 CrossRef CAS PubMed
- A. Papachristou and P. Markaki, Food Addit. Contam., 2004, 21, 85–92 CrossRef CAS PubMed
- T. Moya-Cavas, F. Navarro-Villoslada, J. L. Urraca, L. A. Serrano, G. Orellana and M. C. Moreno-Bondi, Food Chem., 2023, 412, 135536 CrossRef PubMed
- E. Fuentes, M. E. Baéz and J. Díaz, Food Addit. Contam.: Part B, 2010, 3, 101–107 CrossRef CAS PubMed
- Z. Likudis, V. Costarelli, A. Vitoratos and C. Apostolopoulos, Int. J. Food Sci. Technol., 2014, 49, 484–492 CrossRef CAS
- H. Stahnke, S. Kittlaus, G. Kempe and L. Alder, Anal. Chem., 2012, 84, 1474–1482 CrossRef CAS PubMed
- M. M. Gómez-Ramos, Ł. Rajski, A. Lozano and A. R. Fernández-Alba, Anal. Methods, 2016, 8, 4664–4673 RSC
- B. Reichert, A. de Kok, I. R. Pizzutti, J. Scholten, C. D. Cardoso and M. Spanjer, Anal. Chim. Acta, 2018, 1004, 40–50 CrossRef CAS PubMed
- Brazilian Health Regulatory Agency (ANVISA), Monografias de agrotóxicos, 2023, https://www.gov.br/anvisa/pt-br/acessoainformacao/dadosabertos/informacoes-analiticas/monografias-de-agrotoxicos, accessed December 10th.
- European Commission, EU Reference Laboratories (EURLs) for Residues of Pesticides DataPool, 2024, https://www.eurl-pesticides-datapool.eu/, accessed February 29th.
- European Commission, EU Pesticides database, 2024, https://ec.europa.eu/food/plant/pesticides/eu-pesticides-database/start/screen/products/details/59, accessed February 29th.
- European Commission, Commission Regulation (EC) No 1881/2006 Setting maximum levels for certain contaminants in foodstuffs, 2024, https://eur-lex.europa.eu/legal-content/EN/TXT/PDF/?uri=CELEX:32006R1881, accessed February 28th.
- Brazilian Health Regulatory Agency (ANVISA), Instrução Normativa N° 160/2022, 2024, https://antigo.anvisa.gov.br/documents/10181/2718376/IN_160_2022_.pdf, accessed February 10th.
Footnote |
| † Electronic supplementary information (ESI) available. See DOI: https://doi.org/10.1039/d4ay00576g |
| This journal is © The Royal Society of Chemistry 2024 |