
 Open Access Article
 This Open Access Article is licensed under a
 Creative Commons Attribution 3.0 Unported Licence
Using FT-IR as a fast method to measure fatty acid soaps in in vivo and in vitro digests
Kelly
Muijlwijk†
 ,
Anouk L.
Feitsma†
* and
William
Kloek
,
Anouk L.
Feitsma†
* and
William
Kloek
FrieslandCampina, Stationsplein 1, 3818 LE Amersfoort, the Netherlands. E-mail: anouk.feitsma@frieslandcampina.com
First published on 28th June 2024
Abstract
The objective of the current study was to develop a simple method to measure fatty acid soaps, making use of FT-IR, representative for the soap formation observed in clinical trials. Calcium soaps have a unique coordination which leads to a typical double-splitting of the antisymmetric and symmetric carboxylate peaks. Absorbance values of these carboxylate peaks were used together with the absorbance of the hydrocarbon –CH2 antisymmetric and symmetric peaks to calculate the calcium soap absorbance. Based on the linear correlation between the calcium soap absorbance and the calcium soap concentration measured with GC-FID, a model was set-up and subsequently successfully validated to quantify calcium soap concentrations in faecal samples from clinical trials with this FT-IR method. With in vivo as well as in vitro digestion an inverse correlation between the long chain saturated fatty acid part of milk fat containing fat blends used for the infant formulas, and the formation of fatty acid soaps after digestion and defaecation could be observed. There is a clear link between the amount of long chain saturated fatty acids at the sn-1/3 position and their release as free fatty acid after lipolysis with the appearance of fatty acid soaps. These insights enable future development of fat blends for infant nutrition to optimize fatty acid soap formation and thereby gut discomfort in infants. These insights can be used to predict the soap formation capacity of a newly designed fat blend and thereby the improvement of infant nutrition products.
1. Introduction
Human milk is designed by nature and is the best nutrition for healthy growth and development of babies. The fat fraction of human milk is particularly important for a developing infant. It delivers a large part of the required energy as well as essential fatty acids, fat-soluble vitamins and other bioactive components, such as phospholipids and cholesterol.1 Most of the human milk fat fraction comprises triglycerides with a specific regional distribution of the fatty acids (FA) over the glycerol backbone. Long-chain saturated fatty acids (LCSFAs), i.e., ≥C12:0 esterified at the sn-2 position, are easily absorbed during digestion in the form of monoglycerides. In contrast, LCSFAs esterified at the sn-1 or sn-3 positions (sn-1/3), are poorly absorbed after enzymatic hydrolysis because of their low water solubility. Consequently, in the alkaline environment of the small intestinal lumen, free LCSFAs interact readily with cations such as calcium to form insoluble soaps2,3 that are associated with hard stools, gut discomfort and decreased absorption of palmitic acid (PA) and minerals by the infant.3–5Different fat blends used for infant nutrition, e.g., vegetable oils from different origin and bovine milk fat, contain different levels of LCSFAs and these fatty acids are also differently distributed on the glycerol backbone. Palmitic acid, the most common LCSFA present in human milk and often also in infant nutrition, is positioned at the sn-2 position at 10–20% for commonly used vegetable oil blends and up to 40–45% when vegetable oils and milk fat are combined, while in human milk almost 70% of the palmitic acid is positioned at the sn-2 position.1,6
For the measurement of fatty acid soaps in faecal samples, a validated method based on GC-FID has been described by Quinlan et al.5 Since this is a method that is quite elaborate and specialized, involving multiple extraction steps to isolate the soaped fatty acids, an alternative method that can be performed on small samples in a relatively easy and cost-effective way was explored in the current study.
Fourier transform infrared (FT-IR) spectroscopy is a technique that can be used to measure the chemical composition in small sample amounts, and is for example also used on clinical samples such as body fluids, cells, tissues, nails and faecal samples.7 One of the possibilities with FT-IR is a detailed faecal fat analysis,8 and it is possible to measure various types of lipids including fatty acid soaps.9 Calcium soaps have a typical double-splitting of the antisymmetric carboxylate band at 1575–1580 and 1540–1542 cm−1.10,11 This double-splitting is unique for calcium soaps because of the coordination characteristics of calcium when attached to two carboxylate groups.11
A clinical trial recently conducted showed that an infant formula containing a blend of vegetable fats and oils and bovine milk fat (50%) reduced the formation of faecal fatty acid soaps and improved stool consistency compared to an infant formula with 100% vegetable fats and oils.12 Faecal samples obtained in this study were used here to compare the fatty acid soap levels measured with the GC-FID method to levels measured with the FT-IR method.
The objective of the current study was to develop a simple method to measure fatty acid soaps, representative for the soap formation observed in clinical trials. Therefore, we set-up a new method based on FT-IR and correlated these to the soap levels measured with the GC-FID method for faecal soap analysis in the faecal samples obtained from Looijesteijn et al.13 Next to this, FT-IR measurement of fatty acid soaps formed after in vitro digestion was explored. This method would enable the screening of different fat blend compositions for soap formation capacity via in vitro digestion and select the most optimal fat blend for clinical testing.
2. Materials and methods
2.1 Measurement of fatty acid soaps in faecal samples
Faecal samples from 3 infant studies were used. For the development of the FT-IR model samples from the study described in Looijesteijn et al.13 were used. This clinical trial was a single-blinded, crossover, randomized, placebo-controlled study conducted with 19 healthy, full-term, exclusively IF-fed infants.For the validation of the model, samples from two other studies were utilized. The first set of samples were derived from the clinical trial described in Manios et al.12 This was a double blind, randomized, cross-over trial with 16 healthy, term, formula-fed infants aged 9–14 weeks. The second infant study from which samples were used for validation of the model was a monocentric, randomized cross-over, double blind, referent controlled clinical trial registered as NL7047 in the Dutch trial register. All studies were approved by the local medical ethical committees and parents or caregivers of all participants signed informed consent forms. The studies were conducted in accordance with the guidelines of the Declaration of Helsinki and the International Conference on Harmonisation (ICH) guidelines on Good Clinical Practice (GCP).
Faecal samples were collected during the last three days of each of the intervention periods in faecal tube collector and immediately stored in a home freezer. Transport of the faecal samples was on dry ice. Samples were analysed at Eurofins (Madison, USA) as described below, based on the method of Quinlan et al.5 Prior to analysis of the stool samples, the samples of each subject were thawed, pooled, homogenized, and lyophilized, and the moisture content was determined gravimetrically. The dried samples were extracted by solvent reflux to obtain the neutral lipids, including non-soaped FFAs. The remaining samples were treated with acetic acid to release the soaped FA which were isolated by a second solvent reflux step. The FFAs were isolated using solid phase extraction. The FFAs were then converted to methyl esters using methanolic hydrochloric acid. The resulting FA methyl esters were analyzed using a gas chromatograph equipped with a flame ionization detector and quantitated using external standards. Total FA soaps were calculated from the sum of all measured individual FA soaps. Both FFAs and soaped FAs were reported as mg g−1 dry weight stool in the acid form.
Remaining lyophilized faecal samples were stored in a −80 °C freezer and treated with γ-radiation of 40 kGy at Synergy Health (STERIS AST, The Netherlands) to ensure safe handling of the samples before further analysis with FT-IR.
| Milk fat (%) | LCSFA sn-1/3 (mol%) | SFC |
|---|---|---|
| 50 | 32.0 | 21.3 |
| 20 | 48.3 | 32.2 |
| 0 | 52.0 | 34.7 |
The emulsions used for in vitro digestion were prepared to mimic the macronutrient composition of infant formula. Demineralized whey, milk permeate and skim milk were mixed in a ratio of 21![[thin space (1/6-em)]](https://www.rsc.org/images/entities/char_2009.gif) :57:21 and this milk matrix was heated to 50 °C. The fat blends, of which the LCSFA composition is indicated in Table 2, were heated in a water bath at 70 °C until all fat was melted after which the water bath temperature was kept at 60 °C. The fat blends were added to the milk matrix to a final concentration of 3.5 wt% fat. The emulsions were homogenized in 3 rounds with a table top homogenizer at 130 bar.
:57:21 and this milk matrix was heated to 50 °C. The fat blends, of which the LCSFA composition is indicated in Table 2, were heated in a water bath at 70 °C until all fat was melted after which the water bath temperature was kept at 60 °C. The fat blends were added to the milk matrix to a final concentration of 3.5 wt% fat. The emulsions were homogenized in 3 rounds with a table top homogenizer at 130 bar.
| Sample | LCSFA sn-1/3 (mol%) | SFC |
|---|---|---|
| 1 | 30.0 | 20.0 |
| 2 | 32.0 | 21.3 |
| 3 | 37.8 | 25.2 |
| 4 | 52.0 | 34.7 |
2.2 In vitro digestion
To simulate the digestive system of an infant, a two-phase static in vitro digestion model was used, including a gastric and duodenal phase according to the method described by Menard et al.14 The original method was changed as there was no addition of CaCl2 during the gastric and intestinal phase.To simulate the gastric phase, 31.5 mL of test formula or home-made emulsion was mixed with simulated gastric fluid (SGF; 18.5 mL) at 525 rpm stirring speed with a magnetic stirrer. SGF was prepared by dissolving rabbit gastric extract (RGE; CNRS, Marseille, France) at 0.6 mg mL−1 (with a lipase conc of 46 μg mL−1) in a 13 mM KCl and 94 mM NaCl solution. RGE contains rabbit gastric lipase and was chosen because of similar properties to human gastric lipase, like regional- and stereo-chemical preference.15 RGE was added to the gastric juice to reach a final gastric lipase concentration of 17 μg mL−1 in the digestion mixture, representative for the gastric lipase concentration in gastric contents at half gastric emptying in infants.16 During addition of gastric juice, pH is adjusted to 5.5 with 1 M HCl. During the gastric phase the pH was kept constant at pH 5.5 by addition of 0.1 M HCl and/or 0.1 M NaOH. Products with gastric juice were incubated for 60 min at 37 °C. Then the pH was adjusted to 6.5 with 0.1 M NaOH and 27.6 mL of intestinal juice containing bovine bile salts (3.1 mM; Sigma-Aldrich, St Louis, USA), 10 mM KCl and 41 mM NaCl was added and incubated for 15 minutes. After that porcine pancreatic extract (90 U mL−1; PPE or pancreatin; 8xUSP, Sigma-Aldrich, St Louis, USA) was added and incubated for 1.5 hours. During the intestinal phase the pH was kept at pH 6.5 using 0.1 M NaOH. The enzymatic reaction of all samples was inhibited by directly cooling the samples on ice. The digests were centrifuged at 13500g for 30 minutes at 7 °C and the pellets were freeze-dried and stored in a −20 °C freezer until further measurement. The typical weights of the pellets were 0.4–0.9 g after centrifugation and 0.04–0.16 g after freeze-drying. Digestion of the test formulas was performed in single fold and digestion of emulsions in triplicate.
2.3 FT-IR
Samples obtained after in vivo (Section 2.1) and in vitro (Section 2.2) digestion were measured in duplicate with FT-IR. As a reference for calcium soaps calcium dipalmitate (Sigma-Aldrich) was measured. Attenuated total reflectance (ATR) spectra were obtained using the build-in diamond ATR of the Nicolet iS50 FT-IR Spectrometer (ThermoFisher Scientific) equipped with a DTGS detector and a KBr beamsplitter. Before each measurement a background scan was performed with air. Freeze-dried samples were grinded to ensure homogeneity. A pressure of 27 kg was applied with the build-in pressure device on a sample of 10–30 mg that was placed on the all-reflective diamond ATR. Spectra were measured at wavenumbers ranging from 4000 to 400 cm−1 with a resolution of 4 cm−1 and an accumulation of 64 scans. Collected spectra were analyzed using Omnic 9 (ThermoFisher Scientific). A linear baseline correction was performed with baseline points at 4000, 3800, 2400, 1900, 825 and 400 cm−1 using the Auto Y function. Peak height and position at peak apex was measured with the Find Peaks function.3. Results and discussion
3.1 Calcium soaps in in vivo digests
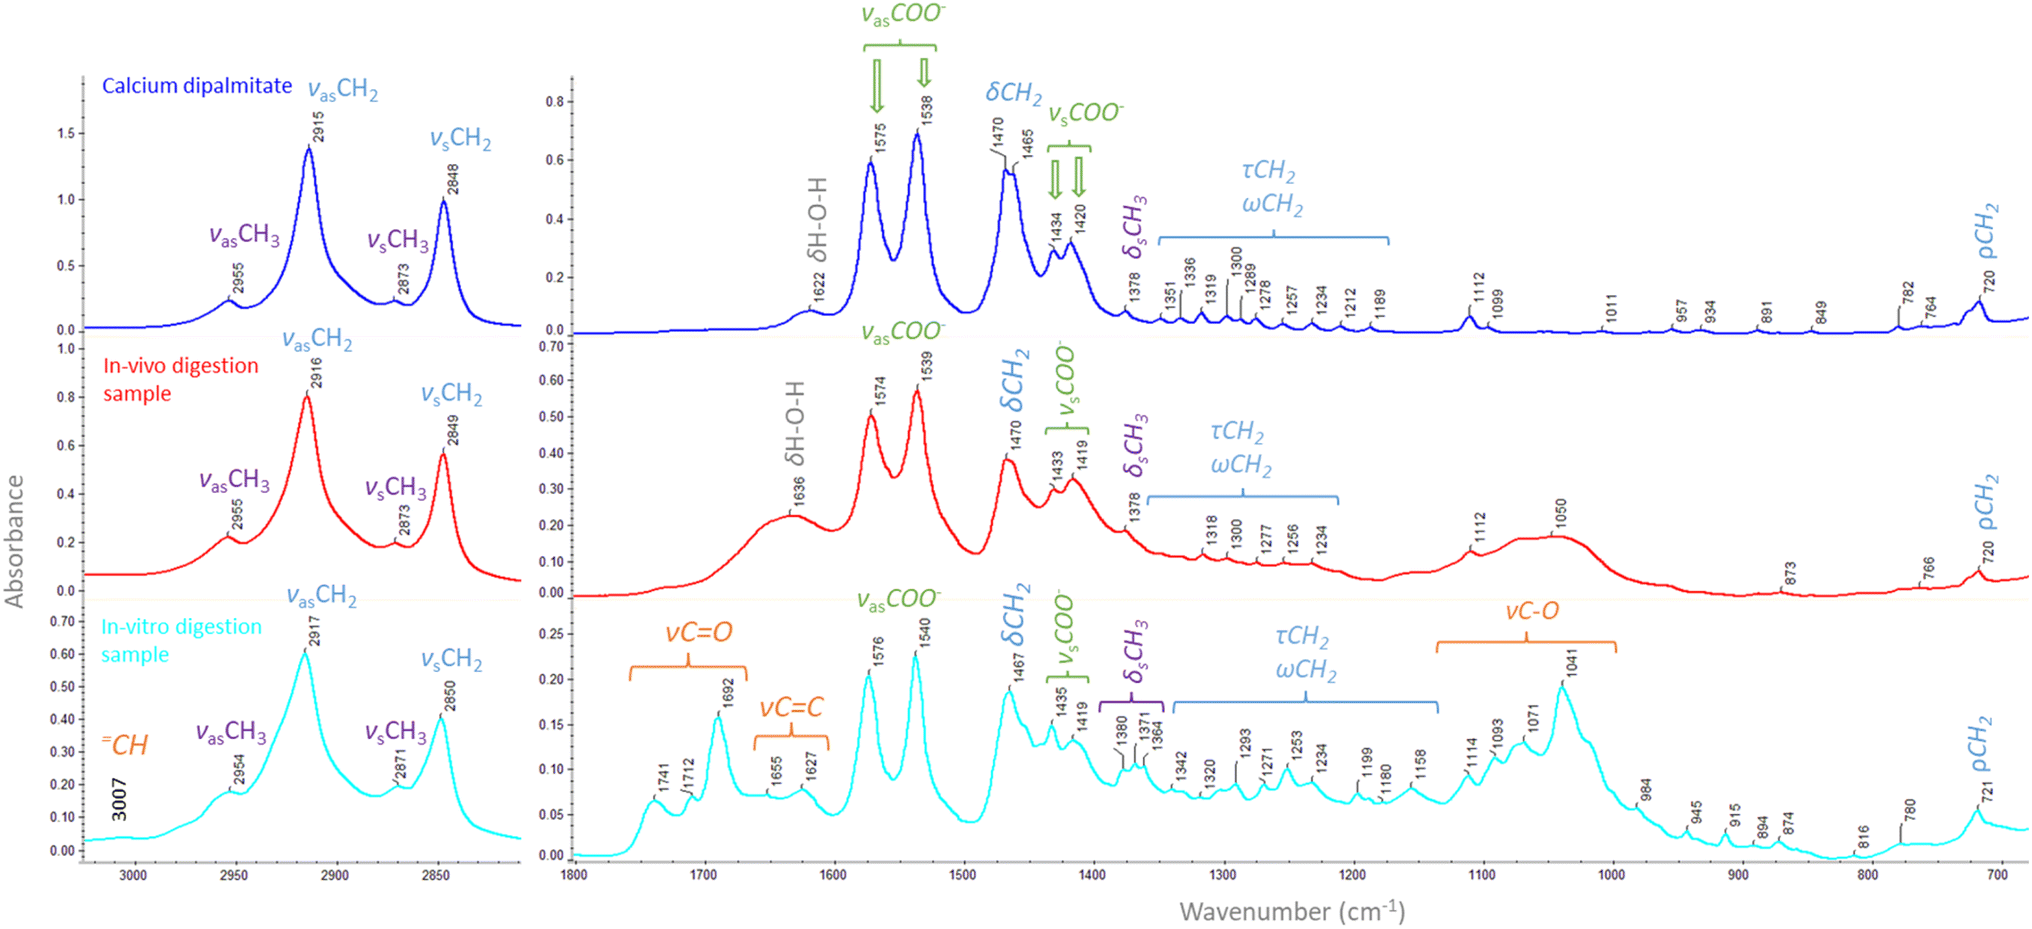 | ||
| Fig. 1 FT-IR spectra of calcium dipalmitate (blue), a representative in vivo sample (red), and a representative in vitro sample (cyan) with assigned peaks in Table 3. | ||
| Wavenumbers (cm−1) | Assignment | Notes | |
|---|---|---|---|
| In vivo | In vitro | ||
| 3600–3000 | νOH | Stretching of O–H | |
| 3008–3007 | ![[double bond, length as m-dash]](https://www.rsc.org/images/entities/char_e001.gif) CH CH |
C–H symmetric stretching in a cis double bond | |
| 2956–2954 | 2955–2954 | ν asCH3 | C–H antisymmetric stretching of –CH3 |
| 2917–2915 | 2918–2917 | ν asCH2 | C–H antisymmetric stretching of –CH2 |
| 2873–2872 | 2872–2871 | ν sCH3 | C–H symmetric stretching of –CH3 |
| 2849–2848 | 2851–2849 | ν sCH2 | C–H symmetric stretching of –CH2 |
| 1741–1735 |
νCO |
TAG ester | |
| 1712 | Saturated FFA | ||
| 1692–1691 | Unsaturated FFA | ||
| 1655, 1627 |
νCC |
||
| 1637–1630 | δH–O–H | Scissoring of H–O–H | |
| 1575–1574 | 1583–1576 | ν asCOO− | Antisymmetric stretching of –COO− |
| 1540–1538 | 1542–1540 | ||
| 1472–1466 | 1468–1465 | δCH2 | Scissoring of –CH2 |
| 1435–1431 | 1436–1435 | ν sCOO− | Symmetric stretching of –COO− |
| 1420–1417 | 1419–1411 | ||
| 1380–1378 | 1380–1379 | δ sCH3 | Symmetric scissoring of –CH3 |
| 1371–1370 | |||
| 1365–1364 | |||
| 1320–1230 | 1350–1150 | τCH2 | Twisting of –CH2 |
| ωCH2 | Wagging of –CH2 | ||
| 1120–1000 | νC–O | Stretching of esters | |
| 720–719 | 721–719 | ρCH2 | Rocking of –CH2 |
The hydrocarbon tail of calcium soaps gives rise to –CH2 and –CH3 peaks in the region 2955–2849 cm−1 as well as a peaks at 1470, 1378–1190, and 720 cm−1.10 The absence of CO stretching carbonyl peaks typical for fatty acids10 at 1703 cm−1 indicate that the hydrocarbons present in the sample can all be attributed to those present in calcium soaps.
| Calciumsoap = Ca2+ + 2FA− | (1) |
| Ksp = [Ca2+] × [FA−]2 | (2) |
| A(Ca-soap) = (COO1− + COO2−) × R2 | (3) |
| A(Ca-soap) = (vsCOO1− + vasCOO1− + vsCOO2− + vasCOO2−) (vsCH2 + vasCH2)2 | (4) |
We used 31 samples from a previous study13 to set-up a model to calculate the calcium soap content in in vivo samples based on FT-IR measurements. Samples were measured with FT-IR and resulting absorption peak heights were used to calculate ACa-soap with eqn (4). The calcium soap concentration in these samples was measured in the study of Looijesteijn et al.13 with GC-FID and were plotted against the ACa-soap as measured in the present study with FT-IR (Fig. 2). Linear regression showed that there was a linear relation through the origin between calcium soap absorption and the calcium soap concentration (CCa-soap, in mg g−1 dry faeces) (eqn (5)). The fitting parameter c was 93.421 mg g−1 with a 95% confidence interval of 89.843 to 97.000 and a p-value of <0.0001. This linear relation can be further used to calculate the calcium soap concentration in in vivo samples via FT-IR measurements.
| CCa-soap = c × ACa-soap | (5) |
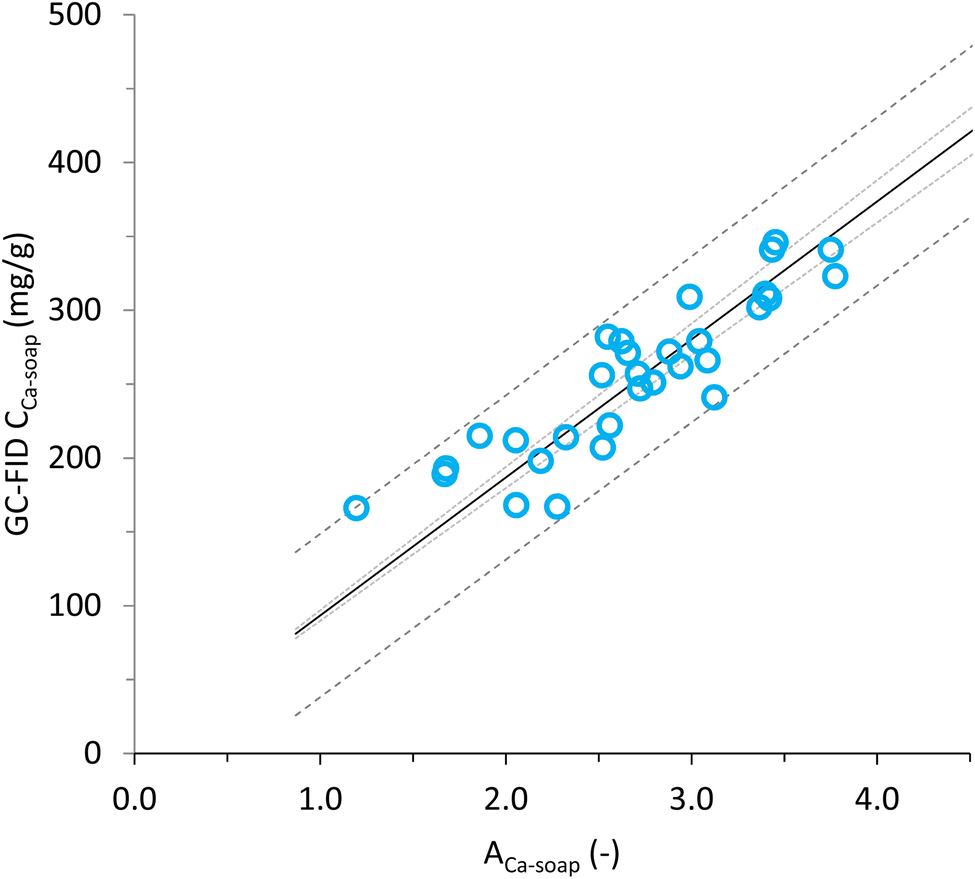 | ||
| Fig. 2 Fit between absorbance of calcium soaps (ACa-soap) as measured with FT-IR and calcium soap concentration (CCa-soap) as measured with GC-FID, on dry faeces samples from the study described in Looijesteijn et al.13 With the model (—), 95% confidence interval on mean of prediction (⋯) and 95% confidence interval on single prediction (--). | ||
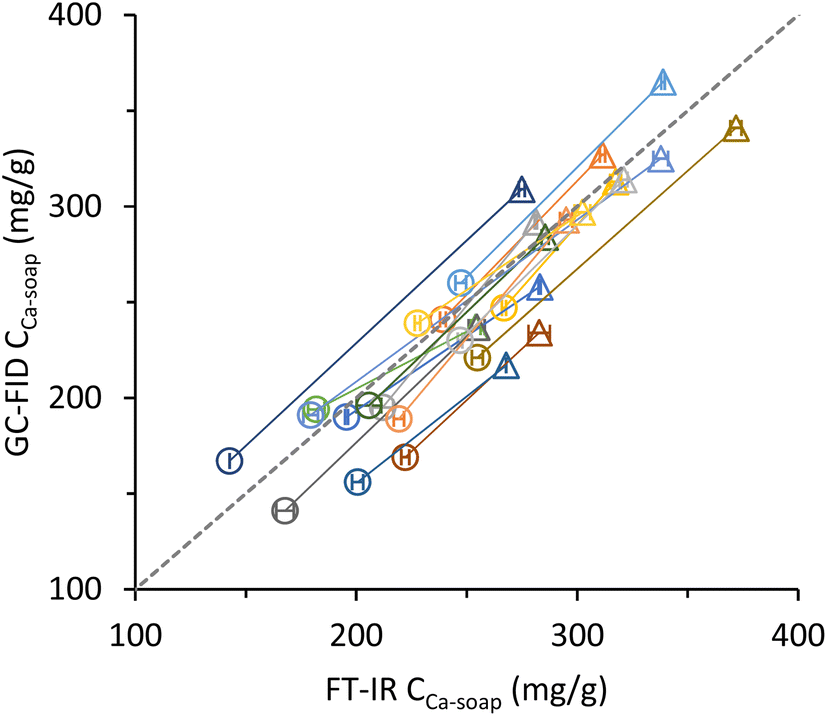
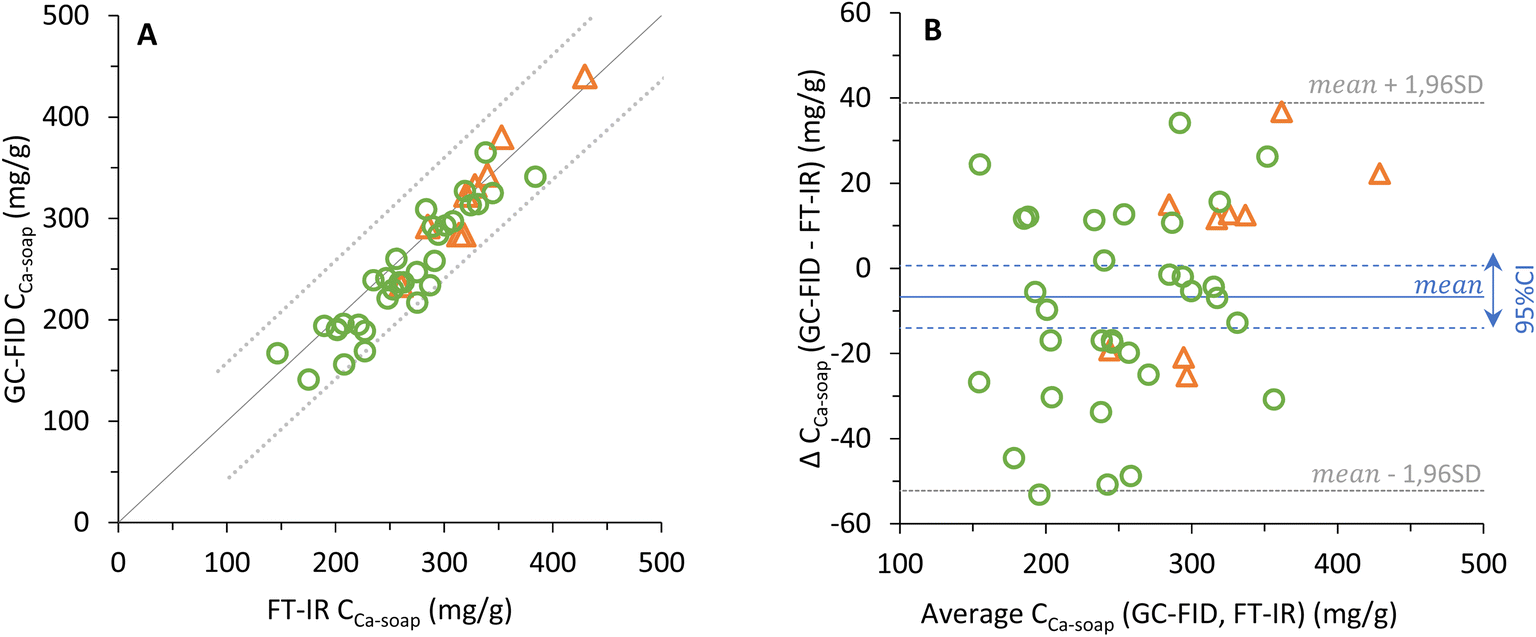 | ||
Fig. 3 (A) Calcium soap concentration in dry faecal samples fromManios et al.12 (○) and from an infant feeding study (registered as NL7047 in the Dutch trial register) (Δ) measured with GC-FID plotted against the calcium soap concentration based on FT-IR measurements, with the parity line (—) and 95% confidence interval (⋯). (B) Bland-Altman17 plot of the same data in which the difference against mean is plotted for calcium soap with the mean difference (![[d with combining macron]](https://www.rsc.org/images/entities/i_char_0064_0304.gif) , —) and its 95% confidence interval (--) and the limits of agreement ( ± 1.96 · standard deviation of the differences, ⋯). , —) and its 95% confidence interval (--) and the limits of agreement ( ± 1.96 · standard deviation of the differences, ⋯). | ||
3.2 Calcium soaps in in vitro digests
3.2.1.1 Qualitative interpretation of the FT-IR spectra. A comparison of spectra after in vivo and after in vitro digestion is presented in Fig. 1. Assignment of peaks relevant for calcium soap quantification is largely consistent with those assigned for the in vivo samples, albeit that there are some slight shifts in wavenumber at which the peaks appear (Table 3). Next to shifts also some additional peaks appear in the in vitro spectra. A C–H symmetric stretching vibration of the cis double bond appears at 3012 cm−1.18 The peaks present at 1741, 1712 and 1692 cm−1 can be assigned to vibration of carboxylic acids. The peak at 1741 cm−1 represents the ester functional group in glycerides. The peaks at 1712 and 1692 cm−1 represents the C
O group in free fatty acids (FFA), of which the first represents saturated FFAs and the latter unsaturated FFAs.19 Unsaturated FFAs also give rise to the CC peak at 1655 cm−1.20 Symmetrical scissoring of the methyl groups has changed from one peak at 1380 cm−1 to a triplet at 1380, 1371, and 1364 cm−1. Peaks present between 1350 and 1150 cm−1 are most likely due to twisting and wagging vibrations of the methylene group.21,22 C–O stretching vibrations of esters is represented by the peaks located at 1157, 1113, 1070 and 1041 cm−1.21,23 Between 1000 and 780 cm−1 multiple small peaks appear which can most likely be attributed to methylene rocking and twisting.22
The extra functional groups that are present in the in vitro digest compared to the in vivo digest are all lipid related and indicate that there are glycerides present as well as unsaturated and saturated FFAs. During in vivo digestion the monoglycerides and short chain FFAs formed during lipolysis are absorbed in the small intestine, as well as minerals such as calcium. The long chain FFAs are either absorbed or precipitated in a calcium soap. While during in vitro digestion monoglycerides, short chain FFAs and minerals remain in the sample. At the end of in vitro digestion there is a centrifugal separation during which a large part of the lipids are removed with the cream layer and the calcium soaps precipitate in the pellet that is collected. However, this separation is not ideal and thus also glycerides and FFAs end up in the pellet as well as insoluble minerals.
3.2.1.2 Quantitative interpretation of the FT-IR spectra. For each sample the calcium-soap absorption (Aca-soap) was calculated with eqn (4) and subsequently multiplied with the mass fraction of dry pellet (mdry pellet) to wet pellet (mwet pellet) with eqn (6) to calculate the calcium soap formation index. The mass fraction is required to correct for the amount of pellet that is formed during centrifugation.
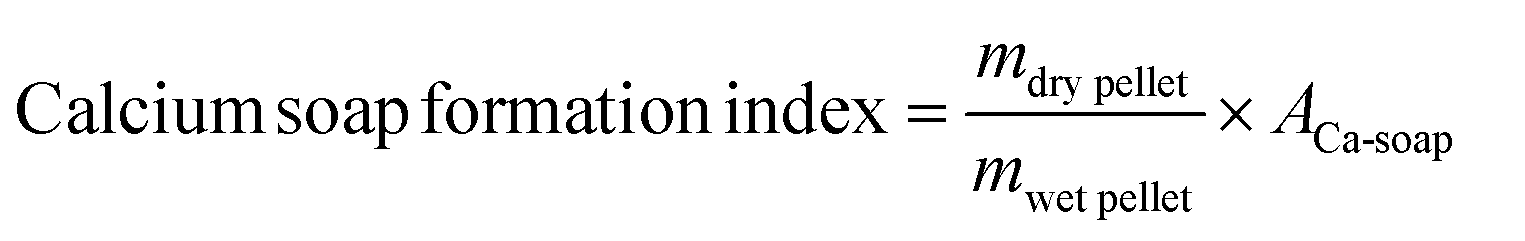 | (6) |
To test the applicability of FT-IR to measure calcium soap formation during in vitro digestion, three model infant formulas containing 0, 20 or 50% milk fat, were digested in an in vitro digestion model. The infant formulas with 0 and 50% milk fat in the fat blend were the same as used in the in vivo study13 that was used for the model definition.
The concentration of calcium soaps in the in vivo feacal samples measured with the FT-IR method decreased for the fat blends with increasing milk fat contribution of the long chain saturated fatty acid fraction in the infant formula (Fig. 4), as was also measured with the validated GC-FID method.12 Also after in vitro digestion an inverse correlation between the fat blends including milk fat contributing in the long chain saturated fatty acid part of the fat blend used for the infant formulas, and the calcium soap formation index was observed (Fig. 5). Note here that the calcium soap formation index obtained with FT-IR measurements on in vitro digests yields a relative index rather than an exact value of the formed calcium soaps. These results show that the FT-IR method presented in this manuscript can be used to predict relative calcium soap formation of an infant formula during in vitro digestion.
 | ||
| Fig. 4 Fatty acid soap concentration measured with GC-FID as a function of the fatty acid soaps measured with FT-IR in in vivo digestion samples from infants fed with infant formula containing 50% (●) or 0% (▲) milk fat in the fat blend of the infant formula.12 Each line represents the faecal samples of one infant. Error bars represent the standard deviation of duplicate FT-IR measurement. | ||
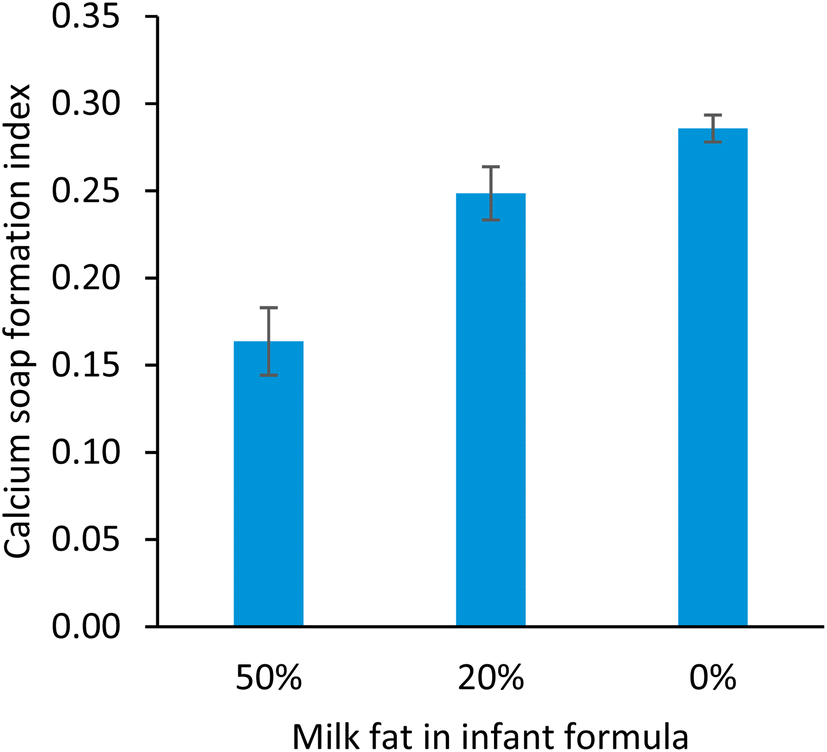 | ||
| Fig. 5 Calcium soap formation index as measured with FT-IR after in vitro digestion of infant formula with varying milk fat content in the fat blend. Error bars represent the standard deviation of duplicate FT-IR measurement. | ||
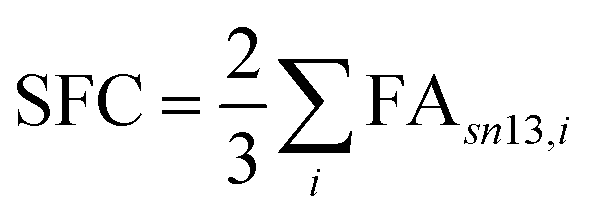 | (7) |
Calculation of the SFC can be used to optimise the design of fat blends towards human milk fat, which has a typical SFC of ∼20. Kloek et al.24 showed that the soap forming capacity had a positive correlation with total long chain saturated fatty acids measured in stools, which originates from the same in vivo study as was used in this study.
To investigate whether there is a relationship between the measured calcium soaps in in vitro digests and the theoretically calculated soap-forming capacity, the data from the calcium soap formation index presented in Fig. 5 were plotted against the soap formation capacity (Fig. 6). Next to that, a new set of in vitro digests was measured with FT-IR and the resulting calcium soap formation index was also plotted in Fig. 6. In both sets the calcium soap formation index had a linear correlation (R2 = 0.98 and 0.97) with the soap forming capacity. However, calcium soap formation index was different at equal soap forming capacity. The shift in calcium soap formation index is due to the effect of the sample matrix on the FT-IR measurement. For example, variation in proteins and minerals affect the amount of pellet formed and thus the calcium soap formation index. It is therefore recommended to compare results with a reference of the same matrix. In this case the set with varying milk fat content can be compared within the set, but not with the set of measurements that consisted of emulsions containing different fat blends. Based on these results we can conclude that for a given matrix the expected calcium soap formation can be steered well by optimizing the fat blend composition with respect to its regional fatty acid distribution and taking into account specific regulatory requirements.
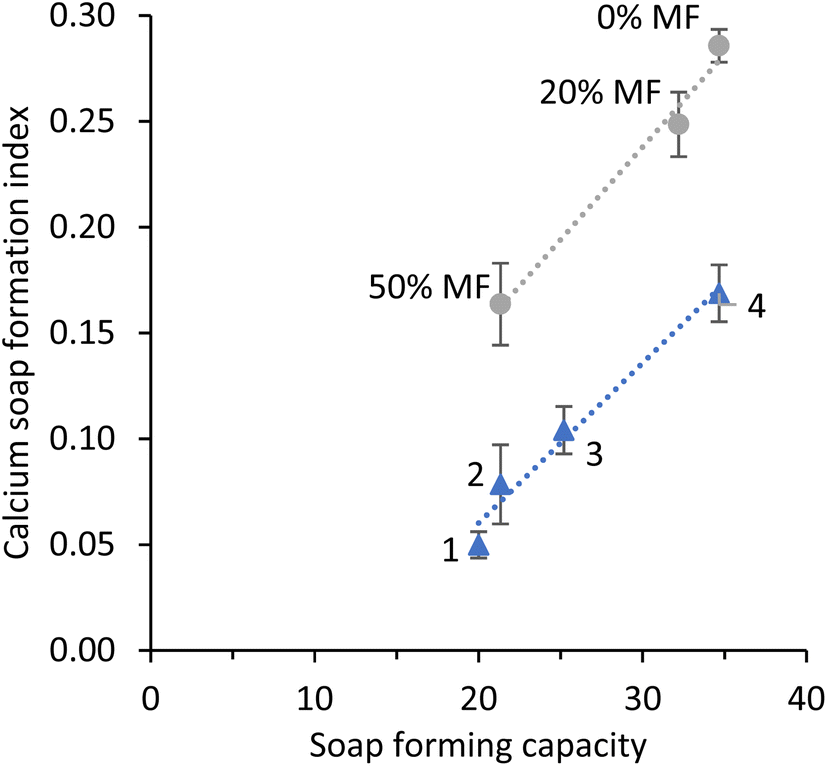 | ||
| Fig. 6 Calcium soap formation index as measured with FT-IR after in vitro digestion of infant formula with varying milk fat content in the fat blend (●) and emulsions containing different fat blends (▲) as a function of the soap forming capacity with a linear trendline fitted through the data. Error bars represent a different standard deviation for each sub-set: For the infant formula (●) duplicate FT-IR measurement was performed on single fold in vitro digestion, and for the emulsions (▲) single FT-IR measurement was performed on in vitro digestion conducted in triplicate. | ||
4. Conclusion
The objective of the current study was to develop a simple method to measure fatty acid soaps, representative for the soap formation observed in clinical trials. Therefore, the newly identified method based on FT-IR was compared to the soap levels measured with the validated method, consisting of an extraction followed by GC-FID detection, for faecal soap analysis in samples of clinical trials performed with infants consuming infant formulas with different fat blends. There was a linear correlation between the calcium soap absorbance, which was calculated with absorbance values of carboxylate and hydrocarbon peaks measured with the FT-IR, and the calcium soap concentration as measured with GC-FID in in vivo digestion samples. Using this correlation, a model was set-up with which calcium soap concentration in in vivo samples can be measured with a simple FT-IR measurement. This model was validated with in vivo samples from another clinical trial performed in infants. The good fit of the model indicates that the FT-IR method is a reliable method to quantify fatty acid soaps and is only marginally influenced by parameters that were possibly different between the clinical studies.In vitro digestion samples are generally too small for calcium soap quantification via GC-FID. We have shown here that calcium soaps can be measured with FT-IR using the same method as for in vivo digestion samples. However, for in vitro samples, the FT-IR method provides a relative index rather than an exact value of the formed calcium soaps. Most likely this is the case because there is no absorption of released components during in vitro digestion and these components may interfere with the calcium soap peaks needed for quantification. Hence, the in vitro method is highly matrix dependent, and results can therefore only be compared within a set of samples with limited variation in composition.
With in vivo as well as in vitro digestion an inverse association between the fat blends used for infant nutrition products containing different vegetable fat blends combined with different amounts of milk fat proportion and the formation of fatty acid soaps after digestion and defaecation could be observed. There is a clear link between the amount of long chain saturated fatty acids at the sn-1,3 position and therefore release as free fatty acid after lipolysis with the appearance of fatty acid soaps, providing extra substantiation for the future development of fat blends for infant nutrition to minimize fatty acid soap formation and thereby gut discomfort in infants. These insights can be used to predict the soap formation capacity of a newly designed fat blend and thereby the improvement of infant nutrition products.
Author contributions
Kelly Muijlwijk: formal analysis, investigation, methodology, validation, visualization, writing – original draft, writing – review and editing. Anouk Feitsma: conceptualization, funding acquisition, investigation, project administration, resources, supervision, visualization, writing – original draft, writing – review and editing. William Kloek: conceptualization, methodology, validation, writing – review and editing.Conflicts of interest
Authors are all employed by FrieslandCampina. There are no further conflicts of interest to declare.Acknowledgements
The authors would like to thank Federica Angius and Corrie Jansen for their work on the in vitro digestions and Thom Huppertz and Christel Timmer for fruitful discussions.References
- B. Koletzko, Ann. Nutr. Metab., 2017, 69, 28–40 Search PubMed
.
- S. Lindquist and O. Hernell, Curr. Opin. Clin. Nutr. Metab. Care, 2010, 13, 314–320 CrossRef CAS PubMed
- S. M. Innis, Adv. Nutr. Int. Rev. J., 2011, 2, 275–283 CrossRef CAS PubMed
- V. Petit, L. Sandoz and C. L. Garcia-Rodenas, Prostaglandins, Leukotrienes Essent. Fatty Acids, 2017, 121, 40–51 CrossRef CAS PubMed
- P. T. Quinlan, S. Lockton, J. Irwin and A. L. Lucas, J. Pediatr. Gastroenterol. Nutr., 1995, 20, 81–90 CAS
- E. A. Miles and P. C. Calder, Nutr. Res., 2017, 44, 1–8 CrossRef CAS PubMed
- S. De Bruyne, M. M. Speeckaert and J. R. Delanghe, Crit. Rev. Clin. Lab. Sci., 2018, 55, 1–20 CrossRef CAS PubMed
- A. S. De Koninck, K. Nys, B. Vandenheede, S. Van Biervliet, M. M. Speeckaert and J. R. Delanghe, Clin. Biochem., 2016, 49, 1283–1287 CrossRef CAS PubMed
- D. Chapman, J. Am. Oil Chem. Soc., 1965, 42, 353–371 CrossRef CAS PubMed
- A. Filopoulou, S. Vlachou and S. C. Boyatzis, Molecules, 2021, 26, 6005 CrossRef CAS PubMed
- Y. Lu and J. D. Miller, J. Colloid Interface Sci., 2002, 256, 41–52 CrossRef CAS
- Y. Manios, E. Karaglani, I. Thijs-Verhoeven, E. Vlachopapadopoulou, A. Papazoglou, E. Maragoudaki, Z. Manikas, T. M. Kampani, I. Christaki, M. M. Vonk, R. Bos and P. Parikh, BMC Nutr., 2020, 6, 46 CrossRef PubMed
- E. Looijesteijn, R. W. W. Brouwer, R. J. W. Schoemaker, L. H. Ulfman, S. L. Ham, P. Jeurink, E. Karaglani, W. F. J. van IJcken and Y. Manios, BMC Nutr., 2022, 8, 93 CrossRef PubMed
- O. Ménard, C. Bourlieu, S. C. De Oliveira, N. Dellarosa, L. Laghi, F. Carrière, F. Capozzi, D. Dupont and A. Deglaire, Food Chem., 2018, 240, 338–345 CrossRef PubMed
- L. Sams, J. Paume, J. Giallo and F. Carrière, Food Funct., 2016, 7, 30–45 RSC
- F. Carriere, C. Renou, V. Lopez, J. De Caro, F. Ferrato, H. Lengsfeld, A. De Caro, R. Laugier and R. Verger, Gastroenterology, 2000, 119, 949–960 CrossRef CAS PubMed
- J. M. Bland and D. G. Altman, Statistical methods for assessing agreement between two methods of clinical measurement, Lancet, 1981, 307–310 Search PubMed
- S. M. Alshuiael and M. A. Al-Ghouti, PLoS One, 2020, 15, e0232997 CrossRef CAS PubMed
- Z. Hao, D. Malyala, L. Dean and J. Ducoste, Talanta, 2017, 165, 526–532 CrossRef CAS PubMed
- H. Yang and J. Irudayaraj, J. Am. Oil Chem. Soc., 2000, 77, 291–295 CrossRef CAS
- M. D. Guillén and N. Cabo, J. Am. Oil Chem. Soc., 1997, 74, 1281–1286 CrossRef
-
W. C. de. Ruig, Infrared Spectra of Monoacid Triglycerides. With Some Applications to Fat Analysis, PUDOC, 1971 Search PubMed
- M. Portaccio, B. Faramarzi and M. Lepore, Biophysica, 2023, 3, 524–538 CrossRef
- W. Kloek, C. J. A. M. Timmer, N. de Groot and A. L. Feitsma, Int. Dairy J., 2023, 141, 105619 CrossRef CAS
Footnote |
| † Shared first authors. |
| This journal is © The Royal Society of Chemistry 2024 |