
 Open Access Article
 This Open Access Article is licensed under a Creative Commons Attribution-Non Commercial 3.0 Unported Licence
A low-volume LC/MS method for highly sensitive monitoring of phenoxymethylpenicillin, benzylpenicillin, and probenecid in human serum†
Alaa
Riezk
 *ab,
Richard C.
Wilson
abcd,
Anthony E. G.
Cass
be,
Alison H.
Holmes
abd and
Timothy M.
Rawson
abd
*ab,
Richard C.
Wilson
abcd,
Anthony E. G.
Cass
be,
Alison H.
Holmes
abd and
Timothy M.
Rawson
abd
aNational Institute for Health Research Health Protection Research Unit in Healthcare Associated Infections and Antimicrobial Resistance, Imperial College London, Hammersmith Campus, Du Cane Road, London, W12 0NN, UK
bCentre for Antimicrobial Optimisation, Imperial College London, Hammersmith Hospital, Du Cane Road, Acton, London, W12 0NN, UK. E-mail: alaa.riezk@imperial.ac.uk; Alaa.riezk@yahoo.com
cImperial College Healthcare NHS Trust, Hammersmith Hospital, Du Cane Road, London, W12 0HS, UK
dDavid Price Evans Infectious Diseases & Global Health Group, The University of Liverpool, Liverpool, L7 8TX, UK
eDepartment of Chemistry, Molecular Sciences Research Hub, Imperial College, London, UK
First published on 3rd January 2024
Abstract
Background: The optimization of antimicrobial dosing plays a crucial role in improving the likelihood of achieving therapeutic success while reducing the risks associated with toxicity and antimicrobial resistance. Probenecid has shown significant potential in enhancing the serum exposure of phenoxymethylpenicillin, thereby allowing for lower doses of phenoxymethylpenicillin to achieve similar pharmacokinetic/pharmacodynamic (PK/PD) targets. We developed a triple quadrupole liquid chromatography mass spectrometry (TQ LC/MS) analysis of, phenoxymethylpenicillin, benzylpenicillin and probenecid using benzylpenicillin-d7 and probenecid-d14 as IS in single low-volumes of human serum, with improved limit of quantification to support therapeutic drug monitoring. Methods: Sample clean-up was performed by protein precipitation using acetonitrile. Reverse phase chromatography was performed using TQ LC/MS. The mobile phase consisted of 55% methanol in water + 0.1% formic acid, with a flow rate of 0.4 mL min−1. Antibiotic stability was assessed at different temperatures. Results: Chromatographic separation was achieved within 2 minutes, allowing simultaneous measurement of phenoxymethylpenicillin, benzylpenicillin and probenecid in a single 15 μL blood sample. Validation indicated linearity over the range 0.0015–10 mg L−1, with accuracy of 96–102% and a LLOQ of 0.01 mg L−1. All drugs demonstrated good stability under different storage conditions. Conclusion: The developed method is simple, rapid, accurate and clinically applicable for the quantification of phenoxymethylpenicillin, benzylpenicillin and probenecid in tandem.
Introduction
Penicillins, a class of beta-lactam antibiotic with a narrow spectrum, are commonly prescribed for the treatment and prevention of infection caused by both Gram-positive and Gram-negative cocci.1,2It is crucial to ensure proper dosing of penicillin to maintain clinical effectiveness and minimize toxicity, especially in the treatment of common infections, in accordance with the WHO Access, Watch, and Reserve (AWaRe) criteria.3,4 Increasing resistance to penicillin among prevalent organisms like streptococci underscores the necessity for innovative strategies to optimize the use of narrow-spectrum frontline antimicrobials. This optimization aims to extend their efficacy, diminish collateral impacts, and safeguard broader-spectrum agents.4–6
Despite the imperative to address rising resistance, delivering higher doses of oral penicillin causes challenges with saturable drug absorption and gastrointestinal side effects.7–9 Consequently, achieving an optimal pharmacokinetic/pharmacodynamic (PK/PD) profile through higher doses is not always feasible.7–9 Exploring the potential of administering enhanced forms of targeted, oral narrow-spectrum medications presents an attractive avenue within regional antimicrobial stewardship initiatives. This approach may also prevent the necessity for prolonged intravenous treatment regimens in specific cases.7–9
Probenecid, p-(di-n-propylsulphamyl)-benzoic acid, exhibits potent inhibition of renal organic anion transporters, crucial players in the excretion of organic agents like penicillin.8,10–12 Consequently, co-administering probenecid significantly reduces the renal clearance of penicillin, resulting in substantial increases in serum exposure. In simpler terms, combining probenecid with penicillin allows the attainment of comparable pharmacokinetic/pharmacodynamic (PK/PD) targets with lower penicillin doses, thereby enhancing therapeutic efficacy at a specified dosage level.8,10–12
Optimizing antibiotic dosing is pivotal in curbing the emergence of drug-resistant bacteria and potentially reducing unwanted side effects. One effective approach is therapeutic drug monitoring (TDM), a tailored strategy for individualized needs. In the realm of anti-infective drug pharmacology, covering antifungals, antiretrovirals, and antibiotics, LC/MS stands out as a widely utilized method for TDM. However, there is a shortage of techniques for simultaneously quantifying both total and free concentrations of penicillin and probenecid using LC/MS. Developing concurrent measurement methods for these drugs can streamline processes, reducing turnaround times, pre-analytical tasks, operator workload, and costs associated with reagents and storage.13–15
Our goal was to create a practical triple quadrupole liquid chromatography mass spectrometry (TQ LC/MS) technique capable of concurrently analysing both total and free concentrations of penicillin and probenecid. To achieve this, we planned to employ benzylpenicillin-d7 and probenecid-d14 as internal standards (IS) in minimal amounts of human serum, while significantly enhancing the limit of quantification. This method's purpose was to bolster the reliability and robustness of TDM for both these drugs. Furthermore, we intended to apply this validated method in support of clinical studies evaluating these medications.
Materials and methods
Chemicals and reagents
Phenoxymethylpenicillin potassium salt (penicillin-V), benzylpenicillin sodium salt (penicillin-G), probenecid and benzylpenicillin-d7 N-ethylpiperidinium salt (IS) were purchased from Sigma (St. Louis, MO, USA). Probenecid-d14 was purchased from Cambridge Bioscience (Cambridge, UK) (Fig. 1). Methanol, formic acid, water and acetonitrile in LC/MS grade were purchased from Sigma (St. Louis, MO, USA). | ||
| Fig. 1 Chemical structures of standard compounds.24–27 | ||
Instrumentation and analytical conditions
The chromatographic and mass-spectrometric procedures were carried out using a 1290 Infinity II LC, which was equipped with a pump linked to an Ultivo TQ LC/MS system. For chromatographic separation, we utilized a reversed-phase analytical column (Polaris 5, C18-A, 2 × 50 mm; 5 micron, Agilent). The data acquisition and analysis were conducted using MassHunter software version 10 (Agilent, Santa Clara, CA, USA).The chromatographic separation was executed at a column temperature of 25 °C, employing a flow rate of 0.4 mL min−1. The mobile phase consisted of 55% methanol in water with the addition of 0.1% formic acid, and the total run time was 5 minutes. Electrospray Ionisation (ESI) was employed for detecting penicillin-V, penicillin-G and probenecid. Penicillin-V and penicillin-G were monitored in positive mode using multiple reaction monitoring (MRM), while probenecid was monitored in negative mode. Both qualitative and quantitative data were collected during the analysis.
Triple quadrupole detector transitions were used for quantification and qualification, as shown in Table 1.
| Analyte | Retention time (min) | Precursor/product ions (m/z) | Collision energy, CE (eV) |
|---|---|---|---|
| Penicillin-V | 1.3 | 351.1/192; 159.8; 113.8 | 10 |
| Penicillin G-D7, IS | 1 | 342.2/182.8; 160 | 12 |
| Penicillin-G | 1.55 | 335.1/175.9; 160 | 12 |
| Probenecid | 1.9 | 284/75.9; 140 | 12 |
| Probenecid, IS | 1.9 | 298/76; 139.9; 254 | 8 |
Source parameters were optimised using the Agilent Source optimizer program with the following results: capillary voltage = 5000 V, gas flow = 10 L min−1, gas temperature = 300 °C, nebulizer = 30 psi, sheath, sheath gas flow = 12 L min−1 and gas temperature = 350 °C.
Sample and calibration preparation
As part of a clinical study aimed at evaluating the pharmacokinetics and pharmacodynamics of penicillin-V and probenecid in healthy volunteers (EudraCT number: 2021-002800-11), serum samples were collected. These serum samples were meticulously preserved at −80 °C for subsequent analysis.To establish blank serum samples for calibration purposes, serum obtained from the study volunteers was utilized. These blank serum samples were then augmented with nine different concentrations, ranging from 0.0015 to 10.00 mg L−1, of all drugs. To ensure the accuracy of the analysis, penicillin G-D7 and probenecid-d14 at a concentration of 0.3 mg L−1 were added to each calibrator and sample. These internal standards were kept at −80 °C and freshly prepared on a weekly basis.
Furthermore, serum control specimens were independently prepared at three distinct concentration levels: low (Qc1; 0.0015 mg L−1), medium (Qc2; 0.123 mg L−1), and high (Qc3; 10 mg L−1). Aliquots of these control specimens were also stored at −80 °C.
The treatment of all serum samples followed a consistent procedure:
(1) A 15 μL volume of serum was combined with 60 μL of acetonitrile.
(2) The mixture was thoroughly vortexed and allowed to equilibrate for 10 minutes.
(3) Precipitated proteins were then separated by centrifugation for 5 minutes at 14![[thin space (1/6-em)]](https://www.rsc.org/images/entities/char_2009.gif) 000 × g.
000 × g.
Stability experiments
To assess the short-term stability of serum samples containing penicillin-V, penicillin-G and probenecid, quality control samples (Qc1, Qc2, and Qc3) were allowed to stand at room temperature (RT) for both 6 and 24 hours. Subsequently, these samples were analysed, and the data obtained at the initial time (time = 0 h) were compared to evaluate the impact of short-term storage on the stability of penicillin-V, penicillin-G and probenecid in the serum samples.Similarly, to gauge the stability of the samples within the autosampler, they were stored at 4 °C, allowing for an assessment of their short-term stability under these conditions.
The long-term stability of the analytes was investigated by freezing the serum samples at −80 °C for a duration of 6 months, providing insights into their stability over an extended storage period.16
To determine the freeze–thaw stability of the analytes, an assessment was conducted over three cycles spanning a period of three days. In each cycle, the samples (Qc1, Qc2, and Qc3) were frozen at −80 °C and subsequently thawed at room temperature. Once completely thawed, the samples were refrozen and maintained at −80 °C for a duration of 24 hours. This process was repeated for a total of three cycles to examine the impact of freeze–thaw cycles on the stability of the analytes.
Stability of the drugs was expressed as
| St% = C0/Ct × 100 |
Method validation and quality characterization
The analytical method was validated according the International Conference on Harmonization guidelines.17,18 A triplicate run of calibration standards was carried out every day for three consecutive days and triplicates of quality controls samples (at low Qc1, medium Qc2, and high Qc3 concentrations) were performed to evaluate the robustness of the developed method.Linearity
The linearity of the developed method was evaluated by running nine calibration standards for each analyte in triplicate over 3 consecutive days.Matrix effects
Standard solutions were prepared at appropriate concentrations depending on the expected drug level in different sets. In the first set, standards of penicillin-V, penicillin-G and probenecid and their IS were prepared in the mobile phase. A second set was made in blank serum samples. The matrix effect was evaluated by comparing the peak area measurements obtained from the standard solutions:18,19| ME (%) = B/A × 100 |
Selectivity, precision and accuracy
Selectivity was assessed by analysing six different blank serum samples and confirmed by the absence of peaks at the respective retention times. The precision of the developed method was assessed in terms of both inter-day and intra-day reproducibility. For intra-day precision, the relative standard deviation (RSD) was calculated by analysing triplicate Qc1, Qc2, and Qc3 samples on the same day. To determine inter-day precision, triplicate QC samples were analysed over six consecutive days.The accuracy of the method was determined by comparing the measured concentrations to the spiked concentrations of the Qc samples, expressed as a percentage agreement. This evaluation helped gauge how closely the measured values aligned with the expected or spiked values, assessing the method's accuracy.
| Accuracy (percentage) = (measured/known spiked) × 100. |
The lower limit of quantification (LLOQ) is the lowest concentration of analyte in a sample which can be quantified reliably, with an acceptable accuracy and precision.
Carry-over
To evaluate the potential carry-over of analytes and IS, a systematic analysis was performed. First, blank samples were analysed following the analysis of samples with the highest standard concentration. Subsequently, standard samples at the lower limit of quantification were analysed after the blank samples. This entire experiment was repeated three times.The criteria for acceptable carry-over were set as follows: the carry-over in the blank samples should not exceed 20% of the analyte's response at the lower limit of quantification, and it should be limited to 5% of the response for the internal standards. This assessment ensured that any residual presence of analytes and IS from previous samples did not unduly affect subsequent analyses and met specific criteria for acceptability.
Pharmacokinetic study
The study was a randomised, open-label, crossover trial in healthy volunteers recruited at a clinical research facility (CRF). The study was reviewed and approved by a Regional Ethics Committee (Reference: 21/LO/0558) and the Medicines and Healthcare products Regulatory Agency (MHRA). Participants were randomised to receive either 250 mg, 500 mg, or 750 mg penicillin-V four times daily (qds). Participants additionally received probenecid 500 mg qds on their intervention visit. Treatment commenced 36 hours before attending on the study day. The sixth dose was observed in the CRF and blood samples were taken by phlebotomy at 45 (time 1) and 180 minutes (time 2) post-dose.Serum protein binding
A method for quantifying the fractions of penicillin-V and probenecid bound and unbound to serum proteins was developed using the Centrifree® Ultrafiltration Device (30000 MW cut-off, Merck Millipore). The influence of temperature, pH and relative centrifugation forces (RCF) on the protein binding was investigated.
Optimal conditions for achieving higher recovery rates were determined. For quantifying free penicillin and probenecid, the optimized condition involved pipetting 0.7 mL of serum at a pH of 7.4 using a 0.1 M sodium phosphate buffer, followed by centrifugation at 1500g for 10 minutes at 25 °C. The filtrate obtained from this process was subsequently analysed using TQ LC/MS, following the previously described method.
The free fraction of drug was calculated as following:
| Free drug% = (Cfree/Ctotal) × 100 |
Results and discussion
This paper aimed to develop a reliable and rapid analytical method for the quantification of penicillin-V, penicillin-G and probenecid in human serum to provide reliable pharmacokinetic data after drug administration, including towards the end of a dosage interval when serum concentrations are low.Various combinations and gradients of mobile phases, comprising water, acetonitrile, or methanol, were rigorously tested in conjunction with reverse-phase μHPLC columns. Additionally, parameters like the column temperature, oven temperature and injection volume were systematically examined to achieve the simultaneous measurement of analyte concentrations while maintaining short retention times and producing robust responses. This comprehensive evaluation aimed to optimize the chromatographic conditions for the most efficient and effective analysis of the analytes.
Ultimately, the optimized conditions were determined, which involved employing a mobile phase consisting of 55% methanol in water with the addition of 0.1% formic acid, maintaining a column temperature of 25 °C, using a 2 μL injection volume, and setting a flow rate of 0.4 mL min−1. These conditions were identified as ideal for achieving the desired analytical objectives. These conditions yielded the highest MS response and produced well-defined peaks at retention times of 1.3, 1.55 and 1 minute for penicillin-V, penicillin-G and penicillin G-D7, respectively. In the case of both probenecid and probenecid-d14, their peaks occurred at 1.9 minutes. These observed chromatographic data served as the basis for quantification.
The optimization of sample pre-treatment was a critical part of this study. Various deproteinization methods were tested using different combinations of acetonitrile and serum sample volumes. The selected process, which demonstrated a recovery rate exceeding 98%, involved using 15 μL of the sample and 60 μL of acetonitrile.
Through several rounds of optimization, a method was developed featuring isocratic elution, short retention times, a minimal sample volume requirement, and a significantly enhanced LLOQ. The LLOQ for penicillin-V, penicillin-G and probenecid was established at 0.01 mg L−1, demonstrating the method's high sensitivity.
The relative detector response (peak area), when plotted vs. injected relative concentration to IS was found to be linear over the concentration range of 0.0015–10 mg L−1 for penicillin-V, penicillin-G and probenecid with a correlation coefficient (r2 = 1), Fig 2S.†
In our study, we present a significant breakthrough in enhancing the sensitivity of LC/MS for probenecid and penicillin, achieving sensitivity levels greater than previously reported methods. This achievement is pivotal in drug monitoring, enabling precise measurements for clinicians to achieve therapeutic targets while mitigating the risk of drug toxicity.
Additionally, our method introduces a unique approach employing a single low volume of sample (15 microliters), which is particularly noteworthy in the context of neonatal patients. This not only conserves valuable clinical samples but also holds significance in reducing the invasiveness of sample collection, especially for vulnerable populations like neonates.
Matrix effect recovery, accuracy and carry-over
The recovery was 99–104% for penicillin-V, 98–103% for penicillin-G, 98–105% for penicillin-G IS, 99–106% for probenecid, and 94–103% for probenecid IS in serum samples, indicating that the matrix effect did not significantly interfere with the calibration, as IS corrected for any matrix effect.2,20Accuracy and precision were tested in three different concentrations (Qc1, Qc2 and Qc3, Tables 2–4). Precision (RSD) within-intra-day and inter-day run ranged from 1.5 to 5.4% for penicillin-V, 1.2 to 4.5% for penicillin-G and 0.8 to 4.9% for probenecid. Carry-over for was considered acceptable for all analytes and IS with less than 5% (Tables 2–4).
| Spiking level mg L−1 | RSD% | Accuracy% | |
|---|---|---|---|
| Intra-day | |||
| Qc1 | 10 | 1.5 | 102 |
| Qc2 | 0.123 | 2.2 | 97 |
| Qc3 | 0.0015 | 4 | 96 |
|
|||
| Inter-day | |||
| Qc1 | 10 | 2.1 | 98 |
| Qc2 | 0.123 | 1.9 | 98 |
| Qc3 | 0.0015 | 5.4 | 99 |
| Spiking level mg L−1 | RSD% | Accuracy% | |
|---|---|---|---|
| Intra-day | |||
| Qc1 | 10 | 0.9 | 102 |
| Qc2 | 0.123 | 0.8 | 97 |
| Qc3 | 0.0015 | 3.1 | 96 |
|
|||
| Inter-day | |||
| Qc1 | 10 | 0.9 | 98 |
| Qc2 | 0.123 | 1.1 | 98 |
| Qc3 | 0.0015 | 4.9 | 99 |
| Spiking level mg L−1 | RSD% | Accuracy% | |
|---|---|---|---|
| Intra-day | |||
| Qc1 | 10 | 1.2 | 99 |
| Qc2 | 0.123 | 1.5 | 98 |
| Qc3 | 0.0015 | 3 | 96 |
|
|||
| Inter-day | |||
| Qc1 | 10 | 1.8 | 99 |
| Qc2 | 0.123 | 1.1 | 101 |
| Qc3 | 0.0015 | 4.5 | 105 |
Stability study
The long-term stability studies conducted for penicillin-V, penicillin-G and probenecid revealed no significant degradation in the quality control (QC) samples (in serum) stored at −80 °C for a period of 6 months. Furthermore, undergoing three cycles of freeze–thaw did not have a significant impact on the stability of these drugs, with values ranging from 98% to 104%, indicating minimal changes.All drugs exhibited commendable stability. They remained within the range of 98% to 105% when stored at room temperature (23 ± 2 °C) for 6 hours, and when placed in the autosampler at 4 °C for 24 hours, the concentrations stayed within the range of 100% to 102% (Fig. 2) of their original levels. These findings align with data reported in other published research.2,16
 | ||
| Fig. 2 Average stability of probenecid and penicillin-V in serum over 4 h and 24 h at RT and over 24 h in the autosampler (n = 5); error bars represent standard deviation. | ||
Application to clinical samples
The method has been used to support and run a clinical study measuring total and free serum penicillin-V and probenecid in healthy participants. Fig. 3 shows the distribution of serum concentrations of penicillin-V and probenecid in participants who underwent real-time TDM (boxplot). Notably, our research findings demonstrated that probenecid effectively prolonged the half-life of penicillin-V and increased its serum concentration. Additionally, the geometric mean of the fraction of free penicillin-V in serum (fu) was calculated to be 0.23, a result that aligns with findings reported in other scientific publications.1,2,4,21,22 Probenecid also demonstrated a similar fu of 0.09 to other reports.23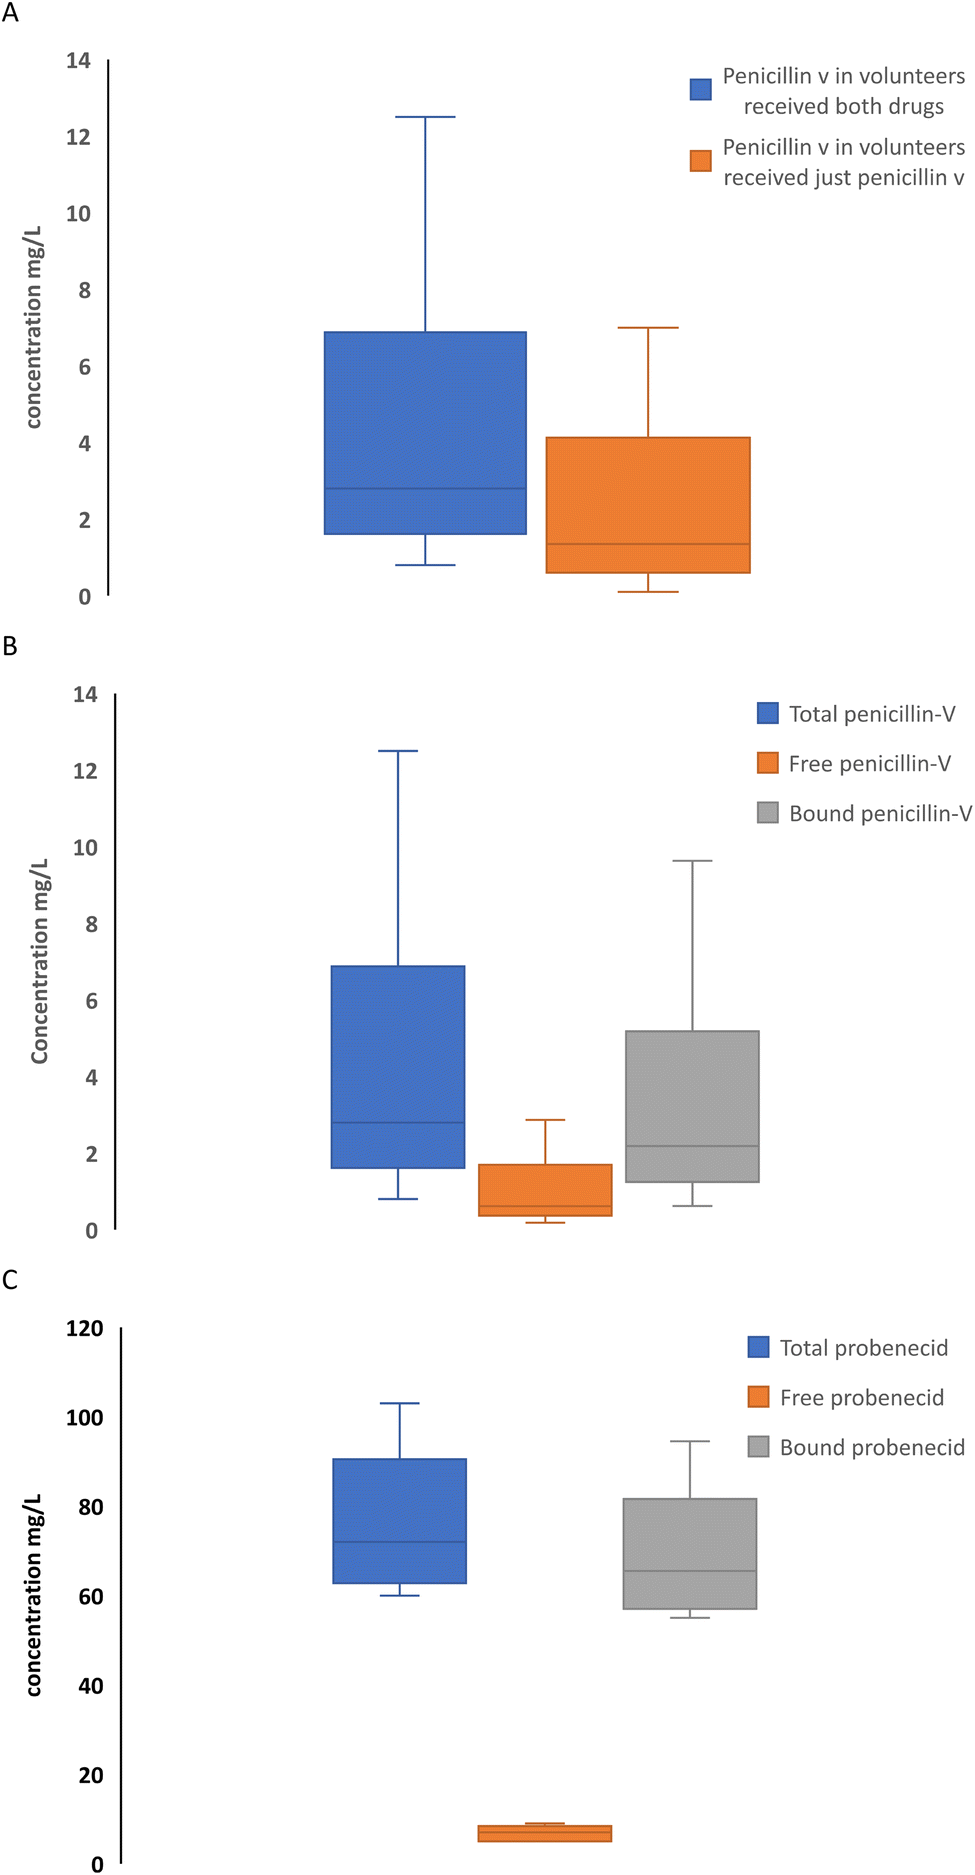 | ||
| Fig. 3 Box plot showing the spread of the total penicillin-V in volunteers received just penicillin-V or both penicillin-V and probenecid (A), total, free and bound penicillin-V (B) and total, free and bound probenecid (C). | ||
Conclusion
In our research, we have successfully developed and rigorously validated a highly precise, sensitive, and accurate TQ LC/MS method. This method is capable of concurrently quantifying both the total and free serum concentrations of penicillin-V, penicillin-G and probenecid using a single sample. The assay minimizes the volume of serum required and implements a straightforward pre-treatment protocol.The method was straightforward to implement, and after thorough validation, it was effectively utilized as a critical component of a clinical trial of an investigatory medicinal product. It was instrumental in simultaneously measuring penicillin-V and probenecid in serum samples obtained from healthy volunteers participating in the trial.
Ethical statement
This study was reviewed and approved by the Riverside Regional Ethics Committee (ref. 21/LO/0558) and the Medicines and Healthcare Regulatory Agency (MHRA, EudraCT number: 2021-002800-11).Conflicts of interest
TMR has received honoraria for consultancy from Sandoz (2020), honoraria for the delivery of educational activities from BioMerieux (2021–2022), and speakers fees from Roche Diagnostics Ltd (2021). All other authors have no declarations of interest.Acknowledgements
The Department of Health and Social Care funded Centre for Antimicrobial Optimisation (CAMO), Imperial College London, provides state-of-the-art research facilities and consolidates multidisciplinary academic excellence, clinical expertise, Imperial's NIHR/Wellcome funded Clinical Research Facility (CRF), and partnerships with the NHS to support and deliver innovative research on antimicrobial optimisation and precision prescribing. We would like to acknowledge: (1) the Department of Health & Social Care-funded Centre for Antimicrobial Optimisation (CAMO) at Imperial College London; (2) the National Institute for Health and Care Research Health Protection Research Unit (NIHR HPRU) in Healthcare Associated Infections and Antimicrobial Resistance at Imperial College London. The authors are grateful to Frankie Bolt and Kerri Hill-Cawthorne, from CAMO, for assistance and support.References
- Phenoxymethylpenicillin, https://bnf.nice.org.uk/drugs/phenoxymethylpenicillin/, 2023 Search PubMed.
- A. Riezk, R. C. Wilson, T. M. Rawson, V. Vasikasin, P. Arkell, T. J. Ferris, L. D. Haigh, A. E. G. Cass and A. Holmes, Anal. Methods, 2023, 15, 829–836 RSC.
- The WHO AWaRe (Access, Watch, Reserve) Antibiotic Book, World Health Organization, Geneva, 2022, available from: https://www.who.int/publications/i/item/9789240062382 [cited 2023 Aug] Search PubMed.
- T. M. Rawson, R. C. Wilson, L. S. P. Moore, A. P. Macgowan, A. M. Lovering, M. Bayliss, M. Kyriakides, M. Gilchrist, J. A. Roberts, W. W. Hope and A. H. Holmes, Open Forum Infect. Dis., 2021, 8, ofab573 CrossRef.
- R. J. Melander, D. V. Zurawski and C. Melander, MedChemComm, 2018, 9, 12–21 RSC.
- A. E. Paharik, H. L. Schreiber, C. N. Spaulding, K. W. Dodson and S. J. Hultgren, Genome Med., 2017, 9, 110 CrossRef PubMed.
- R. A. Seaton, N. D. Ritchie, F. Robb, L. Stewart, B. White and C. Vallance, J. Antimicrob. Chemother., 2019, 74, 2119–2121 CrossRef CAS PubMed.
- R. C. Wilson, P. Arkell, A. Riezk, M. Gilchrist, G. Wheeler, W. Hope, A. H. Holmes and T. M. Rawson, J. Antimicrob. Chemother., 2022, 77, 2364–2372 CrossRef CAS PubMed.
- M. Gilchrist and R. A. Seaton, J. Antimicrob. Chemother., 2015, 70, 965–970 CrossRef CAS PubMed.
- J. Zhang, H. Wang, Y. Fan, Z. Yu and G. You, Pharmacol. Ther., 2021, 217, 107647 CrossRef CAS.
- N. Robbins, S. E. Koch, M. Tranter and J. Rubinstein, Cardiovasc. Toxicol., 2012, 12, 1–9 CrossRef CAS PubMed.
- K. Maeda, Y. Tian, T. Fujita, Y. Ikeda, Y. Kumagai, T. Kondo, K. Tanabe, H. Nakayama, S. Horita, H. Kusuhara and Y. Sugiyama, Eur. J. Pharm. Sci., 2014, 59, 94–103 CrossRef CAS.
- C. R. Palem, S. Goda, N. Dudhipala and M. Yamsani, Am. J. Anal. Chem., 2016, 07, 12–21 CrossRef CAS.
- X. Dong, L. Ding, X. Cao, L. Jiang and S. Zhong, Biomed. Chromatogr., 2013, 27, 520–526 CrossRef CAS PubMed.
- M. Radovanovic, R. O. Day, G. D. R. Jones, P. Galettis and R. L. G. Norris, J. Mass Spectrom. Adv. Clin. Lab, 2022, 26, 48–59 CrossRef CAS PubMed.
- K. Kipper, C. I. S. Barker, J. F. Standing, M. Sharland and A. Johnston, Antimicrob. Agents Chemother., 2018, 62, e01540 CrossRef PubMed.
- International Council for Harmonisation of Technical Requirements for Pharmaceuticals for Human Use, ICH Harmonised Guideline, Validation of Analytical Procedures Q2(R2), https://www.ema.europa.eu/en/documents/scientific-guideline/ich-guideline-q2r2-validation-analytical-procedures-step-2b_en.pdf Search PubMed.
- A. Riezk, V. Vasikasin, R. C. Wilson, T. M. Rawson, J. G. McLeod, R. Dhillon, J. Duckers, A. E. G. Cass and A. H. Holmes, Anal. Methods, 2023, 15, 746–751 RSC.
- J. C. Van De Steene and W. E. Lambert, J. Am. Soc. Mass Spectrom., 2008, 19, 713–718 CrossRef CAS PubMed.
- A. D. De Nicolò, M. Cantú and A. D'Avolio, Bioanalysis, 2017, 9 14, 1093–1105 CrossRef.
- Phenoxymethylpenicillin-DrugBank, https://go.drugbank.com/drugs/DB00417, 2023 Search PubMed.
- T. M. Rawson, S. A. N. Gowers, D. M. E. Freeman, R. C. Wilson, S. Sharma, M. Gilchrist, A. MacGowan, A. Lovering, M. Bayliss, M. Kyriakides, P. Georgiou, A. E. G. Cass, D. O'Hare and A. H. Holmes, Lancet Digital Health, 2019, 1, e335–e343 CrossRef PubMed.
- T. Kakizaki, Y. Yokoyama, M. Natsuhori, A. Karasawa, S. Kubo, N. Yamada and N. Ito, J. Vet. Med. Sci., 2006, 68, 361–365 CrossRef CAS PubMed.
- National Center for Biotechnology Information, PubChem Compound Summary for CID 6869, Penicillin V, 2023, retrieved January 27, 2023, https://pubchem.ncbi.nlm.nih.gov/compound/Penicillin-v Search PubMed.
- National Center for Biotechnology Information, PubChem Compound Summary for CID 3084757, Benzylpenicilline-d7 N-Ethylpiperidinium Salt, 2023, retrieved January 27, 2023, https://pubchem.ncbi.nlm.nih.gov/compound/Benzylpenicilline-d7-N-ethylpiperidinium-salt Search PubMed.
- National Center for Biotechnology Information, PubChem Compound Summary for CID 4911, Probenecid, 2023, retrieved January 27, 2023, https://pubchem.ncbi.nlm.nih.gov/compound/Probenecid Search PubMed.
- National Center for Biotechnology Information, PubChem Compound Summary for CID 46782784, Probenecid-d14, 2023, retrieved January 27, 2023, https://pubchem.ncbi.nlm.nih.gov/compound/Probenecid-d14 Search PubMed.
Footnote |
| † Electronic supplementary information (ESI) available. See DOI: https://doi.org/10.1039/d3ay01816d |
| This journal is © The Royal Society of Chemistry 2024 |